
Abstract
Previous studies report aberrant activation of the hedgehog signaling pathway in the progression of various cancers. This study aimed to investigate the expressions of smoothened and downstream glioma-associated oncogene homology-1 in gastric cancer and the underlying molecular mechanisms. Here, we first detected the expression in 58 cases of primary gastric cancer tissue and matched normal tissue specimens by western blot analysis and quantitative reverse transcription polymerase chain reaction. Cell proliferation and cycle were assayed in gastric cancer cells after blocking the hedgehog pathway by lentiviral-short hairpin RNA knockdown. In vitro inhibition of hedgehog pathway resulted in decreased cell proliferation and migration. Our studies demonstrate an important role for smoothened and glioma-associated oncogene homology-1 in gastric cancer and suggest inhibition of hedgehog pathway as a novel and potent strategy to treat gastric cancer patients.
Gastric cancer (GC) is a leading cause of cancer-related deaths worldwide, with East Asia accounting for more than half of the annual cases.1,2 It is estimated that the overall 5 years survival for GC patients is only 20%. 3 Moreover, little improvement in long-term survival has been made in recent years, partly because of the chemotherapeutic drug resistance. 4 Therefore, it is of great importance to find new molecular markers that will help evaluate the prognosis or develop novel therapies for GC.
The hedgehog (Hh) signaling pathway is closely associated with tumorigenesis, self-renewal, and drug resistance in several types of human cancer. 5 Three Hh homologs have been identified in humans: Sonic hedgehog (SHH), Indian hedgehog (IHH), and Desert hedgehog (DHH). 6 The Hh signaling pathway is initiated by the Hh ligand binding to a 12-transmembrane protein, “patched” (PTCH), which relieves the catalytic inhibition of smoothened (SMO), a G-like protein–coupled receptor, by preventing its localization to the primary cilium. SMO de-repression triggers a series of intracellular events, resulting in the activation of Gli family of zinc-finger transcription factors (Gli1, Gli2, and Gli3). 7 Therefore, when Hh ligand binds to Ptch, the inhibitory effect on Smo is released and active full length Gli is transported into the nucleus and activates transcription of Gli-dependent target genes involved in various cell functions and cell differentiation.8,9 Therefore, the Hh signaling pathway members may be regarded as important therapeutic targets for the clinical treatment of several types of tumors.
The existing data from the relationship of Hh pathway and GC are controversial. In this study, we assessed the expression levels of Gli1 and Smo in GC specimens. Furthermore, we explored the role of Hh pathway in the regulation of proliferation, migration, and invasion of GC.
Materials and methods
Patients and specimens
Fresh GC tissues and paired non-cancer tissues from patients with GC were collected from The Second Hospital of Hebei Medical University between 2010 and 2015. Informed consent for the use of samples was obtained from all patients, and approval was obtained from these two hospitals. All samples were diagnosed by two to three pathologists blindly. Inclusion criteria were patients with primary GC in I–IV stages, having received surgery as initial treatment modality.
Cell lines
The normal gastric mucosa epithelial GES-1 cell line and three different differentiated GC cell lines, including MKN28, SGC7901, and MGC-803, were purchased from the Type Culture Collection of the Chinese Academy of Sciences (Shanghai, China). The cell lines were cultured in RPMI 1640 medium (Gibco; Thermo Fisher Scientific, Inc., Waltham, MA, USA) containing 10% fetal bovine serum (FBS) (Gibco), 100 U/mL penicillin, and 100 mg/mL streptomycin at 37°C.
RNA extraction, reverse transcription polymerase chain reaction, and quantitative PCR
Total RNA was extracted from cell pellets or tissues using QIAzol reagent (Qiagen, Valencia, CA, USA), and complementary DNA (cDNA) was synthesized using Transcriptor Reverse Transcriptase (Roche, Indianapolis, IN, USA). Reverse transcription polymerase chain reaction (RT-PCR) was performed using the GoTaq DNA Polymerase (Promega, Madison, MI, USA). Quantitative PCR was performed using SYBR Green master mixture on HT7900 system (Applied Biosystems, Foster City, CA, USA).
Western blot
Cells were washed with phosphate-buffered saline (PBS) twice, scraped off the culture dishes, treated with 200-µL radioimmunoprecipitation assay (RIPA) buffer (Sigma-Aldrich; Merck KGaA, Darmstadt, Germany) containing protease inhibitors, and were then transferred to 1.5-mL tubes. The tubes were kept on ice for 30 min for cell lysis. After centrifugation at 13,500 r/min for 15 min at 4°C, the supernatants were collected and subsequently denatured with 2× sodium dodecyl sulfate (SDS) protein-loading buffer (Tiangen, Beijing, China) at 100°C. Proteins were loaded on 10% sodium dodecyl sulfate–polyacrylamide gel electrophoresis (SDS-PAGE) gels and transferred onto polyvinylidene difluoride (PVDF) membranes. Membranes were blocked with 5% bovine serum albumin (BSA) in PBS at room temperature for 2 h and incubated with primary antibodies against corresponding antibodies at 4°C overnight. The band was detected using horseradish peroxidase (HRP)–conjugated secondary antibodies along with an enzyme-linked chemiluminescence kit (Beyotime Institute of Biotechnology, Shanghai, China).
Lentiviral production and transduction
Lentiviral shRNA clones (Sigma Mission RNAi) targeting SMO, Gli1, and the nontargeting control (NC) were purchased from Sigma-Aldrich.
The 293T cells were plated in 10-cm plates 24 h prior to transfection in Dulbecco’s Modified Eagle’s Medium (DMEM) containing 10% FBS without antibiotics, and then 5 µg shRNA plasmid, 4 µg psPAX2, and 1 µg pCI-VSVG packaging vectors (Addgene, Cambridge, MA, USA) were co-transfected into 293T cells using Lipofectamine 2000 Reagent (Invitrogen; Thermo Fisher Scientific, Inc.). Viral supernatants were collected, centrifuged, and filtered with 0.45 µm polyethersulfone (PES) Sterile Syringe Filter. Target cells were plated and incubated at 37°C, 5% CO2 overnight, and changed to medium containing lentivirus and 8 µg/mL polybrene. Control plates were incubated with medium containing 8 µg/mL polybrene. Cells were changed to fresh culture medium 24 h after infection. Puromycin selection (5 µg/mL) was started 48 h post infection and continued for 4–5 days until no viable cells were observed in control plates. Once decreased expression of the targeted gene was confirmed, cells were used for subsequent experiments. Stable expression of NC, SMO, or Gli1 shRNAs was ensured by culturing cells in the presence of puromycin.
Cell viability
Cell viability was assessed using the Cell Counting Kit-8 (CCK-8) assay (Beyotime Institute of Biotechnology, Haimen, China), according to the manufacturer’s protocol. Briefly, cells were seeded into 96-well plates. After transfection, and CCK-8 reagent was added to each well (dilution, 1:10) after which the cells were incubated for 2 h at 37°C. Absorbance was measured at a 450 nm using the MD VersaMax microplate reader (Molecular Devices LLC, Sunnyvale, CA, USA) and was expressed as the viability percentages of the cells, as compared with the controls. All tests were performed in triplicate, and the data were presented as the mean ± standard deviation (SD). Cell survival curves were generated by GraphPad Prism 5 (GraphPad Software, Inc., La Jolla, CA, USA).
Cell cycle assay
Cell cycle analysis was performed adopting propidium iodide cell cycle detected kits (BD Pharmingen; Franklin Lakes, NJ, USA) according to the manufacturer’s protocol. All experiments were performed in triplicate.
Cell invasion assay
Cell invasion assays were performed using a transwell system (8-lm pore size) (Corning Costar Corporation, Cambridge, MA, USA). Matrigel (Becton–Dickinson) was diluted to a concentration of 2 mg/mL, and 50 µL of this solution was placed on the lower surface of the polycarbonate filter and air-dried. After being rinsed with PBS, the filters were placed into wells with 700 µL of DMEM containing 10% fetal calf serum (FCS) in the lower compartment. Freshly trypsinized and washed cells were suspended (1 x 10⁴ cells/well) in DMEM containing 1% FCS and added in the upper chamber. After incubation for 24 h at 37°C, cells on the upper surface of the filter were removed with a cotton swab. Cells that had invaded the lower surface of the filter were fixed with methanol and stained with hematoxylin. The invasive ability was determined by counting the number of penetrating cells under a microscope at 200× in 10 random fields per well.
Statistical analysis
Each experiment was repeated at least three times. Bands from western blots were quantified with Quantity One software (Bio-Rad, Hercules, CA, USA). Relative protein and messenger RNA (mRNA) levels were calculated in comparison with internal β-actin or glyceraldehyde 3-phosphate dehydrogenase (GAPDH) standards. Numerical data are presented as mean ± SD. The difference between mean values was analyzed with analysis of variance (ANOVA). Differences were considered significant when p < 0.05.
Results
Expression of Gli1 and Smo in primary GC tissues and cell lines
To investigate the clinical significance of Gli1 and Smo expression in human GC progression, we first analyzed the mRNA and protein expression of Gli1 and Smo in a total of 58 pairs of primary GC cases and distal normal paired tissues by quantitative reverse transcription polymerase chain reaction (qRT-PCR) and western blot. The expression level of Gli1 and Smo was significantly elevated in GC tissues compared with that in normal paired tissues both at the mRNA and protein level (Figure 1(a) and (b); p < 0.01).
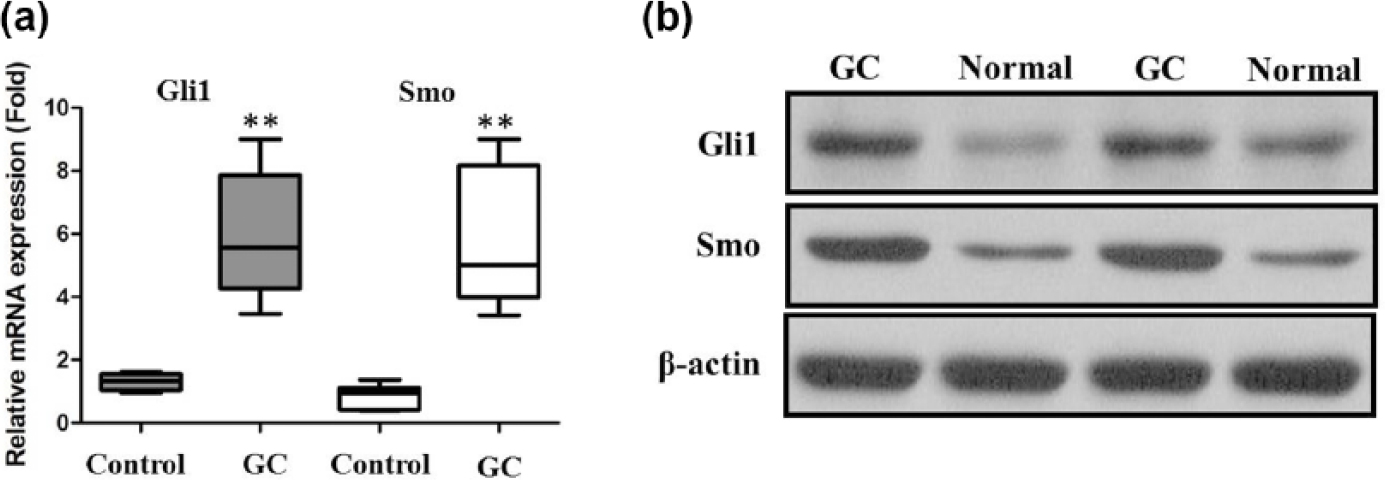
(a) Gli1 was detected in GC tissues and adjacent noncancerous tissues by qRT-PCR, (b) Smo was detected in GC tissues and adjacent noncancerous tissues by qRT-PCR, and (c) Gli1 and Smo were detected in GC tissues and adjacent noncancerous tissues by western blot.
To confirm the relationship between Hh pathway and GC progression, we quantified Gli1 and Smo expression in several GC cell lines, including MKN28, GC7901, and MGC-803 cells by real-time PCR analyses.Most human GC cell lines expressed high levels of Gli1 and Smo when compared with the normal gastric mucosa epithelial GES-1 cell line (Figure 2(a) and (b)). Furthermore, MGC-803 cells, a high metastatic potential cell, showed the highest level of Gli1 and Smo expression. Moreover, the Gli1 and Smo protein levels detected in western blot were consistent with the mRNA levels determined by real-time PCR analyses (Figure 2(c)). These results provided clear evidence that Gli1 and Smo expression may correlate with the metastatic potential of GC cells.

(a) qRT-PCR showing expression level of Gli1 in GC cell lines, (b) qRT-PCR showing expression level of Smo in GC cell lines, and (c) western blot showing expression level of Gli1 and Smo in GC cell lines.
Targeting Gli1 and Smo inhibits GC cell growth
Lentiviral-mediated expression of independent SMO and Gli1 shRNA constructs successfully reduced the SMO and Gli1 mRNA level by 50%–80% in MGC-803 cell lines (Figure 3(a) and (b)). The results of CCK-8 revealed that cell growth was significantly impaired in MGC-803 cell lines transfected with sh-SMO and sh-Gli1 (Figure 3(c) and (d)). Then, we compared the cell cycle profiles of SMO and Gli1 knockdown GC cells. The flow cytometry analysis revealed that the percentage of cells in the G0/G1 peak was clearly higher, and the percentage of cells in the S peak was lower in the SMO and Gli1 knockdown MGC-803 cells (Figure 4(a) and (b)), suggesting that SMO and Gli1 knockdown–mediated cell proliferation seems to be mediated by regulation of the G1-S checkpoint. The transwell assay showed that the migration and invasion of MGC-803 cell line were significantly inhibited by SMO and Gli1 knockdown (Figure 4(c) and (d)).
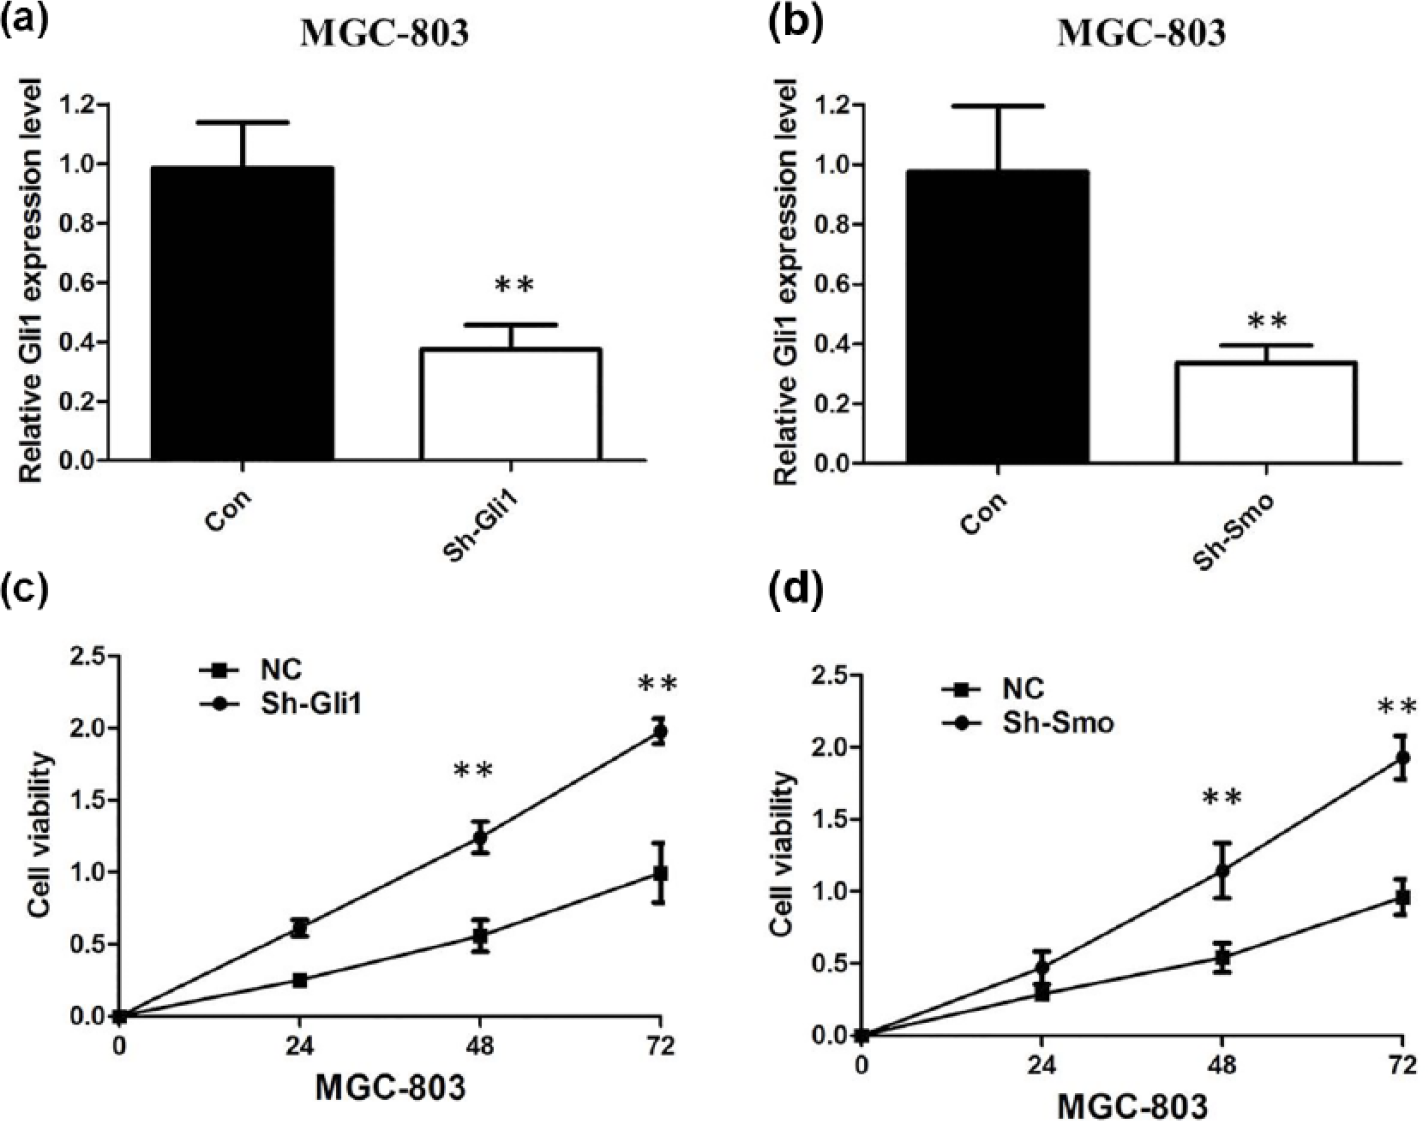
(a) We employed shRNA to enhance efficiency of Gli1 knockdown in MGC-803 cell lines, (b) we employed shRNA to enhance efficiency of Smo knockdown in MGC-803 cell lines, (c) CCK-8 assay showing knockdown of Gli1-inhibited cell proliferation of MGC-803 cells, and (d) CCK-8 assay showing knockdown of Smo-inhibited cell proliferation of MGC-803 cells.

(a) MGC-803 cells transfected with sh-Gli1 had cell cycle arrest at the G1–G0 phase compared with cells transfected with NC, (b) MGC-803 cells transfected with sh-Smo had cell cycle arrest at the G1–G0 phase compared with cells transfected with NC, (c) the migration and invasion of MGC-803 cell line were significantly inhibited by sh-Gli1, and (d) the migration and invasion of MGC-803 cell line were significantly inhibited by sh-Smo.
Discussion
In the past few years, the Hh pathway, one of the major developmental pathways, has been demonstrated to play an important role in various human pathophysiologic processes, especially tumorigenesis.10,11 Although the increasing evidence is available to clarify the mechanisms of Hh pathway on the development and progression of cancers, the knowledge remains very limited. In this study, we observed an elevated SMO and Gli1 expression in GC tissues and cell lines. Knockdown of SMO and Gli1 expression suppressed tumor cell proliferation, migration, and invasion and arrested cells at the G0/G1 phase of cell cycle.
Hh pathway is implicated in transformation of adult stem cells into cancer stem cells. 12 Activated Hh has been implicated in tumorigenesis and metastasis in multiple types of cancers. Inhibition of Hh pathway causes defects in cell proliferation and differentiation and induces apoptosis in various cancer cells, including lung, brain, breast, prostate, and skin.13,14 In this study, we first investigated SMO and Gli1 expression in GC tissues and cell lines by qRT-PCR and western blot. SMO and Gli1 expression was markedly increased in GC tissues and cell lines. Our results provided the evidence that high SMO and Gli1 expression was closely associated with GC carcinogenesis. In order to explore the function of Hh pathway in GC, we performed loss-of-function studies to test the effect of SMO and Gli1 on GC cell lines. Downregulation of SMO and Gli1 in GC cells would reduce cell proliferation, suggesting that Hh pathway might be involved in GC progression. Moreover, depletion of SMO and Gli1 caused cell cycle arrest in G0/G1 phase.
The invasion and metastasis of cancer cells are landmark events that involve many changes in cellular behavior and lead to different steps of the metastatic cascade. Previous studies showed the effect of Hh/Gli pathway on inhibition of lung adenocarcinoma cell migration and reduction in tumor growth using a Gli inhibitor.15,16 Regulating cell migration and invasion by Hh pathway has been reported to play a central role in metastasis, indicating that a novel Gli inhibitor shows promise as a therapeutic agent. Here, we provide strong preliminary evidence that in vitro SMO and Gli1 inhibition impairs the migratory and invasive properties of GC cells.
In conclusion, our results indicate that upregulation of Hh pathway and its downstream signaling contributes to tumor progression of GC. Inhibiting Hh pathway might be a promising strategy for GC patients.
Footnotes
Declaration of conflicting interests
The author(s) declared no potential conflicts of interest with respect to the research, authorship, and/or publication of this article.
Funding
The author(s) received no financial support for the research, authorship, and/or publication of this article.