
Abstract
The aim of this study was to investigate the role of G-protein signaling modulator 2 in the carcinogenesis and progression of hepatocellular carcinoma. We previously showed that G-protein signaling modulator 2 was upregulated in hepatitis B virus-related hepatocellular carcinoma tissues through a hierarchical clustering analysis. With this study, we first assessed the expression pattern of G-protein signaling modulator 2 in hepatocellular carcinoma specimens and adjacent noncancerous tissues; clinical data were analyzed, along survival times, utilizing the Kaplan–Meier method. Moreover, the functions of G-protein signaling modulator 2 were examined using small-interfering RNAs in vitro. The results showed that G-protein signaling modulator 2 was clearly overexpressed in hepatocellular carcinoma tissues and cell lines and that the G-protein signaling modulator 2 expression level was related to tumor size and hepatitis B virus infection. Furthermore, G-protein signaling modulator 2 knockdown studies suggested that G-protein signaling modulator 2 accelerates cell growth, cell cycle, migration, and invasion and inhibits apoptosis, acting as an oncogene in hepatocellular carcinoma. Western blotting indicated that silencing of G-protein signaling modulator 2 in HepG2 and SMMC-7721 cells increased the expression levels of Bax, caspase-3, and E-cadherin, while notably suppressing the cyclin-dependent kinase 4, cyclin-dependent kinase 6, CyclinD1, Snail1, Vimentin, and matrix metallopeptidase 9 expression levels, compared with that in the control groups. In addition, we found that G-protein signaling modulator 2 can affect the expression of key proteins involved in protein kinase B activation. In conclusion, high expression of G-protein signaling modulator 2 was involved in the pathological processes of hepatocellular carcinoma through activation of the phosphatidylinositol 3-kinase/protein kinase B signaling pathway, which may provide an attractive potential diagnostic biomarker and therapeutic target for treatment of hepatocellular carcinoma.
Keywords
Introduction
Hepatocellular carcinoma (HCC) is one of the deadliest cancers with an increasing incidence.1–3 Although different types of treatments, such as surgery, 4 radiotherapy, 5 chemotherapy, 6 ablation, 7 and liver transplantation, 8 as well as molecular targeted drugs, 9 have been used to treat HCC, the poor prognosis has seen limited improvement. 10 It is of critical importance to understand the molecular mechanisms of tumorigenesis and progression in HCC because further knowledge can provide specific and sensitive diagnostic biomarkers and effective therapeutic targets for the diagnosis and treatment of HCC. 11
In our previous publication, microarray technology was used to screen the messenger RNAs (mRNAs) with different protein expression levels in hepatitis B virus (HBV)-related HCC tissues and corresponding normal liver tissues.12,13 The microarray data indicated that the G-protein signaling modulator 2 (GPSM2) mRNA level was upregulated in clinical liver cancer cells compared with normal liver cells.
GPSM2 belongs to a family of proteins that modulate the activation of G-proteins, which transmit extracellular signals received by cell surface receptors into integrated cellular responses. The N-terminal half of the GPSM2 protein contains 10 copies of leu-gly-asn (LGN) repeats, and the C-terminal half contains four GoLoco motifs, which are involved in guanine nucleotide exchange. 14 This protein may play a role in regulation of cell division and cell cycle. Mutations in GPSM2 may affect the development of normal hearing and result in autosomal recessive nonsyndromic hearing loss and deafness (DFNB). 15 However, there have been few investigations of the relationship between cancer and GPSM2. One study has suggested that LGN/GPSM2 is overexpressed in breast cancer cells and acts as an oncogene. LGN/GPSM2 phosphorylation is tightly associated with cytokinesis in cancer cells. 16 Another study has shown that the activity of GPSM2 may be inhibited by XI-006, a 4-nitrobenzofuroxan derivative, which is a novel therapeutic intervention for the treatment of Ewing sarcoma. 17 It remains unclear what roles GPSM2 plays in carcinogenesis and progression of liver cancer.
Hence, this study was performed to elucidate the expressions of GPSM2 and related clinicopathological characteristics in HCC. In addition, the biological behaviors of GPSM2 in tumor cell proliferation, apoptosis, migration, and invasion were assessed in vitro.
Materials and methods
Patients’ information and tissue specimens
A total of 32 patients with primary liver cancer who underwent surgical resection from June 2014 to January 2015 at the Department of Hepatobiliary Surgery of Renmin Hospital of Wuhan University were investigated in this study. All the clinicopathological data related to patient samples were attained from the department of Hepatology Outpatient Clinic and are summarized18,19 in Table 1.The criterion of Union for International Cancer Control (UICC)/American Joint Committee on Cancer (AJCC) was used to classify tumor staging. According to the National Comprehensive Cancer Network (NCCN) guidelines, different treatments were received in these patients after surgery. Patient specimens were preserved in liquid nitrogen before extracting total RNA. All human tissue samples were obtained according to the relevant ethics policies and practices of the Renmin Hospital of Hubei Province.
Clinical characteristics of 32 HCC cohort according to GPSM2 expression levels.
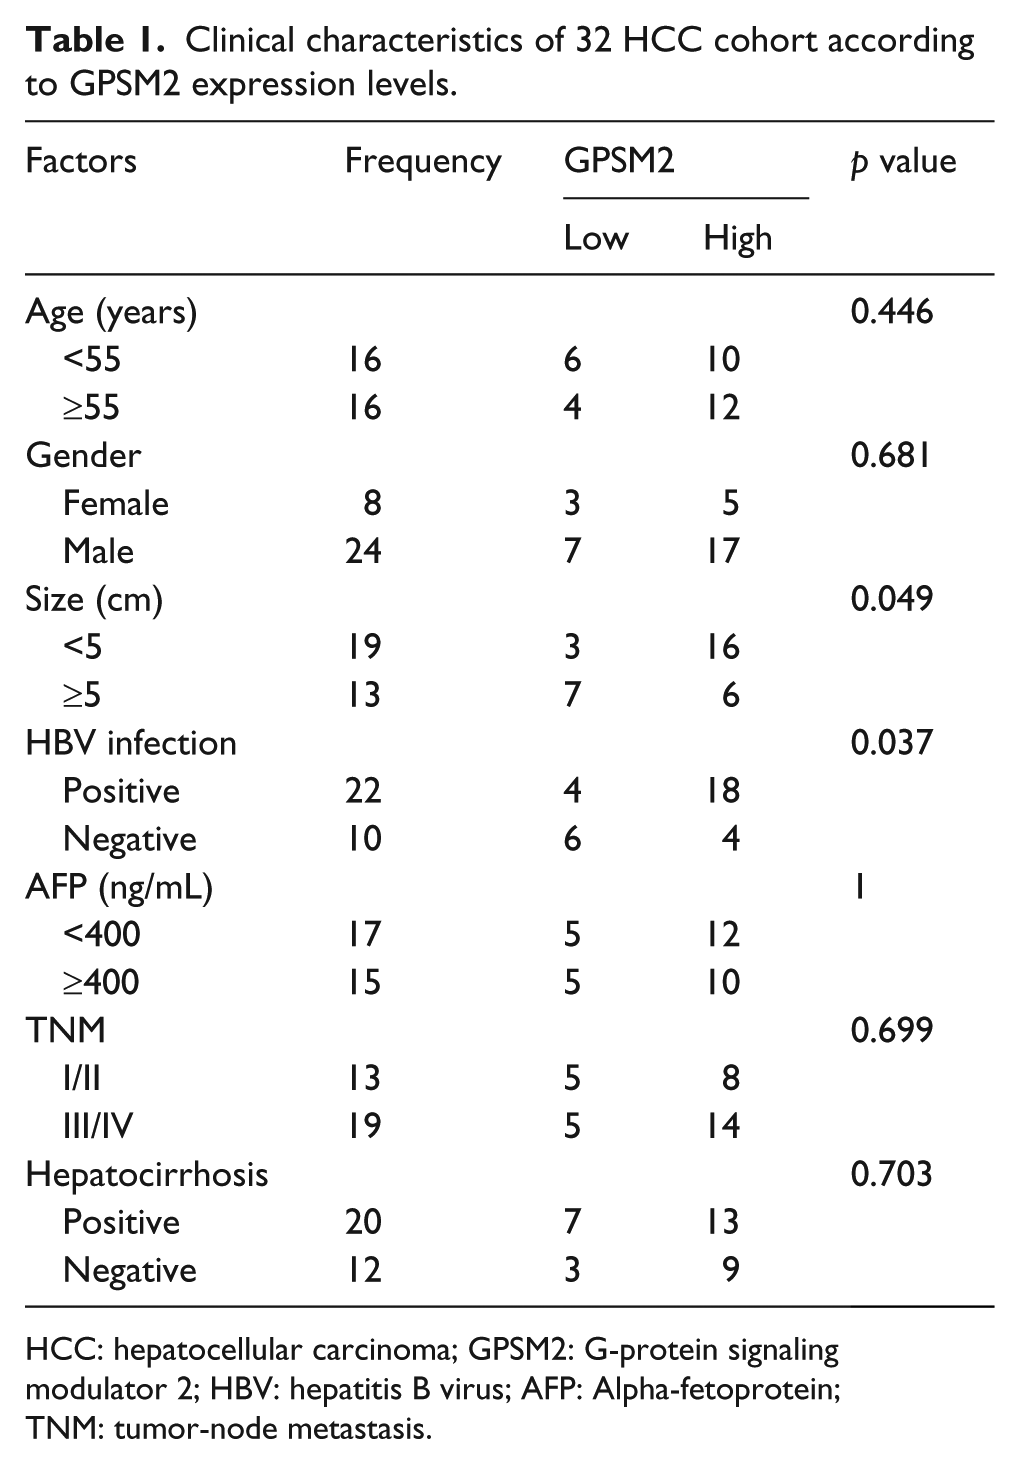
HCC: hepatocellular carcinoma; GPSM2: G-protein signaling modulator 2; HBV: hepatitis B virus; AFP: Alpha-fetoprotein; TNM: tumor-node metastasis.
Cell culture and transfection
The cell lines HepG2, BEL-7402, Huh7, SMMC-7721, and LO2 were obtained from the Institute of Cell Biology, Chinese Academy of Sciences (Shanghai, China). HepG2, BEL-7402, and Huh7 were cultivated with high glucose medium, Dulbecco’s Modified Eagle Medium (DMEM) (Hyclone, Logan, UT, USA), while SMMC-7721 and LO2 were cultured in RPMI (Hyclone), containing 10% fetal bovine serum (FBS; Gibco, Life Technologies, SA, USA) and 1% penicillin-streptomycin (Hyclone), and maintained at 37°C in a fully humidified atmosphere of 5% CO2. The culture medium was changed every 2 days.
Log-phase HepG2 and SMMC-7721 cells were harvested and applied to a six-well plate at a density of 1 × 10⁵ cells/well and were maintained in serum-free medium before transfection. When confluence reached 70%–80%, the cells were transfected with 200 pmol of siGPSM2 (Supporting Table 1) or a scrambled sequence (RiboBio, GuangZhou, China) using Lipofectamine2000 (Invitrogen, Carlsbad, CA, USA) according to the manufacturer’s recommendation. After incubation with a mixture of small-interfering RNA (siRNA) and Lipofectamine 2000 for 6 h, the mixture was replaced with complete culture medium.
RNA extraction and real-time quantitative polymerase chain reaction
Total RNA derived from cancer tissues and adjacent tissues were extracted with TRIzol reagent (Invitrogen). Concentration and quality evaluation were assessed with a Nanodrop spectrophotometer (Agilent Technologies, Santa Clara, CA, USA). Then, total RNA was reverse transcribed using RT-PCR Quick Master Mix Kit (TOYOBO, Osaka, Japan) according to the manufacturer’s protocol. Finally, the GPSM2 expression levels were analyzed by quantitative real-time reverse transcription polymerase chain reaction (qRT-PCR) using SYBR Green assays (TaKaRa, Otsu, Japan) on a Bio-Rad CFX Manager 2.1 real-time PCR System (Bio-Rad, Hercules, CA, USA). Glyceralde-3-hydephosphate dehydrogenase (GAPDH) was used as an internal control, and the equation 2−ΔΔCt was used to describe the relative expression quantity of GPSM2. The expression level of GPSM2 in cells was tested according to the method used in tissues. The primer sequences are shown in Supporting Table 1 (Tianyihuiyuan, Beijing, China).
Immunohistochemistry assay
Specimens were fixed in 4% phosphate-buffered paraformaldehyde (Google biotechnology, Wuhan, China) overnight, paraffin-embedded, and sectioned. Transverse sections of liver cancerous tissue and adjacent specimen slides were selected for testing the expression of GPSM2 protein by immunohistochemistry (IHC). After eliminating endogenous peroxidase activity and blocking with 5% bovine serum albumin (BSA), sections were incubated with the primary antibody against GPSM2 (1:400, Bioss, Beijing, China) overnight at 4°C. After incubation with secondary antibody, sheep anti-rabbit IgG (1:20000, KPL, Shanghai, China), for 1 h at 4°C, sections were stained with fresh 3,3′-diaminobenzidine tetrachloride (DAB) solution, counterstained with hematoxylin, and dehydrated in graded alcohol and xylene. Finally, sections were observed with a microscope (Olympus BX51, Shanghai, China).
Cell proliferation assay
To visually observe the proliferative cells, an EdU (5-ethynyl-2′-deoxyuridine) incorporation experiment was performed using an EdU immunofluorescence staining kit (RiboBio). The cells were collected and seeded into a 96-well culture plate at a density of 4 × 10³ cells/well. Three repeated wells were set in every group. Then, a transfection assay was performed according to procedures described above. EdU medium (1:1000) was added to wells and incubated at 37°C for 2 h. Cells were rinsed with phosphate buffer solution (PBS) (Hyclone) before being fixed in 4% phosphate-buffered paraformaldehyde. Then, cells were stained with fresh Apollo solution, and nuclei were stained with Hoechst33342. Finally, cells were observed with a microscope (Olympus BX51). Meanwhile, a Cell Counting Kit-8 (CCK-8, Dojindo, Kyushu, Kumamoto, Japan) assay was used to examine cell proliferation according to the manufacturer’s instructions. After 0, 24, 48, 72, and 96 h, CCK-8 was added to the wells and incubated for 1 h at 37°C. Next, the absorbance at 450 nm was detected with an automatic microplate reader (Bio-Rad) for the purpose of plotting the growth curve.
Flow cytometry assay
Cell cycle was analyzed with a flow cytometry assay. After transfection for 48 h, approximately 1 × 10⁶ cells were collected and prepared using a cell cycle staining solution kit (MultiSciences Biotech, Hangzhou, China) according to the product’s instructions. For the cell apoptosis assay, cells were resuspended in 300 µL of 1 × binding buffer, and HepG2 and SMMS-7721 cells were stained with Annexin V-APC and 7-Aminoactinomycin D (7-AAD) according to the manufacturer’s instructions (MultiSciences Biotech), and incubated at room temperature for 15 min in the dark. Next, the cell suspension was load on a Fluorescence Activated Cell Sorting (FACS) Calibur flow cytometer (Becton-Dickinson, Franklin Lakes, NJ, USA). Finally, data analysis was performed using FCS Express version 3 software (DeNovo Software, Los Angeles, CA, USA), and the percentages of cells in G0/G1, S, G2/M phase and apoptosis rate were counted and compared.
Transwell chamber assay
Cell migration and invasion capacities were assessed with a Transwell assay. For the migration assay, cells were collected and suspended at a density of 3 × 10⁴ cells in 200 µL of serum-free medium after transfection for 24 h, and seeded in the upper compartment of the chamber. Then, 600 µL of complete medium containing 10% FBS was added into the lower chamber. After incubation for another 24 h, the chambers were removed and the cells on the upper surface of membrane were wiped off with cotton swabs. Then, the cells that had invaded into the microporous membrane were washed three times with PBS, fixed with 4% paraformaldehyde solution for 30 min, and stained with 0.1% crystal violet (Google biotechnology, Wuhan, China) for 20 min. Finally, the cells were observed with a microscope (Olympus BX51), and images were obtained. For the invasion assay, the upper surface of polycarbonate membranes were covered with a 60 µL Matrigel (Becton-Dickinson) layer, and subsequent procedures were similar to the migration assay.
Western blot assays
The transfected cells were lysed by radioimmunoprecipitation assay (RIPA; Beyotime, Haimen, China) supplemented with a protease inhibitor cocktail (Roche, Shanghai, China). Then, a bicinchoninic acid protein assay kit (Biosharp, Shanghai, China) was used to detect protein concentration. For western blotting, 20 µg of the protein sample was loaded on a 10% sodium dodecyl sulfate–polyacrylamide gel electrophoresis (SDS-PAGE) gel and then transferred into polyvinylidene fluoride membrane (PVDF; Millipore, CA, USA) after electrophoresis. Then, membranes were blocked in Tris-buffered saline Tween 20 (TBST) containing 5% skim milk for 1 h. These membranes were incubated with primary antibody dilutions (Supporting Table 3) overnight at 4°C. Then, incubated with goat anti-rabbit IgG-horseradish peroxidase (1:10000, 074-1506, KPL) at room temperature for 2 h. Finally, X-ray film (Kodak, NY, USA) was used to analyze the optical density value of target bands. β-actin was served as an internal control.
Statistical analysis
IBM SPSS20.0 statistics was applied for all data analysis. Measurement data analysis between two groups was conducted by using a Student’s t-test, while comparison of multiple groups was conducted using one-way analysis of variance (ANOVA). In addition, a chi-square test (χ 2 test) and Fisher exact test were adopted to analyze the enumeration data. Survival curves were performed using Kaplan–Meier analysis and log-rank tests. Differences were defined as significant when p < 0.05 (*p < 0.05, **p < 0.01, ***p < 0.001). Data are presented as mean ± standard error of mean (SEM) and all the experiments are repeated for at least three independent times. All graphs and curves were made with GraphPad Prism 5 (GraphPad Software, San Diego, CA, USA).
Results
GPSM2 is upregulated in HCC
To analyze the GPSM2 expression level in HCC and paired nontumor samples, we performed a qRT-PCR analysis on total RNA extracted from 32-paired tissues. The expression of GPSM2 was remarkably upregulated in HCC compared to the corresponding adjacent tissue (Figure 1(a), p < 0.05). Moreover, immunolocalization of GPSM2 was detected both in the nucleus and cytoplasm of cells from cancer tissue samples. In contrast, the expression of GPSM2 was weak or negative in adjacent noncancerous tissues (Figure 1(b)). The results demonstrated that the expression level of GPSM2 was clearly higher in cancerous tissues than in the adjacent tissues. Furthermore, to determine whether GPSM2 mRNA expression levels are associated with HCC progression, we explored the relationship between GPSM2 and clinical pathological characteristics of HCC. The result showed that the expression of GPSM2 was positively associated with tumor size (p = 0.049) and HBV infection (p = 0.037) (Table 1). Furthermore, Kaplan–Meier analysis of 32 HCC samples demonstrated that the expression levels of GPSM2 had no remarkable relationship with overall survival (Figure 1(c)).

Expression of GPSM2 in Hepatocellular carcinoma (HCC) and survival analyses from HCC patient databases. (a) Differential expression of GPSM2 was detected using real-time PCR in 32 pairs of carcinoma tissues and pericarcinomatous tissues; (b) immunohistochemical (IHC) analysis of GPSM2 in carcinoma-adjacent samples (×400). IHC analysis of GPSM2 in formalin-fixed paraffin-embedded (FFPE) liver cancer tissues (×400), showing that the expression of GPSM2 at both mRNA and protein levels was remarkably higher in HCC tissues; and (c) overall survival analysis exhibiting survival status of HCC patients with high GPSM2 expression (dash line) or low GPSM2 expression (solid line) (p = 0.2126).
Relatively high expression level of GPSM2 in different hepatoma cell lines
As shown in Figure 2(a) and b, the results of qRT-PCR and western blotting indicated that GPSM2 expression levels in hepatoma cells were dramatically higher compared to a normal human hepatic cell line (LO2). In addition, GPSM2 expression in SMMC-7721 and HepG2 cells was significantly upregulated when compared to that of Huh7 and BEL-7402 cells. Based on the above results, SMMC-7721 and HepG2 cell lines were used for the following experiments.
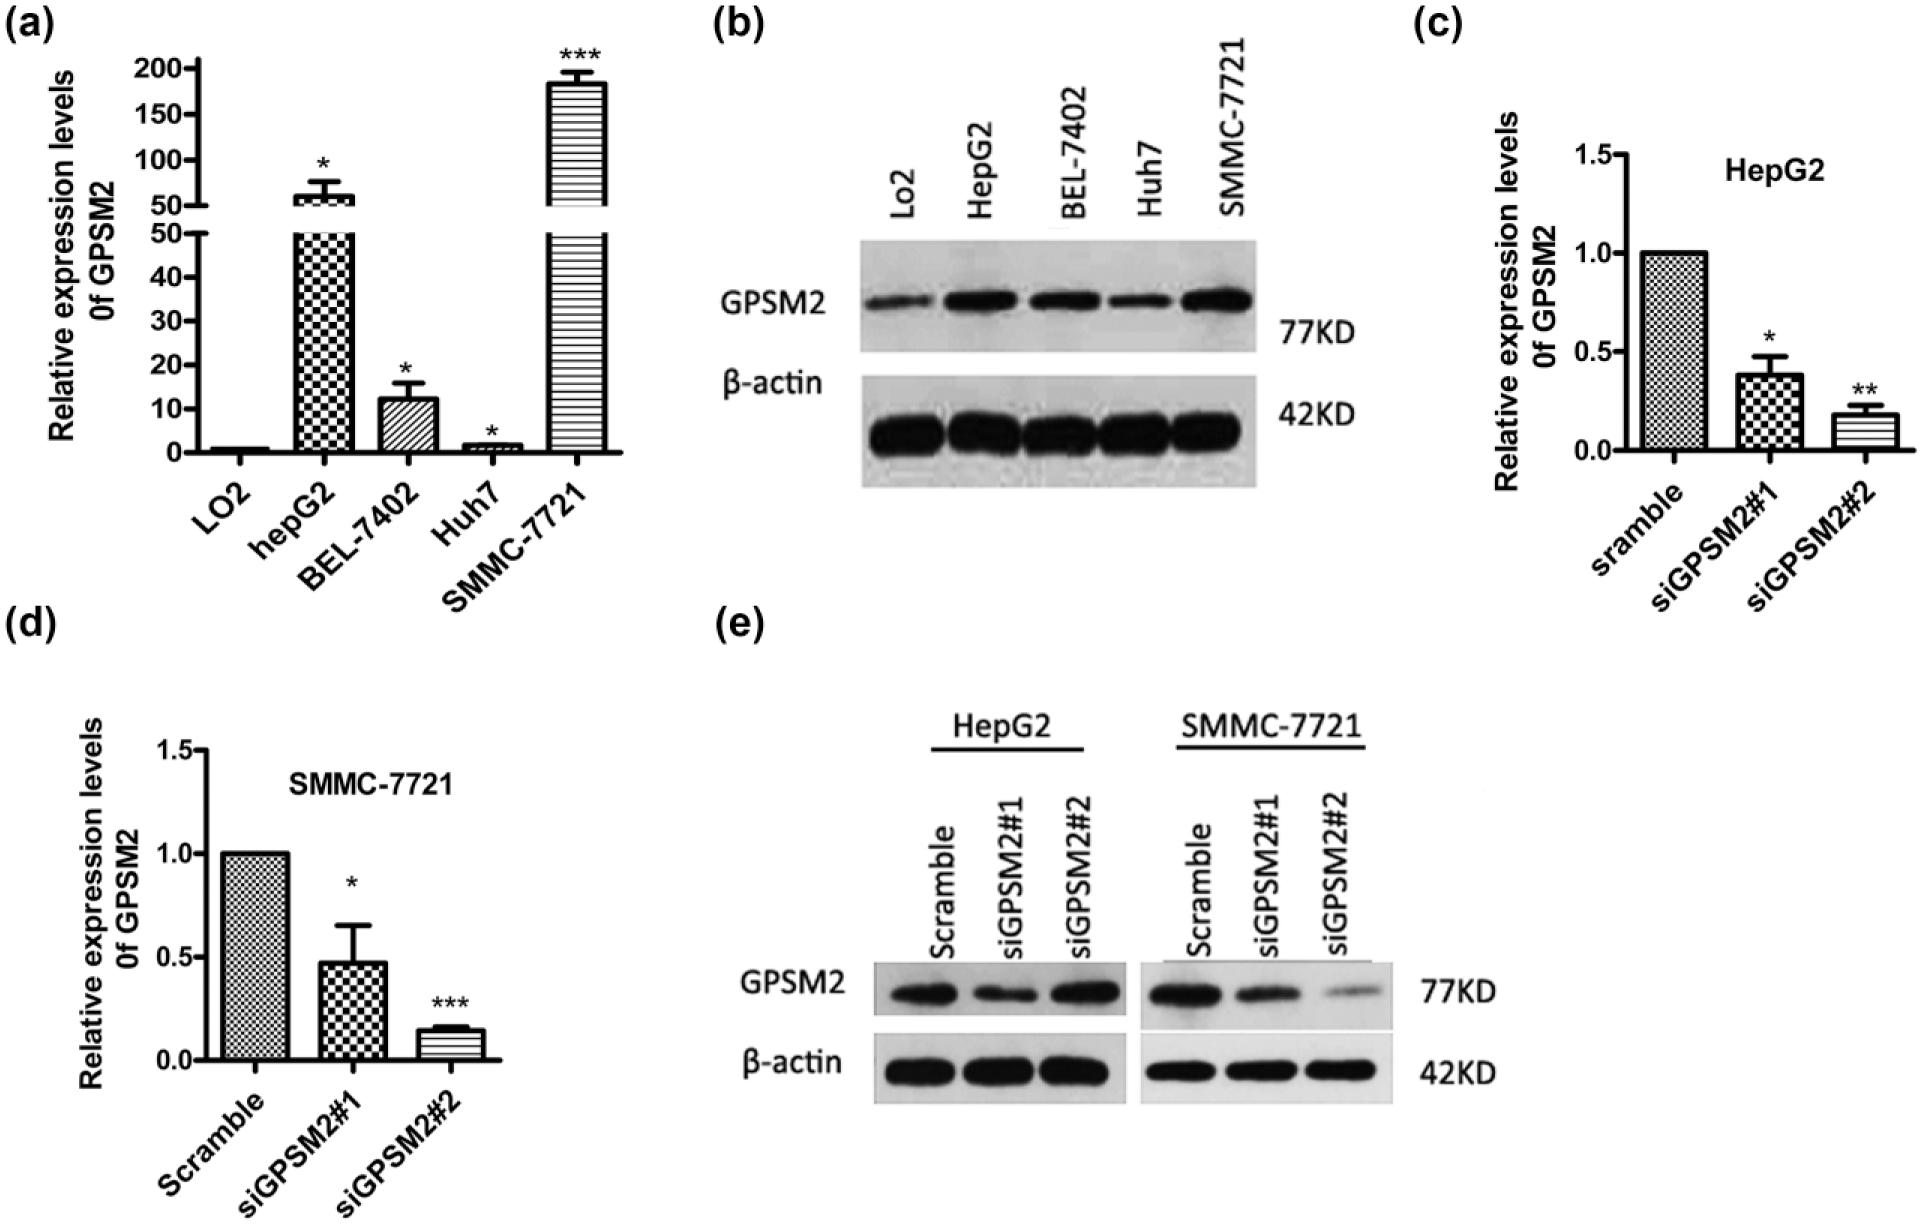
Expression of GPSM2 in liver cancer cell lines and normal liver cells. (a and b) The mRNA and protein expressions of GPSM2 in HepG2, BEL-7402, Huh7, and SMMC-7721 cells were increased compared to LO2 cells (normal liver cell). (c and d) siRNA-mediated knockdown of GPSM2 in HepG2 and SMMC-7721 cells. (e) Western blots were used to demonstrate the GPSM2 expression after transfection with siRNA both in HepG2 and SMMC-7721 cells. Data are presented as the mean ± SEM.
Silencing of GPSM2 in SMMC-7721 and HepG2 cells
Using RNA interference, the relative expression level of GPSM2 in SMMC-7721 and HepG2 cells was determined by qRT-PCR and western blotting, respectively. As presented in Figure 2(c), (d), and (e), expression of GPSM2 at both the mRNA and protein levels was significantly decreased in groups transfected with siGPSM2 compared to the control. The expression level of GPSM2 mRNA was decreased by 85.65% in SMMC-7721 cells and 82.08% in HepG2 cells after transfection with the siGPSM2#2 sequence (Figure 2(c) and (d)). Interestingly, lower protein levels of GPSM2 were detected in HepG2 cells after transfection with the siGPSM2#1 sequence (Figure 2(e)). This indicated that the siGPSM2#2 sequence was an effective siRNA for GPSM2 in SMMC-7721, while both siGPSM2#1 and siGPSM2#2 sequences were effective siRNAs for GPSM2 in HepG2 cell lines (**p < 0.01, ***p < 0.001).
GPSM2 promotes cell proliferation and inhibits apoptosis in vitro
To examine the biological functions of GPSM2 in HCC cell growth, EdU immunofluorescence staining and a CCK-8 assay were performed after transfecting cells with siGPSM2. For the EdU assay, the percentage of EdU positive cells decreased significantly after inhibition of GPSM2 (Figure 3(a) and (b)). The percentage of EdU positive cells in the siGPSM2 groups was decreased by 33.01% and 47.44% in HepG2 cells, and by 48.28% and 64.10% in SMMC-7721 cells (Figure 3(c)). Furthermore, a CCK-8 assay was performed 0, 24, 48, 72, and 96 h after cells were transfected, and cell proliferation curves were constructed (Figure 3(d) and (e)). The cell proliferation rate of the experimental groups was remarkably reduced in comparison with the blank (culture medium) and scramble control groups. Therefore, the suppression effects of GPSM2 downregulation occurred in a time-dependent manner, but remained consistent 48 h post-transfection.

GPSM2 facilitates HCC cell proliferation and cell cycle progression and restrains apoptosis in vitro. (a and b) GPSM2 downregulated HepG2 cells and SMMC-7721 cells, in which GPSM2 was downregulated, were seeded into 96-well plates, and cell proliferative activity was assessed by EdU immunofluorescence staining. The proliferation ability values are in red (×400), (c) the graph shows the percentage of EdU positive nuclei, indicating that GPSM2 notably expedited cell division. (d and e) A CCK-8 assay was also used to verify cell proliferation at 0, 24, 48, 72, and 96 h after transfection, (f) an analysis of cell cycle distribution by flow cytometry in HepG2 and SMMC-7721 cells, (g and h) showing that G1 phase was arrested in siGPSM2 groups compared with control groups, (i) total proteins were harvested and detected by western blot analysis. The protein expression of CDK4, CDK6, and cyclinD1 was decreased in the siGPSM2 group compared to the scramble group; (j) flow cytometry was utilized to test the rate of apoptosis (k) and demonstrated that silencing of GPSM2 induced a markedly higher rate of apoptosis in SMMC-7721 cells but not in HepG2 cells; and (l) the apoptosis-related proteins Bax and caspase-3 were detected by western blot analysis. Data are presented as the mean ± SEM based on three independent experiments.
We wondered whether GPSM2 facilitated liver cancer cell growth through accelerating cell cycle progression. The effect of GPSM2 on cell cycle was detected by flow cytometry. As shown in the Figure 3(f)–(h), we found that the G0/G1 phase was arrested in GPSM2-knockdown cells. Meanwhile, in the western blot analysis, protein expression levels of cyclin-dependent kinase 4 (CDK4), CDK6, and CyclinD1 were noticeably decreased in transfected groups (Figure 3(i)). Thus, it is possible that GPSM2 accelerates cell multiplication by promoting cell cycle progression.
To investigate whether GPSM2 has a role in cancer cell apoptosis, the effect of GPSM2 on apoptosis was confirmed in two liver cancer cell lines (HepG2 and SMMC-7721) stained for Annexin V-APC and 7-AAD at 48 h post-transfection. Flow cytometry assays showed that SMMC-7721 cells with GPSM2 downregulated had a higher percentage of Annexin V-positive cells (Figure 3(j) and (k)). However, for HepG2 cells with GPSM2 downregulated, there was no significant difference compared with the scramble group (Figure 3(k)). Consistent with the flow cytometry results, the expression of key apoptosis-related proteins, such as Bax and caspase-3, were increased in the siRNA groups, as detected by western blot (Figure 3(l)). In brief, these results indicated that GPSM2 facilitated HCC cell growth.
GPSM2 expedites cell migration and invasion in vitro
To further explore whether GPSM2 has a role in cell metastasis, which is a critical factor for malignant progression. After cancer cells were transfected with siGPSM2 for 24 h, a Transwell assay was used to test the function of GPSM2 in cell migration and invasion. As shown in Figure 4(a) and (c), silencing of GPSM2 notably reduced migration and invasion of HepG2 and SMMC-7721 cells in the Transwell examination. The number of cells that passed through the chamber membrane in the siGPSM2#1 group and siGPSM2#2 group was less than that in the control group, and this was observed in both HepG2 and SMMC-7721 cells (Figure 4(b) and (d)). Consistent with the Transwell assay results, the expressions of key metastasis-related proteins, such as matrix metallopeptidase 9 (MMP9), Snail, and Vimentin, were decreased, while E-cadherin was increased in the siRNA groups, as detected by western blotting (Figure 3(l)). Summarily, these data revealed that GPSM2 facilitated tumorigenicity and metastasis in HCC cells.

GPSM2 promotes HCC cell migration and invasion. (a) Transwell migration assays and (c) invasion assays were detected after transfection with siGPSM2 or a scramble control in HepG2 and SMMC-7721 cells (×400). (b and d) Cell migration and invasion ability were calculated by counting cells per field. (e) Western blotting showed that the protein expressions of MMP9, Snail1, and Vimentin were decreased, while E-cadherin was increased in siGPSM2 group. Data are presented as the mean ± SEM based on three independent experiments.
The effects of GPSM2 on the phosphatidylinositol 3-kinase/protein kinase B signaling pathway
As is known, G-protein coupled receptor (GPCR) can activate G-proteins, and GPSM2 can also modulate the activation of G-protein.14,20 Therefore, GPSM2 might play its biologic role in HCC through regulation of GPCR signaling. To verify this hypothesis, we detected the total protein and phosphorylation level of major molecules in the phosphatidylinositol 3-kinase (PI3K)/protein kinase B (AKT) and mitogen-activated protein kinase (MAPK)/extracellular signal-regulated kinase (ERK) pathways AKT, p-AKT, ERK, and p-ERK, in GPSM2-knockdown HepG2 and SMMC-7721 cells by western blotting. The results demonstrated that the expression levels of phosphorylated AKT protein were reduced significantly in the siGPSM2 group compared with the scramble group. However, the protein expression levels of AKT, ERK, and p-ERK in the siGPSM2 group were not significantly different from those in the control group (Figure 5). Taken together, these results show that GPSM2 may play its biological role in HCC via the PI3K/AKT pathway.

Silencing of GPSM2 suppresses the PI3K/AKT pathway but not the MAPK/ERK pathway. Western blotting was performed to detect the expression of ERK, p-ERK, AKT, and p-AKT, revealing that the phosphorylation level of AKT was decreased in the siGPSM2 group compared with control groups.
Discussion
HCC is one of the most common fatal tumors. 21 Although there has been rapid development of molecular diagnostic and therapeutic strategies, there are no specific treatment targets. Hence, it is necessary to discover more effective biomarkers of liver cancer. In this study, we first discovered that GPSM2 is a new oncogene in HCC by high-throughput sequencing and revealed the relationship between GPSM2 and clinicopathologic features of HCC. Unfortunately, because we only followed patients for 18 months, we did not identify a correlation with GPSM2 expression level and patient survival time. Performing loss-of-function measurements, we revealed that GPSM2 facilitated proliferation, cell cycle progress, and metastasis and suppressed apoptosis in HepG2 and SMMC-7721 cells. In addition, GPSM2 could activate the PI3K/AKT pathway in HepG2 and SMMC-7721 cells, which is rarely mentioned in carcinoma. Thus, we consider GPSM2 to be a potential biomarker of HCC.
As is known, GPCRs are considered significant regulators of signaling pathways involved in human physiological processes. 22 It has been reported that the function of GPCR signaling was modulated by endocytosis, 23 which has been extensively clarified in pharmacology.24,25 Through binding with ligand, GPCRs can activate G-protein to trigger the releases of second messengers, when guanosine triphosphate (GTP) binds the alpha subunit 20 (Figure 6(a)). According to a recent study, some evidence indicates that heterotrimeric G-proteins regulate dendritic spine formation through Wnt-5a/Frizzled9 signaling, 26 and another study found that G-protein-coupled estrogen receptor 1 (GPER1) is activated via PI3K/AKT and MAPK/ERK pathways, 27 It has been suggested that the PI3K/AKT pathway that transmits signals downstream of GPCRs is dysregulated in breast cancer. 28 However, there are few studies concerning signaling in the relationship between GPSM2 and HCC. Consistent with our results, several regulated genes involved in GPCR signaling have been revealed in the latter study. Inhibitor of G Protein subunit Alpha (GNAI) loci, including GNAI1, GNAI2 and GNAI3, whose effect is opposite to the function of GPSM2 (Figure 6(b)). It has been revealed that GNAI loci mutations participate in genetic predisposition to pituitary tumors. 29 Meanwhile, numerous studies have determined that GNAI3 inhibits HCC cell metastasis 30 and is closely related with the prognosis of patients. 31 Thus, we wondered whether GPSM2 took part in hepatocarcinogenesis. Here, we primarily performed in vitro experiments to elucidate the function of GPSM2, which is overexpressed in HCC, and showed that it acts as a human oncogene to facilitate liver cancer growth and malignant transformation via the PI3K/AKT pathway.

(a) Proposed model for GPSM2 regulation of the biological behavior of HCC cells. Binding of external signals to a GPCR results in G-protein activation, which in turn triggers the release of second messengers when GTP binds the alpha subunit. GPSM2 is a protein that can adjust activation of G-proteins and influence G-protein signaling pathways. Gene transcription is affected by G-proteins through the PI3K/AKT and MAPK/ERK pathways, which likely affects the levels of key proteins, such as CDK4, CDK6, cyclinD1, Bax, caspase-3, MMPs Snail1, Vimentin, and E-cadherin, that affect the biological behavior of tumor cells. The green arrow and plus sign indicate a promoting effect, and the red arrow indicates an inhibiting effect and (b) the protein-protein interactions in which GPSM2 participates (derived from STRING database).
Of course, it should be noted that this study only examined only 32 pairs of HCC tissue samples, and the collection was not random and therefore may not be representative. In addition, because of limited time and poor compliance of patients, we only followed patients for 18 months after hepatic carcinectomy. Moreover, some limitations of our research include not using gain-of-function experiments or performing the xenografts in nude mice to examine the effect of GPSM2 in HCC. Overall, further research needs to be performed in which enough samples are collected, patient compliance is good, and animal models are established to show sufficient evidence of GPSM2 in HCC. The details of the GPSM2 and PI3K/AKT pathway mechanisms require further verification in other carcinomas.
In conclusion, by performing a combination of experiments clinical patient data and in vitro tests, we described GPSM2 as an oncogene in HCC and identified its regulatory mechanisms in the PI3K/AKT pathway. Finally, our study suggests that GPSM2 may serve as a critical molecule for carcinoma progression and a potential biomarker and therapeutic target for the prevention and treatment of HCC.
Footnotes
Acknowledgements
The authors thank the Government of China for granting them fellowships under the Research Scheme. The authors thank the reviewers for critically assessing the manuscript. X.-Q.H helped in design and performed research, statistical analysis, and manuscript writing; X.-M.X. and Y.-F.Z. helped in the design and manuscript writing; J.-J.Y, Y.-Y.G., N.-N.H., and M.-X.Z. performed research and specimen collection; and W.G., J.D., and Y.Z. performed statistical analysis.
Declaration of conflicting interests
The author(s) declared no potential conflicts of interest with respect to the research, authorship, and/or publication of this article.
Funding
The author(s) disclosed receipt of the following financial support for the research, authorship, and/or publication of this article: Natural Science Foundation of Hubei Province of China supports this work, Funding NO. 2012FKC143.
References
Supplementary Material
Please find the following supplemental material available below.
For Open Access articles published under a Creative Commons License, all supplemental material carries the same license as the article it is associated with.
For non-Open Access articles published, all supplemental material carries a non-exclusive license, and permission requests for re-use of supplemental material or any part of supplemental material shall be sent directly to the copyright owner as specified in the copyright notice associated with the article.