
Abstract
This study is an attempt to examine the fuel use pattern and its impact on the respiratory health of the users in the rural area of Barak Valley region of southern Assam. The effectiveness of Pradhan Mantri Ujjwala Yojana (PMUY) in mitigating the practice of unclean fuel has also been analysed in this study along with other related issues. The results based on personal information of 2,541 individuals from 530 households of Barak Valley reveal that incidence of respiratory illness is more profound in the households of solid biomass fuel users. The study further reveals that though PMUY has equipped the rural households with clean fuel connections but failed to change the fuel use practice of the beneficiaries. Among the barriers of clean fuel use practices, insufficient income of the households and availability of free and low-cost alternative fuels are found to be more prominent. The ordered probit model to examine the factors posing risk to respiratory illness reveal that women are at higher risk of developing respiratory syndromes as they spend more time in cooking space. While among others, smoking habit and age of the person are significant in increasing the risk pulmonary syndromes.
Keywords
Background of the Study
The provision of air that is safe to breathe is just as important as safe water or food. Yet millions of people, predominantly women and children in the developing countries are indebted to breathe air that is heavily polluted with biomass emission (World Health Organization [WHO], 2001). According to latest estimate of WHO (2018), indoor air pollution (IAP) is responsible for as many as 208 million deaths each year in the world, making it one of the largest environmental risk factors of any kind. IAP poses a serious threat to human health, especially in low-income countries that still use biomass fuels as an energy resource (Mannucci & Franchini, 2017). Literature confirms that children and adults exposed to combustion of solid biomass fuels have higher risk of developing acute infection in upper and lower respiratory organs compared to those living in households and using cleaner fuels or having lesser exposure to smoke (Bruce et al., 2000; Franklin, 2007; Khan et al., 2017; Li et al., 2013; Pant, 2008; Smith et al., 2000). Higher the frequency of cooking with solid biomass fuel by non-smoker, higher is the risk of having lung cancer (Liang et al., 2019; Mu et al., 2013). Further there is a complex interaction between smoking, socioeconomic conditions, indoor air quality and tuberculosis (TB). The biomass fuel combustion increases TB risk has been substantiated with larger studies (Jafta et al., 2019; Kim, 2014; Lin et al., 2018; Lin et al., 2007; Oztürk et al., 2014). Pant (2008) finds that IAP is negatively responding by improved cook stove and biogas. Further the author finds problem of respiratory health is more severe among older age cohorts/ elderly, particularly among those who are female. Alberts (1994) finds substances arise from combustion have the potential to cause injury, damage, and adverse effects on health if inhaled in sufficient quantities and concentrations. Nevertheless, continued awareness of the potential problem is important to avoid circumstances where normal indoor concentrations may reach dangerous levels.
It has been estimated that the IAP contributes 3% to 5% of the national burden of disease in India (Smith et al., 2000). More specifically, some 440,000 premature deaths in children under 5 years, 34,000 cases of chronic respiratory disease in women under 45 years, and 800 cases of lung cancer may be attributable to solid fuel use every year in India (Balakrishnan et al., 2004). According to WHO (2016), firewood is the prime source of cooking in rural India as 85.6% of the rural population depend on this. On the other hand in Assam as well as Barak Valley (a region in southern Assam comprising three districts Cachar, Karimganj and Haiakandi) more than 91% of rural households depend mainly on firewood as cooking fuel (Census of India, 2011). Fuel combustion radically generates air pollutants such as fine particles, carbon monoxide, nitrogen oxides, sulphur oxide, volatile and semi-volatile organic compounds (Balakrishnan et al., 2004; Zhang & Smith, 2003) and poses a serious threat to human health, especially in low-income countries which still use biomass fuels as energy resource (Mannucci & Franchini, 2017). Evidence obtained from HDR Assam 2014 shows that common childhood illnesses such as diarrhoea, pneumonia and other infections still prevail in the state, exerting a disproportionate burden on the population. About a decade ago, 7% of under-five children in Assam reportedly had symptoms of acute respiratory infections (ARIs). Few years later, another survey—DLHS-RCH III (2007–2008)—with a much larger sample of children, estimated 12% of children having ARI symptoms. A higher prevalence of both these childhood morbidities was noticed in the districts of Karimganj, Dhemaji, Cachar, Hailakandi, Sonitpur and Dhubri. 1
According to Annual Health survey (2011–2012) in Assam, the prevalence of several types of disability, acute and chronic illness are found more in rural areas than in urban areas. Among all the districts of Assam, Cachar has the highest number of persons with these types of disability per 100,000 persons, followed by Karimganj, Hailakandi and Nogaon. Further, according to the same report the incidence of acute illnesses (as diarrhoea/dysentery, ARI and fever of all kinds) measured per 100,000 persons is highest in Nagaon district followed by Karimganj, Hailakandi and Cachar. Further, Hailakandi has recorded the second highest number of persons (per 100,000) with ARI and Cachar has prevalence of maximum number fever of any kinds. Further the three districts of Barak Valley are among the top ten districts with greater prevalence of Asthma/Chronic respiratory infection within the state and among the top seven in terms of numerous chronic illnesses. Low birth weight in Barak Valley is another health concern found notably higher than rest of the districts of the state. Thus, health effect of IAP becomes a serious concern in rural Assam, especially in its Barak Valley region.
On 1 May 2016 Pradhan Mantri Ujjwala Yojana (PMUY) was launched as a social welfare scheme of the Central Government of India to provide 5 crore deposit free liquid petroleum gas (LPG) connections in the name of Women of below poverty line (BPL) households. The primary aim of this scheme is to safeguard the health of women and children against IAP by providing them with clean fuels. According to the report of the Comptroller and Auditor General of India (CAGI) on PMUY, in 2018 (post PMUY) the share of principal LPG users in India has increased from 2.3% in 2016 to 40.43% in 2018. However, the average refilling interval for PMUY users remain between three and four cylinders per year over the period 2016 to 2018 by the PMUY users according to the same report.
Further on the policy front, IAP is inextricably linked to poverty, as it is the poor who both rely on inferior rank fuels and have the least access to clean cooking technologies for cooking and heating (Bruce et al., 2000; Pant, 2008). Literature reveals intense relationship between environment and poverty, and the state of Assam shows a higher incidence of poverty than national level over time 2004–2005 to 2011–2012 (NSSO). Further according to HDR 2014 the Multidimensional headcount ratios of the three districts of Barak Valley (37.27, 39.49 and 41.06 in Cachar, Hailakandi and Karimganj respectively) are pretty higher than many other districts and the state average (30.1). However, the share of poor people is higher in rural areas of all the districts in the state than urban areas (NSSO 2011–2012). Hence, it would be worthwhile to conduct the study on rural people who are expected to use more biomass fuels. Further, from literature one can unambiguously link the relation between fuel use practice and respiratory health (Balakrishnan et al., 2004; Mannucci & Franchini, 2017; Zhang & Smith, 2003, etc). However, lack of evidence on literature regarding the problems of IAP and related health issues in Assam and Barak Valley, where the majority of people are residing in rural areas with a higher incidence of poverty motivates a comprehensive study on these issues. So, the present study attempts to address the specific issues of respiratory health across different fuel types and using pattern along with the influence of contemporary government policy PMUY and various factors affecting the incidence of respiratory health in the region.
Objectives of the Study
The following are the fundamental objectives of the study:
To examine the fuel use pattern in the households of rural Assam and the barriers of clean fuel practices.
To examine the relationship between household fuel use practice and respiratory illness.
To examine the factors posing risk of having respiratory illness.
Data and Analytical Technique
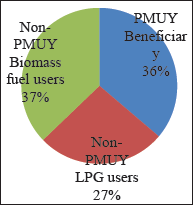
The study is mainly based on primary data collected from rural households of Barak Valley during January 2019 to June 2019. In total 2,541 individuals’ health information has been collected from 530 households of Barak Valley using stratified random sampling method. The total number of households in the three districts of Barak Valley is 768,126. Out of the total, 86.4% households belong to rural area and 14.6% belong to urban area, while Cachar, Karimganj and Hailakandi constitute approximately 49%, 32% and 19% of the total rural households, hence, accordingly the data were collected at 5:3:2 ratio. From Cachar 20 villages were selected from five subdivisions, while from Karimganj and Hailakandi twelve and eight villages were selected from three and two subdivisions respectively. Finally, 15 households were selected from each of the 40 selected villages using random sampling method. In total 600 households have been selected in this study, however, due to lack of information related to some crucial variables, 70 households could not be included in the present analysis and the final sample size stood at 530. Here out of this total sample, 63% households have access to LPG, while 27% households are primarily dependent on biomass fuels and 36% households are PMUY beneficiaries. Further out of the total, nearly 48% individual is female and 52% is male. Further the average family size of the households is approximately five in the study area with a total population 2,541. Here, approximately 10% individuals are above 60 years of age, 9% is under five years, while 53% and 28% of the population belong to the age groups of 18 to 60 and 5 to 18 years respectively.
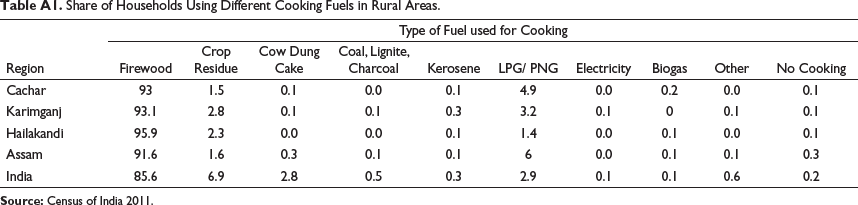
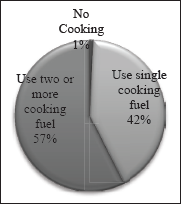
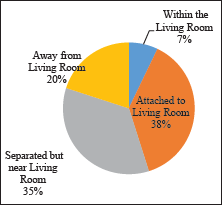
Census of India (2011) has identified that eight major types of fuels are used in India. In our study area 97% of the population uses only two types of fuels, namely firewood and LPG (Table A.1). Hence in this study these two fuel types are considered to examine the pattern of fuel use practice in rural Barak Valley. On the other hand in rural Barak Valley more than half of the total households are using multiple fuels (Figure A.2 in Appendix). So the study considers the fuel users into two categories namely clean and unclean fuel users. The clean fuel user category has been quantified as ‘1’and and the other category has been quantified as ‘0’.The first category are those households using LPG on regular basis and second category are those households that using the biomass solid fuel on regular basis with or without access to LPG. To have better insight of the fuel use practices the above two categories were sub-grouped as ‘0’ for those who are absolutely or predominantly using unclean solid fuel, ‘1’ for those using clean and unclean fuels simultaneously, ‘2’ for those using unclean between LPG refilling, ‘3’ occasionally (one to three times maximum in a year) and ‘4’ for those who have not used unclean fuel since having access to LPG (never after getting LPG). Further cross tabulation and percentage analysis are used to observe the relationship between household fuel use practice and respiratory illness. In order to check the variation in incidence of respiratory illness in the households of PMUY beneficiary and others, key symptoms of chronic bronchitis (CB), asthma and ARI along with medical diagnosed cases of TB for the households’ members are considered in this study.
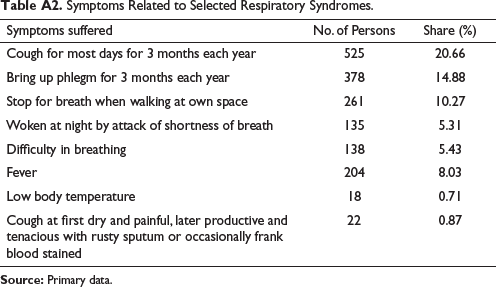
There are several types of respiratory illness that affect normal pulmonary function with common symptoms. Here to examine the incidence of respiratory illness, number of symptoms is considered as extent of severity of the respiratory illness based on disease specific number of symptoms. For the number of symptoms ranging from one to four, the severities are termed as mild, moderate, severe and extremely sever respectively. Following medically identified symptoms of various illnesses, adopted from review of related literatures, were inspected for a range of respiratory illnesses:
Cough for most days for three months each year Bring up phlegm for three months each year Stop for breath when walking at own space Woken at night by attack of shortness of breath Difficulty in breathing Cough at first dry and painful, later productive and tenacious with rusty sputum or occasionally frank blood stained Fever Low body temperature
The study considered eight most common symptoms of various respiratory syndromes related to IAP. The symptoms of chronic cough (i.e., cough on most days for at least three months each year) and haemoptysis (bringing up phlegm for three months each year) are the symptoms of CB (1 and 2). Likewise, shortness of breath (dyspnoea) as characterised by a need to stop for breath when walking at own pace and waking up at night due to attack of shortness of breath we take as the symptoms of asthma (3, 4 and 5). Fever or low body temperature, localised chest pain, cough at first dry and painful, later productive and tenacious with rusty sputum or occasionally frank blood stained along with cough are the symptoms of ARI (1, 5, 6, 7 or 8). If a person has a greater number of symptoms related to a particular illness, then the disease severity is as more and vice versa. Since, the symptoms of TB are similar to other respiratory syndromes and require advance diagnosis, so the incidence of the disease is considered for medically identified cases only. For example, if a person has only one symptom of ARI out of the five key symptoms, then the person is considered to have mild ARI, further a person with two, three, four or five symptoms is considered to have moderate, high, very high or severe ARI respectively.
To analyse the factors influencing respiratory health, the severity of selected four respiratory syndromes are taken as function of some selected personal and household related factors. Since, the severity of diseases is assumed to increase with number of symptoms and have multiple ordered outcomes for CB, Asthma and ARI, hence probit model is applied in this study. The application of ordered model or generalised probit is suitable for multiple categorical outcomes; specially when dependent variable is ordinal or have natural order (Andrew, 1998; Greene, 1993; Pant, 2008). Hence to identify the factors influencing incidence of respiratory illness following ordered probit model is applied in this study:
where yij is the prevalence of any respiratory syndrome in i’th individual of j’th household, which takes value upto k when k number of symptoms exist and 0 when there are no disease symptoms. Here k goes from 1 to 3 for Asthma, 1 and 2 for CB and 1 to 4 for ARI based on total number of common symptoms of the specific illness. On the other hand yij takes value 1 for medically identified cases of TB or 0 otherwise. Hence the study consider medically identified case of TB, so in this case binary probit is applied where yij = 1 for TB patients and 0 for others. FS indicates family size and KL is the proxy variable for measuring kitchen distance from living space of the households which takes value 0 if the household has no separate kitchen and cooking within living room, 1 if the kitchen room is attached with same wall of the living room, 2 if the kitchen location is detached from living room with different partition within same or attached roof, and 4 if kitchen location is quite far of living space with detached roof or if the household is using open space cooking stove. GND denotes gender of the individual which takes value 1 for male and 0 for female. AGE is the age of the family member, EA stands for educational attainment individual measured in terms of years of formal education, AFUPM denotes amount of firewood used by the households per month, YUL denotes years of using LPG as cooking fuel, ln(AFIPCj) denotes annual family income of the household per capita transformed into natural logarithmic form to avoid huge scale difference among the variables. SHij denotes smoking habit of the i’th family member of j’th household which takes value 1 for smoker or 0 otherwise. ei is the error term of the probit model that follows standard normal distribution. Since the objective of the study is to observe the factors influencing severity of selected respiratory syndromes, the marginal effects of each level of syndromes are further estimated in this study.
Results and Discussion
Fuel Use Pattern in Rural Assam
According to Census 2011 more than 90% of the rural households in India as well as Assam rely primarily on unclean fuels such as firewood, crop residue, cow dung for cooking while the rest 10% uses cleaner cooking fuels such as LPG, biogas and so on (shown in Table A.1). Although the share of cow dung cake and crop residue used for cooking is moderately less in Assam and in the three districts of Barak Valley than the national level, still the higher share of firewood use makes the situation volatile. From the field survey it has been found that out of 530 households494 (93.21%) households still use solid biomass fuel as primary or secondary source of cooking energy, of which 318 (60%) have the accessibility to LPG either through PMUY or otherwise. On the other hand, the use of kerosene, electricity and so on as cooking fuel is very marginal in the study area (Table A.1) as well in the state.
According to the report of the CAGI on PMUY, in 2018 (post PMUY) the absolute use of unclean cooking fuel has declined to 40.43% from 97.47% in 2016 (pre PMUY). Where, 24.13% are using LPG and unclean fuels both simultaneously. The average refilling interval for PMUY users remains between three and four cylinders per year over the period 2016 to 2018 for the PMUY users (according to CAGI report). The results obtained from field survey in the three districts of rural Assam also reveal similar figure for PMUY users, however the average refilling gap for non-PMUY LPG users is between one to two months (Table 1). This evidently indicates that the households are still continuing conventional cooking fuels over LPG. For various socio, economic, cultural and infrastructural factors rural households use multiple fuels for cooking.
Fuel User Category-wise LPG Refill Gap.
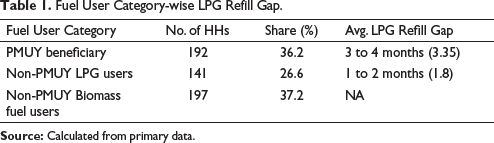
Fuel User Category-wise LPG Refill Gap.
The study reveals that in the three districts of Barak Valley approximately 57% of the households are using two or more fuels while 42% use single cooking fuel (Figure A.2 in Appendix). Table 2 reveals out of 530 households 201 households mostly relies on biomass fuel for coking without using LPG and 6 households mainly use unclean cooking fuel along with the regular use of LPG. This implies that approximately 39% of the total households are primarily biomass fuel user.
Use of Clean and Unclean Fuels in Rural Areas of Barak Valley Assam.
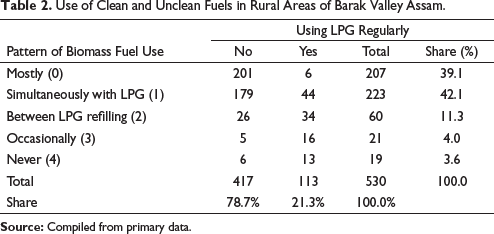
On the other hand a large share of households (approximately 42%) in rural areas use biomass fuel simultaneously with LPG due to their easy accessibility and affordability nature which lead them to ignore the harmful impact of IAP. This means that more than more than 70% of the total households are using unclean cooking fuel on regular basis. On the other hand 11.3% of the households use biomass fuels between the interval period of LPG refilling and nearly 4% uses unclean fuel once or twice in a year for occasions. In total nearly 21.3% of the households are using clean fuel on regular basis and the rest have different reason for using polluted fuels overlooking the related health issues.
Considering the duration of clean fuel use practice and the pattern of biomass fuel use, the study reveals a positive association between uninterrupted use of clean fuel (or less frequent use of biomass fuel) and length of having accessibility to clean fuels (Table 3).
Fuel Use Pattern and Period of Having Access to Clean Fuels.
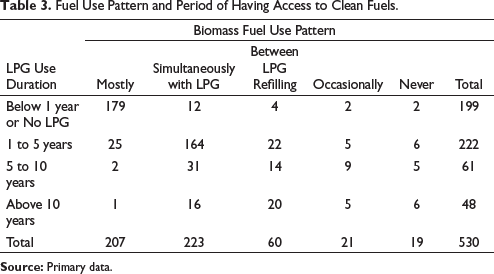
Here out of 199 major biomass fuel using households, 179 households (approximately 90%) have no access to LPG and 20 households have received LPG connections few months back. Further out of this set only 8 households have adopted stable use of LPG while more than 95% (191 households) are primarily using solid fuel. On the other hand out of the out of the 222 households which have obtained LPG connection between one to five years 164 households (73.87%) are using both LPG and biomass fuel regularly on daily basis. While 25 households (more than 11%) rarely use LPG and 27 households (12.16%) either occasionally or between refills gap use biomass fuels. Hence it can be said that 380 (more than 71%) households without LPG connection or with LPG connection (but for below five years) are primarily dependent on biomass fuels. This implies that considerable shares of latest LPG users (beneficiaries) are not using LPG on regular basis (visibly clear from Figure 1).
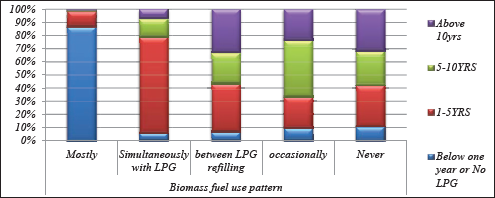
Further out of the total sample only 100 households (60 + 21 + 19), that is, 18.88% of the households primarily use LPG, while the rest use unclean fuel more intensively (Table 3).
Qualitative Measures of Association Between Uninterrupted Use of Clean Fuel and Duration of Using Clean Fuels.
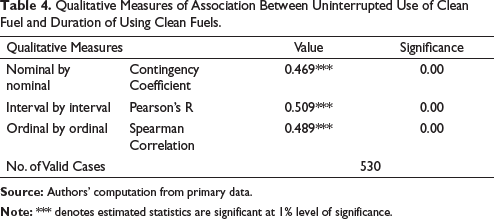
Table 4 depicts various statistics related to the qualitative measures of association between continuous use of clean fuel and duration of using clean fuels. Here the estimated correlation coefficients for categorical outcomes are also found positive, statistically significant and the magnitude is moderate ranging from 0.47 to 0.51. This implies that duration of using clean fuels is positively associated with regular use of clean fuel. In other words it can be said that the households with higher experience of clean fuels are using LPG on regular basis.
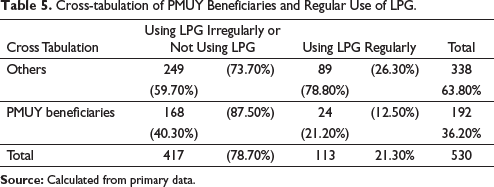
Table 5 depicts the cross-tabulation of PMUY beneficiaries and regular LPG users. Out of the total sample only 21.3% (113) households are using LPG on regular basis and from this set of regular LPG users only 21.2% are PMUY beneficiaries. On the other hand, out of the total set of PMUY beneficiaries 87.5% households use unclean fuel more intensively and 12.5 are using clean fuel on habitually. This implies that PMUY has equipped the rural households with the connection of clean fuel but failed to change the fuel use pattern of the beneficiaries.
Cross-tabulation of PMUY Beneficiaries and Regular Use of LPG.
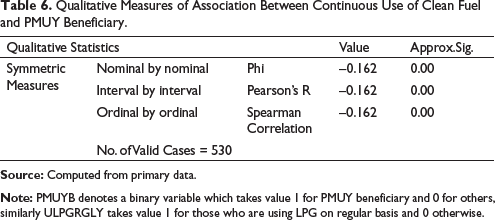
Further the coefficient of qualitative measures of association between continuous use of clean fuel and PMUY users (shown in Table 6) reveals significant inverse relation.
Qualitative Measures of Association Between Continuous Use of Clean Fuel and PMUY Beneficiary.
This necessitates some modification of the PMUY scheme and its proper implementation as PMUY users are not using clean fuel regularly. Hence in this study the grounds for using unclean fuels are further incorporated through some open-ended responses of the households.
This study also tried to know why the rural households prefer biomass fuel over clean fuels in Barak Valley. From the perspective of households various rationales related to economic, behavioural, institutional and infrastructural aspects of their life have been reported. Among the reported responses some are firmly connected with another, however, to perceive the broader aspects of the household perspective all opinions are reported in this study (Table 7).
Grounds for Opting Biomass Fuel over Clean Fuels from Households’ Perspective.
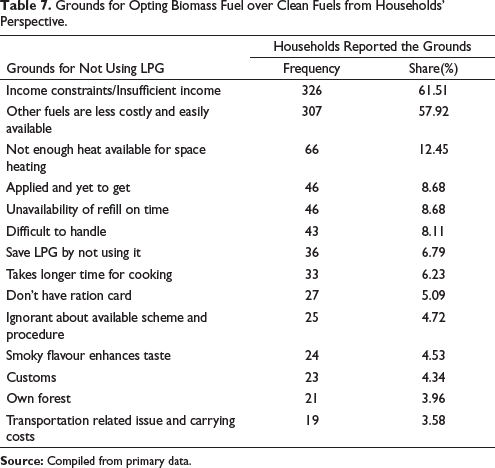
More than 61% of the households have mentioned that their insufficient income is the prime reason for not using clean fuel on regular basis and opting for biomass fuels as an alternative cooking practice. Apart from this, four households have reported that they failed to save the requisite amount to refill their allotted cylinder. Another 326 households have opined that for them LPG is just a distant dream because of their extreme poverty and that is why they are regularly depending on biomass solid fuels to manage their kitchen.
Table 8 illustrates the variation in opinion regarding the two above mentioned vital barriers of clean fuel use for PMUY users with others. The results of the cross-tabulation in favour of the two significant barriers reveal that the perspective regarding these barriers within the group of PMUY users is stronger than other group.
Perspective on Barriers of Clean Fuel Use Between PMUY Users and Others.
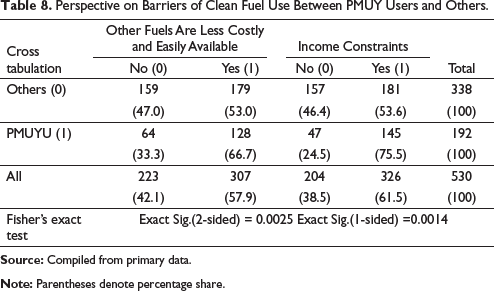
The Fisher’s exact test is used for two-by-two contingency table for testing whether row and column variables are independent or not. The null hypothesis of this test assume row and column variable are independent and the exact significance level of the test infers the results. Here for the two barriers of clean fuel use from the perspective of PMUY users is found stronger than other group as the Fisher’s exact test is significant at less than 1% level of significance (both one tailed and two tailed). This is probably due to the reason that the PMUY users are BPL households and with their insufficient monthly income they often fail to save the amount for filling up their LPG cylinder. On the other hand, availability of free and low-cost alternative fuels is consumable on daily basis which stimulate them to evade clean fuel use practice.
Respiratory Syndromes in Rural Assam
The incidence of respiratory syndrome in the households of rural areas and the factors influencing the prevalence of these selected respiratory syndromes along with the relationship between incidence of respiratory illnesses with fuel use pattern are discussed as follows:
Asthma
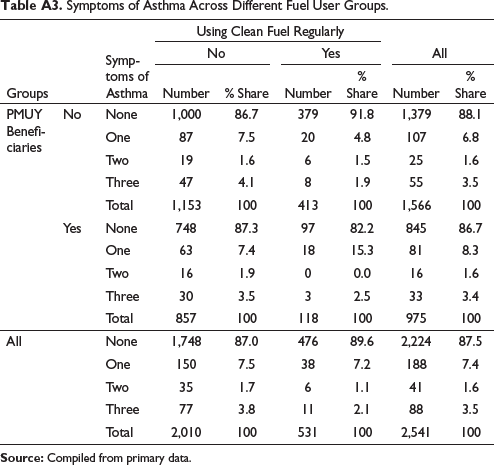
Asthma is a common respiratory syndrome that blocks airway to lungs through inflammation of the respiratory tubes. The effects of particulate matter and gaseous pollutants from air pollution increase the risk of exacerbations of asthma symptoms through oxidative injury to the airways, leading to inflammation and sensitisation (Guarnieri & Balmes, 2014). Children exposed to air pollutants and allergies are at a higher risk of having asthma (Annesi-Maesano et al., 2013; Jiang et al., 2016). Out of the three key symptoms of Asthma more than 5% people have reported problem of difficulty in breathing, while 5.3% and have reported the problem of sleep deprivation by attack of shortness of breath and 10.3% need to stop for breathing when walking at own space (Table A.2).Overall, about 3.5 persons suffers from Asthma, while 7.4% and 1.6% people have at least one or two symptoms of Asthma respectively (Table A.3). Out the total family members of PMUY users and others the difference in the incidence of having two and three symptoms are almost nil and negligible. However the variation in terms of having at least one symptom of Asthma is marginally higher for PMUY user group. On the other hand the incidence of one to three symptoms of Asthma is found more for those who belongs to the households that are using unclean fuels more intensively.
Probit estimates illustrating the influence of household and personal factors on Asthma, CB and ARI are shown in Table 9. Among the household related factors years of using clean fuel and distance of kitchen are found negatively influencing prevalence of the symptoms of Asthma. This implies that higher the duration of using clean fuel and away the cooking place, lesser will be the risk of developing Asthma. This is evident due to the reason that increase in these factors would lead to reduction in exposure to indoor air pollutants and hence lessen the chance of having respiratory syndrome. Per capita annual family income is found positively associated with probability of having Asthma. This unusual causal relationship may be due to the fact that higher per capita income is generally found in households with more family members and in such families there are more cooking activities thus more IAP. Further family size is found inversely influencing incidence and disease severity of asthma. It implies that large size families are likely to have lesser probability of suffering from asthma. In rural Barak Valley the larger families are characterised by large houses and more cooking members, which points towards lower density of the indoor air pollutants with larger living space and division of cooking responsibility among the family members. Further, the coefficients of marginal effect of family size reveal that an increase in family size is likely to decrease the probability of mild, moderate and severe asthma by 0.5, 0.1 and 0.2% respectively.
Impact of Household Related and Personal Factors on Incidence of Asthma, Chronic Bronchitis and Acute Respiratory Infection.
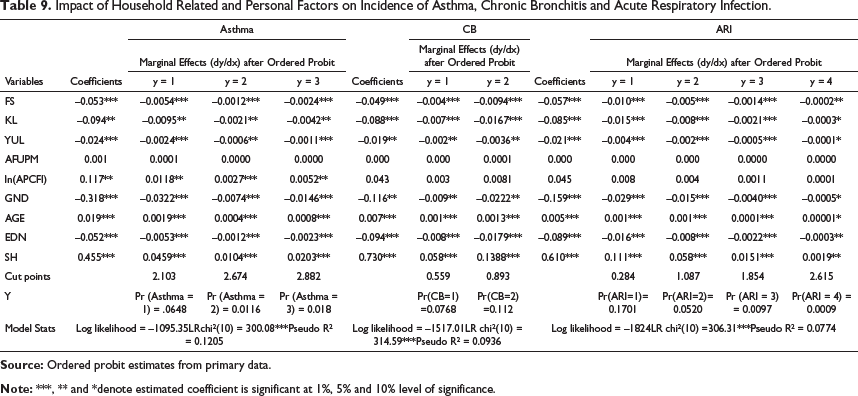
Further among the personal factors, age is found directly posing risk of having Asthma and the marginal effects of the estimated coefficient reveal that one year increase in age of an individual increases 0.19% risk of having at least one symptom of Asthma, 0.04% risk of having at least two symptoms and 0.08% of having three symptoms of Asthma. Smoking habit makes 4.6% higher the risk of having at least one symptom, 1.04% risk of having two symptoms and 2.03% risk of having all the symptoms of Asthma. Again the gender and educational attainment are found to have inverse impact on incidence of Asthma. Since the coefficient of gender is a dummy variable that takes value one for male and 0 for female, hence for the estimated coefficients reveal that female members are at 3.2% higher risk of developing at least one symptom of Asthma than the male family members. Further, the coefficients of marginal effect of educational attainment implies that one year increase in formal education is likely to reduce 0.5% and 0.2% risk of having mild and severe Asthma respectively. Hence it can be said that an increase in year of formal education will decreases probability of the incidence of Asthma.
Chronic Bronchitis (CB)
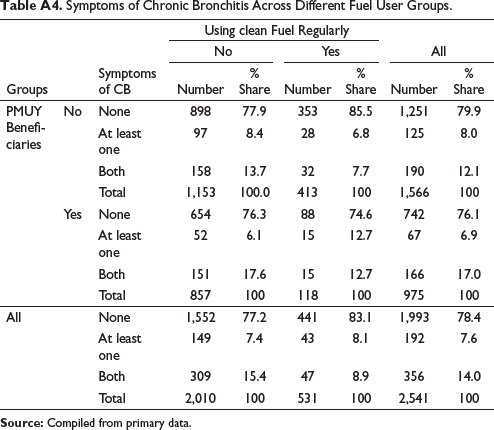
Apart from Asthma and different ARIs, some of the infections are perpetual in nature, such as chronic infection of bronchitis. So the present study also considers CB as an indicator of respiratory illness and found approximately 548 persons reporting that they had either one or both the symptoms of CB (depicted in Table A.4).
14% of the people have both the symptoms of CB and 7.6% have at least one symptoms of CB. Further the proportion of people with the symptoms of CB is found comparatively less prevalent for those who are using clean fuels on regular basis. Out of the sample of PMYU beneficiary households total 166 have experienced both the symptoms of CB. The incidence of CB is 17% among PMUY beneficiary households and 12% on non-PMUY beneficiary households.
Among the household related factors, kitchen location is found negatively related to the probability of having the symptoms of CB (Table 9). One unit increase in kitchen distance reduces 0.6% and 1.4% probability to have one and two common symptoms of CB respectively. Male gender are at a lesser risk of developing at least one or both the symptoms of CB compared to female by 1.04% and 2.5% respectively. Similarly with higher years of using clean fuels and house area reduce the risk of developing symptoms of CB. On the other hand among personal factors age and smoking habit are found directly posing threat to occurrence of CB. Again educational attainment is found inversely influencing on incidence of CB with the probability of reducing risk of mild CB by 0.73% and severe CB by 1.7%. Among these selected influential factors the magnitude of the coefficient of smoking habit is found strongest followed by gender, education and kitchen location. In this study smoking habit has been found to increases 5% risk of developing one symptom and 14.1% risk of developing both the symptoms of CB.
Acute Respiratory Infection (ARI)
Acute respiratory tract infection refers to contagion that interferes with normal pulmonary function. Upper respiratory tract infection includes common cold, flue, tonsillitis, sinus, laryngitis and pharyngitis (sore throat). A lower respiratory tract infection includes infections that can block the airways, such as acute bronchitis, pneumonia, acute exacerbation of chronic obstructive pulmonary disease (CB) and acute exacerbation of bronchiectasis. Children and adults, exposed to combustion of solid biomass fuels, have higher risk of developing ARI in upper and lower respiratory organs compared to those living in households using cleaner fuels or having less exposure to smoke (Bruce et al., 2000; Franklin, 2007; Khan et al., 2017; Li et al., 2013; Pant, 2008; Smith et al., 2000). Prolong low to moderate level of air contaminant exposure is associated with a greater risk of developing ARI after severe strain and represents a novel and potentially modified environmental risk factor for ARI (Lin et al., 2018; Reilly et al., 2019).
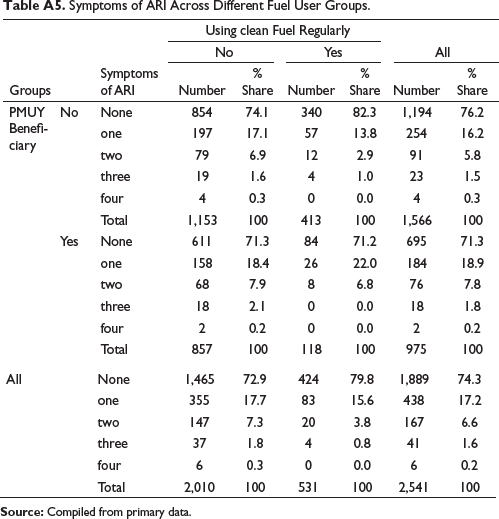
In this study the incidence of ARI is found differently across different fuel user groups, however occurrence of mild (at least one) symptom is found highest across all the groups. On the other hand, very severe (all common four) symptoms of ARI is zero among the regular LPG using households. Further the variation in incidence of ARI between the groups of PMUY users and others is found marginally higher in the family members of PMUY users (shown in Table A.5).The influence of household and personal factors on incidence of ARI is found similar as on CB and Asthma (Table 9). Here, it is found that increase in one year of formal education reduce 1.6% risk of having at least one symptom of ARI. Smoking habit is likely to increases the risk of having at least one common symptom of ARI by 11.3%.
Tuberculosis (TB)
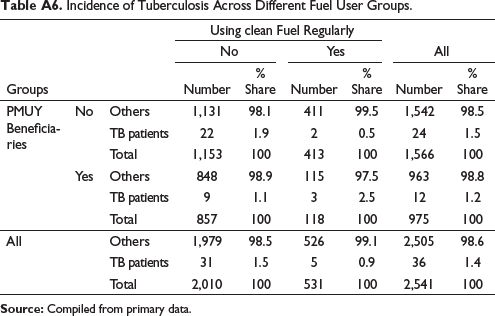
TB is a severe bacterial infectivity that affects lungs. According to WHO TB is one of the top 10 causes of death and about 1.5 million people died from TB in 2018 worldwide 2 . In 2018 India is one of the zeniths out of eight high burdened countries. Long-term exposure to ambient SO2 increased the risk of TB in males (Hwang et al., 2014) and long-term exposure to PM2.5 and CO2 generated from the use of solid biomass fuel are positively associated with TB formation. Hence smoking and IAP may increase the risk of TB (Kim, 2014; Lin et al., 2018; Lin et al., 2007; Oztürk et al., 2014). Table A6 depicts incidence of TB across different fuel user groups in Barak Valley.
In this study area out of 530 households (of 2,541 individuals) 35 households have reported 36 TB cases. This implies that approximately 1.4% of the total population from 6.6% of the households has been medically identified as TB patient. This result is quite higher compared to Annual Health Survey 2012–2013, Assam, (Census of India), according to which the incidence of TB in the three districts of Barak valley is approximately 1%. The difference is probably due to reason that in the Annual Health Survey (2012–2013) has considered overall population of the districts and the present analysis is based on rural population only. This difference further infers that the incidence of TB is higher in rural areas than the urban. Further out of these 36 patients five persons belong to the households that are using clean cooking fuel on regular basis while the rest 31 belongs to those households that are using unclean fuel. On the other hand, among 12 individuals from the households of PMUY beneficiary three patients belong to the households that are using clean fuel on regular basis and nine are from other group. Further 22 TB patients belong to the group of non-PMUY beneficiary households who are using unclean fuel more intensively and two patients belong to the households which are non-PMUY beneficiary households and using LPG on regular basis. Hence it can be said that incidence of TB is more dominant in the households using solid biomass fuels irrespective of type of LPG connections.
Influence of Household and Personal Factors on Prevalence of Tuberculosis.
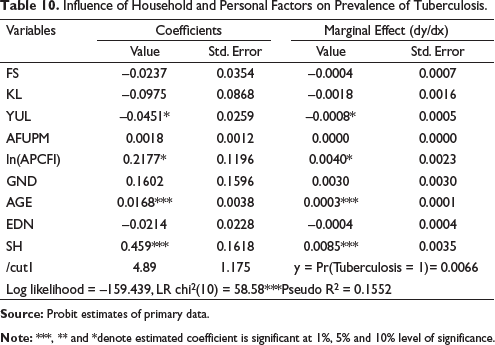
There is a complex interaction between smoking, socioeconomic conditions, indoor air quality and TB. Hence an effective indoor air quality control could help to prevent TB risk (Oztürk et al., 2014, Lin et al., 2007). Table 10 shows binary probit estimates of TB on different socio-economic and personal factors.
The results reveal that smoking habit, age of the individual and annual income of the households are directly associated with the risk of having TB, like asthma. Considering the magnitude of influential factors from marginal effect of the respective variable it can be said that smoking habit has highest influence on incidence of TB followed by quantity of firewood used and age. The findings reveal that smoking habit increases approximately 1% risk of being diagnosed with TB.
Association Between Fuel Use Pattern and Respiratory Health
It has been observed that the majority of the people of Barak Valley are intensively using unclean fuels in spite of having clean fuel connections through PMUY (Table 5) and the incidence of respiratory illnesses is deeper in the households using unclean fuels more intensively (Table A.3 to Table A.6). So, the connection between respiratory illnesses PMUY beneficiary households cannot be ignored.
Association of Respiratory Illnesses with Continuous Clean Fuel Use and PMUY.
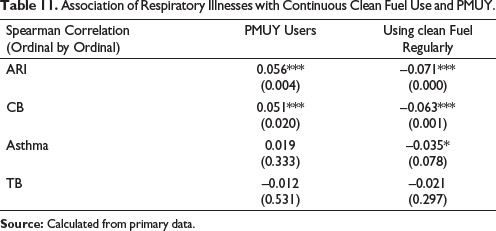
Table 11 depicts the association of respiratory illnesses with continuous use of clean fuel and PMUY. The coefficients of correlation reveal that disease severity of ARI and CB is positively related with PMUY and inversely associated with the households of clean fuel users. This implies that the problem of these two respiratory illnesses is more in the households of PMUY beneficiary households than others. This may be due to the reason that the extreme poor (vulnerable sections) were given the connections.
The introduction of PMUY was done with much optimism to bring about a major change in the pattern cooking fuels use in rural India, however it has been found in this study that only less than one fifth of the total sampled beneficiary households are using LPG uninterruptedly and the rest are using firewood more or less intensively on regular basis. Further, the PMUY users are found to refill their cylinders hardly three to four times in the year. Average refilling interval remained between three and four months for PMUY users at national level and even in rural Barak Valley level. The coefficient of qualitative measures of association between continuous use of clean fuel and PMUY users also reveals inverse relationship. This indicates that PMUY beneficiary are not using clean fuels on regular basis. This implies that though PMUY has equipped the rural households with clean fuel connection but failed to change the practice of using firewood by the beneficiaries. This is probably due to the reason that the PMUY users are BPL households and with their insufficient monthly income often they fail to save the amount for filling up their LPG cylinders. On the other hand, availability of free and low-cost alternative fuel which is consumable on daily basis stimulates them to evade using clean fuels.
In regard to health aspect, the study reveals that the incidences of respiratory illness such as CB, asthma; ARI and TB fall more profoundly in the households of solid biomass fuel users on both the groups. On the other hand between the groups, the proportion of individuals suffering from moderate to severe symptoms of CB and ARI along with incidence of TB (17%, 9.8% and 2.5% respectively) in the households of PMUY users are found higher than in the non-PMUY beneficiary households (12%, 7.6% and 5% respectively).This implies that PMUY is not successful in reducing respiratory infirmity in the rural households of Barak valley. Beside the incapability to refill LPG cylinder on regular basis, various personal and households related factors are also found responsible in increasing risk of respiratory illnesses. Among the households, the factors such as distance of cooking space from living space and years of having access to clean fuel are found significant and inversely related with the risk of having respiratory illness such as asthma, CB and ARI. On the other hand, family income is found to be positively influencing probability of having Asthma and TB, which is quite an unexpected outcome. This is probably due to the reason that an increase in economic status of the rural households is not sufficient to generate the awareness on IAP related illness and to ease the practice of biomass fuel use pattern. Firewood available from surroundings (BarirLakri in native language) at free or lower costs certainly induces people to use unclean fuels. Further, average solid fuel used by the household is found to be significantly associated with risk of being diagnosed with TB. Family size is found inversely escalating chances of having all the four selected respiratory illnesses which is not an expected outcome. Among the individual related factors smoking habit and age of the person are found to be significant in increasing the risk of all the four pulmonary syndromes. Further gender and educational attainment of the person are found negatively associated with probability of having symptoms of Asthma, CB and ARI. Since women spend more time in cooking space with a higher exposure to indoor air pollutants, hence is expected to suffer more. An advanced level of education is expected to create awareness regarding IAP related illnesses. Therefore, with the increase in level of educational attainment the probability to have symptoms of respiratory syndromes decreases. Further, considering the magnitude of the influencing factors, smoking habit is found to be the most prominent in posing risk to respiratory health.
So, based on the above observations this study suggests to rationalise the price of clean fuel in such a way that the use of clean fuel becomes most convenient and economically viable to those people who mostly use biomass fuel. For example, many rural PMUY beneficiary households are unable to opt for clean fuels due to their income constraint; hence, an inexpensive price of LPG refilling may encourage these households to refill LPG on regular basis. This may further reduce the exposure to IAP and the problem of respiratory infirmity in the households of rural Barak Valley. A large-scale awareness campaign among the poor about the harmful effect of such free/low-cost fuels needs to be made, so that they shift from unclean fuel to the cleaner one. Some restrictions by the local governments on reckless collection and destruction of forest by the surrounding people will also supplement the move of better cooking practice as well as preservation of forest. Further, anti-smoking campaign in the rural areas to foster awareness may help to reduce magnitude of respiratory illness.
This present study confronted with some limitations. The study could not cover other vital and prevalent illnesses viz cardiovascular disease, lung cancer, hypertension, eye infection and skin diseases that are closely related to air pollution. In order to keep the study simple, indicators of air pollutants and ventilation facility of the households are also not integrated in the study. Further the study is limited to Barak Valley of Southern Assam, though comparison with other parts of Assam could have attracted a comprehensive picture. Any change in variable set or sample may depict a different picture. Hence it would be encouraging to conduct further study by considering both respiratory and non-respiratory illnesses with more pollution, households and individual related factors.
Appendix
Share of Households Using Different Cooking Fuels in Rural Areas.
Symptoms Related to Selected Respiratory Syndromes.
Symptoms of Asthma Across Different Fuel User Groups.
Symptoms of Chronic Bronchitis Across Different Fuel User Groups.
Symptoms of ARI Across Different Fuel User Groups.
Incidence of Tuberculosis Across Different Fuel User Groups.
Supplementary Material
Supplementary material for this document is available online.
Supplemental Material for Cooking Fuels and Respiratory Infirmity in Rural Barak Valley: An Analysis of Pradhan Mantri Ujjwala Yojana Period by Monalisa Das and Alok Sen, in Arthaniti: Journal of Economic Theory and Practice
Footnotes
Acknowledgement
We would like to express our gratitude to ICSSR for financial support and all the field associates for serving the field survey with us. We are also thankful to the reviewers and editors for their useful suggestions.
Declaration of Conflicting Interests
The authors declared no potential conflicts of interest with respect to the research, authorship and/or publication of this article.
Funding
The authors disclosed the receipt of the following financial support for the research, authorship and/or publication of this article: This research is supported by the Indian Council of Social Science Research (ICSSR), New Delhi, India (File No: 3-35/18-19/PDF/GEN1).
Notes
References
Supplementary Material
Please find the following supplemental material available below.
For Open Access articles published under a Creative Commons License, all supplemental material carries the same license as the article it is associated with.
For non-Open Access articles published, all supplemental material carries a non-exclusive license, and permission requests for re-use of supplemental material or any part of supplemental material shall be sent directly to the copyright owner as specified in the copyright notice associated with the article.