
Abstract
Background
The first-trimester ultrasound assessment of nuchal translucency (NT) thickness has lately been recommended as the most helpful sign in early screening for prenatal chromosomal disorders. Increased foetal NT thickness between 11 and 13+6 weeks of gestation is a frequent phenotypic manifestation of chromosomal abnormalities as well as a variety of foetal deformities and genetic disorders.
Purpose
At the moment, clinicians conduct the measurement manually. The measurement may take a long time to complete, requires highly competent operators, and is susceptible to mistakes. So, an automatic method is required for NT measurement.
Materials and Methods
This study proposes a Markov random Field-based approach for contextually segmenting the NT area from foetal pictures and offering a quick and inexpensive diagnostic even during the early stages of pregnancy.
Results
Proposed method gives maximum NT thickness error 0.03 and minimum NT thickness error 0.04.
Conclusion
The proposed research work developed a prototype for an automated NT thickness measuring system. This study proposes an MRF-based model for segmentation and detection of NT area from foetal pictures which gives error is less than other methods.
Introduction
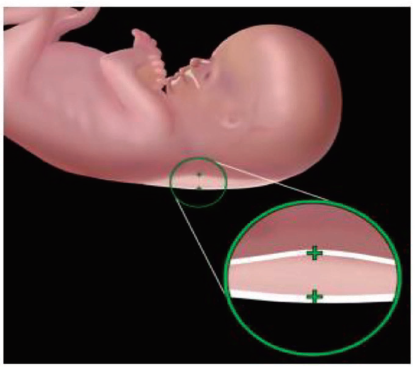
Nuchal translucency (NT), as shown in Figure 1, is a liquid fill under the foetus’s neck skin that shows sonographically like an anechogenic area (i.e., a black zone in greyscale images) among two echogenic areas (i.e., bright zones). The thickness of the NT, also known as the diameter, is associated not only with Down’s Syndrome (DS), but also with other genetic conditions such as Edwards’ (trisomy 18), Palau’s (trisomy 13), Turner’s syndromes, and heart problems.1, 2
Nuchal Translucency. 1
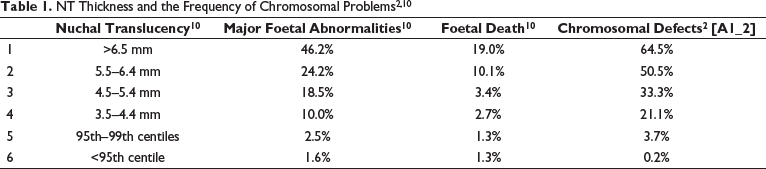
For almost two decades, researchers have been captivated by the link between increasing foetal neck thickness and genetic and cardiac problems. 3 Benacerraf et al. 4 reported a study in 1987 that linked DS to higher nuchal fold thickness evaluated during 16 weeks of gestation in 5500 foetuses. Following that, Nicolaides et al. 5 reported an increased incidence of chromosomal abnormalities in foetuses with high nuchal fluid buildup at 10–14 weeks gestation. NT is a subcutaneous accumulation of fluid in the foetal neck that is detected by ultrasonography during the initial trimester of pregnancy. 6 NT thickness rises with foetal crown-rump length in normal foetuses (CRL). Contributing factors for expanded NT usually involve cardiac dysfunction associated with heart and great artery abnormalities, venous congestion inside the head and neck, altered extracellular matrix composition, collapse of lymphatic drainage due to atypical or delayed lymphatic system development, or impaired foetal movements, foetal anaemia or hypoproteinaemia, and congenital infection. Table 1 summarises the relationship between NT thickness and the frequency of chromosomal problems, miscarriage, foetal mortality, and significant foetal abnormalities. With increasing NT thickness, the frequency of chromosomal abnormalities grows dramatically. It became obvious very quickly that an elevated NT is not just a diagnostic for chromosomal abnormalities, but also a generic evidence of a disruption in regular early development.
Accurate measurements are critical because differences of even just a few tenths of a millimetre might have therapeutic implications owing to the influence on the detection rate. 7 The positioning of the callipers on the monitor is an important factor in NT measurement quality. Callipers could be adjusted by a small distance of 0.1 mm using current technology. The method for measuring NT, the necessity for proper sonographer training and external quality verification, and the use of NT in successful monitoring for genetic abnormalities are all well established. 8 Traditional segmentation algorithms confront several obstacles, including fuzzy edges, intensity uniformity, increased time consumption, and a significant likelihood of inaccuracy in recovering the NT area. Rapid identification of DS would overcome these challenges and give a more accurate and timely diagnosis of the foetus. The objective of this article is to introduce an effective tool to aid in early diagnosis through the automatic quantification of NT; the suggested scheme can identify NT and a way of measuring its thickness without the need for user intervention, thereby eliminating inter- and intra-observer variability.
The following is how the article is structured. The second section provides a summary of the background literature. The third section presents a problem formulation for estimating the NT area using Fuzzy Clustering and MRF. The segmentation method used to detect the NT edges properly is described. The fourth section presents the experimental outcomes. The fifth section concludes the article.
Literature Survey
There are various publications on the measurement of NT in the literature; Sciortino et al. 9 present a novel approach to assist the clinician in both automatically identifying the nuchal area and obtaining an accurate thickness estimate of the NT. Thomas et al. 10 describe a SegNet model based on a Convolutional Neural Network (CNN) and a VGG-16 for semantically separating the NT area from US foetal images and delivering a rapid and economical assessment during the beginning phases of gestation. An AlexNet-based transfer learning technique is used to train the NT segmented areas for the detection of the midsagittal plane, Chudhary et al. 11 suggested an automated NT identification approach based on SIFT feature point and GRNN. This non-invasive method is critical not just for NT testing, but also for detecting severe abnormalities and identifying high-risk pregnancies. 12 Ping et al. 13 investigate the use of ultrasonic assessment of foetal NT width in early gestation and its association with unfavourable pregnancy outcomes. Lee et al. proposed14, 15 a semi-automatic method of foetal NT thickness measurement that utilises a coherence-enhancing diffusion filtration to improve the frontier and eliminate, accompanied by identification of the NT using optimisation techniques to minimise a cost function that combines intensity, edge strength, and continuity. Catanzariti et al. 16 offer a method that finds the boundary of an NT automatically once a targeted area has been explicitly selected. The approach is based on cost function minimisation and is optimised using the dynamic programming paradigm.
Deng et al. 17 suggested a hierarchical structural model for identifying the NT area automatically. To represent the NT, head, and body of foetuses, three discriminative classifications are initially trained using Gaussian pyramids. The spatial constraints among them are then denoted by a spatial model. Eventually, the suggested model is inferred using dynamic programming and the generalised distance transform, ensuring that the best solution for NT detection is reached. Nirmala et al. reported 18 the NT Width measurement in screening first-trimester foetus for DS. The NT zone was segmented using mean shift analysis as well as canny operators, and the precise thickness was calculated using Blob analysis. Liu et al. 19 create a CNN comprising fully linked layers to directly identify the NT area. Explicit identification of other body parts, on the other hand, necessitates extra annotation, development, and processing expenditures. In circumstances of ambiguous head placement or non-standard head-NT relations, it may also create cascading mistakes. In addition, we use U-Net with a tailored design and loss algorithm to provide exact NT segmentation. Finally, principal component analysis is used to compute NT thickness.
Methodology
The work that this article discusses is part of a larger initiative aimed at designing and developing software tools that could simplify the entire procedure of non-invasive screening for the operator. An automated system has several advantages. First, the evaluation would become consistent and repeatable, increasing the overall reliability of the test and perhaps minimising the frequency of intrusive screenings. 20 Second, with automated measurement, the time required for a single assessment would be reduced, shortening the time patients must wait before being evaluated while enhancing the number of screens that may be conducted daily. 21
The goal of image segmentation is to divide the image into a set of meaningful chunks, or regions, based on the intensity values indicated by their pixels. Specifically, segmentation divides the image into a set of 
xk= Gray Value associated with kth pixel
vi= ith Cluster Center uik= Fuzzy menmbership Value of pixel k m = Fuzziness Exponent with valuelarger than 1
Mobility of the contour is constrained by the provided image in active contour approaches. If the item being detected is present in the image, the contour will begin above it and move inward along the object’s normal until it hits the edge. The LMS, which was first proposed by Osher and Sethian in 1988, employs a zero-level function supplied at time t as a 2D Lipschitz function indicated by 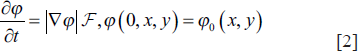
In this case, the coordinates
Proposed Segmentation
Initially, the suggested technique would segment the region of interest (ROI) using a level-set method and fuzzy clustering. In the suggested method, the level-set function is initialised to an initial value using fuzzy clustering. The FCM creates misleading blobs and outliers in the picture. Gaussian filtering is used to isolate these ancillary effects. Following these steps, the results of the fuzzy clustering are used to initialise the level-set function.


A ROI is computed using,

The level-set function is set up initially as:


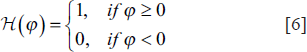
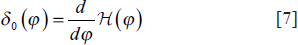
In traditional level-set approaches, controlling parameters are inputted manually, with values shifting according to the needed application, in order to influence the development of the level-set function. The suggested technique utilises the outputs of fuzzy segmentation to perform an adaptive evaluation of all the necessary controlling parameters. The Heaviside function and the Dirac function are used to assess the area and the length of the contour generated by fuzzy clustering.


Here, the Heaviside function may be described as:
and the Dirac function as:
An increase in balloon pressure, the extraction zone is drawn in by the level-set function, which is generated by the parameter m. Based on the sign of 
The Markov Random Field (MRF) is a sophisticated stochastic modelling technique that may be used to efficiently depict the local interactions between the properties of neighbouring pixels. More than that, it may use Bayesian probability distributions to represent the spatial relationship between neighbouring pixels. Segmentation is performed using the maximum posterior probability (MAP) of the labelling space provided by the image data. 22 Energy maximisation problems are at the heart of the MRF MAP specifications. In addition to the combinatorial nature of the maximisation problem, the nonconvexity of the energy function and the presence of several local minima in the image’s solution space make it difficult to achieve a global maximum. The innovative Hidden Markov Random Field (HMRF) method was developed as a spinoff of the Hidden Markov Model, 23 a Markov chain-based algorithm. As a graphical probability prototype, HMRF does not directly discover the proper states but rather estimates them via a network of observations.
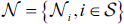
An observable random field is present in HMRF models,

Which seeks to deduce an underlying stochastic field


If the following Markovian condition is true, then the label field 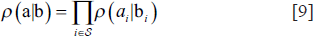


MRF’s Equation 

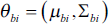
Assuming 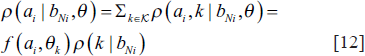
Measurement of the HMRF using the EM algorithm:

A Gibbs distribution may be thought of as an alternative way to describe an MRF:


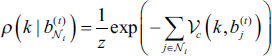
In Equation [12], the prior probability 

To summarise the HMRF-EM method in a nutshell:
Step 1: Initialise parameter set.
Step 2: The second stage entails determining the probability distribution.
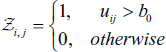
Step 3: Using 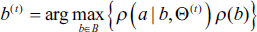

Step 4: The posterior probability distribution is calculated 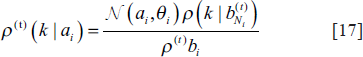


Step 5: Parameters of the Gaussian distribution are modified by
An initial segmentation is created in the HMRF method for image segmentation by applying a Level set based on the grey-level values of pixels. Significantly fewer iterations are required to produce final labels using this method compared to the MRF-MAP method, demonstrating the importance of this procedure.
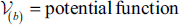
The suggested technique uses the energy functions created for the integration of Clustering based Level-set and MRF to establish the first segmentation of pictures. The standard Potts model presents the regional prior energy function, often known as the potential function, as,


As an added complication, the posterior energy function requires modelling the image’s probability density function.
NT thickness measurement
In the first three months of pregnancy, the NT thickness is a key diagnostic indicator. While NT thickness is relatively insensitive, this is not the case. 18 Fluid accumulates in the nuchal region of the foetus, hence the NT size is much more susceptible to the deposition than that of the NT thickness. The suggested method may also be used to calculate the size of the NT. To successfully extract the NT contour from the ultrasound picture, the suggested method is used. Because of this, calculating the parameters is straightforward and achievable. Before we can measure the NT thickness, we need to locate its limits. We offer the following approach to calculating the NT’s margins inside the chosen ROI. Take into account a ROI with N × M dimensions. The NT region is measured by the number of pixels that fall inside the NT boundary. Edge detection is used on this ROI to identify the ceiling and floor. The objective of the thickness evaluation is to provide a good estimate for the largest possible separation of the two boundaries identified.
Experiment
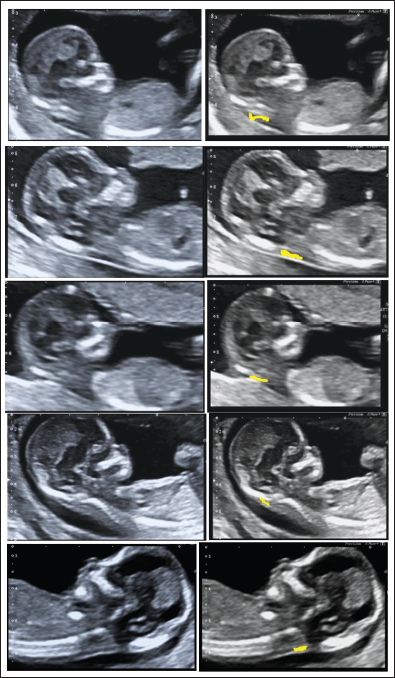
The proposed research work data collection includes 200 ultrasound images from the first trimester of pregnancy. Dataset is collected from women of the age group 25–40. A section of the NT was annotated by specialists. The discovered NT edges are shown by the yellow marker in (Figure 2).
Input Image and NT Detected Image.
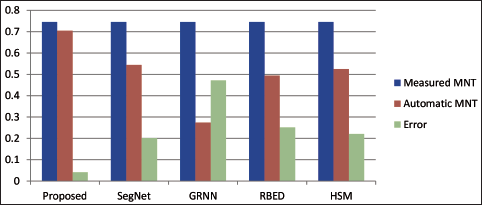
The error between Measured and Automatic NT thickness measurements (Maximum) is shown in Table 2.
Error Between Measured and Automatic NT Thickness Measurements (Maximum).11,17-19
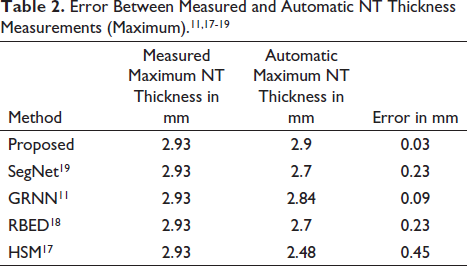
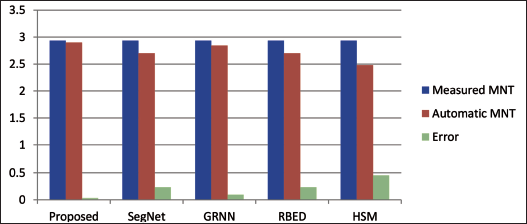
Figure 3 shows that the suggested approach has a smaller margin of error relative to manual measurement than the other methods.
Comparison of Maximum NT Thickness.
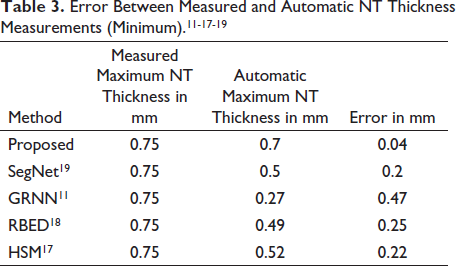
The error between Measured and Automatic NT thickness measurements (Minimum) is shown in Table 3.
Error Between Measured and Automatic NT Thickness Measurements (Minimum).11-17-19
The minimal thickness of segmented NT is shown in Figure 4. The above Figure 4 shows that the suggested approach has a smaller margin of error relative to manual measurement than the other methods.
Comparison of Minimum NT Thickness.
Conclusion
Transabdominal or transvaginal ultrasonography is used to determine NT thickness in the sagittal region of foetuses. Nowadays, clinicians are typically in charge of measuring the NT thickness. This necessitates highly competent operators and results in data unpredictability. There has only been a small investigation on an automated computerised assessment of foetal NT. The proposed research work developed a prototype for an automated NT thickness measuring system. This study proposes an MRF-based model for conceptually segmenting the NT area from foetal pictures and offering a quick and inexpensive diagnostic during the early phases of pregnancy.
Future Scope
As the proposed method is computationally complex the automated determination of the appropriate number of states for the above model, or the number of area clusters produced by the image segmentation process, is one of their main limitations. So in the future researcher can upgrade this using deep learning methods. As well as foetal picture size and angle departure from the mid-sagittal plane have an impact on the NT measures; so the researcher has to take care of it.
Footnotes
Acknowledgments
This work would not have been possible without the contributions of other researchers in the area. I am grateful to each and every one of them, especially to Apex Diagnostic Centre, Pune, for supplying a database and valuable advice, and to the gynaecologist, obstetrician, and infertility expert Dr Sonali Chaudhari for her support.
Declaration of Conflicting Interests
The authors declared no potential conflicts of interest with respect to the research, authorship and/or publication of this article.
Funding
The authors received no financial support for the research, authorship and/or publication of this article.