
Abstract
This article traces income and employment changes through various phases of the lockdown based on primary data. It analyses the coping strategies of people in response to fall in their income. The article reveals that there was a large drop in income and employment with the announcement of lockdown. While there is some recovery with easing of the lockdown, the income at the time of survey is still substantially lower than its pre-lockdown level. Casual labour households with the largest fall in income and employment are the most affected. Income and employment losses are also higher among Scheduled Caste (SC) and Other Backward Caste (OBC) households. In the absence of any income, the households either had to live off their savings or had to borrow money for their basic needs. With rapidly depleting savings, borrowing approached its limits, and with slow recovery of income, households may need substantial government assistance to save them from deprivation.
Introduction
COVID-19 has caused the biggest health emergency of recent history with drastic economic consequences. In the absence of a cure or vaccine, the governments have adopted the policies of lockdowns (also called shelter-in-place policy), large-scale testing with contact tracing and isolation and voluntary social distancing to forestall its spread. The countries vary significantly in terms of importance given to the three policies. While some countries like South Korea mostly relied on large-scale testing and contact tracing (see Cheong, 2020 for initial response of South Korea), other countries like India had imposed stringent restrictions on economic activities and movement of people (see Hale et al., 2020a). Yet a few countries like Sweden trusted people to voluntarily follow social distancing and take necessary precautions (Swain, 2020). Jain and Singh (2020), based on the analysis of initial trends, found large-scale testing to be more effective in containment of infections and lowering the death rate.
Among these policies, lockdowns have the most severe economic implication. Countries were already looking at contraction of economic activity due to the fear of COVID-19 (Gopinath, 2020a), while the lockdowns further aggravated the problem, leading to large-scale income and employment losses (Coibion et al., 2020; Fairlie et al., 2020; Gopinath, 2020b; Rojas et al., 2020). Even the developed economies are finding it difficult to withstand the economic effect of COVID-19. The USA has recorded the highest levels of unemployment since the great depression (Coibion et al., 2020; Fairlie et al., 2020; Rojas et al., 2020) with disproportionate effect across industries and communities (Borjas & Cassidy, 2020; Fairlie et al., 2020; Montenovo et al., 2020). The studies expect a significant share of worker lay-offs in the USA to be permanent (Barrero et al., 2020). International Monetary Fund’s (IMF) June 2020 update on world economic outlook predicted the global economy to contract by 4.9 per cent in 2020 (IMF, 2020a). Emerging economies with fast growth are also expected to have negative growth rate.
Most of the counties responded to the crisis by instituting relief plans for individuals and businesses (IMF, 2020b provides information on policy responses of 196 countries to COVID-19). These relief packages include unemployment benefits, pay-check protection programme, child benefits, food supply to vulnerable sections, tax relief to individuals and businesses, loan and guarantees, additional funds for health infrastructure and subsidies to prevent job losses. Relief measures taken by developed countries generally exceed 10 per cent of their gross domestic product (GDP) with some countries announcing a package of more than 20 per cent of their GDP. Developed countries, through these relief measures, could substantially lower (or even reverse) the sufferings caused by income and employment losses. Han et al. (2020) found that the support provided by the US government under the Coronavirus Aid, Relief, and Economic Security (CARES) Act and other stimulus packages led to fall in poverty during the lockdown. The well-established social security system in the developed countries facilitated delivery of timely assistance during the lockdown.
In comparison, the lockdowns inflicted unbearable pain on people in the developing countries (Ray & Subramanian, 2020). India is one of the countries where a large section of people had to endure unimaginable sufferings due to the lockdown (Centre for Equity Studies, Delhi Research Group & Karwan-e-Mohabbat, 2020). The reports of migrant workers walking hundreds of kilometres to their home or their struggle to meet their basic needs evince the acuteness of the economic and human crisis (Nayar, 2020).
The lockdown has resulted in significant fall in income and employment throughout India. Bertrand et al. (2020) found a worsening of income and employment situation in India. The unemployment rate in India increased to 25.5 per cent by 5 May. Nearly 83 per cent of the households reported income loss in the month of April (the survey was conducted by Centre for Monitoring Indian Economy between 18 April and 30 April). Starvation seemed like a real possibility to a significant share of the population, as 34 per cent reported that they cannot survive more than a week on their existing savings and food stock. Low-income households residing in urban areas were the worst affected by the lockdown.
Afridi et al. (2020a, 2020b) made a similar observation from their survey conducted in two phases (between 25 March 2020 and 3 May 2020) in Delhi. Nearly 90 per cent of the workers could not work between 25 March 2020 and 3 May 2020. More than 80 per cent of the workers received no income from their main occupation. The average daily income of the workers fell by 77 per cent during the lockdown. Even though the distribution of food by the government could avert hunger and deprivation among people, 40 per cent of the surveyed households reported deficient supply of food. Income loss and scarcity of food were also reported in Lee et al. (2020). The study examined the situation after 7 weeks of lockdown in Delhi. The income of the households declined by 77.5 per cent by the seventh week with 89.2 per cent reporting zero earnings. Nearly half of the respondents reported insufficient supply of food. A total of 75 per cent of the households had exhausted their savings by the time of survey and required assistance to survive.
The brunt of COVID-19 outbreak and lockdown was unequally shared by the various sections, owing to the disproportionate impact of lockdown and COVID-19 outbreak across industries and occupations (see Bartik, Bertrand, Cullen, et al., 2020; Bartik, Bertrand, Lin, et al., 2020; Borjas & Cassidy, 2020; Fairlie et al., 2020; Montenovo et al., 2020). People employed in the non-essential sectors, especially those who could not work from home, were the worst affected. Deshpande (2020), using data from Centre for Monitoring Indian Economy (CMIE), observed that women working in the pre-lockdown period in India were 23.5 per cent less likely to be employed in April 2020 compared to their male counterparts. The loss of employment was higher among Dalits and other vulnerable sections. Centre for Equity Studies, Delhi Research Group and Karwan-e-Mohabbat (2020) found that the vulnerable sections like single mothers, Dalits and religious minorities had lower access to ration during the lockdown.
The large-scale employment losses left workers vulnerable with bleak hopes for future. There is a fear among researchers and different organizations that the hard-gained progress in poverty reduction may be lost to the crisis. Sumner et al. (2020) estimated that with 20 per cent contraction in economic activity, the number of poor globally may increase by 420–580 million. As per International Labour Organization (2020), about 400 million workers in India are at the risk of being pushed into poverty due to slowdown caused by lockdown and COVID-19 shock. Most of these estimates are based on an extreme scenario; the size of population that will actually fall into poverty largely depends on the loss during the lockdown and the extent of recovery after easing of the restrictions. The existing studies have provided some insights into the loss during the first and the second phases of the lockdown in India (between 25 March 2020 and 3 May 2020). However, we still do not have estimates of the losses in the later phases. There is also a lack of understanding of the coping strategies of the people and their future expectations.
The situation in smaller cities remains unexplored as well in the studies. The existing studies have either focused on large cities like Delhi or clubbed urban areas together for the analysis. The evidences in these studies suggest that urban areas have suffered higher employment losses during the lockdown than rural areas (Deshpande, 2020). Nonetheless, small cities, which often lack large-scale industry and have different economic and social dynamics than bigger cities, may have different experiences and vulnerabilities. Given that small cities have stronger linkage with rural areas and often act as a link between rural areas and bigger cities, their employment and income loss may fall somewhere between rural areas and large urban areas.
There are also dearth of studies that have examined income and employment situation in Punjab. Singh and Kumar (2020) provide some insight into the spread of COVID-19 and policy responses in Punjab till 10 May 2020. The study, based on newspaper reports, found severe negative impact on businesses and the government revenue due to lockdown and fear of COVID-19. Bertrand et al. (2020) reported that 70–80 per cent households in Punjab experienced income decline in April 2020. However, these studies have not analysed income and employment changes during the lockdown in Punjab.
The present study sheds light on some of these missing aspects, using data from a primary survey conducted in the city of Mansa in Indian Punjab. It examines income and employment implications of fear of COVID-19 and the policy of lockdown. It also analyses the coping strategies of the people to withstand income shock.
The article is divided into seven sections. After the introduction, Section II of this article analyses timeline of the lockdown and its stringency level. Section III discusses the sampling and data collection. Section IV provides a brief understanding of basic characteristics of the surveyed households. Section V traces income and employment losses and recovery trends across occupations and social groups until the mid of June. Section VI captures the capacity of people to withstand the income shock and their survival strategies. The final section concludes the study.
Chronology of the Lockdown
The Indian government started taking note of the COVID-19 outbreak by the end of January 2020. Hale et al. (2020b) calculated the government’s response stringency index, using nine policy responses (Figure 1). India had stringency index of 10.19 on 26 January 2020 (the higher value of index denotes more stringent response with 100 being the strictest). To put into perspective, this index value was more than many early affected countries like South Korea and Italy, which had stringency index of 0 and 2.78, respectively. While the stringency index of South Korea and Italy increased in February 2020, India’s response did not change until 4 March 2020. On 3 March 2020, South Korea and Italy’s stringency index increased to 55.56 and 69.91, respectively, compared to 10.19 of India. While the cautious approach of the Indian government was guided by a small number of infected population and high cost of restrictions, it caused India to lose precious time when the infection was easier to manage.
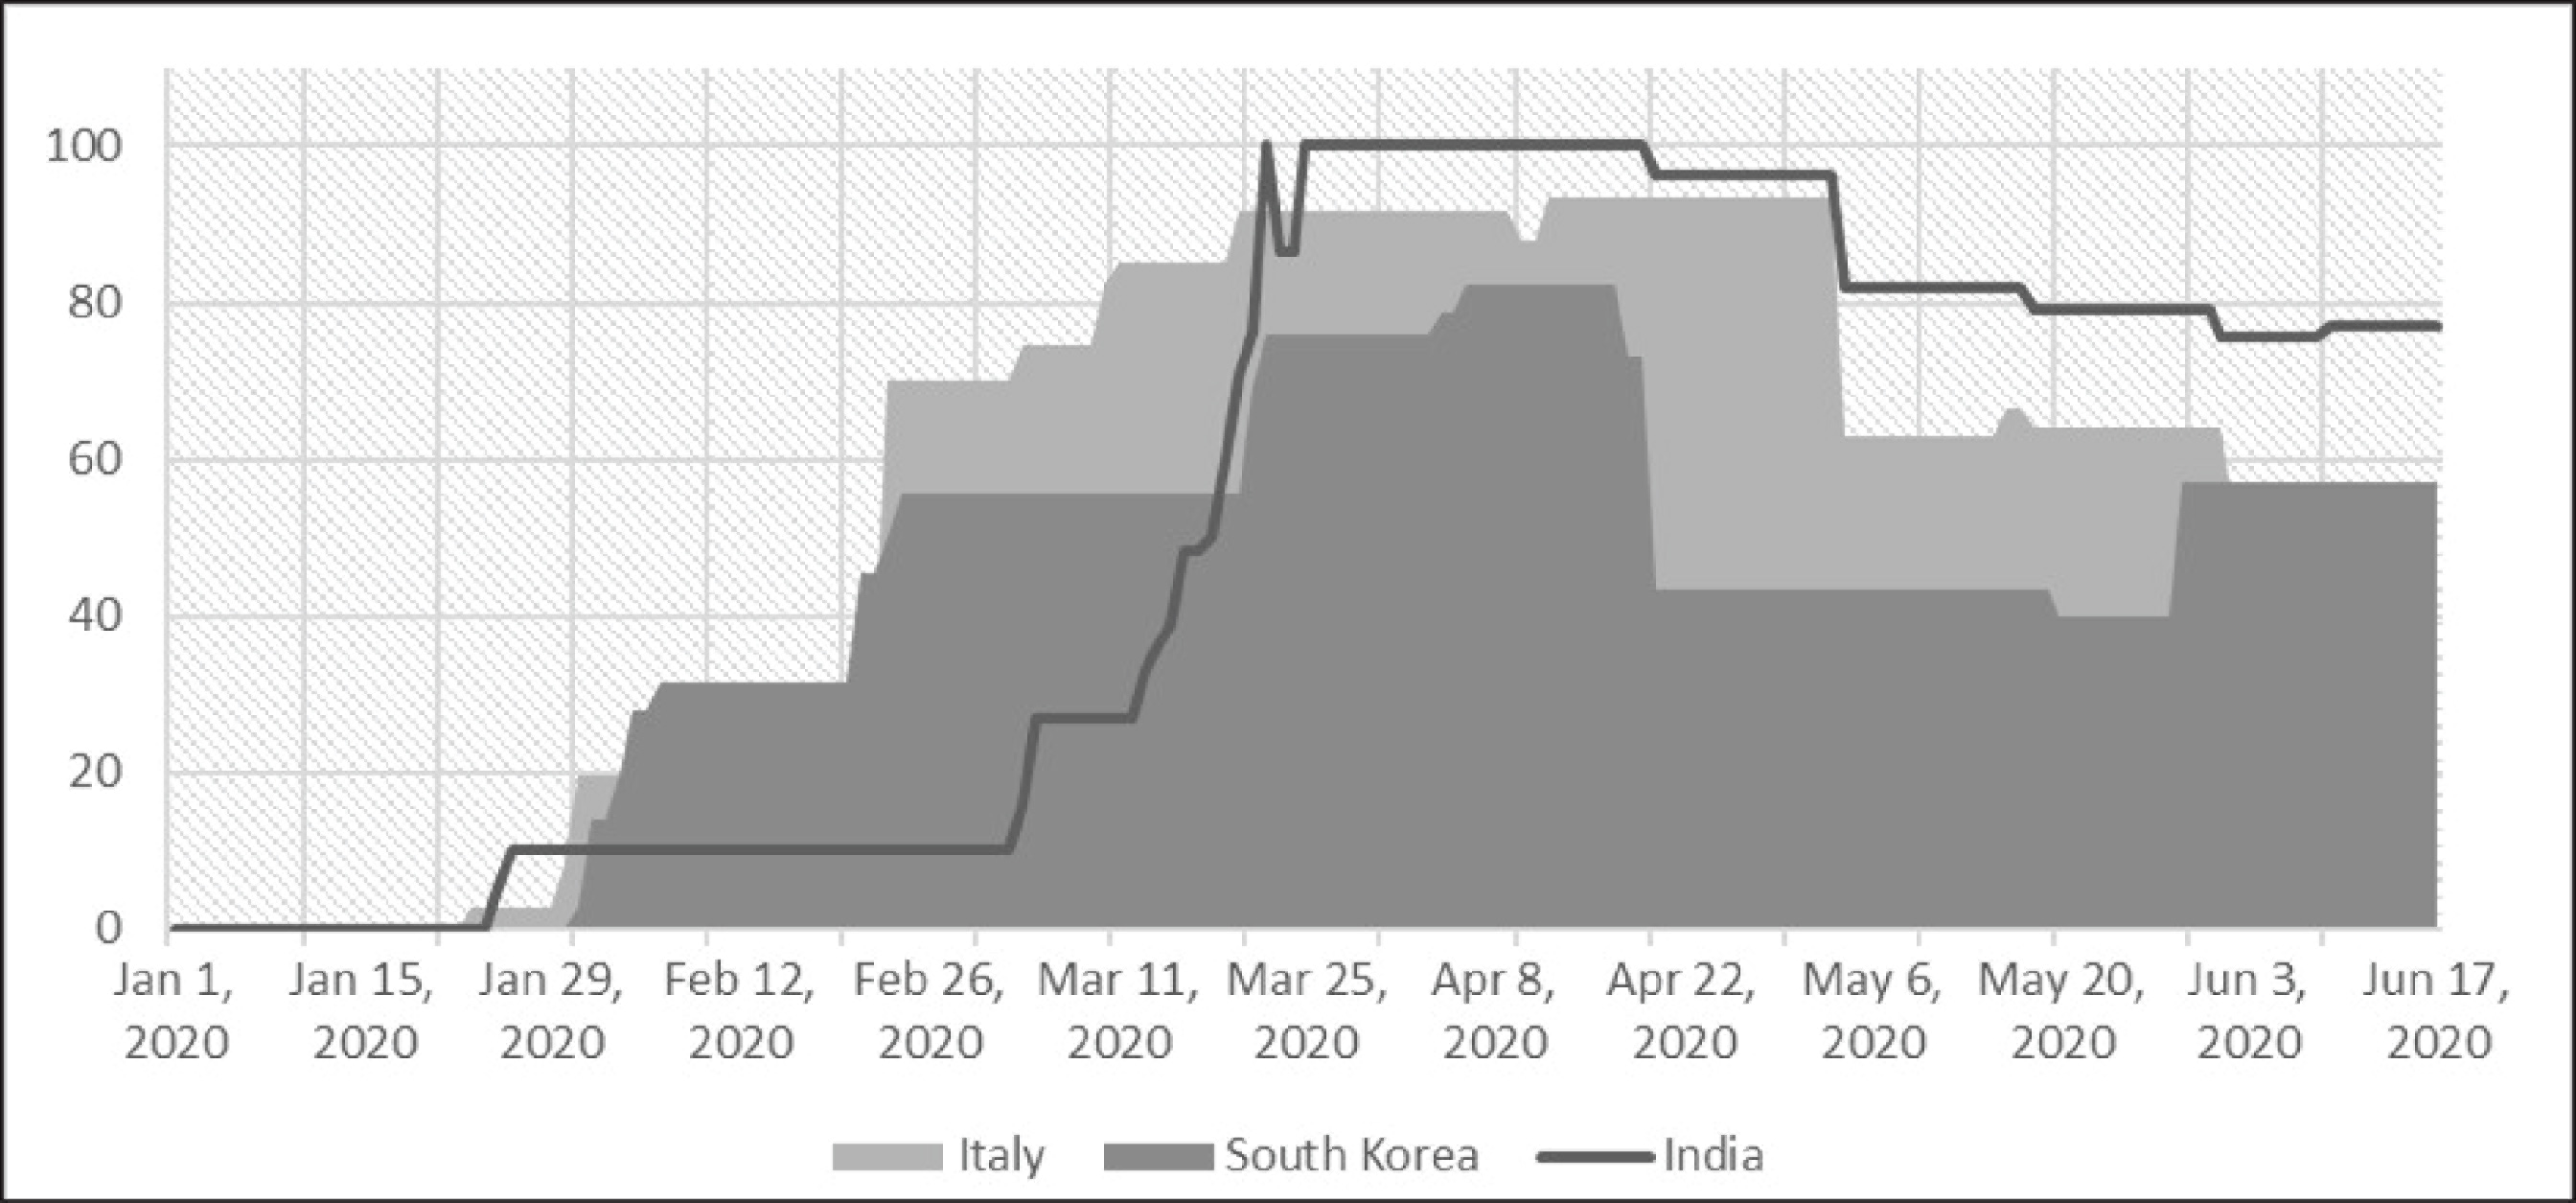
The index value for India rapidly soared up after 12 March 2020 from 26.85 to 100 by 22 March 2020 (day ‘Janta Curfew’ was announced). It was also the day when many state governments, including Punjab, started taking stringent measures to control the infection. Punjab imposed lockdown on 22 March 2020 and curfew from 24 March 2020 onwards restricting all movements, barring visits to the hospitals. All essential goods were delivered at home by the authorized businesses. The stringency index came down to 86.57 for 23 March and 24 March. On 24 March, the Indian government used the National Disaster Management Act, 2005, and the Epidemic Diseases Act, 1897, to enforce nationwide lockdown for 21 days. Only the essential economic activities such as sale of grocery items, vegetables and medicine were allowed. Banks and a few other important businesses were also allowed to function. Movement of people except for medical reasons was completely banned. With these restrictions, the stringency index again went up to 100 on 25 March 2020, where it stayed so for the next 25 days. Only 13 out of 160 countries, for which the data were collected by Hale et al. (2020b), had reached the stringency index of 100 until 17 June 2020.
On 14 April 2020, the lockdown was extended till 3 May 2020. Some relaxations were allowed to specified businesses on 19 April 2020. It led to a small reduction in the index value to 96.30 on 20 April 2020, which continued till 3 May 2020. Second set of relaxations were provided from 4 May 2020 onwards, and the stringency index further reduced to 81.94. The stringency index fell to 79.17 on 18 May and 75.46 on 1 June 2020 with further alleviation of restrictions.
Although the fall in stringency index was higher on 4 May 2020, the relaxations allowed on 18 May 2020 were perhaps more important for businesses. The state of Punjab was under curfew from 24 March 2020 to 17 May 2020. While majority of businesses were allowed to function, the movement of people was still restricted to a few hours. People used the relaxation hours to buy essential commodities. Due to the little time to purchase non-essential commodities and lack of clarity on government policy, many people postponed their purchases (these observations are based on the field survey). Police strictness in the initial days of lockdown, when many curfew violators were beaten up (see Singh & Kumar, 2020 for discussion on inital response to COVID-19 in Punjab), discouraged many to visit distant markets. Lifting of the curfew on 18 May 2020 solved many of these difficulties, making it easier to conduct business or visit markets. The index value witnessed a small increase to 76.85 on 9 June 2020. The stringency index remained the same till 17 June 2020, the last date to which the value was available (it is also the date till the information was collected in the primary survey). Since no major policy revision is expected until 30 June 2020, the index value is likely to stay at this level for the rest of the month.
Despite the stringent lockdown, the infection is increasing all over India. By the end of July 2020, the total confirmed cases had crossed 500,000 with about 200,000 active cases and more than 15,000 deaths (as per the data provided by the Ministry of Health and Family Welfare, Government of India). The growing number of COVID-19 cases is intensifying fear among people. The economic consequences of lockdown and fear of COVID-19, though yet to be known, are likely to be extensive.
The primary data for the study were collected from the city of Mansa in the Indian state of Punjab. A sample of 55 households were selected for the survey. The area to the north of the railway line in Mansa was selected. The whole area was further divided into 44 small parts of which 11 parts were randomly selected for the survey. From each of these parts, five households were randomly selected, and one of the earning members of the families was interviewed. The earning members were chosen for interview to minimize the error in income data. To avoid direct contact with the respondents, all interviews were conducted over phone. Telephonic interviews were also convenient because many earning members were only available in the evenings.
Basic Characteristics of the Surveyed Households and Working Members
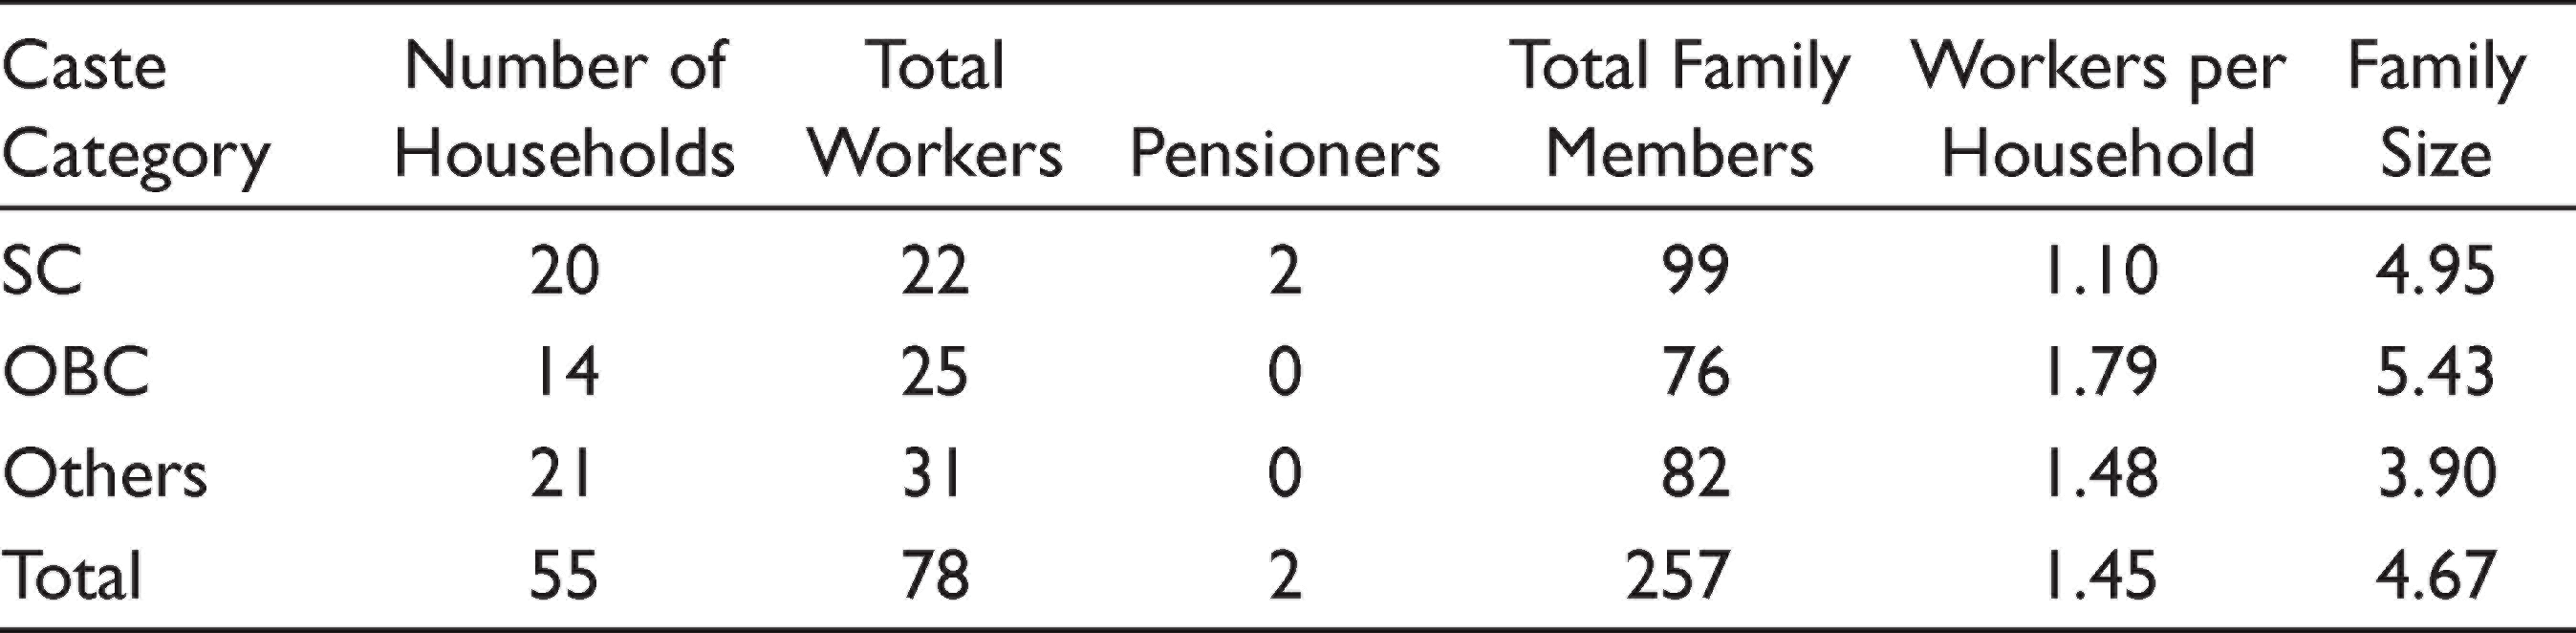
Among the surveyed households, 20 belonged to Scheduled Caste (SC) category, 14 were from Other Backward Caste (OBC) and 21 were from Other categories (Table 1). These households had 80 earning members, of which 78 were workers and 2 were pensioners. The number of working members per household was just 1.1 among SC households compared to 1.79 of OBC and 1.48 of Others. The average family size was larger for OBC households, followed by SC category and Others.
Demographic Features of the Surveyed Households
Demographic Features of the Surveyed Households
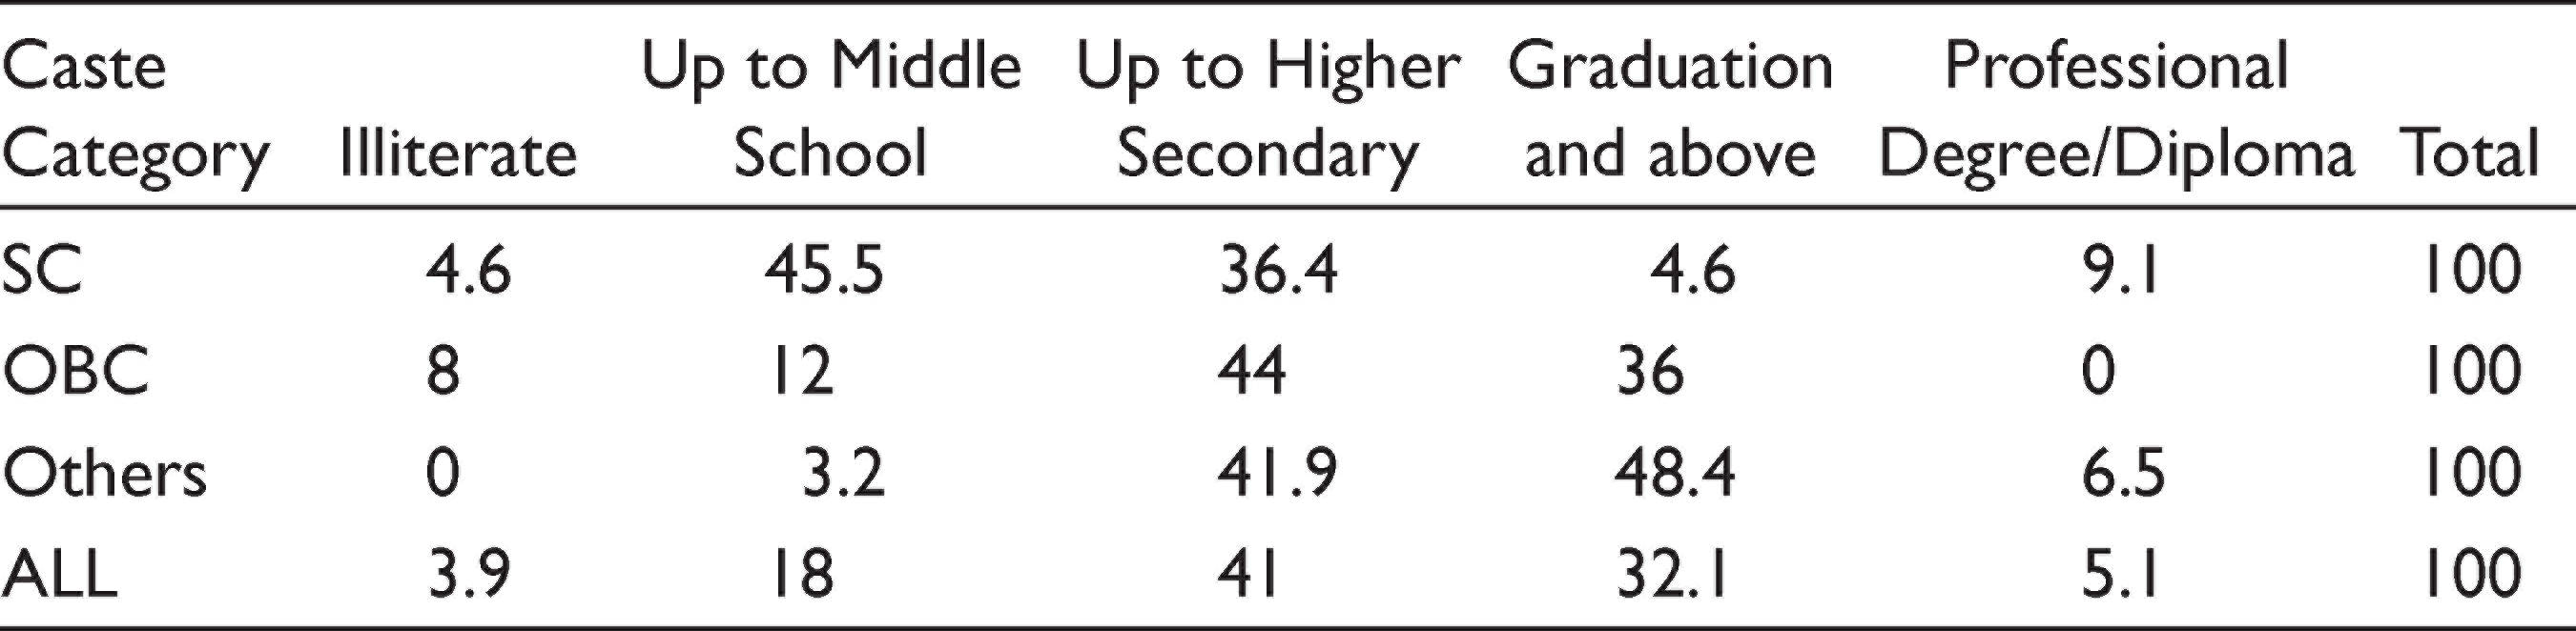
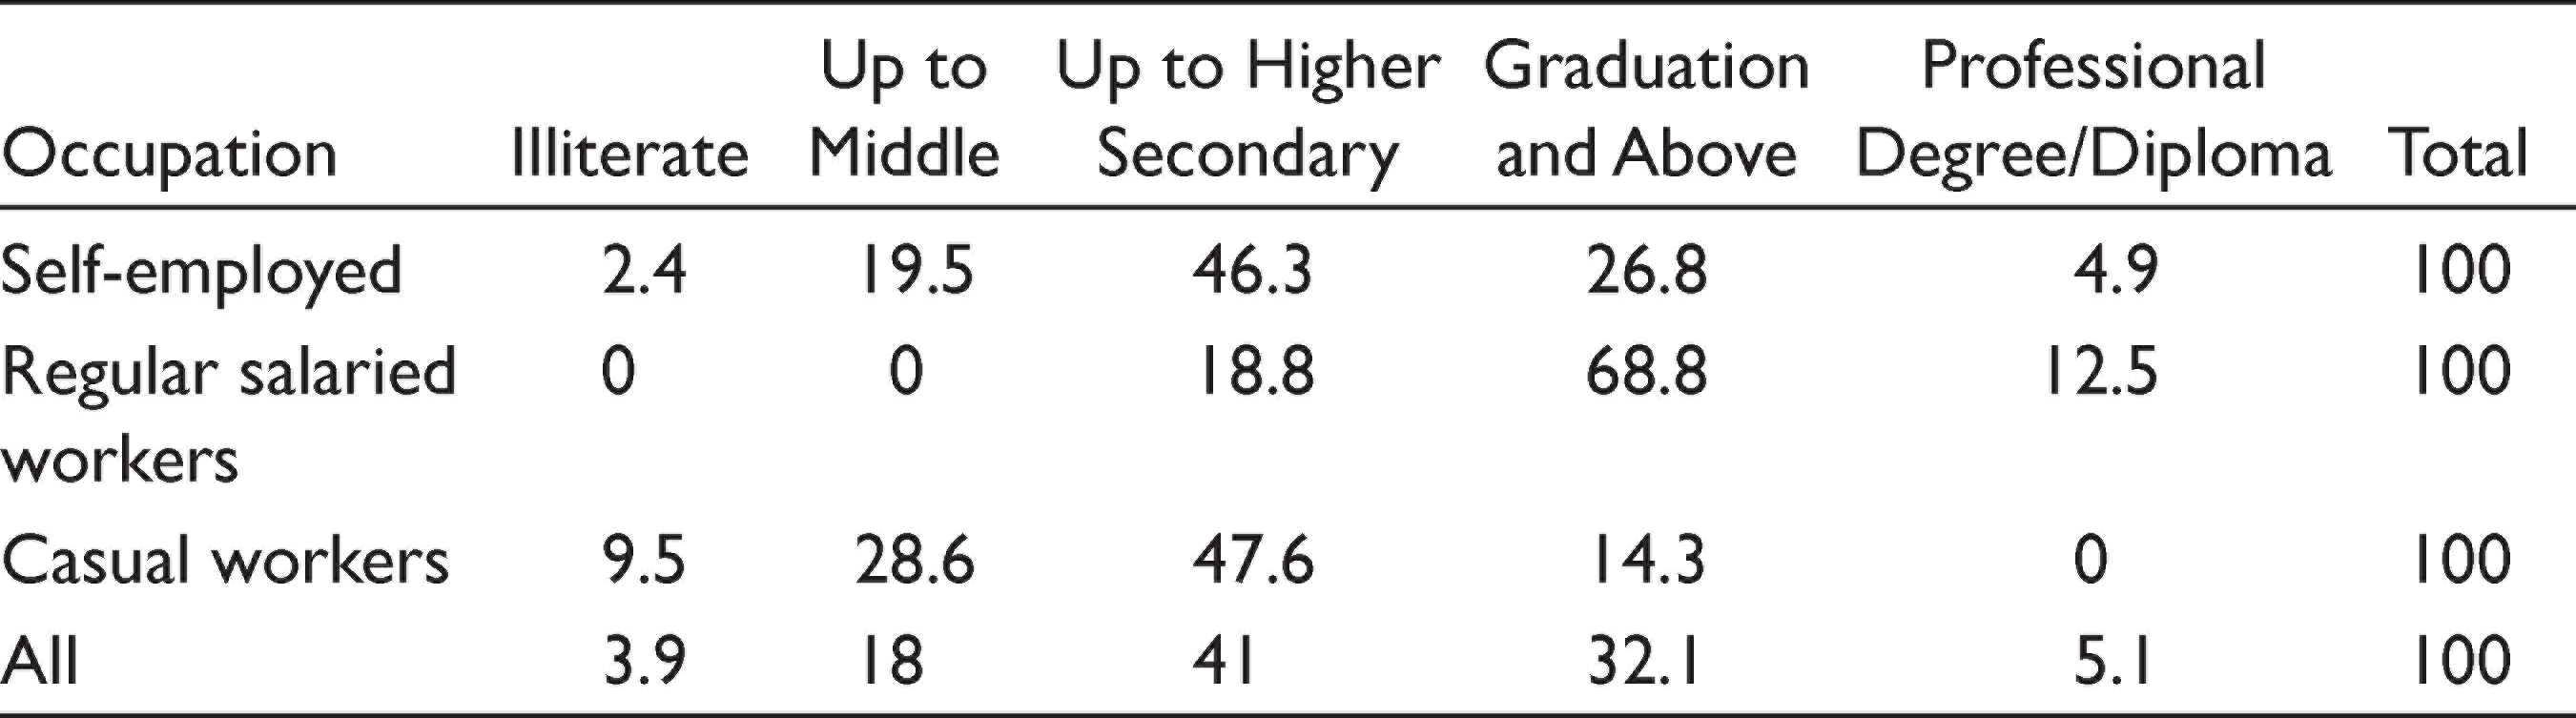
The educational attainments of the working members again put OBC and Others in better position compared to their SC counterparts (Table 2). Workers in Others category are the best placed with nearly 55 per cent of them are either college graduate or have a professional degree or diploma. Percentage of workers with similar levels of education among OBC and SC category are 36 per cent and 13.7 per cent, respectively. SC workers are the worst placed with half of them either illiterate or who have studied up to middle school (less than 8 years of schooling). Incongruously, SC workers also have the highest percentage of workers with professional degree or diploma (9.1%), and OBC workers have the highest percentage of illiterates.
Educational Attainments of Workers by Caste (%)
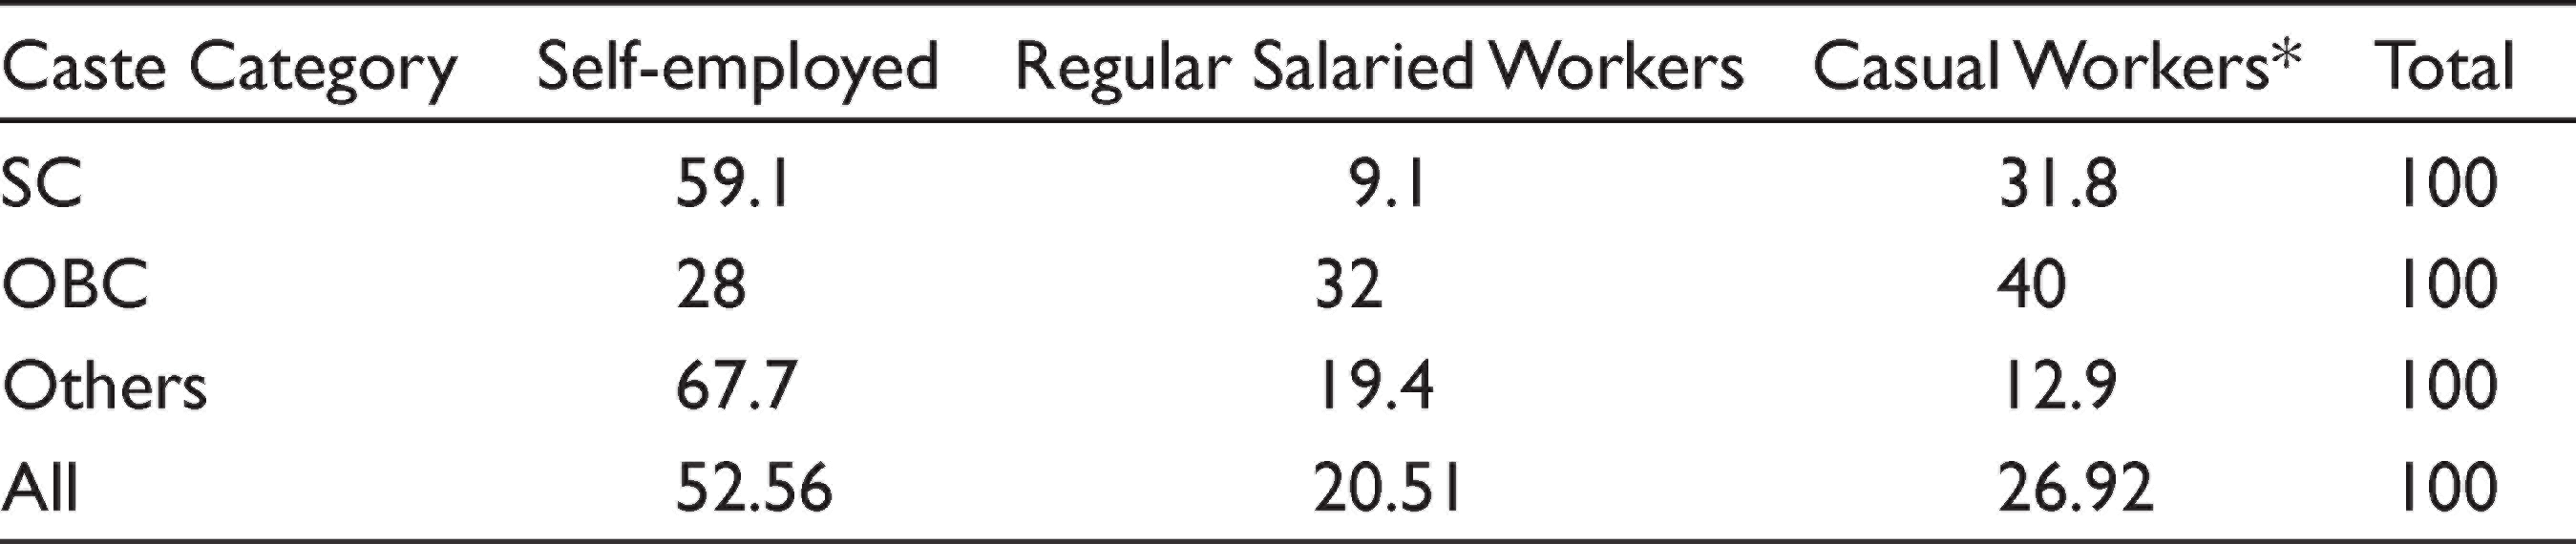
Distribution of workers by occupations and caste shows Others mostly concentrated in self-employed (67.7%) or regular salaried worker (19.4%) categories (Table 3). Though the largest share of SC workers is self-employed (59.1%) similar to Others, their substantial share (31.8%) is found to be casual workers (all casual workers are employed in non-agricultural sector). OBC workers have a different pattern than the rest of the categories. While the dominant share of workers in SC and Others categories is self-employed, OBC workers are more likely to be casual workers (40%) followed by regular salaried workers (32%).
Occupational Distribution of Workers by Caste (%)
As one may expect, less educated workers are mostly concentrated in casual labour, followed by self-employment (Table 4). All regular salaried workers have at least 10 years of schooling with more than 80 per cent having a college degree or diploma (including professional degree or diploma).
Educational Attainments of Workers by Nature of Occupation (%)
Smaller family size, more workers per family, better educational attainments and small share of workers in casual labour suggest that ‘Others’ category was better placed in terms of their capacity to endure an economic shock. SC households were in the worst position in this regard.
Both lockdown and the fear of COVID-19 have contributed to the fall in income and employment. Businesses like hotels, restaurants and poultry in Punjab had started experiencing slowdown in the beginning of March (Singh & Kumar, 2020). While we may theoretically make a distinction between loss due to COVID-19 and lockdown, it is difficult to empirically estimate it without a comprehensive data set.
An early estimate by Goolsbee and Syverson (2020) suggests that the fear of COVID-19 had bigger impact on consumer traffic than lockdown in the USA. However, these results cannot be directly applied to the studied area. The impact of COVID-19 is likely to vary across time and space. People in developing countries and rural areas may respond differently than those living in developed and urban areas. While this article traces the income and employment impact through different phases of lockdown, it does not attempt to estimate the possible impact that the fear COVID-19 may have had in the absence of lockdown. Separating the effect of COVID-19 from lockdown requires detailed analysis and is beyond the scope of this article. Nonetheless, the discussions with respondents do suggest that businesses were largely unaffected before the lockdown and the biggest fall in income and employment is likely to be caused by lockdown.
To compare the income and employment changes, the article divides the lockdown period into four phases. Phase I was from 22 March 2020 (when Punjab announced lockdown, and India’s stringency index reached 100) to 19 April 2020. India had stringency index of 100 during this period with the exception of 23 March 2020 and 24 March 2020. Since the Government of Punjab had gone for complete lockdown on 23 March 2020 and curfew on 24 March 2020, the stringency index for Mansa may be higher than the whole of India. Hence, these days are also considered under the first phase. Phase II started with some relaxation on 20 April 2020 and lasted till 3 May 2020 (see Section II for details). Phase III covers the period between 4 May 2020 and 17 May 2020. Phase IV includes all days from 18 May 2020 to 17 June 2020. Though the last phase saw change in stringency index on 1 June 2020 and 8 June 2020, these changes in terms of allowing new businesses to operate were relatively small and did not change anything significantly for the respondents. Therefore, the article considers the whole period as a single phase.
Employment Changes During Lockdown
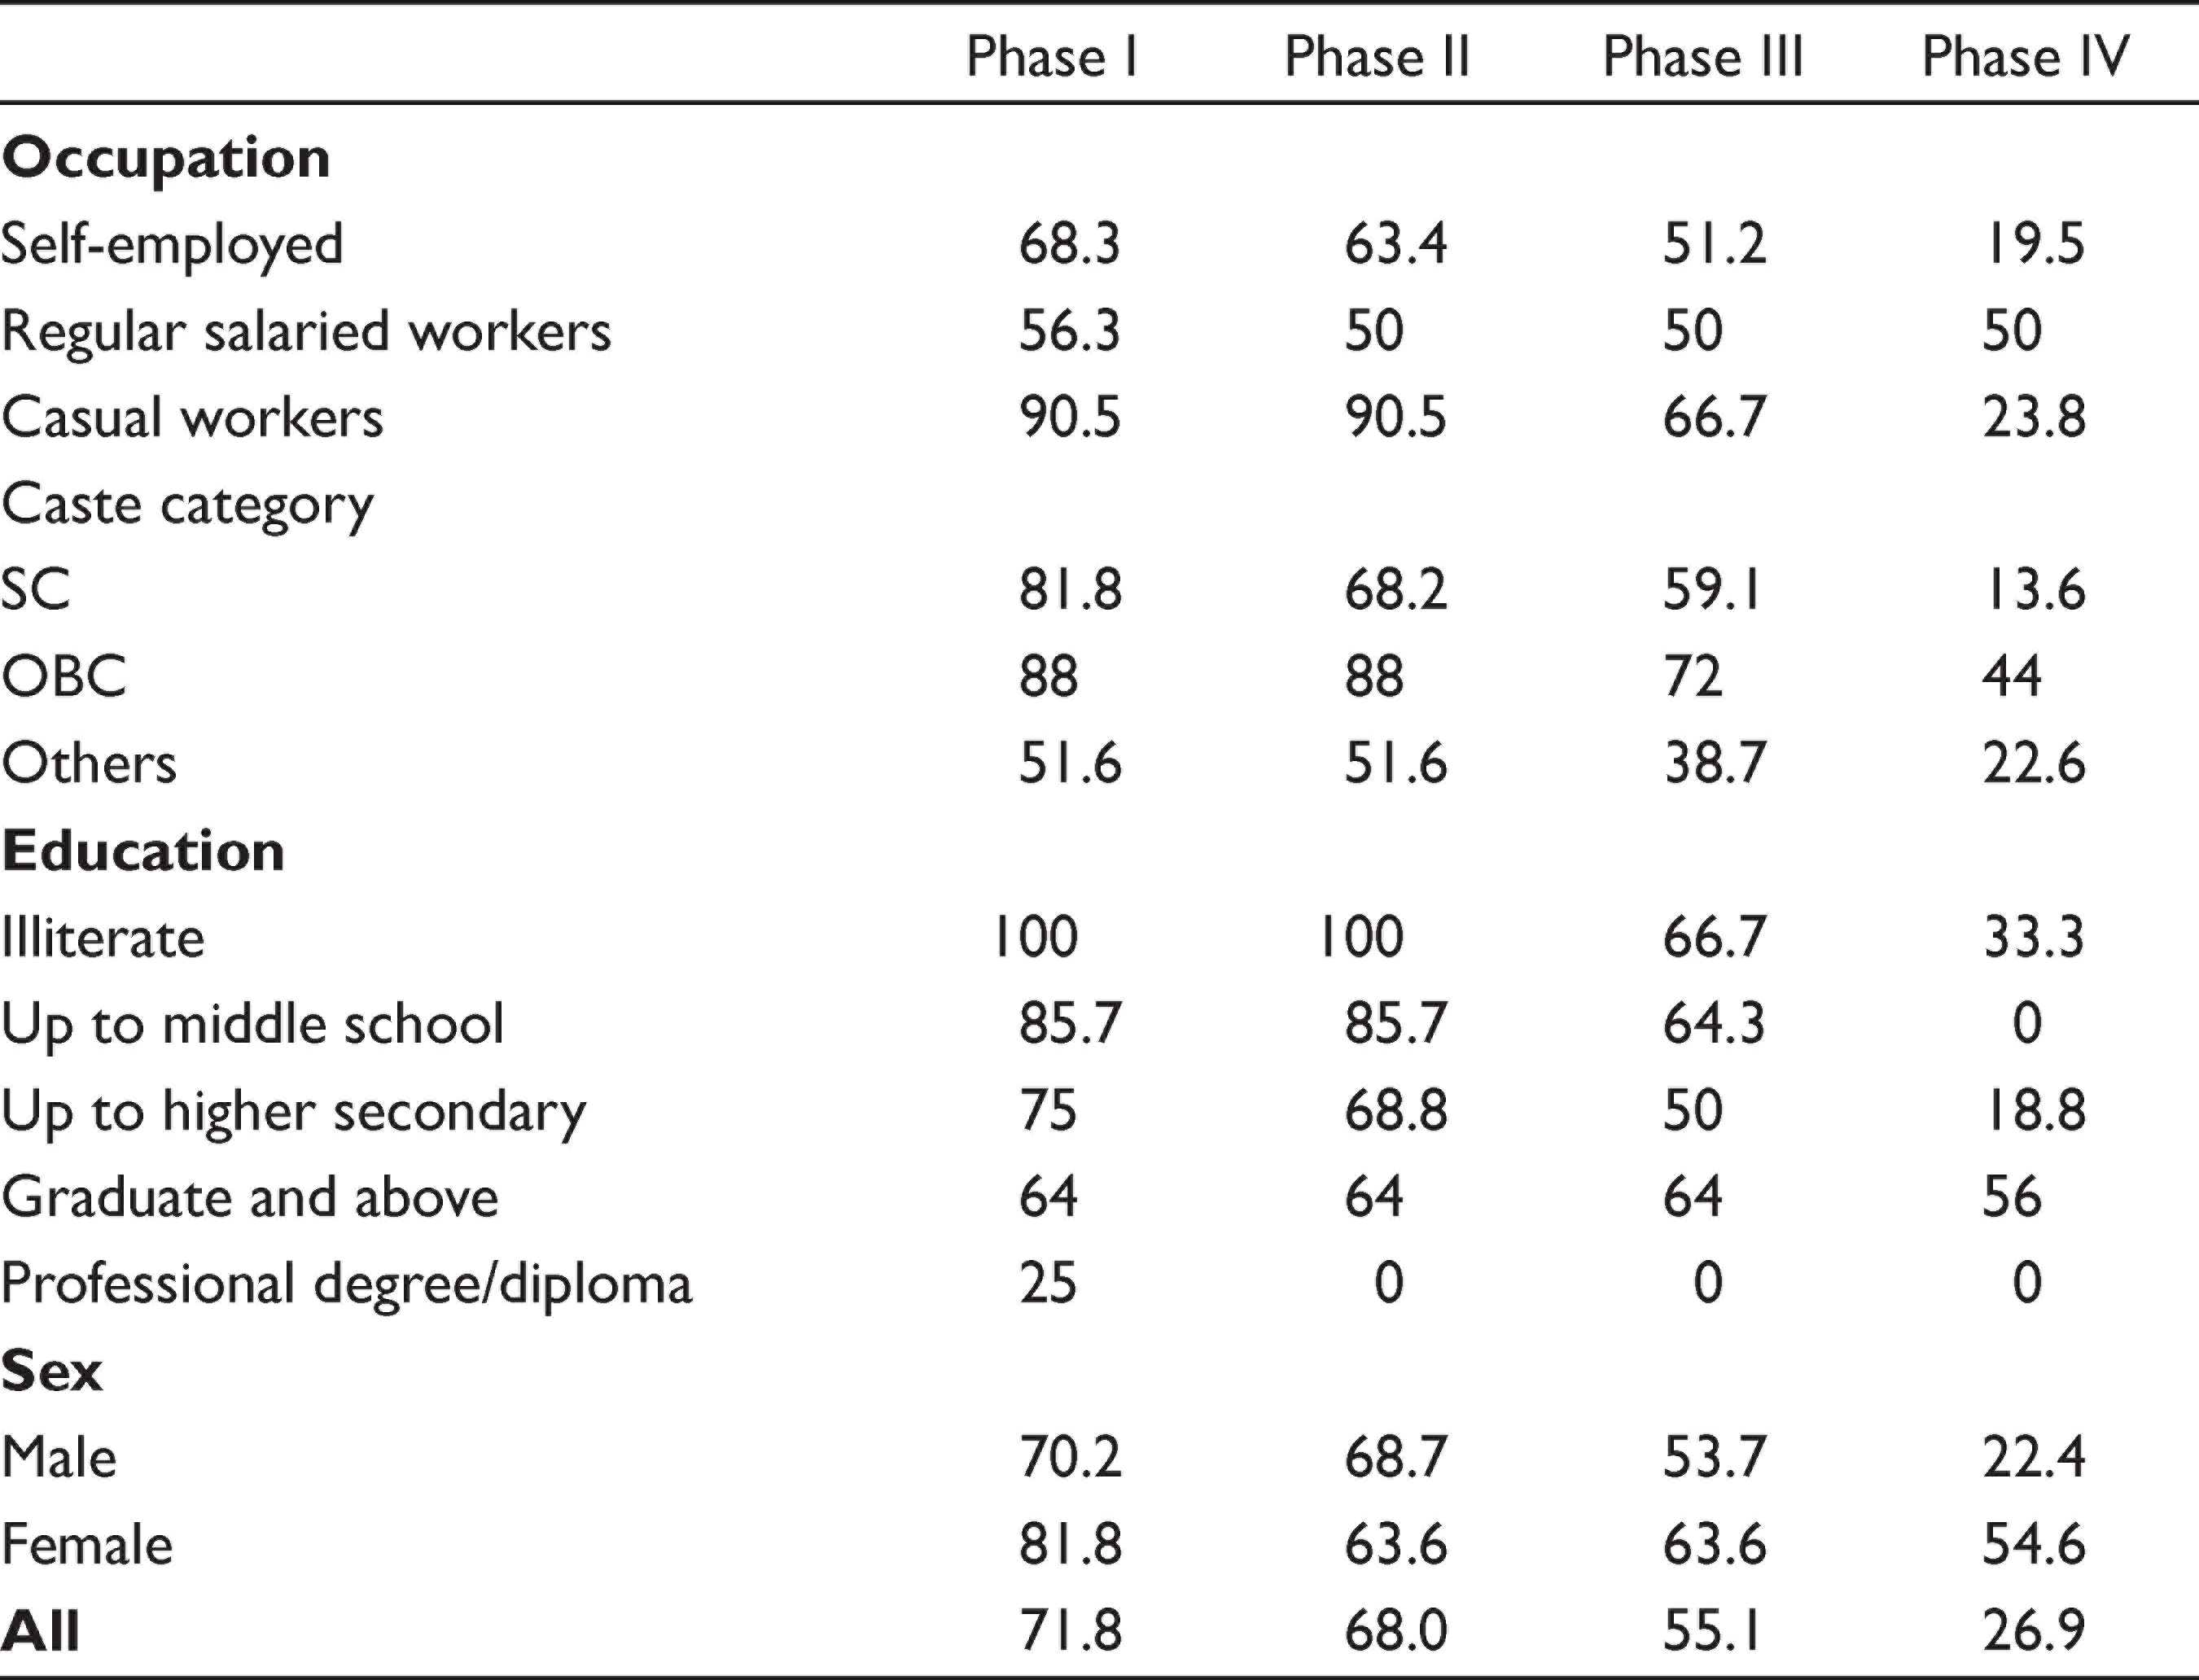
The lockdown was a sudden and unanticipated decision for most of the people. It led to a sudden fall in employment and income of the workers. Nearly 72 per cent of the workers went unemployed during phase I (Table 5). There was only a small improvement in the situation in phases II and III as the percentages of workers who could not work in these phases were 68 per cent and 55.1 per cent, respectively. Phase IV witnessed a major improvement in employment scenario with the share of unemployed workers dropping to 26.9 per cent.
Percentage of Workers Who Could Not Work During the Lockdown*
Percentage of Workers Who Could Not Work During the Lockdown*
Fall in employment was borne disproportionately across occupational and social categories. The loss of employment was particularly high for illiterate and less educated in the initial phases. Casual workers were hit hardest with more than 90 per cent being unable to find any work in phases I and II. However, their condition saw quick recovery with the percentage of casual workers not working, dropping to 66.7 per cent in phase III and 23.8 per cent in phase IV. Self-employed, which was the second worst category with 68.3 per cent and 63.4 per cent, respectively, of workers not being able to work in the first two phases, also saw a similar recovery in the last two phases.
While the regular salaried workers fared relatively better with 56.3 per cent not working in the first phase, the recovery for them seems to be slow. The percentage of regular salaried workers who could not find work continued to be 50 per cent in phases II–IV. The trend suggests that even though the regular salaried may be less affected in the initial phase, their unemployment may be long term compared to workers in other categories. A similar trend is observed for educational categories. Illiterate and less educated workers experienced the largest fall in employment in phases I and II. However, it was graduate and above category for which the loss had persisted throughout the lockdown with 56 per cent of them unable to find work even in phase IV. People with a professional degree or diploma were the least affected among all and recovered completely by phase II.
Caste-wise analysis shows OBC being the most affected by COVID-19 and lockdown with 88 per cent of them losing work in phase I. Though the percentage of OBC workers not finding work came down considerably by phase IV, it stayed much higher compared to SCs and Others. SCs, which was the second most affected category in the first three phases, showed remarkable recovery. By phase IV, it had the smallest share of workers (13.6%) without any work. A gender-wise comparison shows that men were relatively less affected by lockdown and recovered much faster than women. One must be cautious in interpreting the results, as some of the workers in well-off categories may not be trying hard enough to get work (even though they show willingness to work).
Income Changes during Lockdown
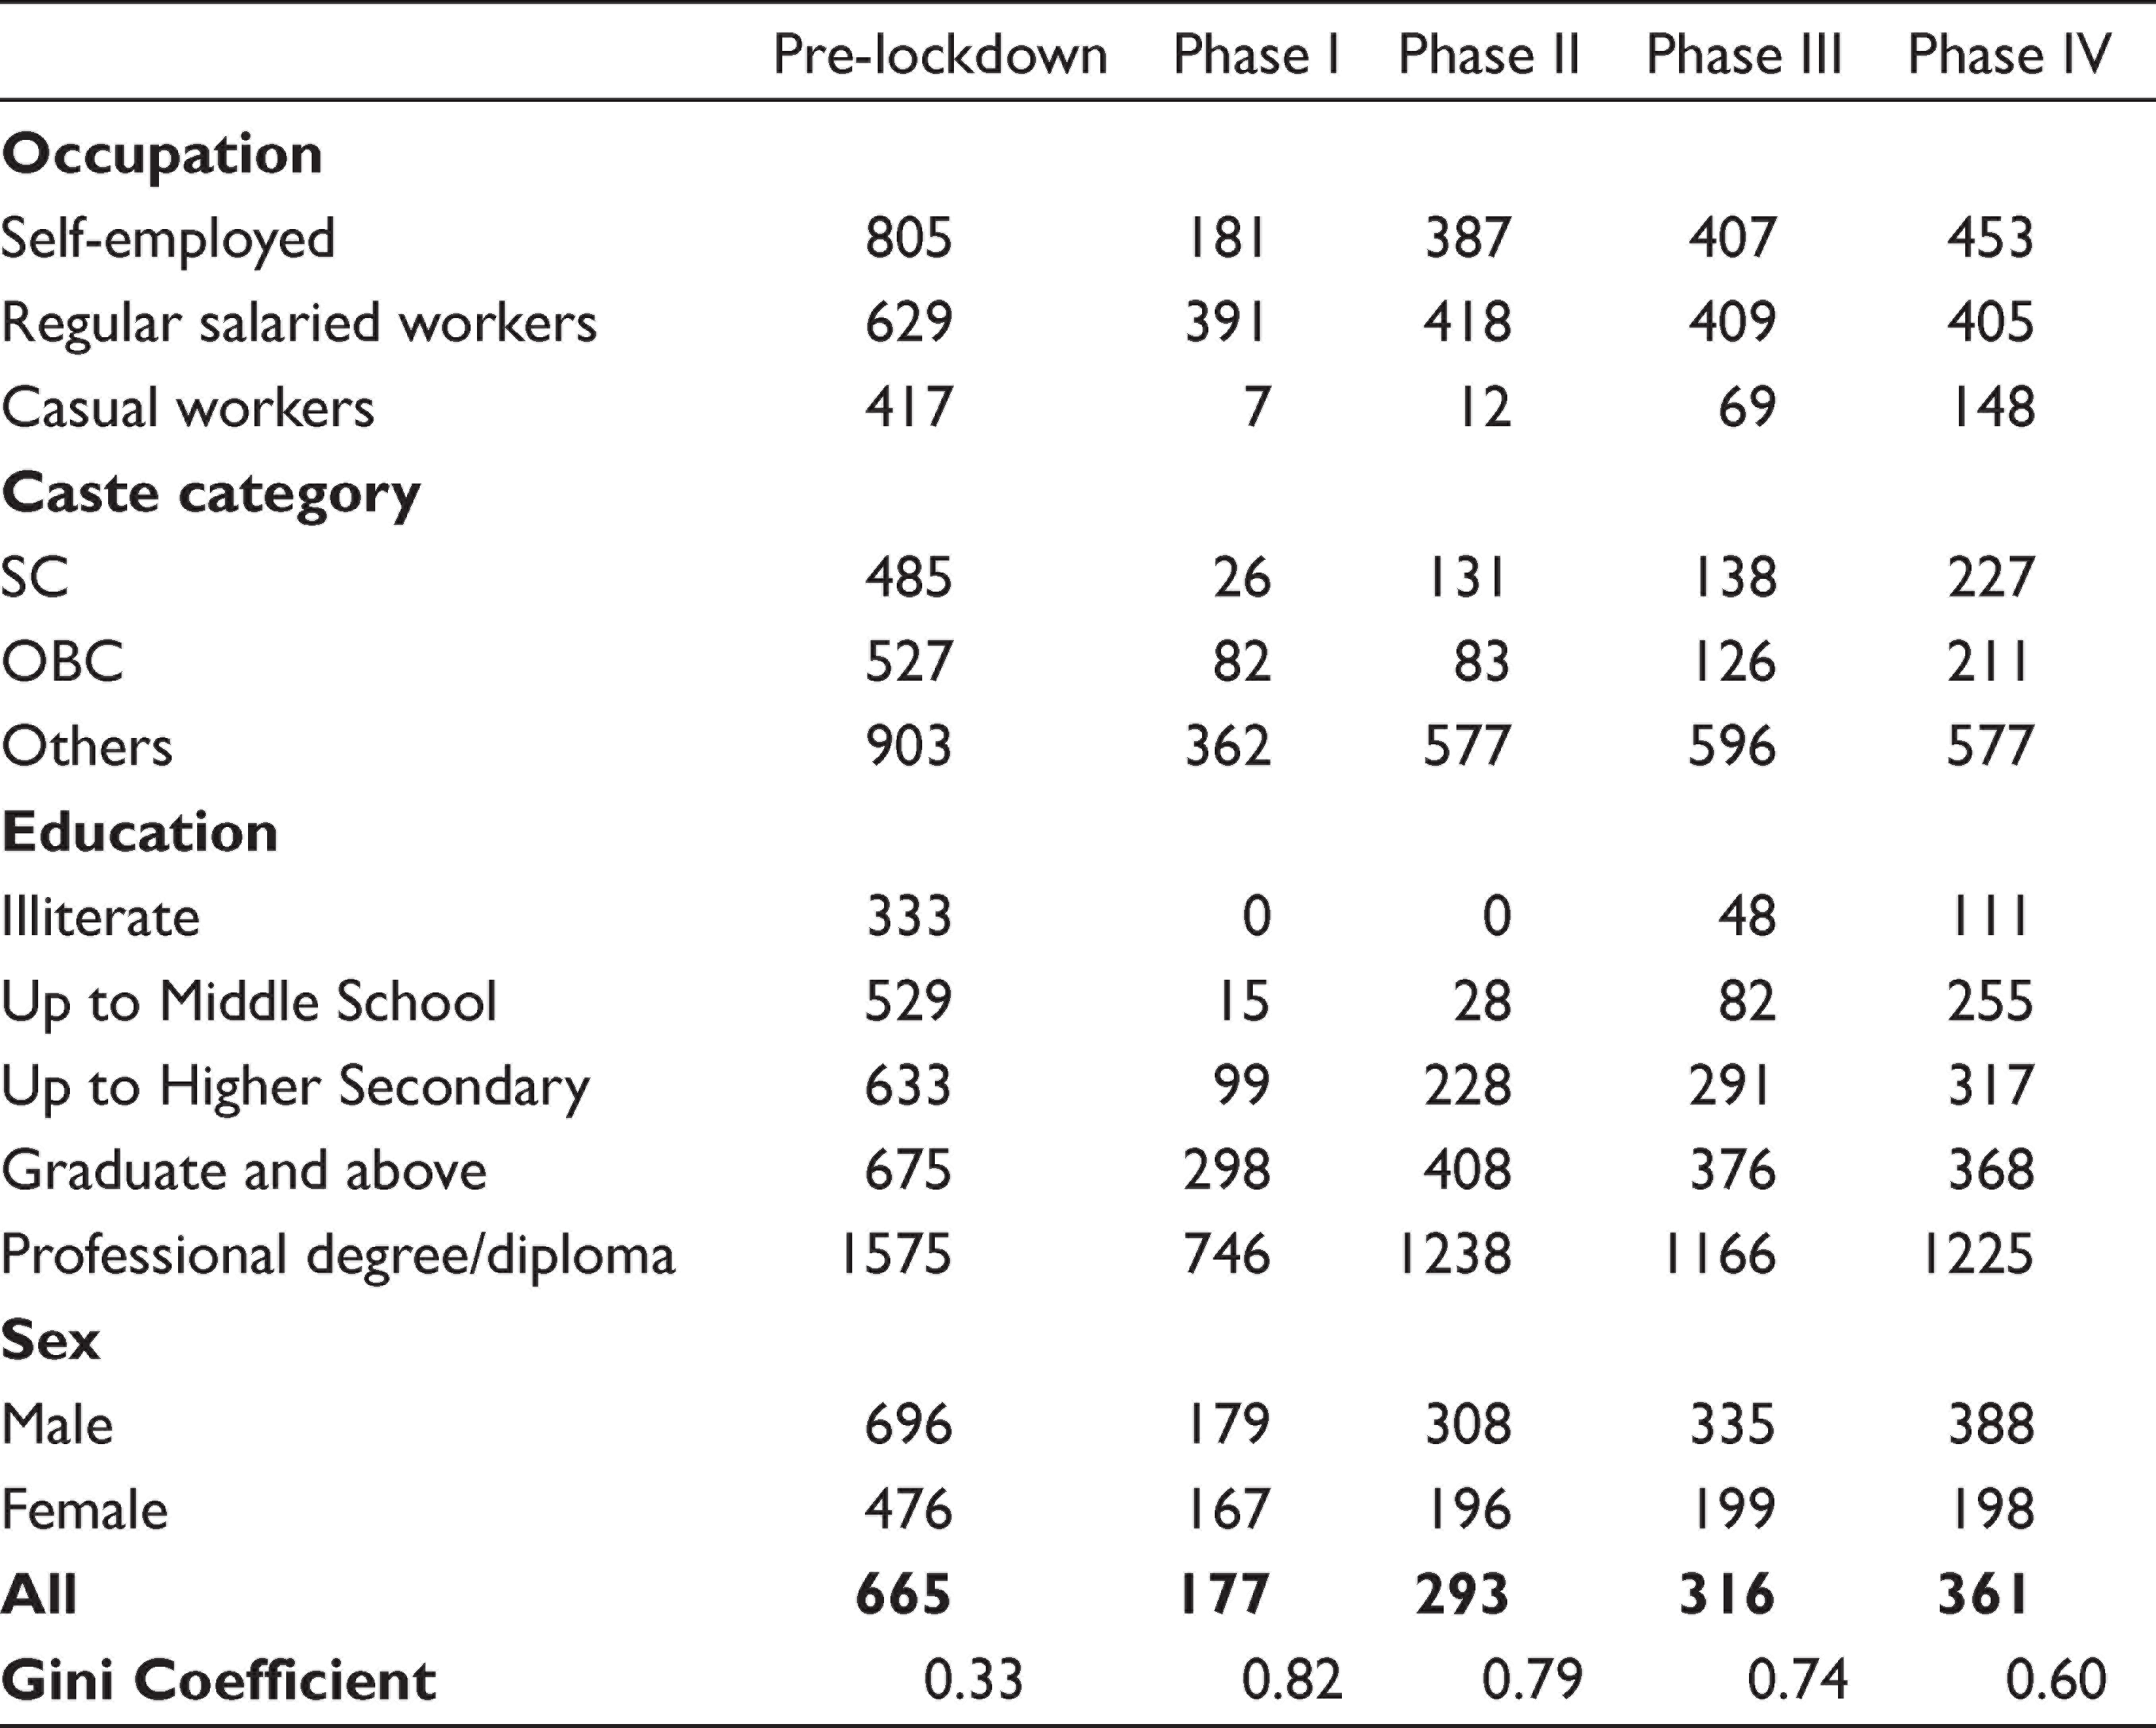
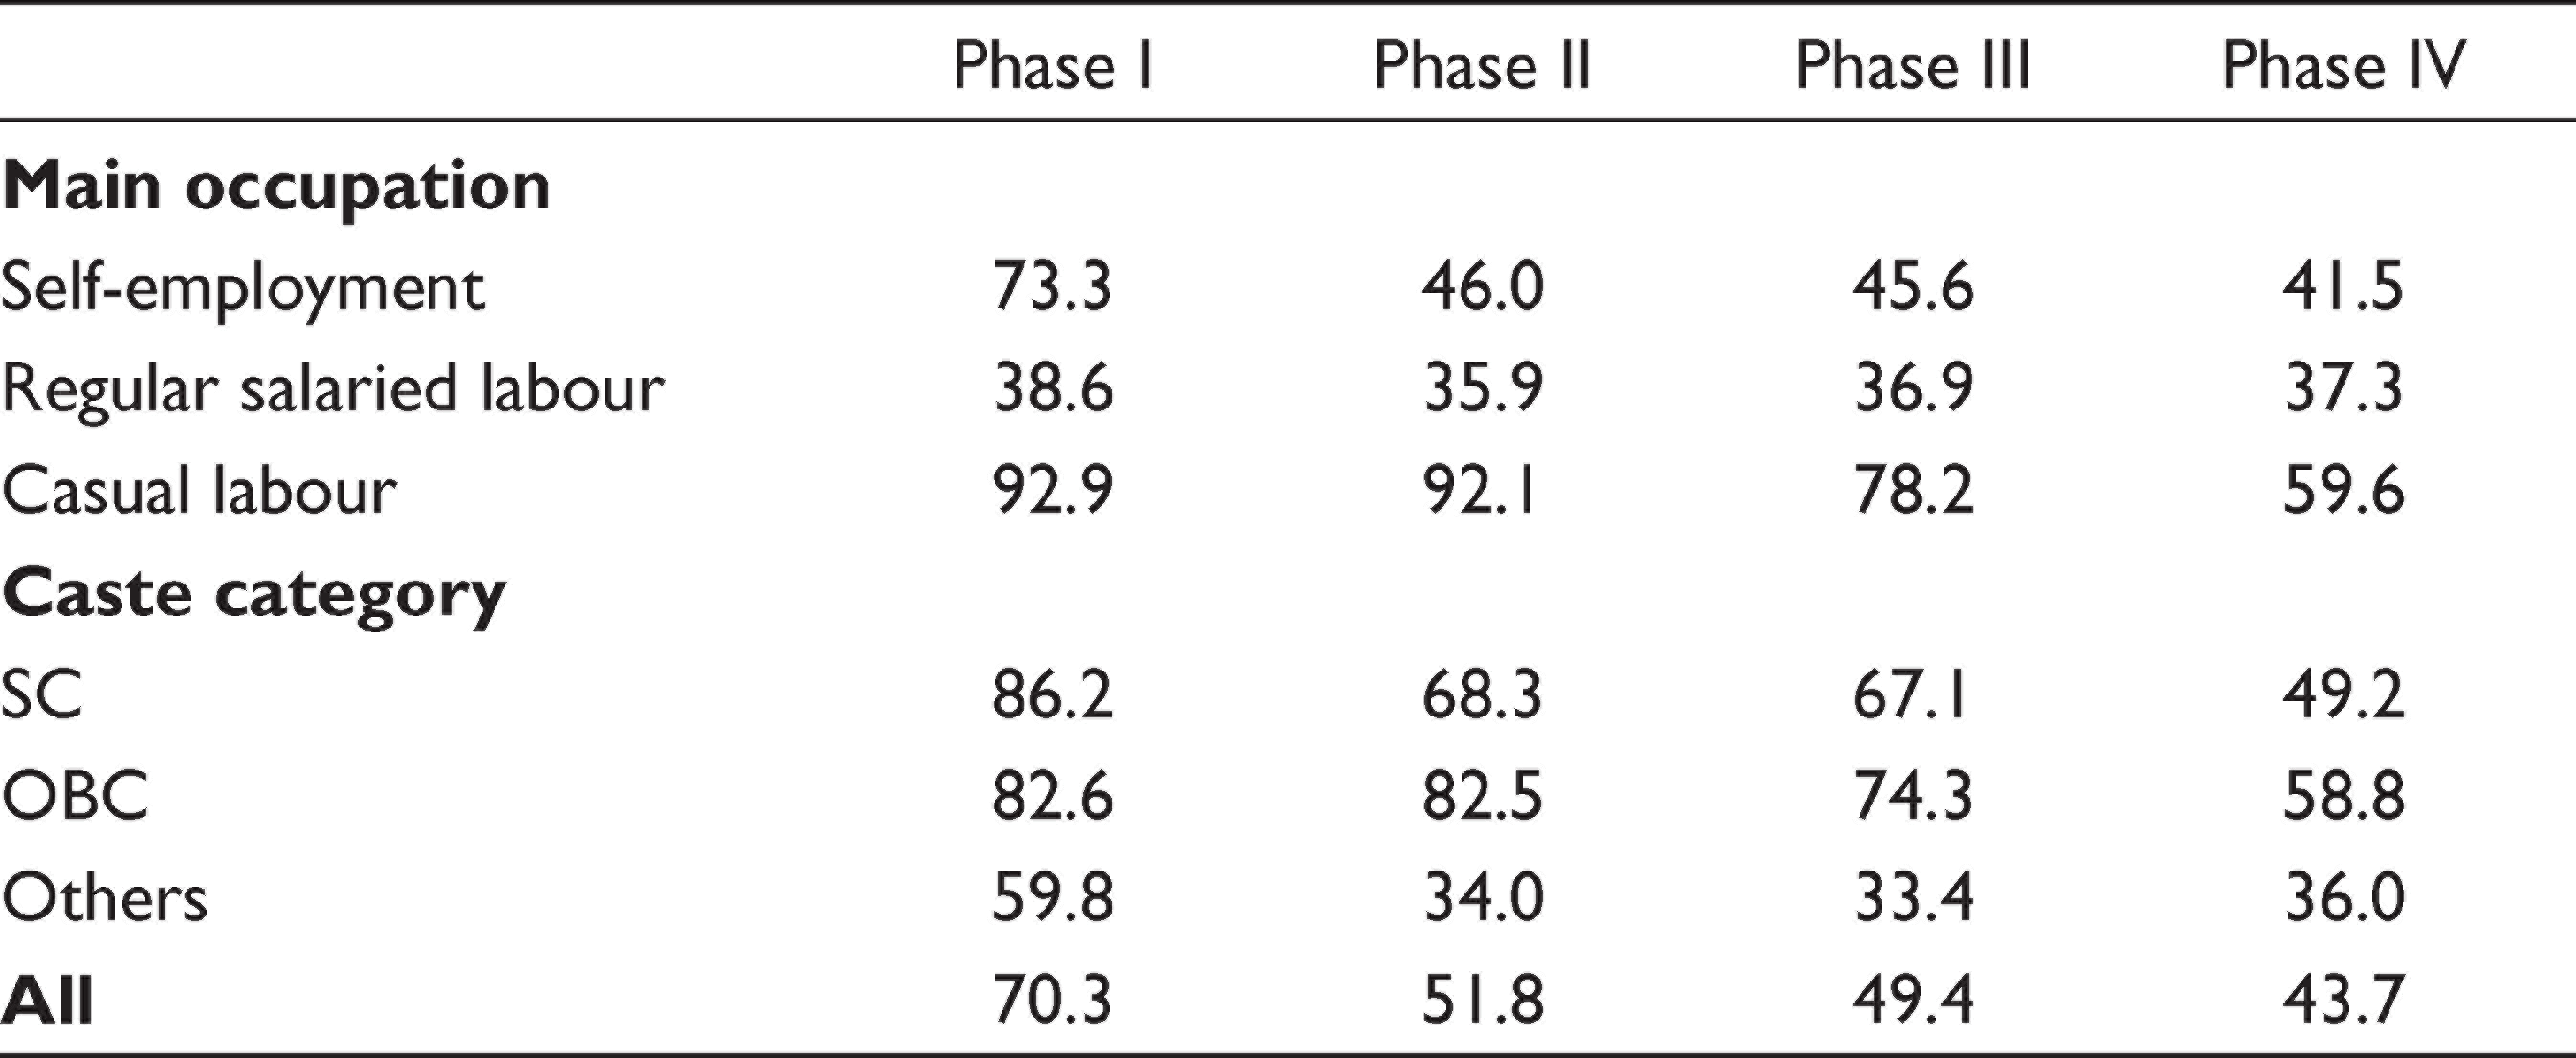
Average daily income of a worker had some similarity to the trends and patterns of employment. Phases I and II witnessed a sharp fall in the average income (compared to their pre-lockdown income), followed by some recovery in phase III and with a somewhat better position in phase IV (Tables 6 and 7). The extent of fall in income was much higher for vulnerable categories and the recovery in income much lower. On an average, the income of the workers fell by 73.3 per cent in phase I, followed by a loss of 56 per cent, 52.4 per cent and 45.7 per cent, respectively, in the next three phases. The loss of income in the last phase was much higher than the employment loss (discussed earlier). A slower recovery in income than employment indicates a drop in demand for non-essential commodities.
Average per Day Income of the Workers During the Lockdown (in ₹)
Percentage Fall in Average per Day Income of the Workers During the Lockdown
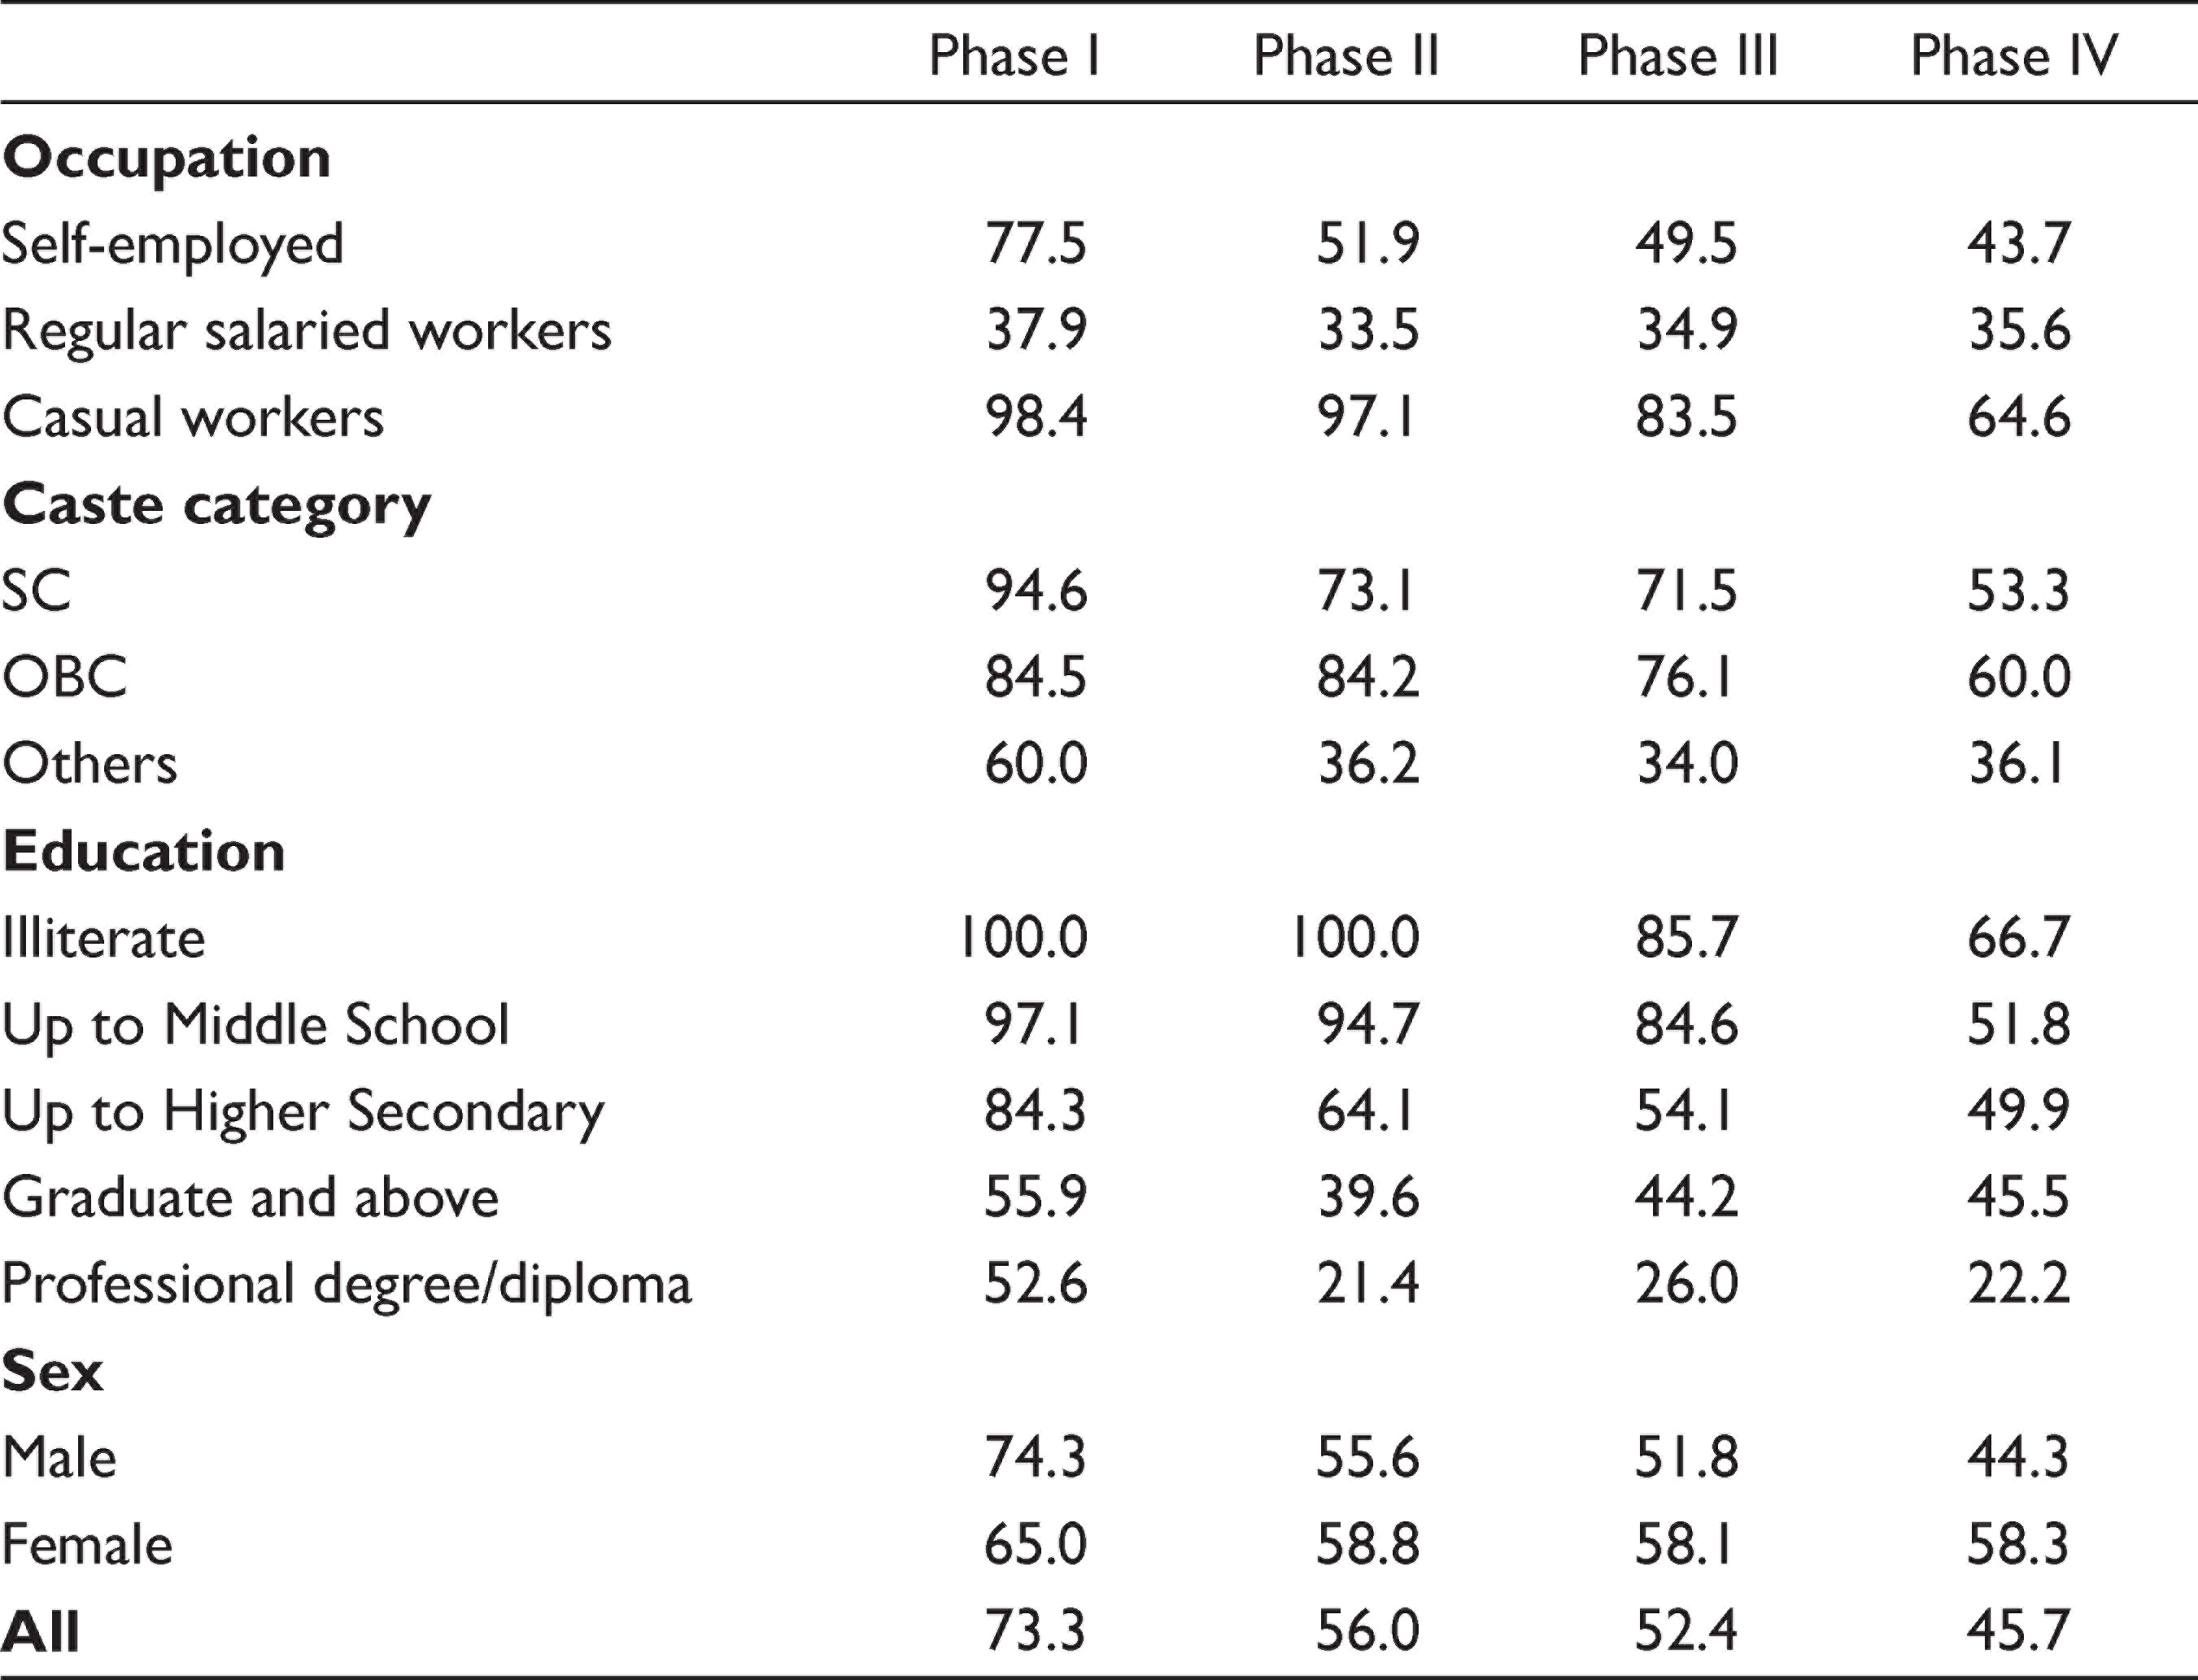
The divergence between income and employment trends is observed in occupation, caste, education and sex-wise analysis too. Casual workers lost 98.4 per cent and 97.1 per cent of their income in phases I and II, respectively, which is in line with their employment losses. Phase III saw separation of income and employment trends. Income loss was much larger in phases III and IV than employment loss. While only 23.8 per cent of casual workers did not find any job during phase IV, their loss in per day income was 64.6 per cent. The loss of income was the second highest for self-employed. In phase IV of the lockdown, the income loss of self-employed at 43.7 per cent was more than double of its employment loss. Regular salaried workers were in the best position with the lowest income loss in all the phases.
Loss of income was high for SC and OBC workers too. While SC workers had the largest fall in income (94.6 per cent) in phase I, the loss was the highest for OBC in the rest of the phases. Workers in Others category with 60 per cent drop in their average daily income were not only the least affected in phase I, but their income also recovered quickly. Their income loss for the rest of the period was around 36 per cent or less. Similarly, the extent of income loss was found to be persistently higher for workers with lower educational attainments with illiterates being the most vulnerable group of all. Women also had higher income loss in phases II–IV compared to their male counterparts.
The unequal income effect has led to a rise in inequalities. Gini coefficient for per day income, which was 0.33 in pre-lockdown period, went up to 0.82 in phase I. Although the later phases observed some decline in Gini coefficient as more businesses were allowed, it remained high. In phase IV, Gini coefficient was found to be at 0.60, which was much higher than the initial level. Larger income drops of vulnerable groups and rising inequalities are a worrying trend with possible long-term implications.
It needs to be mentioned that not all businesses experienced a fall in income. Some of the businesses reported an income increase specially in phases II and III of the lockdown. Three businesses, which reported an income increase, are grocery stores, mobile phone stores and flour mills. People, having uncertainty over the lockdown period, had gone for panic buying of essential commodities, especially food. As a result, the sale of grocery stores and flour mill went up in the initial phases. The trend started reversing in phase IV, as people already had sufficiently stocked food and other essential items. The owner of a mobile phone store, in our sample, was relatively less affected despite his business not being allowed in phase I. Most of his customers had his mobile number and could call them for services like recharging their mobile account or paying bills. With many schools starting to take online classes by the end of phase I, there was a sudden increase in sale of mobile phones and Internet recharge. Many families bought separate smartphone sets with mobile connections for their children. Thus, he earned significantly higher during the lockdown.
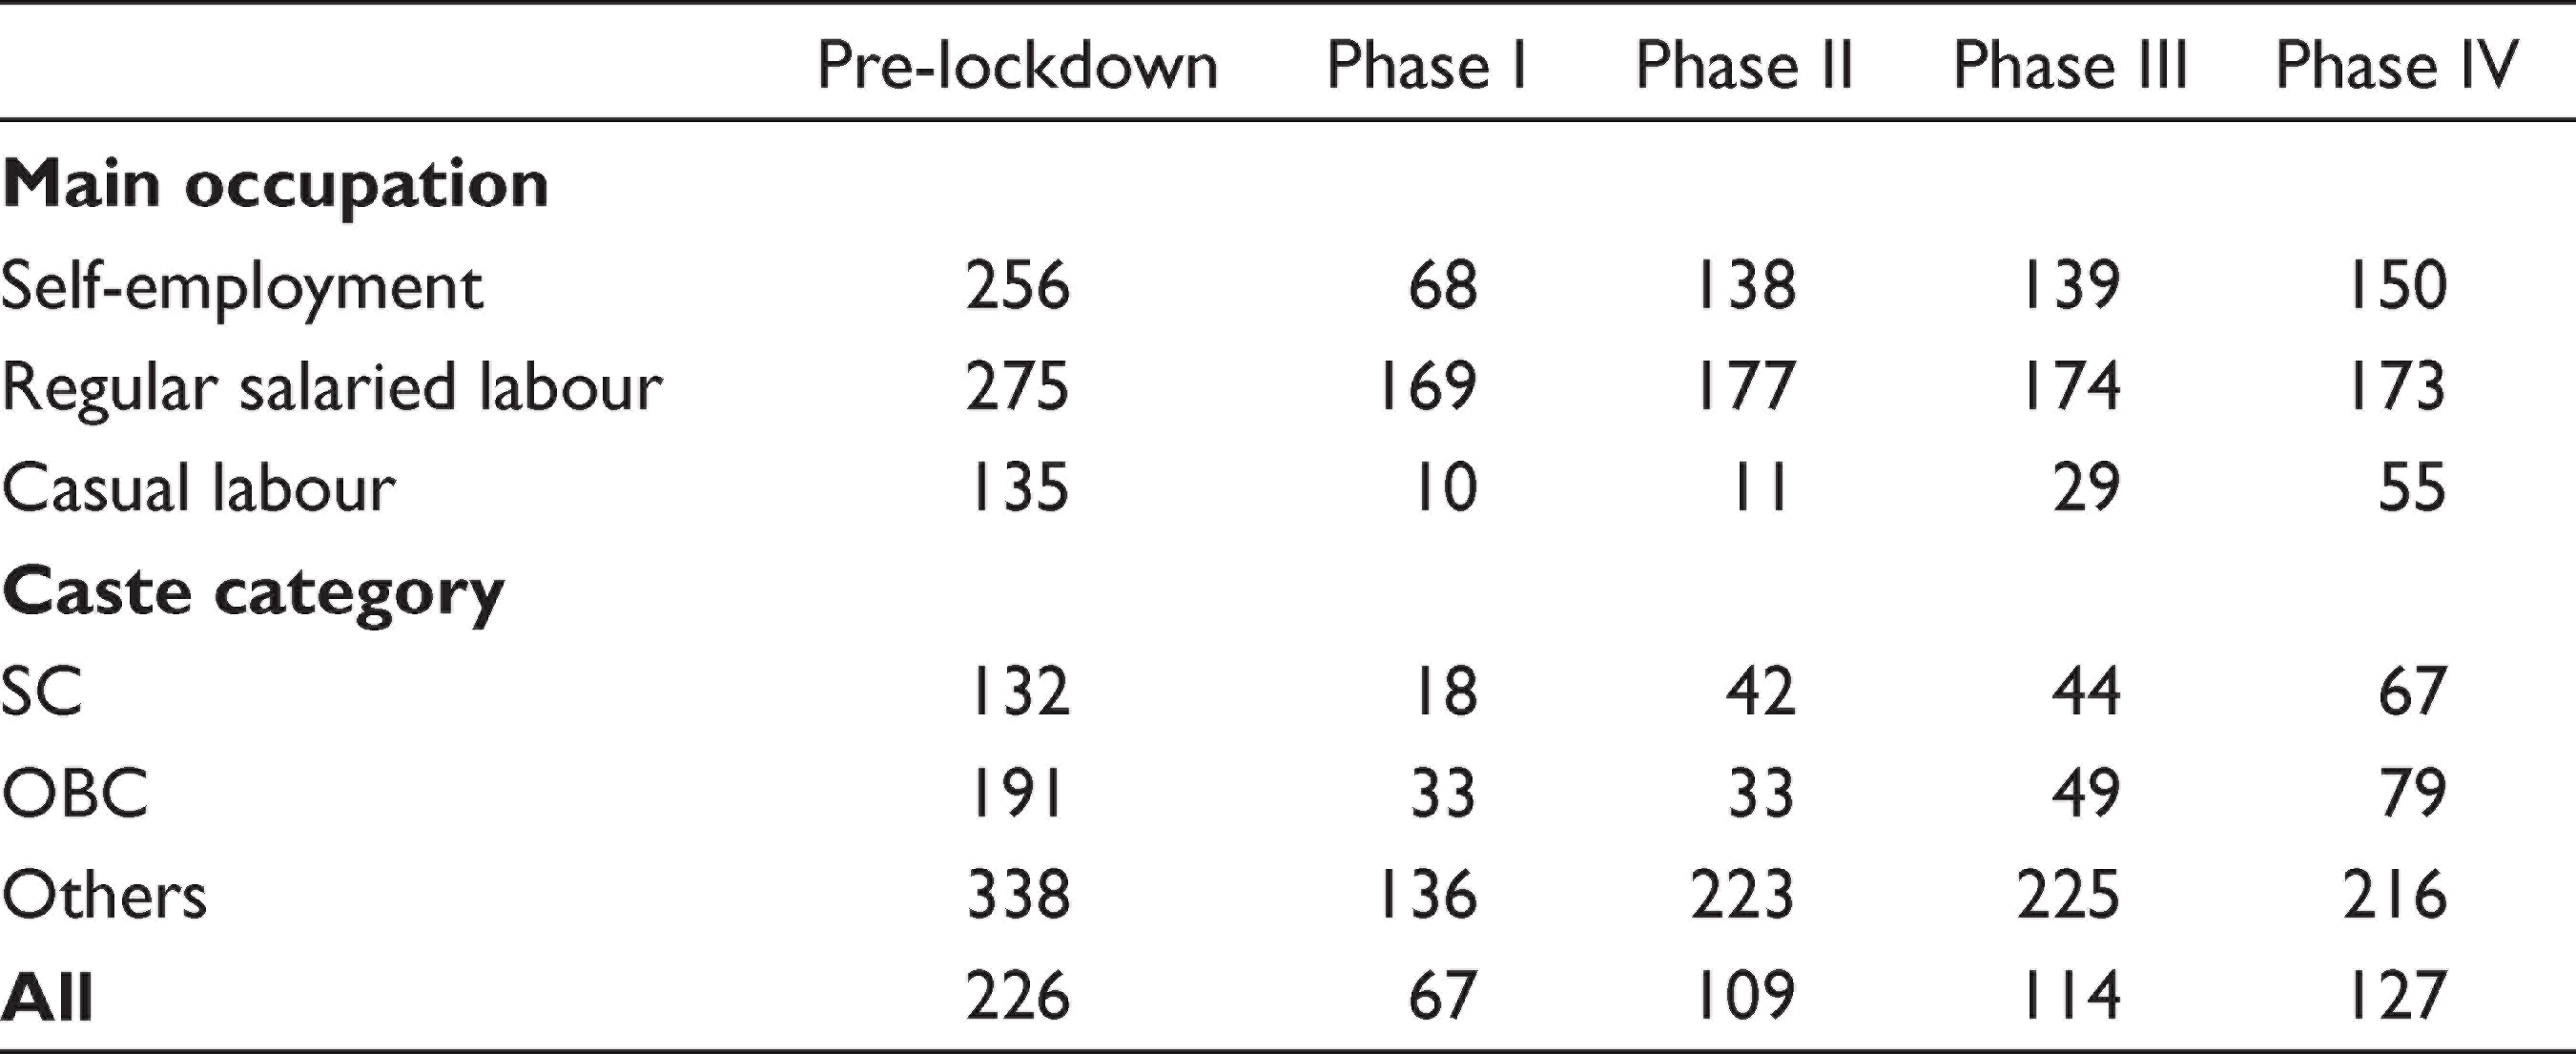
An analysis of per person per day income of the surveyed households show 70.3 per cent decline in phase I compared to pre-lockdown period (Tables 8 and 9). This figure is in line with the findings of Bertrand et al. (2020) based on the CMIE data. There was some recovery in phase II with loss in per person income coming down to 51.8 per cent. The recovery was much slower in phases III and IV. Per person per day earnings of the surveyed households were nearly 44 per cent less in phase IV compared to pre-lockdown period.
Average Per Day per Person Income of the Surveyed Households During the Lockdown (in ₹)
Percentage Fall in Average per Day per Person Income of the Surveyed Households During the Lockdown
A deeper probe into trends in per person per day income provides a disturbing picture. While all sections saw a fall in income, the loss was much severe for casual labour households. These households reported more than 92 per cent drop in their per person per day earnings. Despite some improvements in later period, their loss of income still stands at nearly 60 per cent in phase IV. Loss of income of these households is especially harrowing because their pre-lockdown income was about half compared to households in the other two categories.
In phase I, the casual labour households were earning just ₹10 per person per day. In comparison, the regular salaried households were earning almost 17 times more. Similarly, the self-employed households were earning about seven times more than that of casual labour households. Though the difference narrowed down by phase IV, the self-employed and regular salaried households were still earning 2.7 and 3.1 times higher than casual labour households. Since the share of casual labour workers was much higher among SC and OBC households, fall in income per person was also much higher for them. In phase I, both SC and OBC households had more than 80 per cent fall in their per person per day income compared to 58.9 per cent of households belonging to Others category. Even in the last phase, income of SC and OBC households was about one-third of the Others category.
The survey findings suggest serious economic and welfare consequences, owing to fear of COVID-19 and the lockdown. Employment and income of the households are severely hit, and recovery is slow. In the vulnerable sections like those engaged in casual labour, SC and OBC households have borne the maximum brunt of it.
Lockdown created a situation where a large section of people found it difficult to survive without assistance. Both the Government of India and the Government of Punjab announced policies to help people meet their basic needs. The Government of India made an additional monthly provisioning of 5 kg of food grains (wheat or rice) per person and 1 kg of pulses per household without cost for a period of 3 months (April–June 2020). The beneficiaries of Pradhan Mantri Ujjwala Yojana were provided three gas cylinders for free between April 2020 and June 2020. The central government also transferred money to the accounts of certain target groups. Women holding Pradhan Mantri Jan Dhan Yojana (PMJDY) accounts were paid ₹1,500 in three monthly instalments. Nearly 200 million women were expected to gain from it. 1 The central government has made other announcements such as collateral free credit to micro-, small- and medium-scale enterprises. However, these schemes were not implemented at the time of survey.
The Government of Punjab further increased the quantity of free ration announced by the central government. It distributed 15 kg of wheat per person and 3 kg pulses per family to below poverty line (BPL) households through the public distribution system (PDS) (the quantity includes free ration announced by the central government). The Government of Punjab transferred ₹3,000 to the accounts of registered construction workers. It was expected to benefit 0.32 million labourers. In addition, non-governmental organizations (NGOs) distributed ration to needy households not covered by PDS.
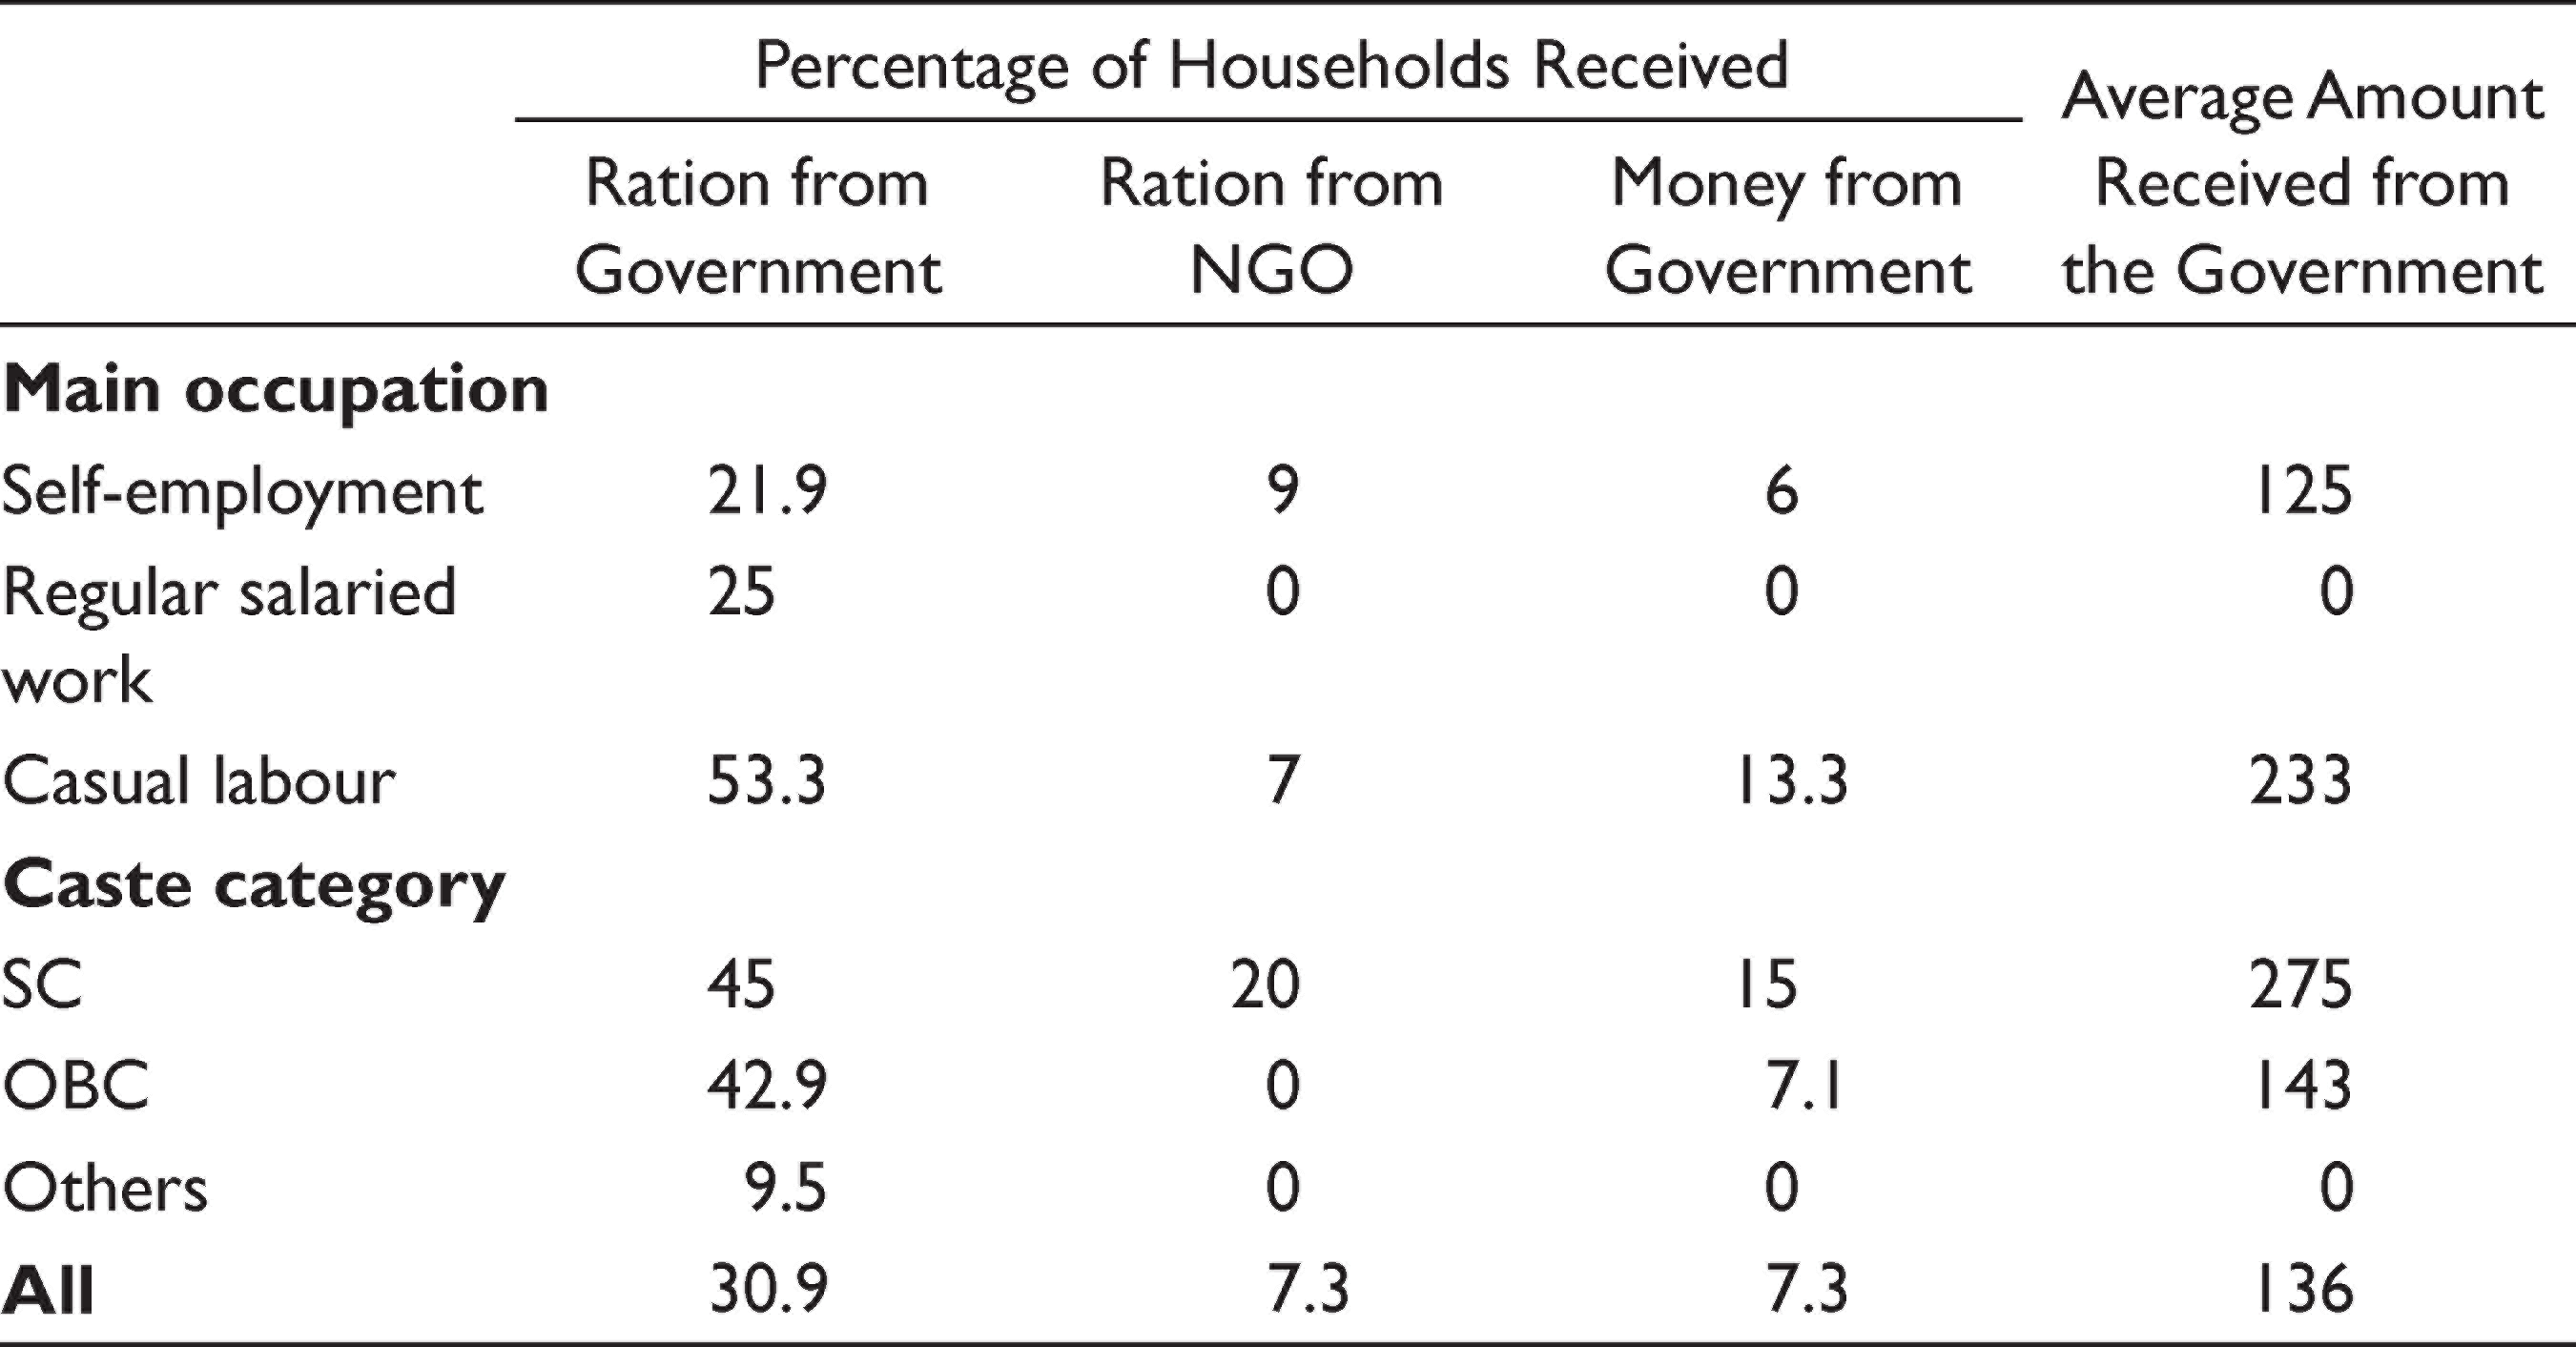
Among the surveyed households, 30.9 per cent received free ration through PDS during the lockdown (Table 10). Another 7.3 per cent got ration from an NGO. The access to free ration was relatively higher among vulnerable sections. More than 60 per cent of casual labour households and 65 per cent of SC households received free ration from either the government or an NGO. The same percentage for households belonging to Others category and those which were dependent on regular salary was 9.5 per cent and 25 per cent, respectively. This low percentage is because these households chose not to get the ration.
Assistance Received by Households During the Lockdown
Assistance Received by Households During the Lockdown
The money transfer by the government was not significant. Just 7.3 per cent of the households received money from the government. The percentage was relatively higher for SC households (15%) and casual labour households (13.3%). However, the average amount received by a household was meagre for any significant help.
While the free distribution of ration was a major help for a large number of households, it only provided wheat in sufficient quantity. Households were still dependent on the market to buy other food items. Despite this, no households reported shortage of food during the study period. Households which lost their income have lived off their savings or had borrowed money during the lockdown.
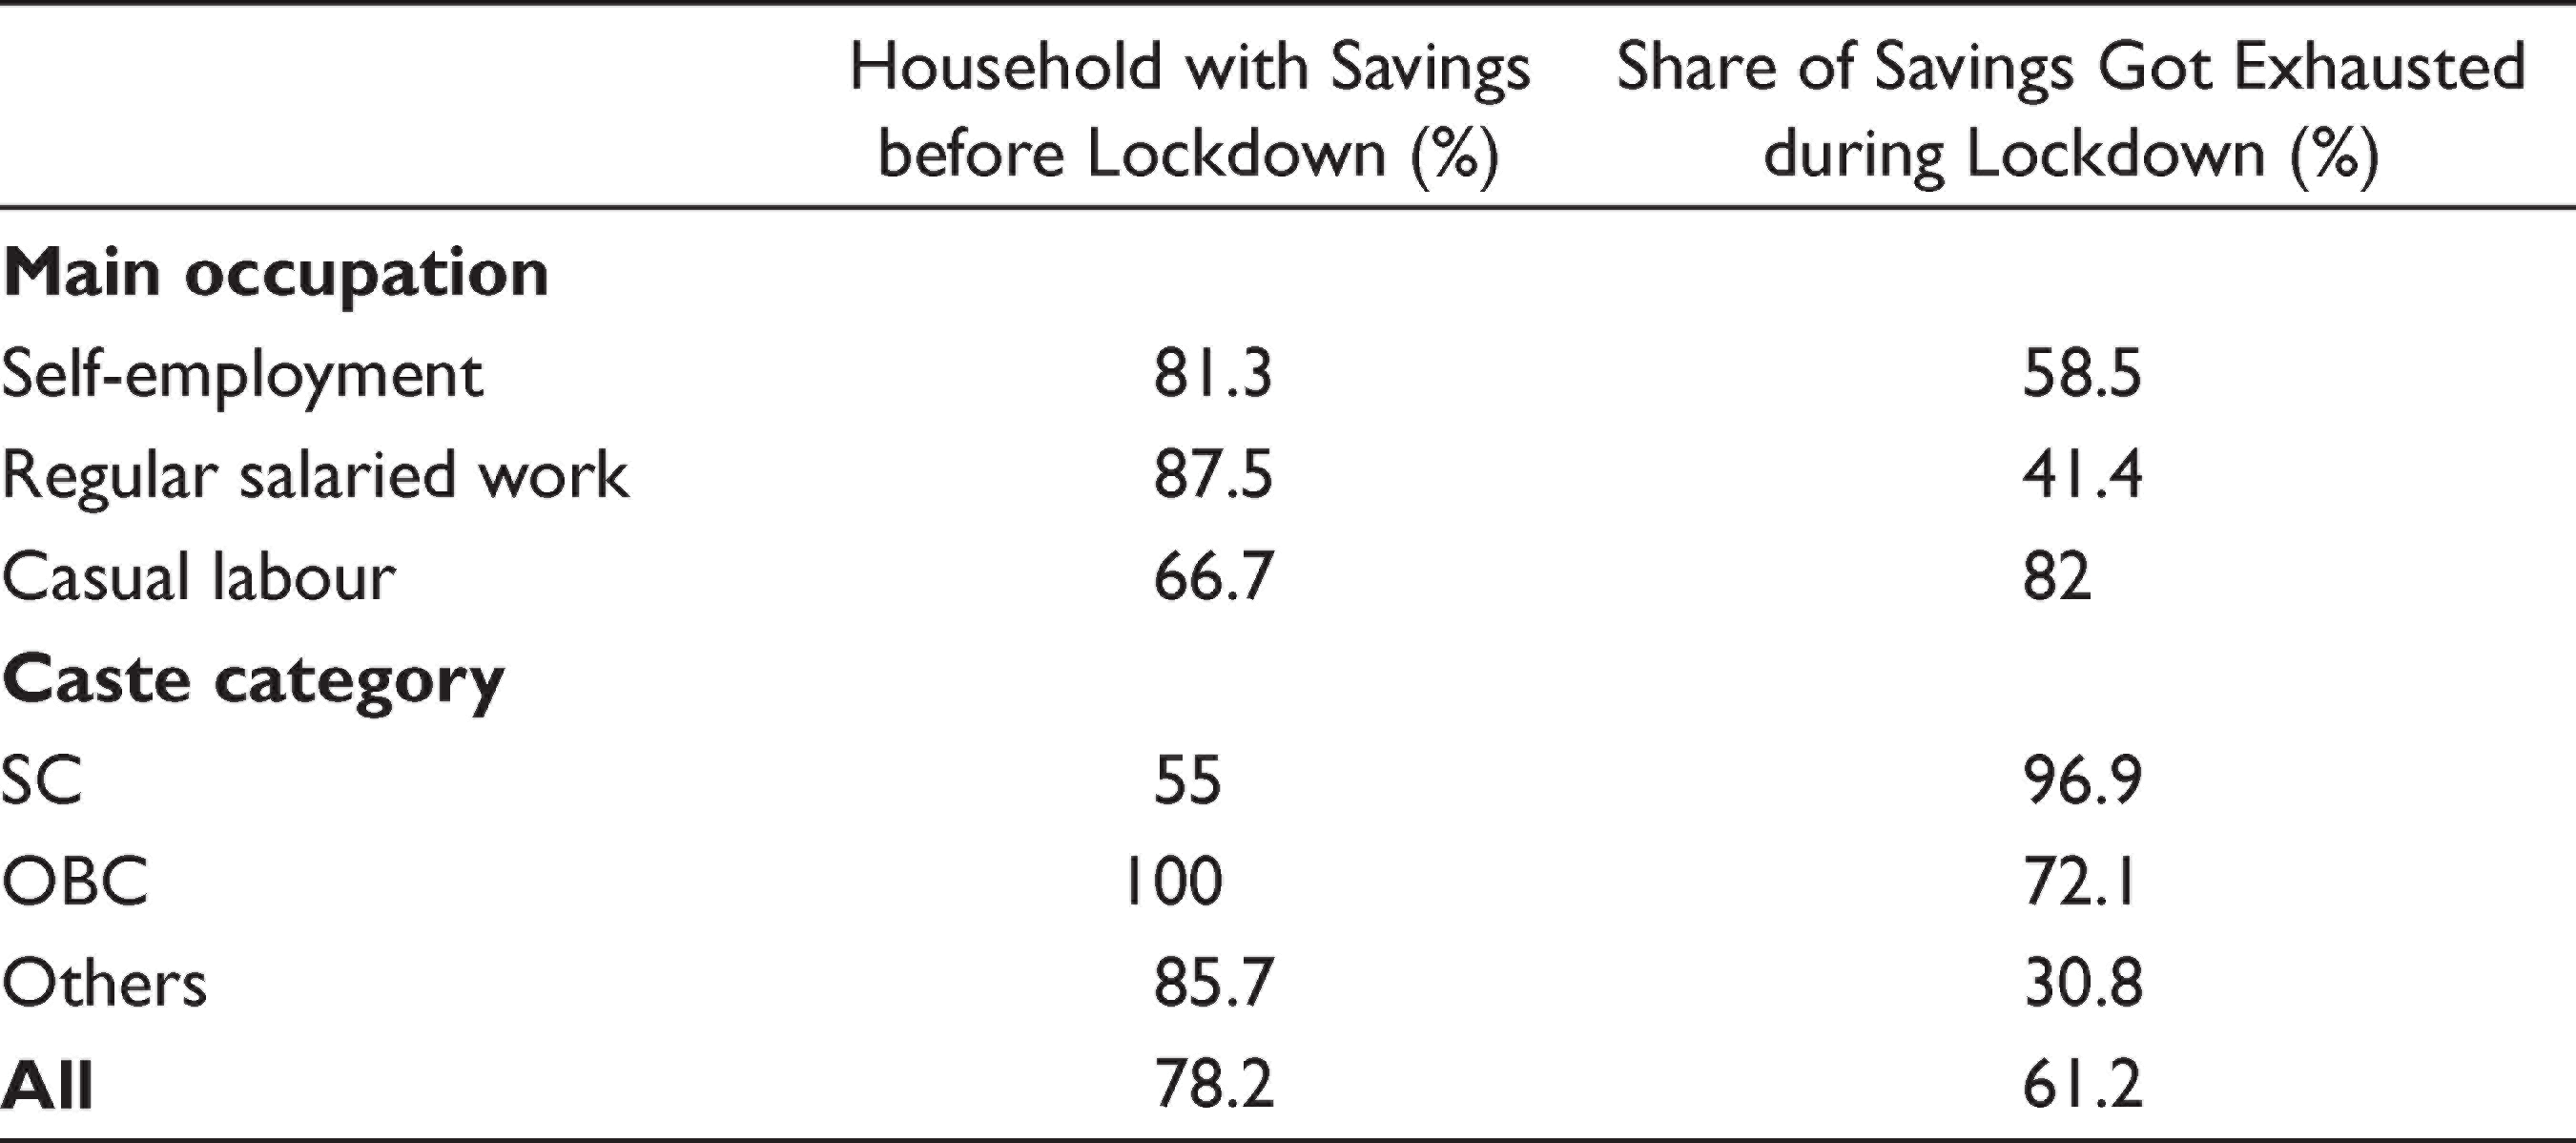
About 78 per cent of the households reported to have some amount of savings before the lockdown (Table 11). The percentage of households with savings was relatively higher in OBC (100%) and Others (85.7%) categories than in SC category (55%). A larger share of self-employed households (81.3%) and regular salaried households (87.5%) reported to have savings compared to those of casual labour households (66.7%). Households in Others categories were particularly better secured in terms of saving, as they had only exhausted 30.8 per cent of their saving at the time of survey. It is also evident from Table 12, as more than 57 per cent of the households in Others category, at the time of survey, reported that they can survive for more than 6 months on their existing savings.
Status of Savings Before the Lockdown and After Phase IV
Time Period for Which the Household May Survive on the Existing Savings (after phase IV of the lockdown)
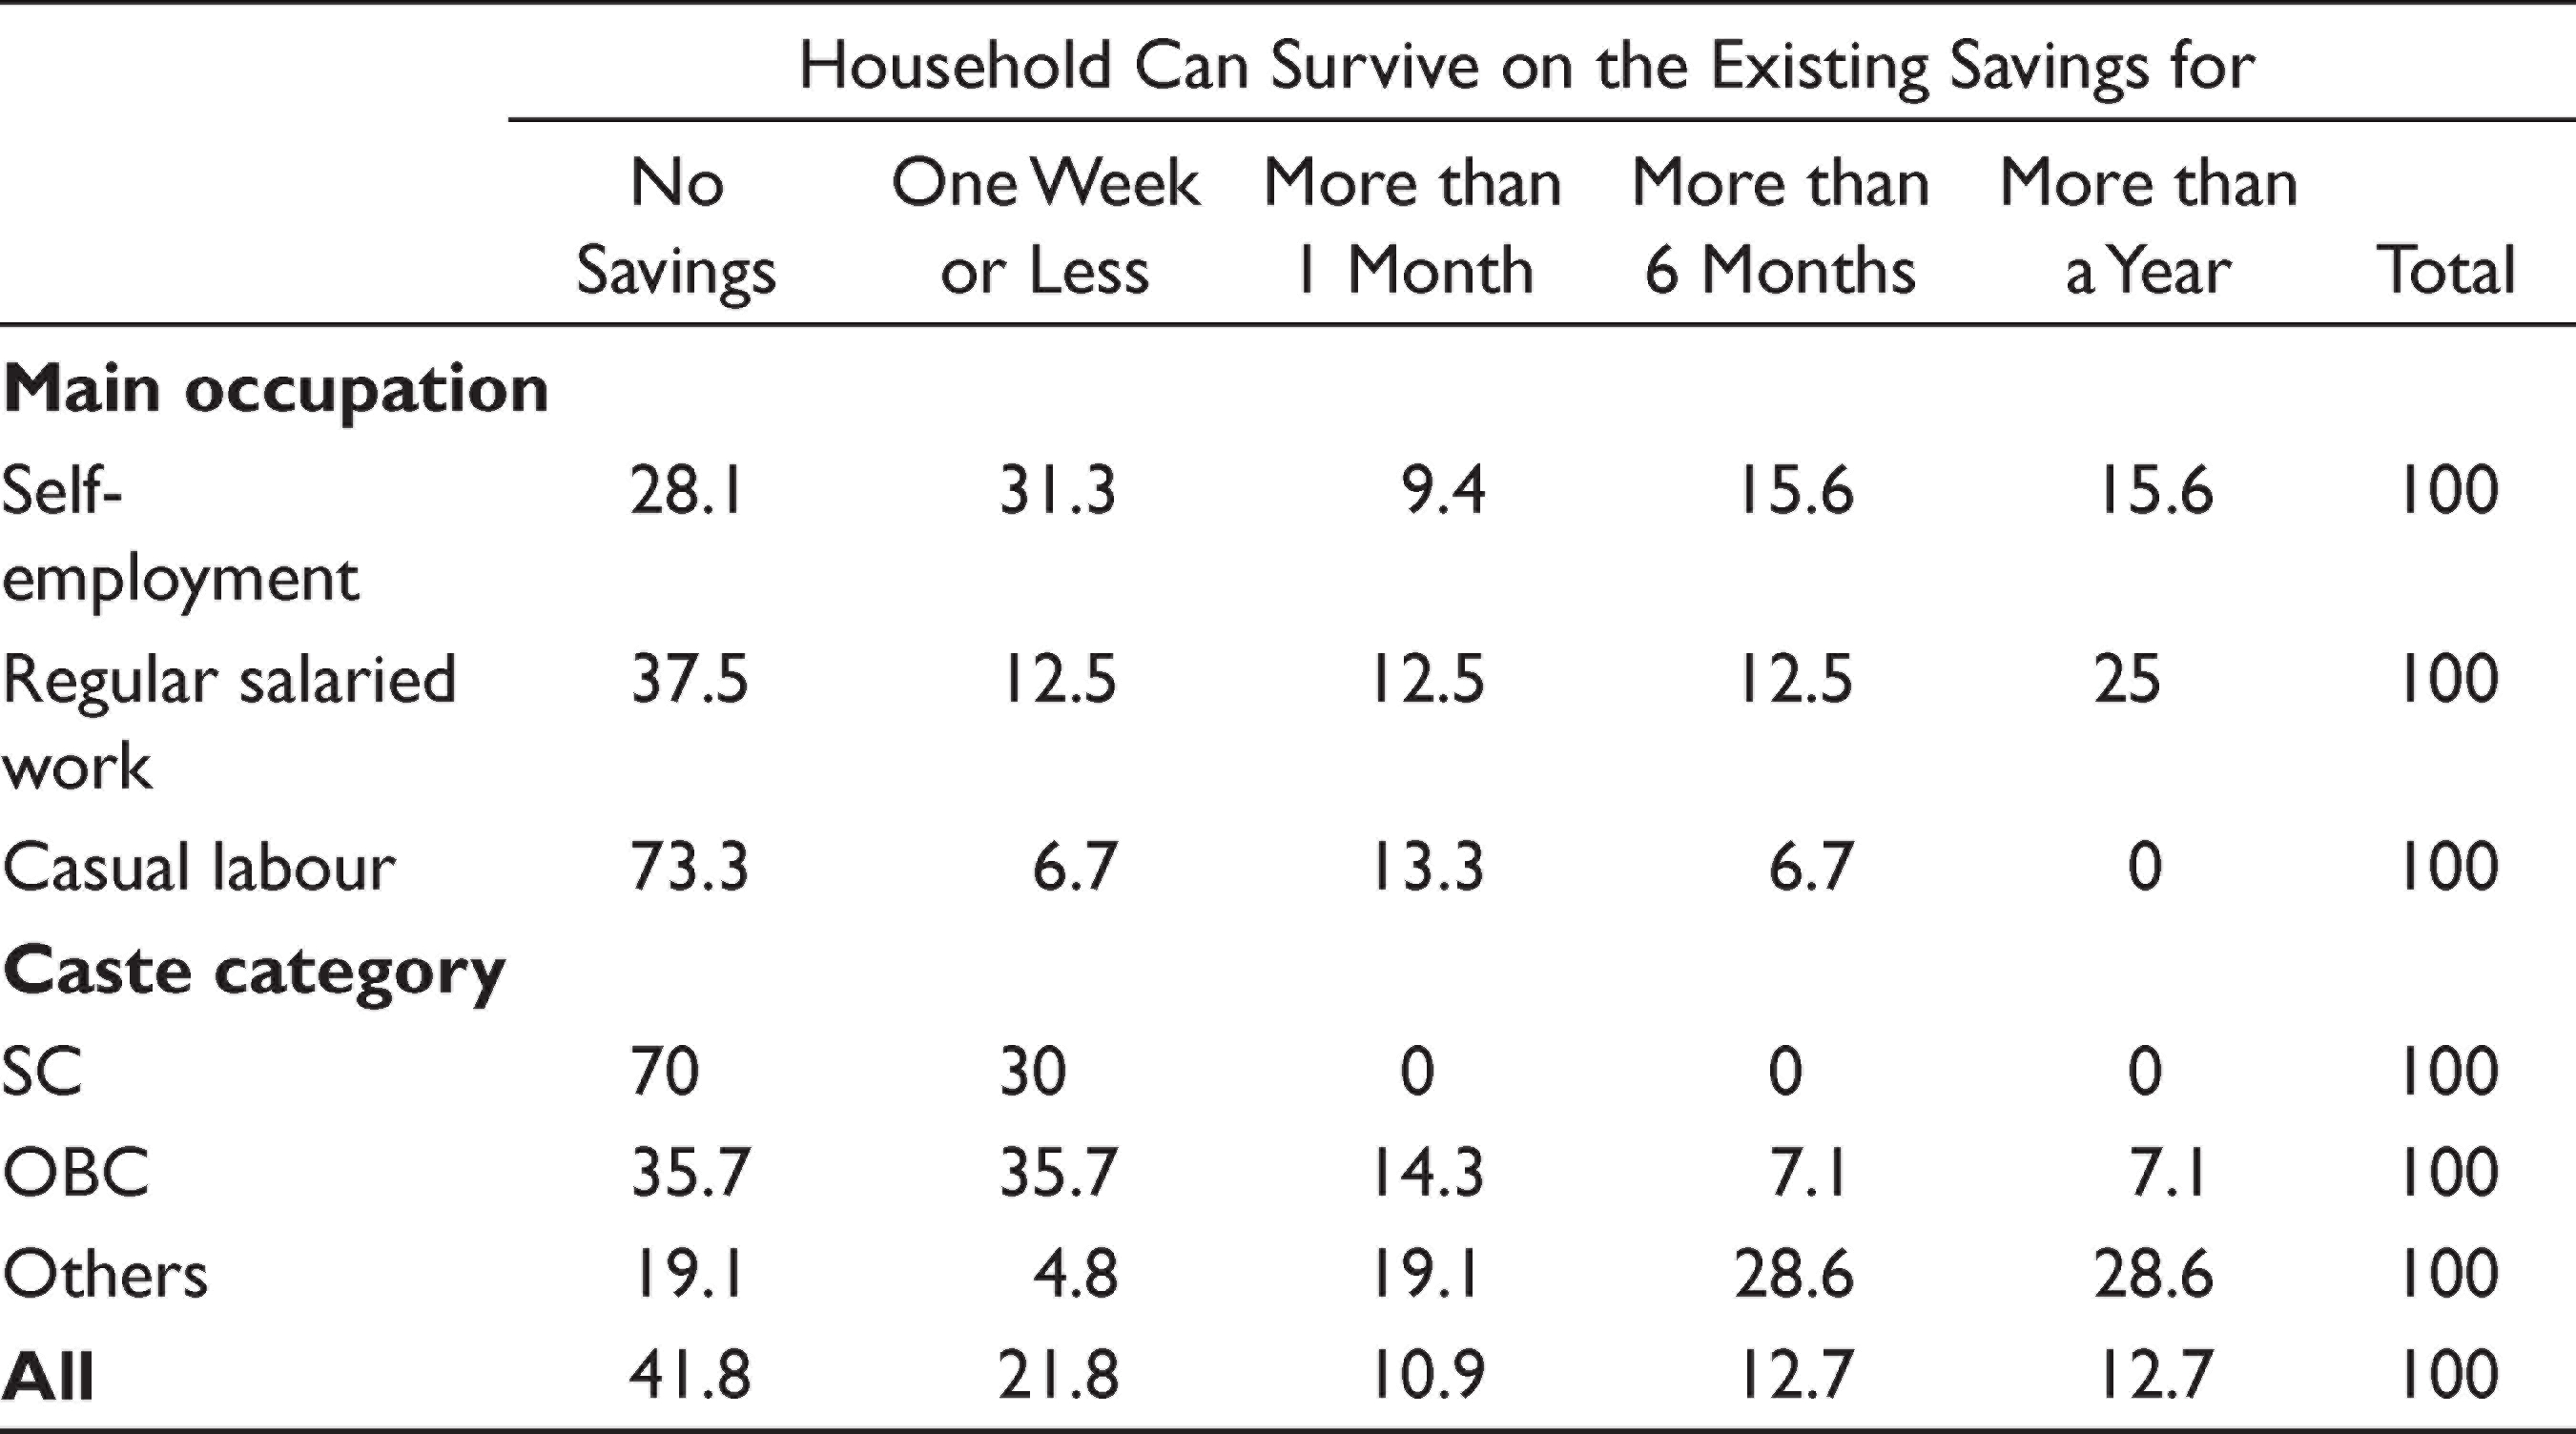
Regular salaried and self-employed households too had higher savings at the time of survey with about one-third of them reporting to be able to live off it for more than 6 months. SC households are in the worst position to withstand the income fall, as they have already exhausted 97 per cent of their savings, and none of them can survive more than a week without income or someone’s assistance. Casual labour households too were highly vulnerable to income shock, as they have exhausted 82 per cent of their savings. Besides, 73.3 per cent of these households reported to have no saving at the time of survey.
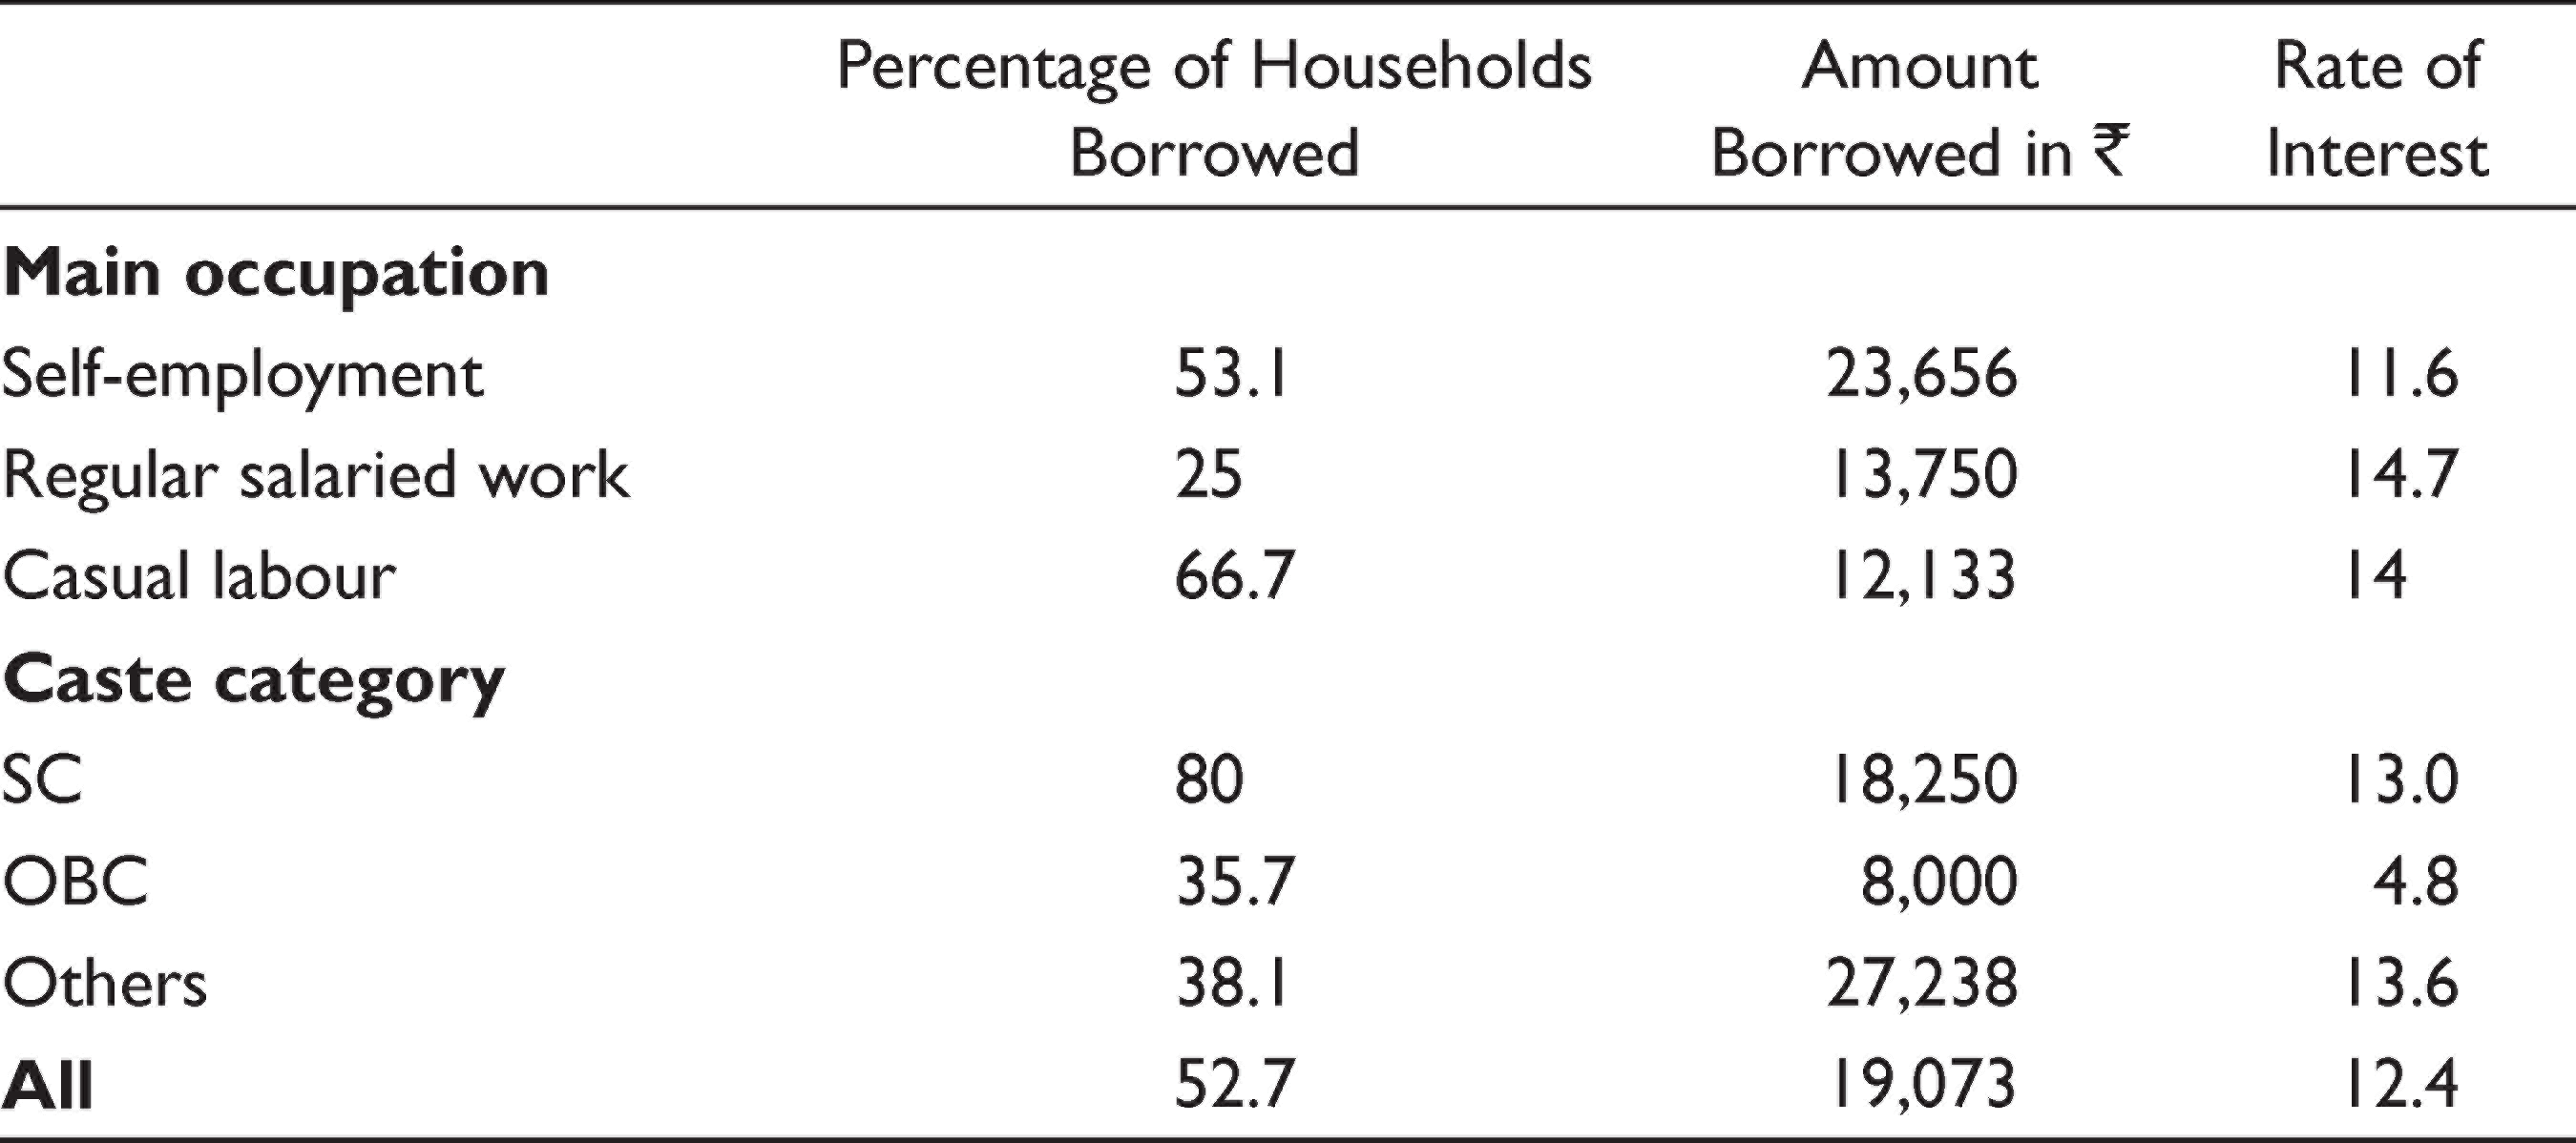
With a significant share of households with no saving or having exhausted the savings, they have to rely on borrowings (Table 13). Nearly 53 per cent of the households reported to have borrowed money to meet their needs (it only includes loans that were taken to cover fall in income during the lockdown). The percentage is relatively higher for vulnerable sections, as they either did not have savings at the time of lockdown or exhausted them quickly. The rate of interest on these loans varied considerably. While some could get the money from relatives or friends at zero rate of interest, for others, it ranged between 12 per cent and 20 per cent. The average rate of interest on these loans was 12.4 per cent.
Borrowing by the Households Due to Loss of Income During Lockdown
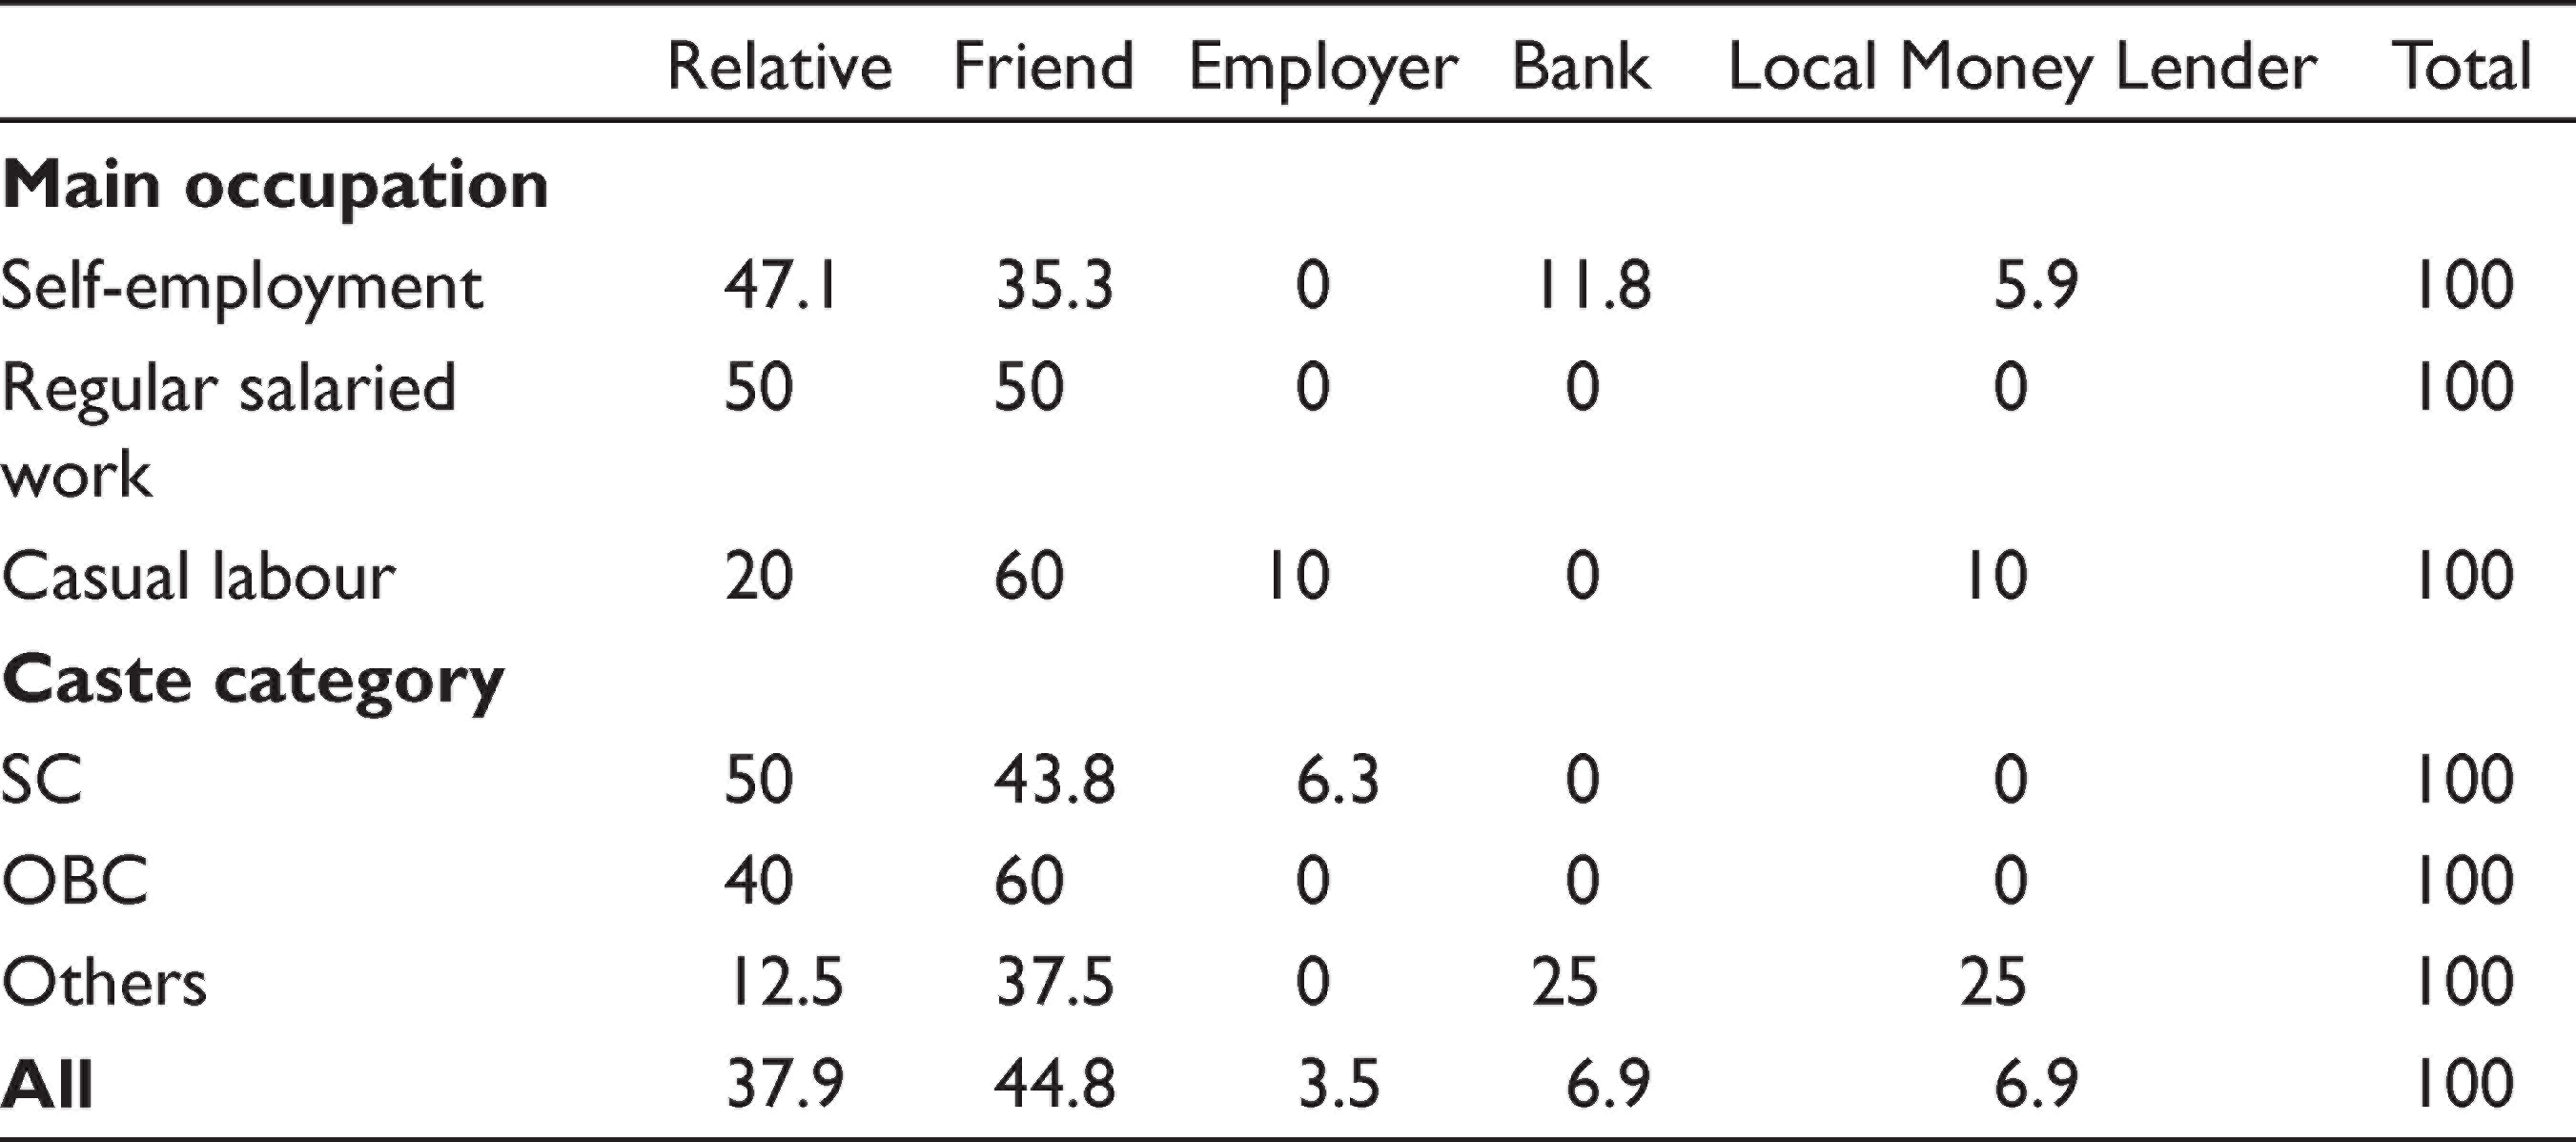
Nearly 83 per cent of these loans were taken from relatives or friends (Table 14). A small percentage of the loans (3.5%) was from the employer. While relatives and friends constituted a dominant source of loan in all categories, 50 per cent of households in Others category got loan from a bank or local money lenders.
Distribution of Borrowers According to Source of Loan (%)
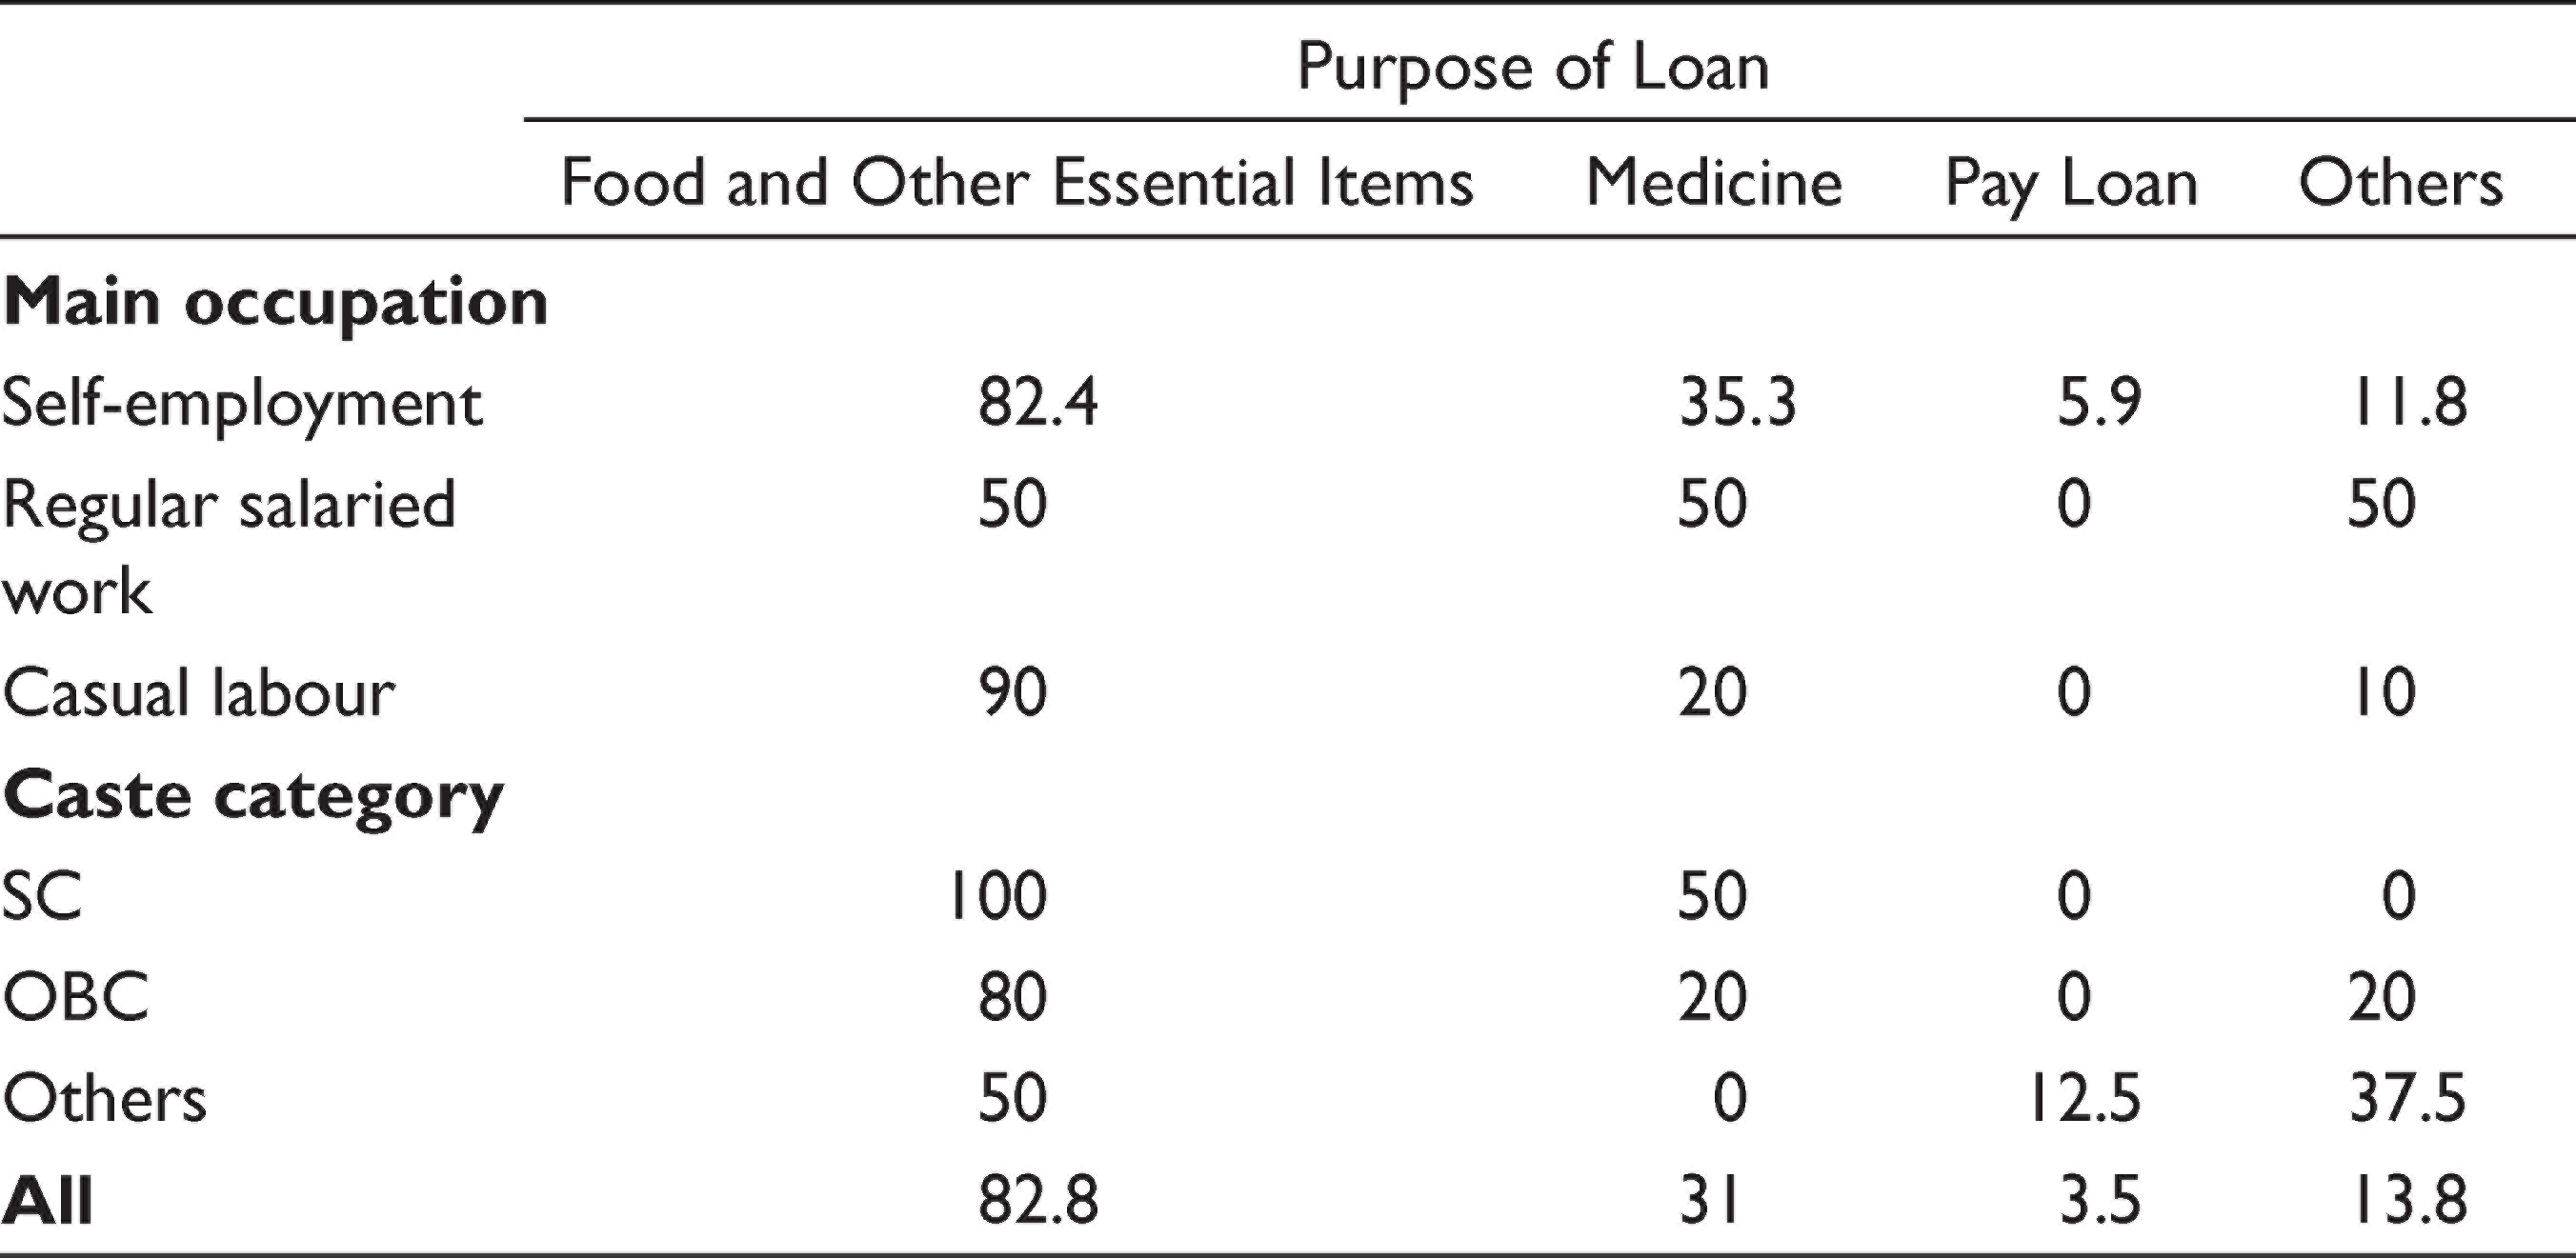
A majority of these loans were taken to buy food and other essential items (82.8%). Expenditure on medicine was the second important reason for the loan (31%). All loans by SC and OBC households were to purchase either food and other essential items or medicine. Households in Others category had also taken loan to repay an old loan or for expenditure on non-essential items.
The findings of the study show that people had mostly survived the lockdown by using own savings or borrowing. The government assistance played little role, except for distributing ration (which mostly comprised wheat) during this period. A majority of households had already exhausted their savings, and among the rest, only a small percentage had enough to live off them for more than a month. The condition of vulnerable categories is especially worrying in this regard. With nearly 27 per cent of them still out of work (Table 15) and a significant number still earning too little, deprivation is a real possibility for a significant share of the population. Many of these households had survived the lockdown by borrowing (often at high rate of interest) and can afford to borrow more for the time being. Their ability to do so is fast reaching the limit. The grocery stores and flour mill owners, who had given goods on credit, reported their financial condition to be under serious strain. People reported that they may not continue to extend such help if their income did not revive. High uncertainty is making people more prudent in their choice, and they are cutting down on their expenditure and are more cautious in lending monetary help to others. Without any assistance from the government, these people may slip into deep poverty, failing to fulfil even their basic needs.
Distribution of Borrowers According to Purpose of Loan (%)
COVID-19 pandemic had come with serious economic and welfare consequences. While the developed world has well-functioning social security system to shield its citizens from its adverse consequences, people in developing countries are at the risk of falling into deprivation. Imposing the lockdown had further increased the hardship of people. The present study, using the data from a primary survey, finds large fall in employment and income during various phases of the lockdown in the city of Mansa. Although there is some recovery with easing of lockdown restriction, there remains a significant proportion of workers who are unable to find work. Even for those who could find some work, their income has not fully recovered. On an average, people are still earning about 44 per cent less than their pre-lockdown income.
The government’s help during the lockdown was mainly limited to distribution of free ration. Even though it provided some level of food security to people, it was not enough to meet even the basic nutrition needs of the people. Only a few households received monetary assistance from the government. Not only was the monetary assistance limited to a small share of households, but it also was too small to be of any significant help. People mostly depended on their own savings or borrowings to meet their basic needs. With depletion of their savings and income not recovering, people continue to struggle to make their ends meet. The option of borrowing, which is presently available, is also under serious strain, as the lenders are reaching the limits of their capacity to provide credit. Without the restoration of their income or government’s assistance, people are at the juncture of witnessing serious deprivation.
With the number of confirmed cases and deaths growing in India, it may be long before income and employment are restored to pre-pandemic period. Therefore, the government must come up with a comprehensive plan to tackle welfare consequences of income and employment losses. While free distribution of food grains should continue, the government should include other essential food and non-food items to the list to minimize the hardships of the people. It should make larger money transfers to low-income families. An employment guarantee scheme (similar to the Mahatma Gandhi National Rural Employment Guarantee Scheme, 2005) in urban areas may provide much needed relief to the people. The present situation rendered a large number of households vulnerable. Identifying these households for the delivery of goods and service is a major challenge. Given the inherent limitations of government departments and PDS, NGOs may also be used to identify such households and distribute food and other essential items to them.
Footnotes
Declaration of Conflicting Interests
The authors declared no potential conflicts of interest with respect to the research, authorship and/or publication of this article.
Funding
The authors received no financial support for the research, authorship and/or publication of this article.