
Abstract
In recent years, countless studies have sought to explain and characterise video streaming consumption. Its facet of excessive consumption, the so-called binge-watching, has been privileged in an attempt to define and quantify, if possible, the phenomenon. In this work, we intend to analyse streaming video consumers, aiming to identify the factors that differentiate two specific types of consumers: TV series streamers and medium/short-duration video streamers. The data was obtained using a structured questionnaire, shared online between 16 June and 16 August 2022, to individuals residing in Portugal, aged between 18 and 64, with 496 valid responses. Our sample consists of 67.3% women, and 83.5% of the participants are of Portuguese nationality. About 75% of the participants assumed themselves as consumers of TV series, and about 25% were medium/short-duration video consumers. This study used several statistical techniques, including descriptive statistics, chi-square independence test and logistic regression. The factors that differentiate these two groups of consumers are gender, age group, environment where they live, type of platforms used, the device they usually watch, with whom they typically watch and the system recommendations.
Introduction
The advancement and massification of information and new communication technologies have allowed for a new way of consuming media entertainment in recent years. The popularisation of access to personal devices, with particular emphasis on mobile phones and computers, along with a growing and stable Internet connection, has provided a new form of online consumption. Viewers can now access their favourite programs anywhere, anytime and as often as they like. Thus, the consumer now has perfect control not only of what they consume but particularly how they consume it. Hence, it became possible to consume multiple TV series episodes (or another type of program) simultaneously for as long as one wants without being dependent on the weekly TV schedule and successive advertising interruptions. According to some authors (e.g., Shim & Kim, 2018), this new pattern of streaming video consumption, despite greater efficiency in choosing and controlling what is consumed, can lead to an excess, the well-known phenomenon of binge-watching, which has been much studied in recent years by various subject areas (Merikivi et al., 2018; Pittman & Sheehan, 2015; Steiner & Xu, 2020; Sung et al., 2018). This type of phenomenon originates in the development of various ‘on-demand streaming’ platforms, notably Netflix, Hulu, HBO GO, Amazon Prime, Disney+, Crunchyroll and Apple TV. In 2013, Netflix created new ways of consuming TV programs in which viewers could choose extensively from the diverse content offered (Starosta & Izydorczyk, 2020). Recently, according to data from Netflix, around 208 million consumers subscribed to this paid platform in 2020 Netflix (2021). These numbers have continued to grow, especially during the quarantine and lockdown of the economy following the pandemic (Rahman & Arif, 2021).
This new behaviour towards video streaming has aroused increasing interest in the profile of this type of consumer, excessive or more recreational and in their real motivation.
We also emphasise that currently, several studies are being carried out regarding the profile and consumer behaviour of TV series such as Netflix and HBO,…, that is of programs whose each episode has a longer duration (e.g., Martínez-Sánchez et al., 2021; Nagaraj et al., 2021), and other studies to analyse the profile and behaviour of the consumer for videos of short/medium duration, such as YouTube, TikTok, Reels (e.g., Blagojević, n.d.; Chen, 2016; Iqbal, 2023). As referred by Yoo et al. (2020), like binge-watching, short-watching is also a representative way of consuming media. In congruence with the continuing growth of subscription video-on-demand (SVoD) services such as Netflix and Hulu, studies on binge-watching appear to receive more attention than research conducted on short-watching. In this way, it will be essential to differentiate between the two types of programs/series and to know what distinguishes them in consumer profiles.
In recent years, several definitions have emerged to distinguish videos in terms of their length. For Newman (2010), short-watching is similar to the snack culture: consuming media in short periods to suit hectic lives. In the study conducted by Bytyci (2014), it was concluded that the mean length for short videos was about 2.9 minutes, whereas for long-form videos, it was about 30.7 minutes. According to Kong (2018), ‘Short video’ refers to video content shorter than 5 minutes distributed via digital media platforms. Short video features include low-cost production, highly spreadable content and blurry boundaries between producers and consumers.
Lew (2021) states that the concept of ‘medium-length videos’ or ‘mid-form videos’ was formally introduced in October 2020 by Watermelon Video’s CEO Ren Lifeng and is now trending on all major video platforms in China. Here, a distinction is made between the three categories of video according to their length: Short-form, whose duration is up to 1 minute (e.g., TikTok videos); mid-form, where video duration can be anything between 1 and 30 minutes, but a length of 5–15 minutes is more commonly seen (e.g., YouTube videos); and long-form, whose duration is more than 30 minutes (e.g., Netflix and Disney+ videos). According to Bonacci (2022), short-form videos are typically under 10 minutes long, while long-form videos exceed that 10 minutes.
Thus, it is clear that there is no unanimous definition in the literature as to the duration of the videos under review. Therefore, in our study, we made the distinction between TV series, considering, in this case, videos with a longer duration, such as Netflix, HBO or Disney+ videos and videos of medium/short duration, such as videos such as YouTube, TikTok or Reels.
In this setting, the main objective of this study is to identify the main factors that distinguish the consumer of streaming TV series from the consumer of short/medium duration videos. These factors include some socio-demographic characteristics, the devices and platforms used and factors that can be considered motivational, such as the recommendations made by the system and relaxation. To this end, our main research question is:
RQ: What are the main factors distinguishing a consumer of streaming series and a consumer of medium/short duration videos?
To answer the question, streaming consumers were asked about the type of product they usually consume: TV series (e.g., Netflix, HBO and Disney+) or medium/short-length videos (e.g., YouTube, TikTok and Reels). This variable is the dichotomous dependent variable of interest.
The article is organised as follows. In the second section, a review of the literature is carried out. The following section describes the methodology used, questionnaire and measures, as the procedures adopted in data collection and the statistical techniques used to respond to the study’s objectives are described. In the fourth section presents the results obtained, namely the sample characterisation, hypothesis validation and research question. Finally, the conclusions are drawn, and the limitations of this study are mentioned.
Literature Review
Numerous studies have sought to explain and characterise video streaming consumption in recent years. Its facet of excessive consumption, the so-called binge-watching, has been privileged, seeking to define and quantify, if possible, the phenomenon. One of the first proposals was put forward by McNamara (2012), who suggested a minimum consumption in duration and number of episodes. The problematic application of this concept and the fact that most studies used a self-reported variable led to the need to find a more operational criterion, giving rise to a metric of ‘three or more episodes at once’. The studies by Pittman and Sheehan (2015), Schweidel and Moe (2016), Trouleau et al. (2016) and Merikivi et al. (2018) contributed to shaping this criterion. More recently, Anghelcev et al. (2022) suggested the more realistic hypothesis of considering different consumption levels, differentiating non-binge-watchers from regular binge-watchers or heavy binge-watchers. Most of these works were mainly concerned with investigating the main factors at the origin of the binge-watch phenomenon, such as personality traits, other psychological factors or even motivation, in which entertainment, relaxation and fantasy and fandom phenomena are highlighted.
For a more systematic review of the issue, see, for example, Flayelle et al. (2020) and Starosta and Izydorczyk (2020). Other authors go a little further, exploring the potential addictive nature of the phenomenon, seeking to identify risk consumers, which would be of particular importance for the prevention of mental disorders or social problems, as well as allowing for a better understanding of this excessive consumption behaviour. This is the main objective of the work by Ort et al. (2021) when concluding that although consumers of TV series reveal, in general, low levels of a behaviour, identified by the authors, as problematic, this trend could be reversed as the frequency of binge-watching increases. However, the results of the study suggest that consumers identified as ‘regular’ cannot be characterised by problematic or even addictive behaviour.
A reference should be made to the study by Lüders et al. (2021), which, in a broader sense, seeks to analyse the profile of the streaming consumer, choosing the particular cases of music (Spotify) and TV (Netflix). The analysis was carried out based on the Norwegian reality, aiming to assess the extent to which the two types of consumers differ: in terms of TV consumption, it is younger men with higher income who seem to be more frequent streaming consumers, whereas concerning streaming music consumption, age and gender are both explanatory and significant factors that lead to more frequent consumption compared to non-streaming users.
The demographic analysis by Nagaraj et al. (2021) found that the younger generation was more willing to subscribe to SVoD services. In contrast, education was negatively related to willingness to subscribe. As one’s educational qualifications increased, the familiarity and awareness of technology and innovations also increased. With the increasing need for convenience, interactive features and widespread global content, over-the-top (OTT) services are highly appealing to the educated class of society. Also, the educated working class gets entertainment on their devices, saving time in their already busy schedules. Occupation also emerged as one of the important demographic factors in determining willingness to subscribe. Consumers from public sector jobs have more leisure time when compared to private sector employees, so they show greater willingness to subscribe to SVoD services. Although it is a common perception that males and females have different viewing patterns and preferences, when it comes to the choice of OTT service subscription and platform, the study found no significant influence of gender in predicting willingness to subscribe.
Despite some studies concluding that binge-watching is gender-neutral (Moore, 2015), differences appear in preferred programs—women tend to consume more dramas and comedies, while men often choose other types of content, such as science fiction (Chang, 2020). In addition, it is also important to understand the reason, beyond the more apparent socio-economic reason, why some consumers subscribe to one or more paid platforms (as is the case with Netflix) and others prefer free platforms (as is the case with YouTube). There is, therefore, a place to identify different segments of consumers either by socio-demographic characteristics or differences in the programs chosen or still which device they choose. Thus, considering the above, we propose the following research hypotheses:
H1: There is an association between socio-demographic characteristics and the type of programs consumers watch. H2: There is an association between the type of platforms where they watch and the type of programs that individuals watch.
Another aspect to remember is the type of device used to watch the series and whether the kind of series that individuals watch is associated with loneliness or social interaction. In this sense, the way they do it and with whom they watch their favourite programs are additional characteristics that distinguish the consumers. D’heer and Courtois (2016) state in their study that an increasingly saturated media environment potentially alters how viewers engage with televisual media and each other. In this respect, they address how mobile devices, such as tablets, have entered our living rooms and altered TV’s social uses and practices. They conclude that the use of mobile Internet devices in addition to the TV is integrated into our everyday TV viewing behaviour. They also report that although family members may all be watching programs in the same living room but on different devices, their conversation diminishes.
According to Rahman and Arif (2021), their study’s results indicate that most respondents use smartphones for binge-watching on Netflix. The most popular device for marathon Netflix usage among the respondents is the smartphone (65.7%), followed by laptops (45.7%) and desktop computers (43.8%). This indicates that most of the respondents prefer portability. Some surveys suggest that excessive video streaming consumption is usually a more solitary behaviour and that it may, in some cases, be associated with specific personality traits and psychological factors (Wagner, 2016; Wheeler, 2015).
A study by Evens et al. (2021) reveals that nowadays, individuals not only have more choice and control over which audiovisual content they access when (time-shifting) and where (place-shifting), but they can switch between services (platform-shifting) and select the most appropriate screen (device-shifting) to playback that content. Depending on the socio-spatial context, consumers may, for example, prefer to watch a drama series individually on a mobile phone while commuting on public transport but would cast the same series to a bigger screen while being together with friends or family. Yoo et al. (2020) analyse the addiction effects of both binge-watching and short-watching. They considered several motivation variables and concluded that social interaction significantly positively affects attitudes towards short-watching. Thus, we propose the following research hypotheses:
H3: There is an association between the type of device used and the type of program individuals watch. H4: There is an association between who individuals watch and the type of program that individuals watch.
Since we would like to know if the consumer profile is different for the TV series and medium/short length video consumers, we would like to know if the motivations like recommendations, relaxation or behaviour patterns are associated with the two kinds of programs. Several studies analysed the motivations related to video streaming consumption.
The excessive consumption of video streaming is analysed by Hasan et al. (2018), considering the impact of the recommendation system. This question is somewhat innovative since it brings to the investigation the role that the platform recommendation system can have in excessive consumption. Thus, the authors consider three significant factors likely to explain excessive consumption: motivation and psychological. And the use of the recommendation system (on sites such as YouTube and Netflix). The latter refers to a type of service included in Internet applications, which may lead to excessive use of the application in question. Despite some similarities of this service between platforms, attention is drawn to the effectiveness and quality of recommendations, which may vary from individual to individual and from platform to platform.
It is important to mention the role of recommendations, either by friends (e.g., Anghelcev et al., 2022) or through reviews and readings about series (e.g., Forte et al., 2021), which can end up influencing decisively content choices and the intensity of that consumption.
According to Limov (2020), users will rely on Netflix’s recommendation system to find foreign content more frequently than other common discovery sources, like their peers or reviewers. Evens et al. (2023) state that algorithmic platforms may direct viewers towards popular series based on their viewing behaviour, almost reducing that choice. This might not be the case for the affordances categorised under the ‘Modality’ umbrella, which instead seem to describe the technology.
Concerning motivation, and among several possible explanations, entertainment and relaxation stand out, or even, on a smaller scale, the attempt to escape everyday problems or other negative emotions. In the results obtained in the study of Castro et al. (2021), relaxation was the main motivation for watching Netflix at the end of the day. Ort et al. (2021) conclude that relaxation and entertainment are unproblematic and rather recreational motives regardless of binge-watching frequency. Also, Khan (2017) concludes that the strongest predictor for liking and disliking YouTube videos was the relaxing entertainment motive; commenting and uploading were strongly predicted by the social interaction motive, and the information-giving motive anticipated sharing. The results of the study by Yoo et al. (2020) demonstrate that media audiences show different motivations towards the tendency of binge-watching and short-watching. As Camilleri and Falzon (2021) concluded, their study’s research participants sought emotional gratification from the streaming technologies. As referred by the authors, they probably allowed them to relax in their free time. Other theoretical underpinnings reported that individuals use certain technologies to distract themselves into a better mood. Thus, we propose the following research hypotheses:
H5: Recommendations are perceived differently by individuals who watch TV series and those who watch medium/short-duration videos. H6: Relaxation is perceived equally by individuals who watch TV series and those who watch medium/short-duration videos. H7: The consumption pattern is perceived equally by individuals who watch TV series and those who watch medium/short-duration videos.
Methodology
Questionnaire and Participants
This study collected cross-sectional data using a structured questionnaire on the Google Forms platform. A pre-test with ten individuals has been previously carried out, which led us to correct some questions. The questionnaire consists of three sections: (a) Socio-demographic data (seven questions); (b) type of video streaming, platforms, devices and with whom watch (four questions) and (c) motivation (recommendations, relaxation) and consumption pattern (eight questions). All questions are of multiple choice, and there are no open-ended questions. The questionnaire is written in Portuguese and was shared on social networks and Facebook video-streaming consumer groups between 16 June and 16 August 2022. The questionnaire takes approximately 5 minutes to complete. In the third section of the questionnaire (the questions are shown in Tables 1 and 2), we used a 5-point Likert scale (1: Strongly Disagree, 2: Disagree, 3: Neutral, 4: Agree, 5: Strongly Agree). The participants of this study are residents of Portugal, are consumers of video streaming, and are of legal age (18 years old or more). All study participants knew the study’s objective and consented in advance. In total, 496 valid responses were obtained, with no missing values: 67.3% of individuals are female, 83.5% are Portuguese, aged between 18 and 64 years old, with a mean age of 34.7 years old, 55.2% are full-time workers and 80.6% lives in urban areas.
Measures
Socio-demographic Data
In the first section of the questionnaire, questions were asked regarding gender, age groups, educational qualifications, professional situation (occupation), marital status, the environment where they live, and nationality.
Platforms, Devices and Streaming Consumers
In this section of the questionnaire, we start with the question about the kind of program we usually see: TV series (e.g., Netflix, HBO and Disney+) or medium/short length videos (e.g., YouTube, TikTok and Reels). Regarding the type of platforms used, it was asked whether they usually watch on paid or free platforms (Nagaraj et al., 2021), as well as the type of device most frequently used (Hasan et al., 2018). In this section of the questionnaire, we also have a question to find out with whom they usually watched the video streaming.
Reasons and Pattern of Consumption
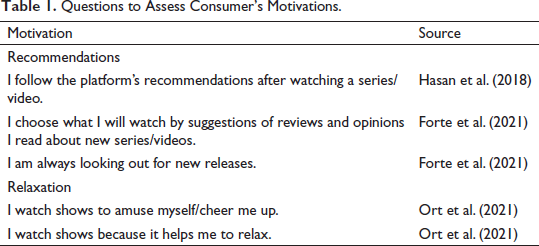
Concerning the reasons that lead consumers to watch TV series or medium/short-length videos, questions were asked about the recommendations made by the system and suggestions of reviews (Forte et al., 2021; Hasan et al., 2018). Another reason is considered as the relaxation factor, based on the work of Ort et al. (2021) but also analysed in other works, such as Hasan et al. (2018). The questions are shown in Table 1.
Questions to Assess Consumer’s Motivations.
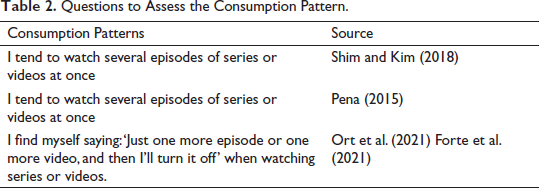
To analyse the consumption pattern of this type of consumer, the questions shown in Table 2 were posed, which are based on the work carried out by Pena (2015), Shim and Kim (2018), Forte et al. (2021) and Ort et al. (2021).
Questions to Assess the Consumption Pattern.
Data Analysis
In general terms, this study is essentially quantitative and descriptive. A questionnaire was prepared to carry out this study, and a non-probabilistic sampling technique was used. In this study, we characterised the sample using descriptive statistics measures.
To test the research hypotheses, from H1 to H4, chi-square independence tests were performed. The parametric t-tests were used to test hypotheses H5, H6 and H7, having previously used Cronbach’s alpha coefficient to analyse the internal consistency of the items used in the considered factors.
The research question, RQ, was answered using the logistic regression model, whose dependent variable, Y, assumes the value 1 if the individual watches mostly TV series and 0 if the individual watches mostly medium/short duration videos. Lee and Monsam (2018) used the logistic regression model to assess whether there is any statistical significance between Millennials’ desires to switch from traditional television services to OTT. Laban et al. (2020) used this model to explain the strategy (implicit as the reference group) according to the type of production (non-Netflix originals as the reference group) and genre (drama as the reference group). Nagaraj et al. (2021) also used this model to analyse the availability of subscribing to new OTT services or continuing with the same services, considering as independent variables socio-demographic factors such as age, education, gender, income, occupation and household structure. For all the statistical analysis of the data, the statistical software IBM SPSS 27 was used.
Results
Sample Characterisation
Table 3 presents the characterisation of the sample obtained. Table 3 shows the results’ absolute and relative frequencies (in percentage). In our sample, we have a total of 496 valid responses. Regarding the complete sample, 67.3% of the individuals are female, the majority having a bachelor’s degree or higher, 55.2% are full-time workers, 56.9% are single and 80.6% live in urban areas. Our sample comprises individuals aged between 18 and 64; only 5.8% of this belongs to the age group between 55 and 64. It should be noted that around 58.9% of users use paid platforms, 46.0% watch programs on television and 75.2% of individuals watch programs alone.
Sample Characterisation.
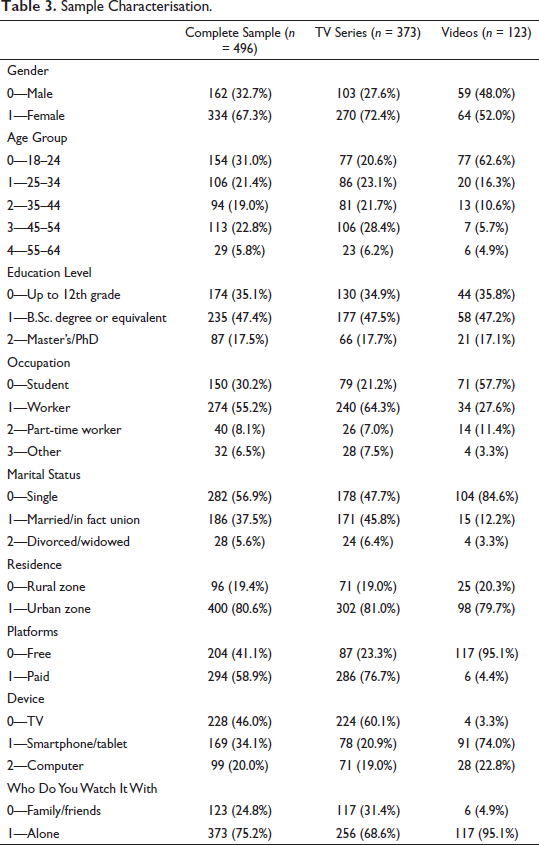
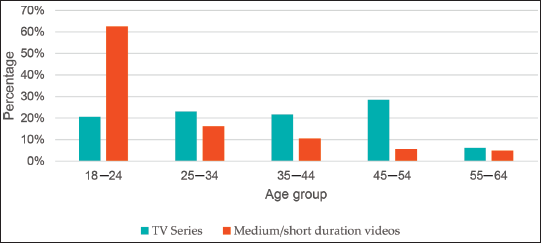
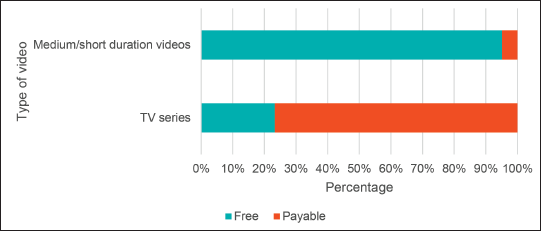
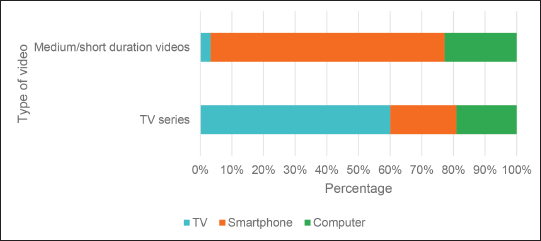
Regarding the two subsamples analysed in this study, we highlight: (a) 64.3% of individuals who watch TV series are workers, while 57.7% of individuals who watch medium/short duration videos are students; (b) Among individuals who watch TV series, 76.7% do it using paid platforms, while of individuals who watch medium/short duration videos, 95.1% do so using free platforms; (c) 60.1% of individuals who watch TV series use television for this purpose, while 74.0% of individuals who watch medium/short duration videos use their mobile phone or tablet; (c) among of individuals who watch medium/short duration videos, 95.1% do it alone, with 68.6% being the result for individuals who watch TV series.
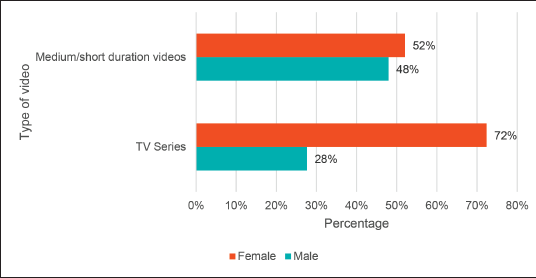
Figures 1–4 show the distribution of consumers of TV series and short/medium duration videos by gender, age group, platform type and device type, respectively.
Streamers by Gender.
Streamers by Age Group.
Streamers by Type of Platform.
Streamers by Type of Device.
Hypothesis Validation
Table 4 presents the results obtained by performing the chi-square test and the respective Cramer’s V contingency coefficient, and the latter is used to measure the intensity of the existing association between the variables.
Results of the Chi-square Test.
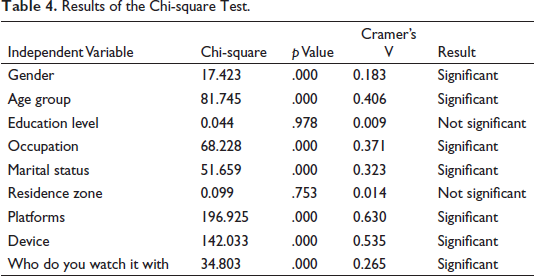
The results aim to test hypotheses H1, H2, H3 and H4. By analysing the results in Table 4, we can conclude that there is an association between the type of programs that individuals watch and the following variables: gender, age, occupation, marital status, residence zone, type of platform, device they watch on and with whom they watch with.
The education level and residence zone variables were not statistically significant with the type of programs individuals watch (p value > .05). Regarding the intensity of the association, we found that it is more significant for the variable’s platform, device and age class. Finally, we can conclude that hypothesis H1 is partially validated, and hypotheses H2, H3 and H4 are validated.
To test hypotheses H5, H6 and H7, parametric t-tests were performed for the equality of two means. The results are shown in Table 5. Previously, Cronbach’s alpha coefficient was calculated to analyse the internal consistency of the items that constitute the factors. Based on (Hair, 2010) values, we can say that the factors recommendations (3 items) and relaxation (2 items) have moderate consistency with alpha values of 0.609 and 0.673, respectively, and the factor consumption pattern (3 items) has good internal consistency, with an alpha value of 0.769.
Results of the t-Test for Independent Samples.
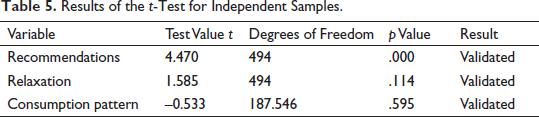
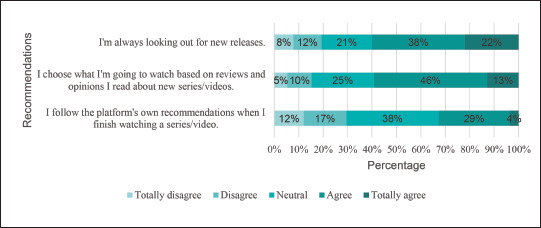
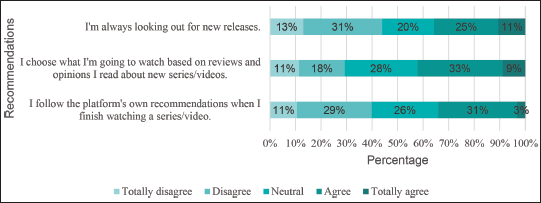
By analysing the results obtained, we can see only one statistically significant difference in the two groups of individuals’ perceptions regarding the recommendations. To better illustrate these differences, Figures 5 and 6 were elaborated. Thus, hypotheses H5, H6 and H7 are validated.
Recommendations: TV Series.
Recommendations: Short/Medium Duration Videos.
Finally, a multiple logistic regression model was estimated using the stepwise forward variable selection method to answer our research question, considering the probability of entry equal to 0.05 and removal equal to 0.10.
Table 6 presents the results of the estimated logistic regression model, which shows the estimated coefficients, B, the estimated standard errors, EP, the Wald statistic values, degrees of freedom and respective p values, the odds ratios (OR), as well as the 95% confidence intervals for the ORs.
Estimated Logistic Regression Model.
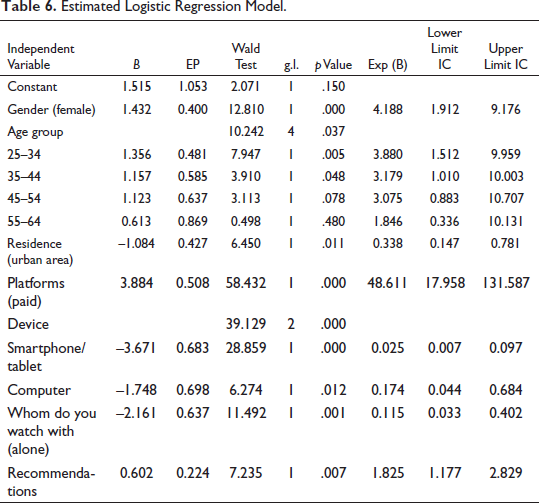
Overall, we can conclude that the variables that help to distinguish the two types of programs that individuals watch are gender, age group, residence zone, type of platforms, type of device, who they watch with, as well as recommendations.
To assess the significance of the estimated model, we used the likelihood ratio test (whose null hypothesis states that the estimated model is not significant). The observed value of the test statistic is G2 = 344.172 (p value = .000), so we can conclude that the estimated model is statistically significant. The value of the Hosmer-Lemeshow quality of fit statistic was also calculated,
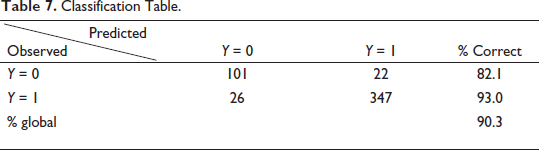
In addition to the statistics of fit quality, we present the classification Table 7, which indicates the observed and estimated values of the dependent variable under study. By analysing the results of Table 7, we can conclude that the estimated model correctly classifies 90.3% of the cases, with a specificity of 82.1% and a sensitivity of 93.0%. The previous values were obtained using a comparison value equal to 0.5.
Classification Table.
As previously stated, the estimated logistic regression model shows that seven independent variables significantly explain what distinguishes TV series viewers and viewers who watch medium/short videos: gender, age class, residence zone platforms, devices, who they watch with and recommendations.
Conclusions
The main objective of this study was to analyse the differences in consumption patterns between two consumer groups: TV series streamers and short/medium duration video streamers. For this purpose, a sample of 496 respondents aged between 18 and 64 was used.
The differences appear right away in the socio-demographic characteristics of the two groups—if, on the one hand, the TV series is watched mainly by a female and working audience, on the other hand, the medium/short duration video consumers are essentially students, with some gender neutrality. As for the way they watch, there seems to be a common pattern between the two types of consumers since both watch, as a rule, alone. Moreover, there is a clear distinction in the type of platform used: TV series streamers watch mostly on paid platforms, while video consumers do so almost entirely on free platforms.
Regarding motivation, there seems to be some homogeneity between the two groups, with relaxation being the main reason that leads them to stream. Regarding the most used device, TV series consumers watch mainly through TV (this result does not agree with the results of Rahman & Arif, 2021), while consumers of medium/short duration videos use mainly smartphones. Finally, we highlight the role played by the recommendation system, which is particularly relevant for TV series consumers.
Streaming entertainment consumption is not only a growing trend but has been undergoing rapid change, strongly enhanced by the confinement of the population due to the COVID-19 pandemic. This market seems to be undergoing rapid change, making it essential to know the profile of the target consumer of this entertainment industry. Until now, there has been an almost exclusive focus on studying excessive consumption, describing the factors that cause it and which groups are most vulnerable, to assess risks and contribute to preventing possible adverse effects on mental health, social life, etc.
As some authors have mentioned (Flayelle et al., 2020), it is essential to know what moves and explains the behaviour of most streamers, and that will be only frequent or regular consumers without additional characteristics. Knowing these differentiating characteristics (social, demographic, motivational, lifestyles, etc.) will provide information for the industry to adapt content and the logic of streaming itself to a constantly changing audience. Some affinity may even be discovered as to the motivation behind the programs consumed (music, series, videos, etc.) that the platforms have not yet explored (see the work of Lüders et al., 2021). How content is accessed, be it the computer, the smartphone or even the traditional TV set, is also crucial for ‘building’ new audiences (Burroughs, 2019). Recommendations, whether through interpersonal relationships or through the system of the platform itself, assume an important role. This issue has been given very little consideration in the literature and deserves more attention.
Our study revealed that only the system recommendation was significant, something that is not unrelated to the more ‘solitary’ profile with which the streamer watches the programs. This trend may frustrate any attempt to influence the diversification of programs that the individual watches since, according to some authors, the consumers may close themselves in a kind of ‘bubble’ since the contents recommended by the system are related to the individual history consumed (Gutzeit et al., 2021). Finally, according to the results of our study, the streamer of short/medium duration videos is young (male or female), and the streaming industry cannot ignore users of free platforms.
In sum, people now have more choices and seem to be dividing their digital entertainment options more evenly based on the kinds of value they offer. For many, digital media is entertaining and can offer utility, foster community and support emotional needs. For more people, the digital and physical are likely becoming equally real and meaningful. Generation Z is the first generation to grow up with smartphones, social media and always-on access to the internet. Their brains and behaviours are being shaped equally by the physical and digital worlds, further invoking the nascent metaverse. They may hold the keys to the future of media and entertainment.
This study thus aims to contribute to the literature on video streaming consumption since we are not aware of any studies that make this distinction between the two types of consumption to date.
Limitations
In this work, a non-probability sampling technique was used, so using a stratified sampling technique, namely by gender, age group or region of the country, is a way to enrich this study and confirm the results obtained. Another limitation of this study was that consumers were not asked about their behaviour regarding streaming consumption before, during and after the confinement period. This is a suggestion for future work. In this study, we used a multiple logistic regression model to distinguish the factors that could be associated with the consumption of TV series to medium/short duration videos, and perhaps it would be interesting for future work to use a model hedonic-motivation system adoption model (HMSAM) to study consumption of the two types of programs separately.
Footnotes
Declaration of Conflicting Interests
The authors declared no potential conflicts of interest with respect to the research, authorship and/or publication of this article.
Funding
The authors received no financial support for the research, authorship and/or publication of this article.