
Abstract
The purpose of the study is to empirically examine the sectoral-specific performance of the five-factor asset pricing model comprising of 17-years’ data in the Indian stock market using the Fama–French methodology. The results highlighted the better performance of a five-factor model in the “Basic Material” and “Oil” industries. However, for the “consumer” industry, there is an existence of other risk factors which can better explain the portfolio’s excess returns. The result further demonstrates the better explanatory power of the five-factor model in explaining the portfolio excess return for the “Industrial” sector. However, the findings support the better applicability of market mode for the “financial” sector in the Indian stock market. For the “Health Care” and “Technology” industries, the addition of two more risk factors does not lead to much improvement in the model’s explanatory power. The current study evaluating the applicability of the asset pricing model will have a practical implication for portfolio managers, policymakers, researchers, and academicians in evaluating the performance of the portfolios on a sectoral basis and in determining the cost of equity in the overall cost of capital. The study will also aid the investors in their investment decision-making by helping them to identify the average stock return in different sectors.
Introduction
Financial management revolves around various decisions, particularly, capital budgeting, capital structure, and dividend decisions. The cost of equity is considered as a heart or a center point of attraction for all these decisions. Thus, the correct estimation of the cost of equity is crucial in order to make vital decisions like whether to invest in a particular company or not or whether to undertake a particular project or not. The correct estimation of equity is vital for both the companies as well as for the investors. In the finance literature, there is an existence of various model which can assist in the calculation of the cost of equity. One such prominent model to calculate the cost of equity is Capital Asset Pricing Model (CAPM). The CAPM was introduced in the 1960s by Treynor (1961), Sharpe (1964), Linter (1965), and Mossin (1966) depicting the direct and linear relationship between the security’s expected return and market risk. CAPM was considered as a follower of modern portfolio theory which was introduced by Harry Markowitz in 1964. The theory investigates the relationship between the financial asset’s risk and expected return. In continuation of Harry Markowitz’s theory, CAPM attempts to capture the relationship between the expected return and market risk. Failure of CAPM in capturing the security’s expected returns has led to the development of alternative versions of CAPM such as zero beta version of CAPM, consumption-oriented CAPM, and multi-beta CAPM. The introduction of multi-beta CAPM by Ross (1976) in the 1980s has led to the development of a plethora of research specifying the presence of various other risk factors which can explain the security’s expected returns. Thus, in order to improve the explanatory power of the model, various asset pricing models have been empirically developed and tested by the researchers. But the end of the 20th century marked the arrival of one of the famous multifactor models called the Fama–French three-factor model. Fama and French (1993) included market, size, and value risk factors. But the failure of the three-factor model in capturing the anomalies such as accrual anomaly, profitability, and investment anomaly has led to the development of the Fama–French five-factor model which incorporates profitability and investment risk factor along with the market, size, and value risk factors (Fama & French, 2015). With the advent of the five-factor model, various research are forgoing in the finance literature with regard to the testing of the five-factor model amongst various nations. Numerous researchers have tested the empirical applicability and the explanatory power of the five-factor model in the Indian stock market. The present research tries to go one step ahead by testing the sectoral-specific applicability of one of the widely used five-factor model in the Indian stock market. The objective of the research article is to identify the risk factors which can capture the size, value, profitability, and investment risk factors amongst various sectors of India. The study also tries to shed a light that whether the five-factor asset pricing model has a sectoral orientation or not in India. Also, because of different industry characteristics, the same model may not be universally applicable across various sectors of India. Thus, findings will give an opportunity to examine the in-depth validity of the asset pricing model in India. It tries to address an important research question, that is, whether a five-factor model can explain industrial returns in India. It will also assist the portfolio managers to build a portfolio of those companies belonging to compute the industry-specific cost of capital, and thereby will help them in evaluating the performance of their sectoral-specific portfolios. The study will also assist the mutual fund managers in their investment decision-making as it helps them to identify the average stock returns in various sectors.
Literature Review
The CAPM which was introduced by Treynor (1961), Sharpe (1964), Linter (1965), and Mossin (1966) in their empirical findings independently found out that security’s expected returns are explained by market risk factor and degree of sensitivity of security return to market return is being measured by “beta” of a security. However, with the passage of time, it was found that security’s expected returns are not merely the function of the market risk factor but can also be explained by various other factors. Merton’s (1973) Intertemporal CAPM and Ross’s (1976) arbitrage pricing theories were two such models which gave a direction towards the path of the multifactor asset pricing model. Failure of CAPM to explain the size and value anomaly has led to the development of a three-factor model comprising of the market, size, and value risk factor (Fama & French, 1992). However, the three-factor model still lacked in explaining the momentum anomaly which has led to the emergence of the Carhart four-factor model. There existed a large body of literature with regard to testing of the explanatory power of the three-factor model amongst various nations. Gaunt (2004) empirically tested the applicability of size effect, value effect, and Fama–French three-factor model in the Australian stock market and highlighted the improved explanatory power of the three-factor model. The authors also highlighted the important role of the value factor in asset pricing in the Australian stock market. However, despite of recommendations from the academic world, Bartholdy and Peare (2005) found the inferior performance of a three-factor model in the U.S. stock market for the study period from 1970 to 1996. The outperformance of the three-factor model over the traditional CAPM has also been found in the Indian stock market by Bartholdy and Peare (2005). Similar evidences were being reported by Taneja (2010) and Aldaarmi et al. (2015) in the Indian and Saudi Arabian stock markets, respectively. Walid (2009) in his paper provided stronger support for the characteristic model rather than Fama–French three-factor model in explaining return dynamics of the Japanese stock market. The inferior performance of the four-factor model is also being witnessed by Nartea et al. (2009) in the New Zealand stock market. Similar evidence of the weaker performance of the four-factor model was found in the Italian stock market by Brighi et al. (2010). The period also witnessed the introduction of liquidity augmented three-factor model which is another effort being done (Chen et al., 2011) in the Chinese stock market wherein the results revealed the better explanatory power of the new four-factor model. Later on, similar evidences were quoted by Bhattacharya et al. (2020) who documented a liquidity-based asset pricing model in the Indian stock market using high-frequency data after controlling for up and down market, volatility, and effect of derivatives trading. Bhattacharya et al. (2021) further found the importance of illiquidity during periods of extreme high and low returns in the Indian stock market. Further, the existence of a large body of literature that emphasized the importance of profitability and investment risk factors in explaining the security’s expected returns has led to the development of a five-factor asset pricing model. Supported by the theoretical justification, Fama and French (2015) introduced the five-factor asset pricing model comprising of profitability and investment risk factors along with the market, size, and value risk factor. Various studies were conducted with regard to the testing of the five-factor model in various stock markets of the world (Chiah et al., 2015; Elliot et al., 2016; Huynh, 2017; Jain & Singla, in press; Khudoykulov, 2020). The availability of limited literature on the sectoral performance of the five-factor asset pricing model in the Indian stock market and inconclusive research with the regard to the five-factor model in such a market inspires us to study the sectoral-based testing of five-factor model performance in the context of Indian stock market.
The following objectives have been studied in this article:
To examine the market, size, value, profitability, and investment effect amongst various sectors of the Indian stock market. To examine the explanatory power of the three, and five-factor asset pricing model amongst the various industries.
Data and Research Methodology
Data
The study tests the sectoral-specific applicability of the five-factor model in India by considering NSE 500 companies as a broad market index for the sample period from March 2002 to June 2019. All the NSE 500 companies are categorized into various sectors namely Basic Materials, Consumer Goods, Financials, Health Care, Industrial, Oil & Gas, and Technology. Sectors particularly Consumer services, Telecommunications, and Utilities are excluded for the select sample period as the number of companies belonging to such sectors falls short for the portfolio formation purpose. The study considers the monthly stock price and accounting data of each company belonging to different sectors of India. The sector-specific data have been retrieved from the Bloomberg database. For each sector, the study further excludes companies with a negative book value of equity and market value of equity (BE/ME) ratio, with missing stock price and accounting data. For the estimation and analysis purpose, the data is being converted into monthly simple return series using the following formula:
where Rt = return on stock I for month t;
Pt = closing stock price in period t; and
Pt–1 = closing stock price in period t–1.
The stylized portfolios are formed on the basis of size (measured by market cap), BE/ME ratio, profit before tax (PBT)/BE, and growth in total assets. The study employs 91 days T-bill as a proxy for the risk-free rate of return and NSE 500 as a proxy for the market portfolio.
Methodology
The study adopts Davis et al. (2000) and Chan et al. (1991) methodology of portfolio construction. The study adopts portfolio analysis instead of individual security analysis in order to avoid measurement accuracy problems as it is difficult to estimate the betas of individual securities with high degrees of accuracy because of potential structural and cyclical changes (Fama & French, 2004). The study further adopts a single sorting procedure of portfolio formation because of the paucity of securities belonging to each sector.
For each sector, the ranking of all companies included in such sector is being made in ascending order on the basis of June-end market capitalization. The ranked sample companies for each sector have been named as P1S, P2S, P3S, P4S, and P5S. P1S portfolio consists of small size companies, while P5S constitutes stock price data of big size companies. A similar single sorting procedure is being repeated for BE/ME ratio wherein portfolios sorted on the basis of value factor have been named as P1V, P2V, P3V, P4V, and P5V. Similarly, stocks belonging to their respective sector are ranked on the basis of the PBT/BE ratio which is the proxy for the profitability factor. The portfolio sorted on the basis of profitability has been named as P1P, P2P, P3P, P4P, and P5P. Ranking in the ascending order is also being made for the formation of investment sorted portfolios. Growth in the total asset has been used as a proxy for investment which leads to the resultant portfolios, namely P1I, P2I, P3I, P4I, and P5I. All the portfolios are rebalanced on annual basis, and then monthly portfolio excess return and market index return have been calculated for the study period from July 2003 to June 2019.
For the construction of risk factors, namely SMB, HML, RMW, and CMA, the study employs a single sorting procedure. SMB risk premium has been defined and calculated as the monthly return difference between the small stock (P1S) and the big size portfolio (P5S). Similarly, the HML risk premium has been defined and calculated as the monthly return difference between the high-value (P5V) and low-value portfolio (P1V). The monthly return difference between the robust (P5P) and weak profitability portfolio (P1P) have been used for the calculation of the RMW risk premium. Similarly, the CMA risk premium has been defined and calculated as the monthly return difference between the conservative (P1I) and aggressive investment portfolio (P5I).
The relationship between the portfolio excess return and various risk factors is represented by the following:
Fama–French Three-Factor Model

where Rit means a return of portfolio i on month t, and Rf represents risk-free rate of return. SMB is the size factor, HML the value factor, RMW is the profitability factor and CMA as investment factor, while α i is defined as the intercept term and β, s, v, r and c measure the sensitivities of various factors, and e it is the error term.
Fama–French Five-Factor Model

Empirical Results
Table 1 represents the monthly excess returns of the portfolio sorted on the basis of size, value, profitability, and investment risk factors for different sectors of the Indian stock market. Except for the “oil” sector, the result indicates the higher mean monthly excess returns for the small stock portfolio in comparison to the large stock portfolios for all the sectors. This indicates the outperformance of small over the mega-stock portfolios. For the portfolio sorted on the basis of value, the mean monthly excess returns of high-value portfolios (P1V) were found to be higher than that of low-value portfolios (P1V) for all the industries except for the “Financial” and “Oil” sectors which shows a different trend pattern.
Descriptive Statistics of Portfolio Excess Returns
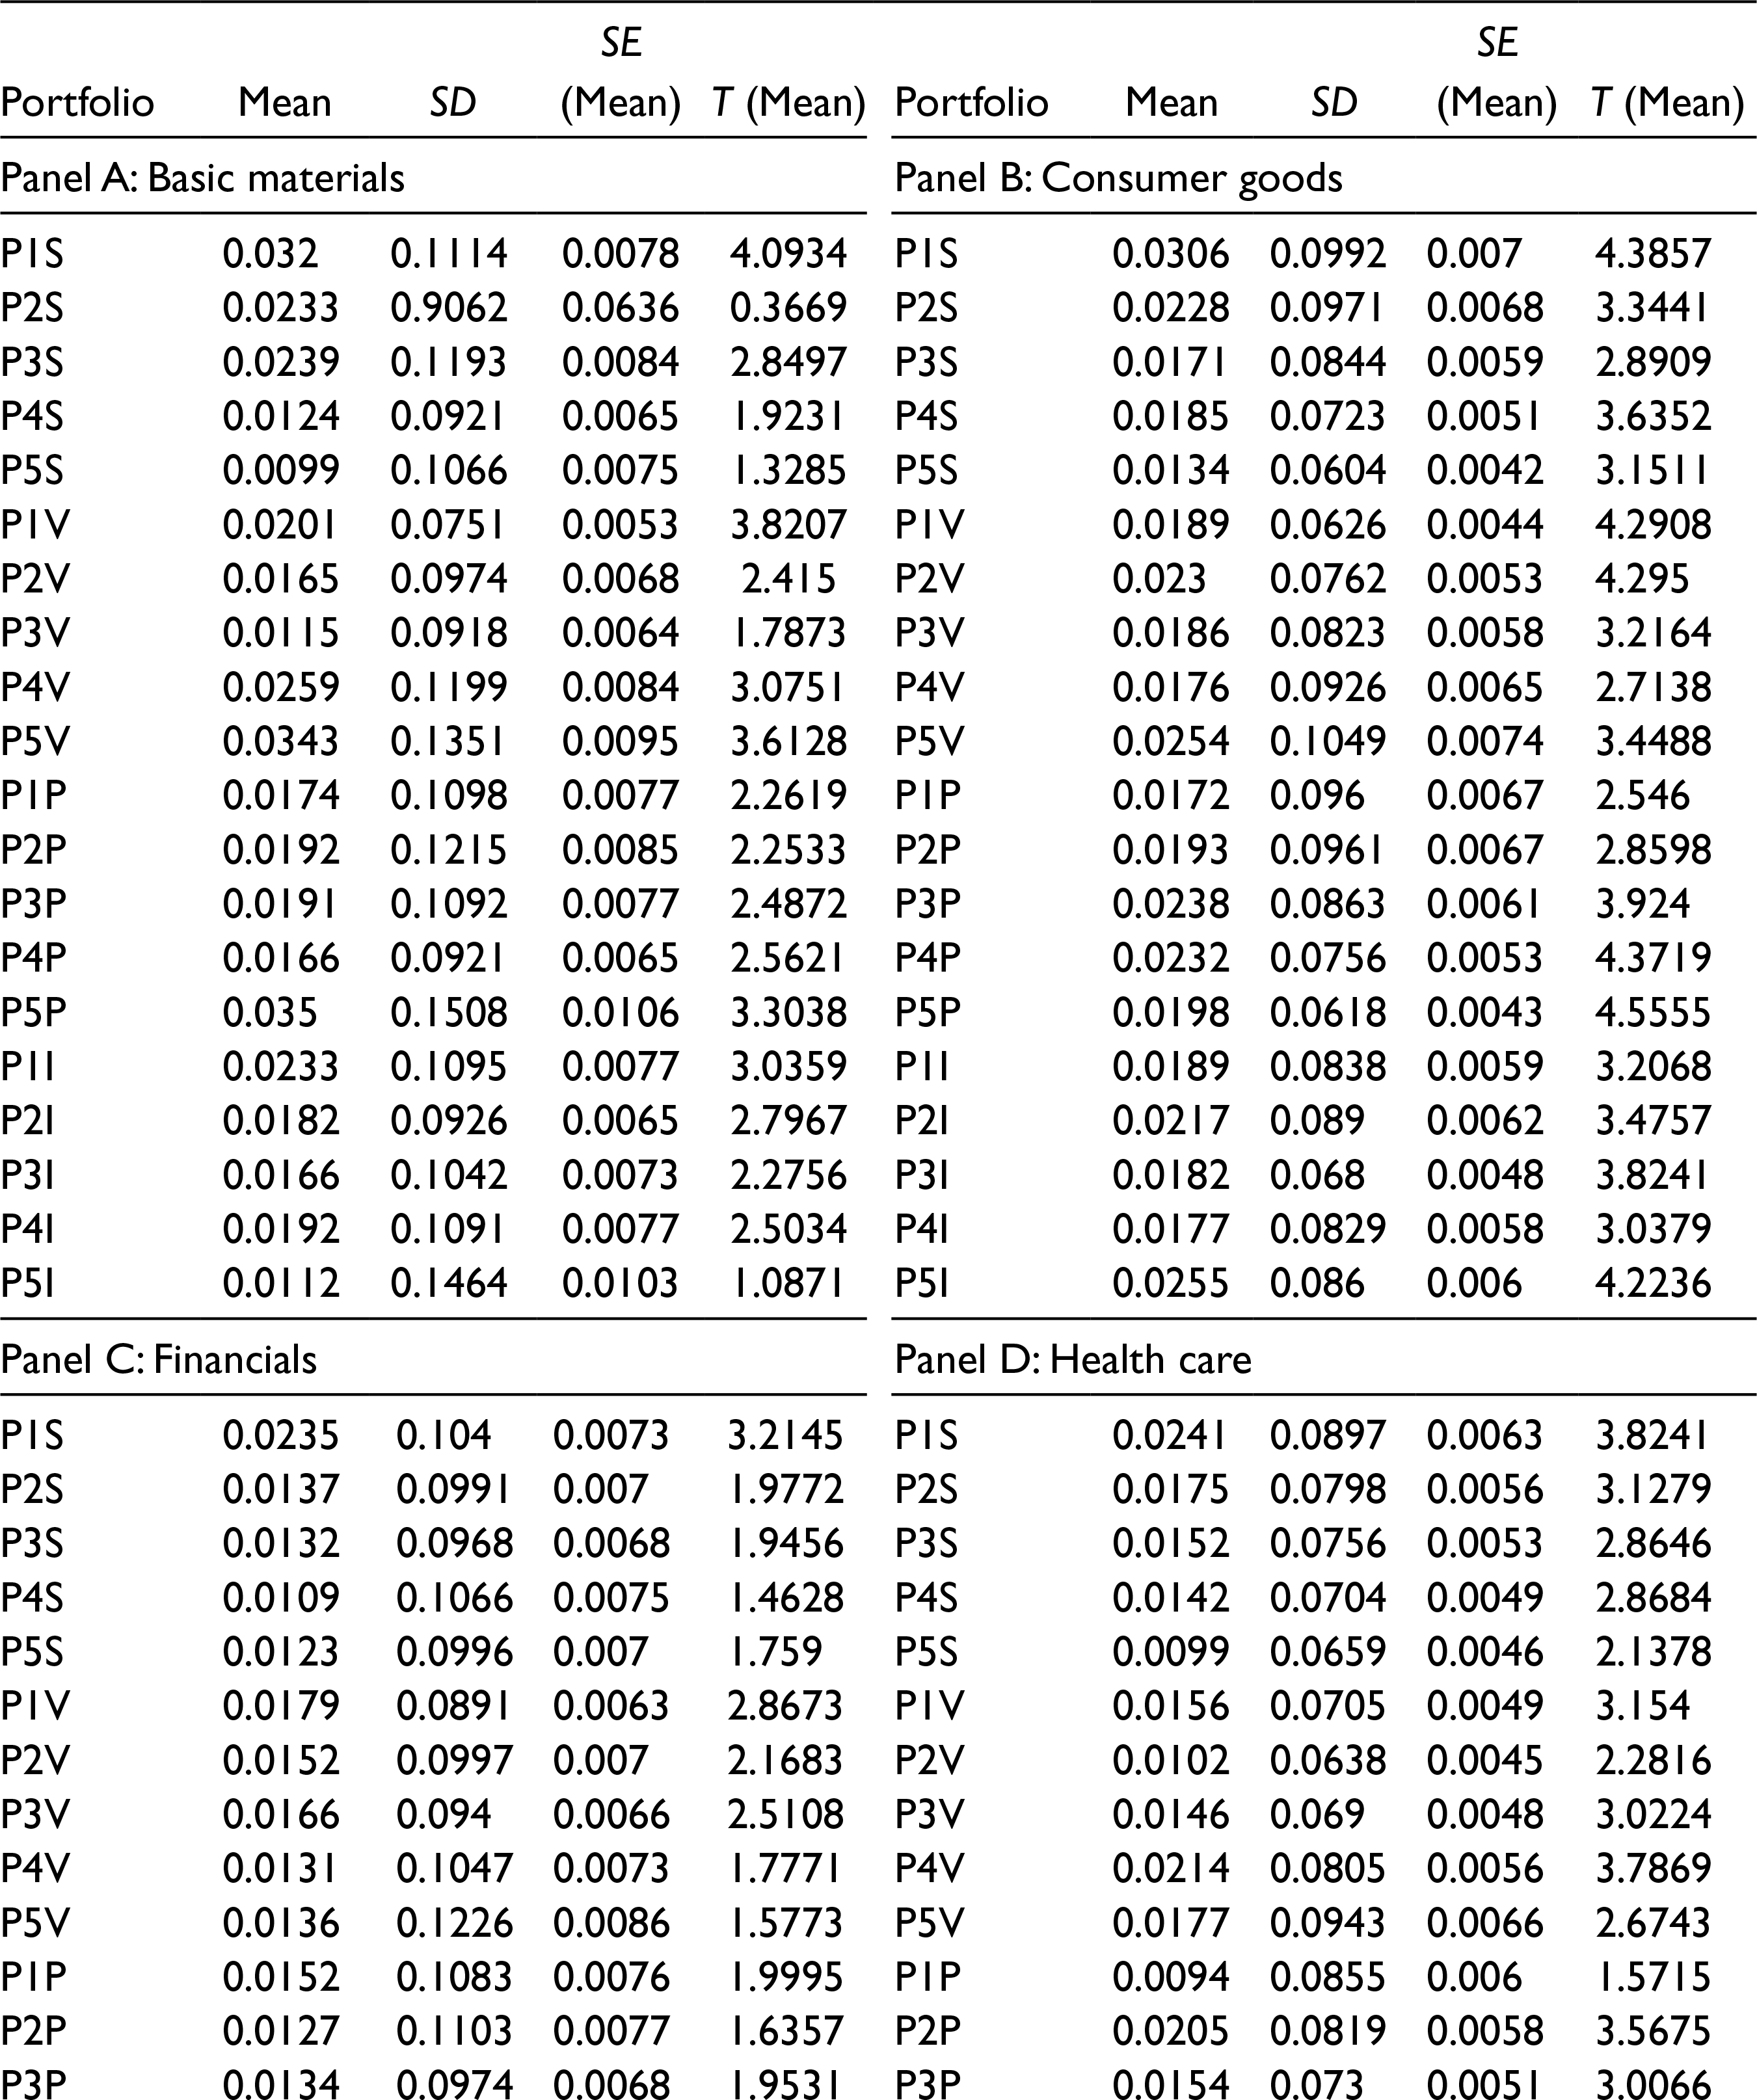
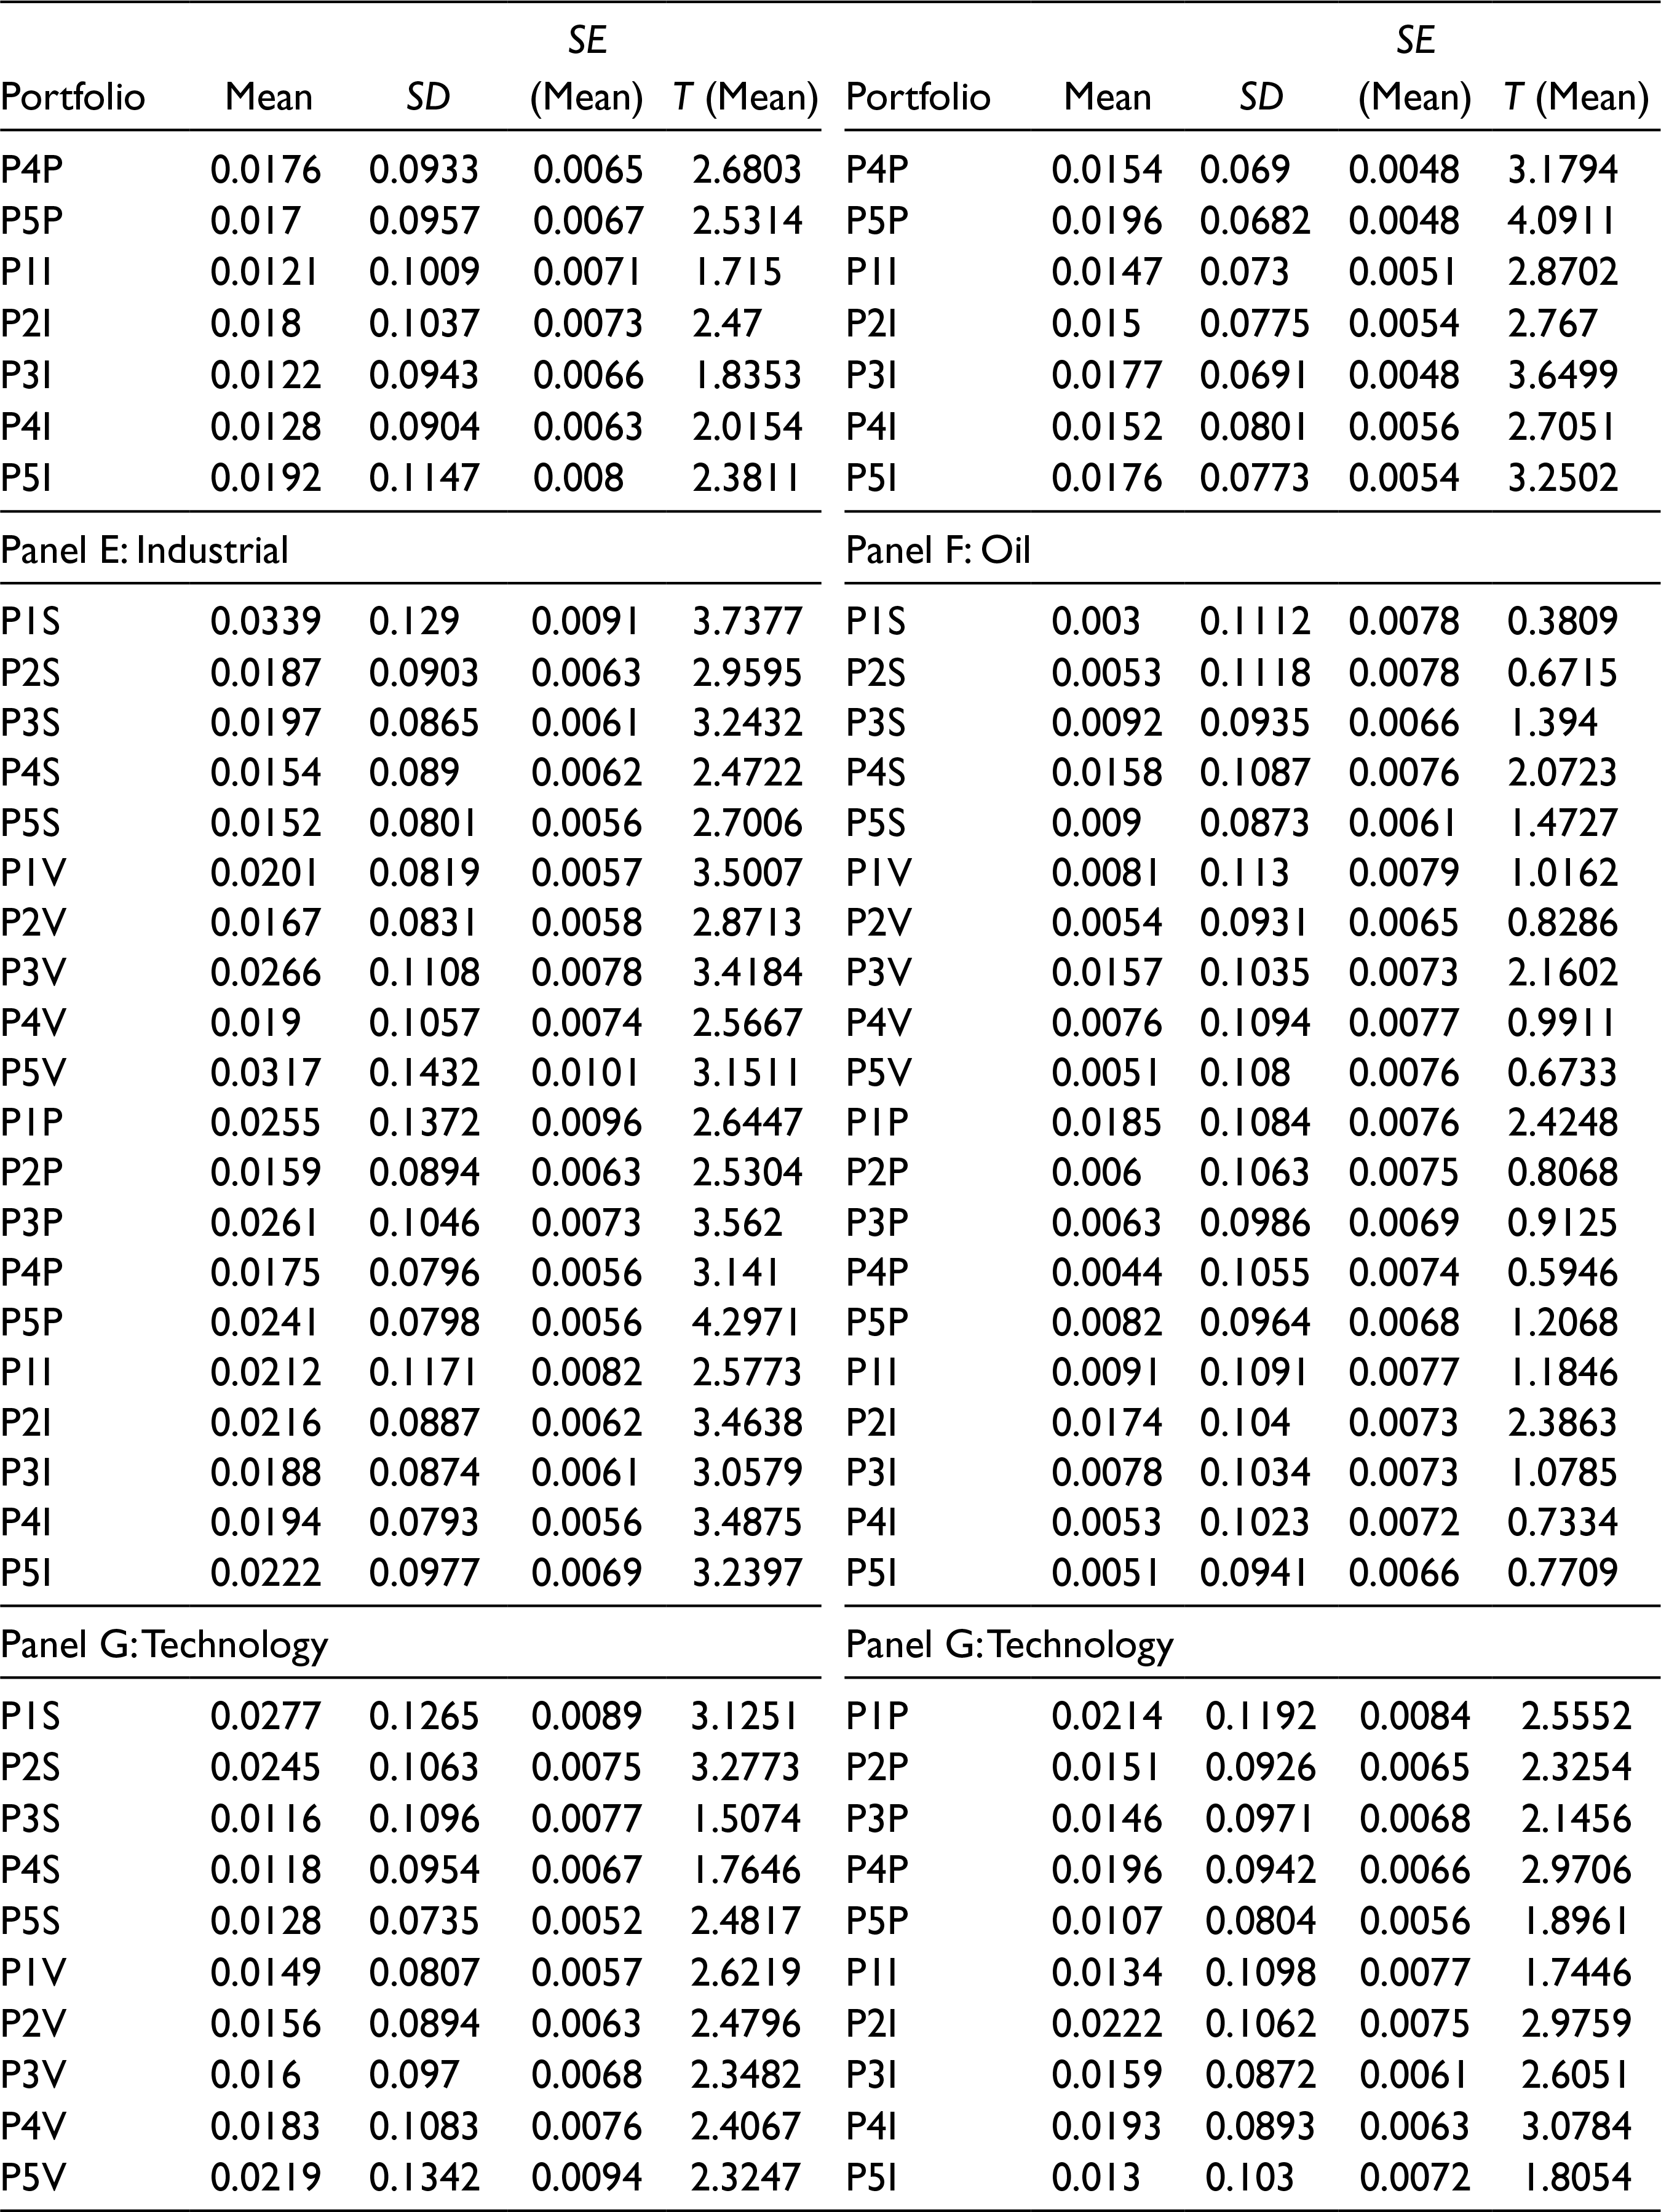
The portfolios sorted on the basis of profitability also indicate the increasing pattern of mean monthly excess returns with the increase in firm’s profitability for the majority of the sectors, particularly “Basic Materials,” “Consumer Goods,” “Financials,” and “Health Care.” However, no specific pattern is indicated in the “Industrial,” “Oil,” and “Technology” sectors. In the case of portfolios sorted on the basis of investment risk factors, the mean monthly portfolio excess return exhibits a diminishing trend with a movement from P1I to P5I for the “Basic Material,” “Oil” and “Technology” sectors. The descriptive results indicate the outperformance of conservative over aggressive investment portfolios. However, the increasing trend is witnessed for the other industries.
The results of Table 2 highlight the summary statistics of factor returns, namely market, size, value, profitability, and investment risk factors. The market premium for all the sectors is found to be 0.93% per month and is about 11.8% per annum. For the “Basic Material” industry, the SMB, HML, RMW, and CMA premiums are reported to 2.21%, 1.41%, 1.75%, and 1.22%, respectively, per month. The “Consumer Goods” industry indicated the positive size (1.72% per month), value (0.65% per month), and profitability premium (0.26% per month). However, investment premium (–0.66% per month) comes out to be negative in this industry showing a weak or no investment effect in the “Consumer Goods” industry. The descriptive results of the “Financial” sector indicate positive SMB and RMW risk premium of 1.12% per month and 0.18% per month, respectively. However, the risk premiums for the value and investment risk factors are found to be negative. In the “Health Care” sector, size, and profitability risk premium are reported to be positive and significant. The HML risk premium has also been reported to be positive (0.21% per month) but insignificant (t(mean) = 0.45). The descriptive results further reported a negative investment premium of –0.29% per month. For the “Industrial” sector, SMB and HML risk premium are found to be positive. However, RMW (–0.14% per month) and CMA risk premium (–0.10% per month) are reported to be negative for the “Industrial” sector. The “Oil” sector reports a negative SMB, HML, and RMW risk premium of –0.61%, –0.30%, –1.03%, respectively, while CMA risk premium is reported to be positive. The “Technology” sector indicates the positive SMB, HML, and CMA risk premium of 1.49%, 0.70%, and 0.04%, respectively, per month while the risk premium appears to be negative for the RMW risk factor (–1.07% per month).
Summary Statistics of Factor Returns
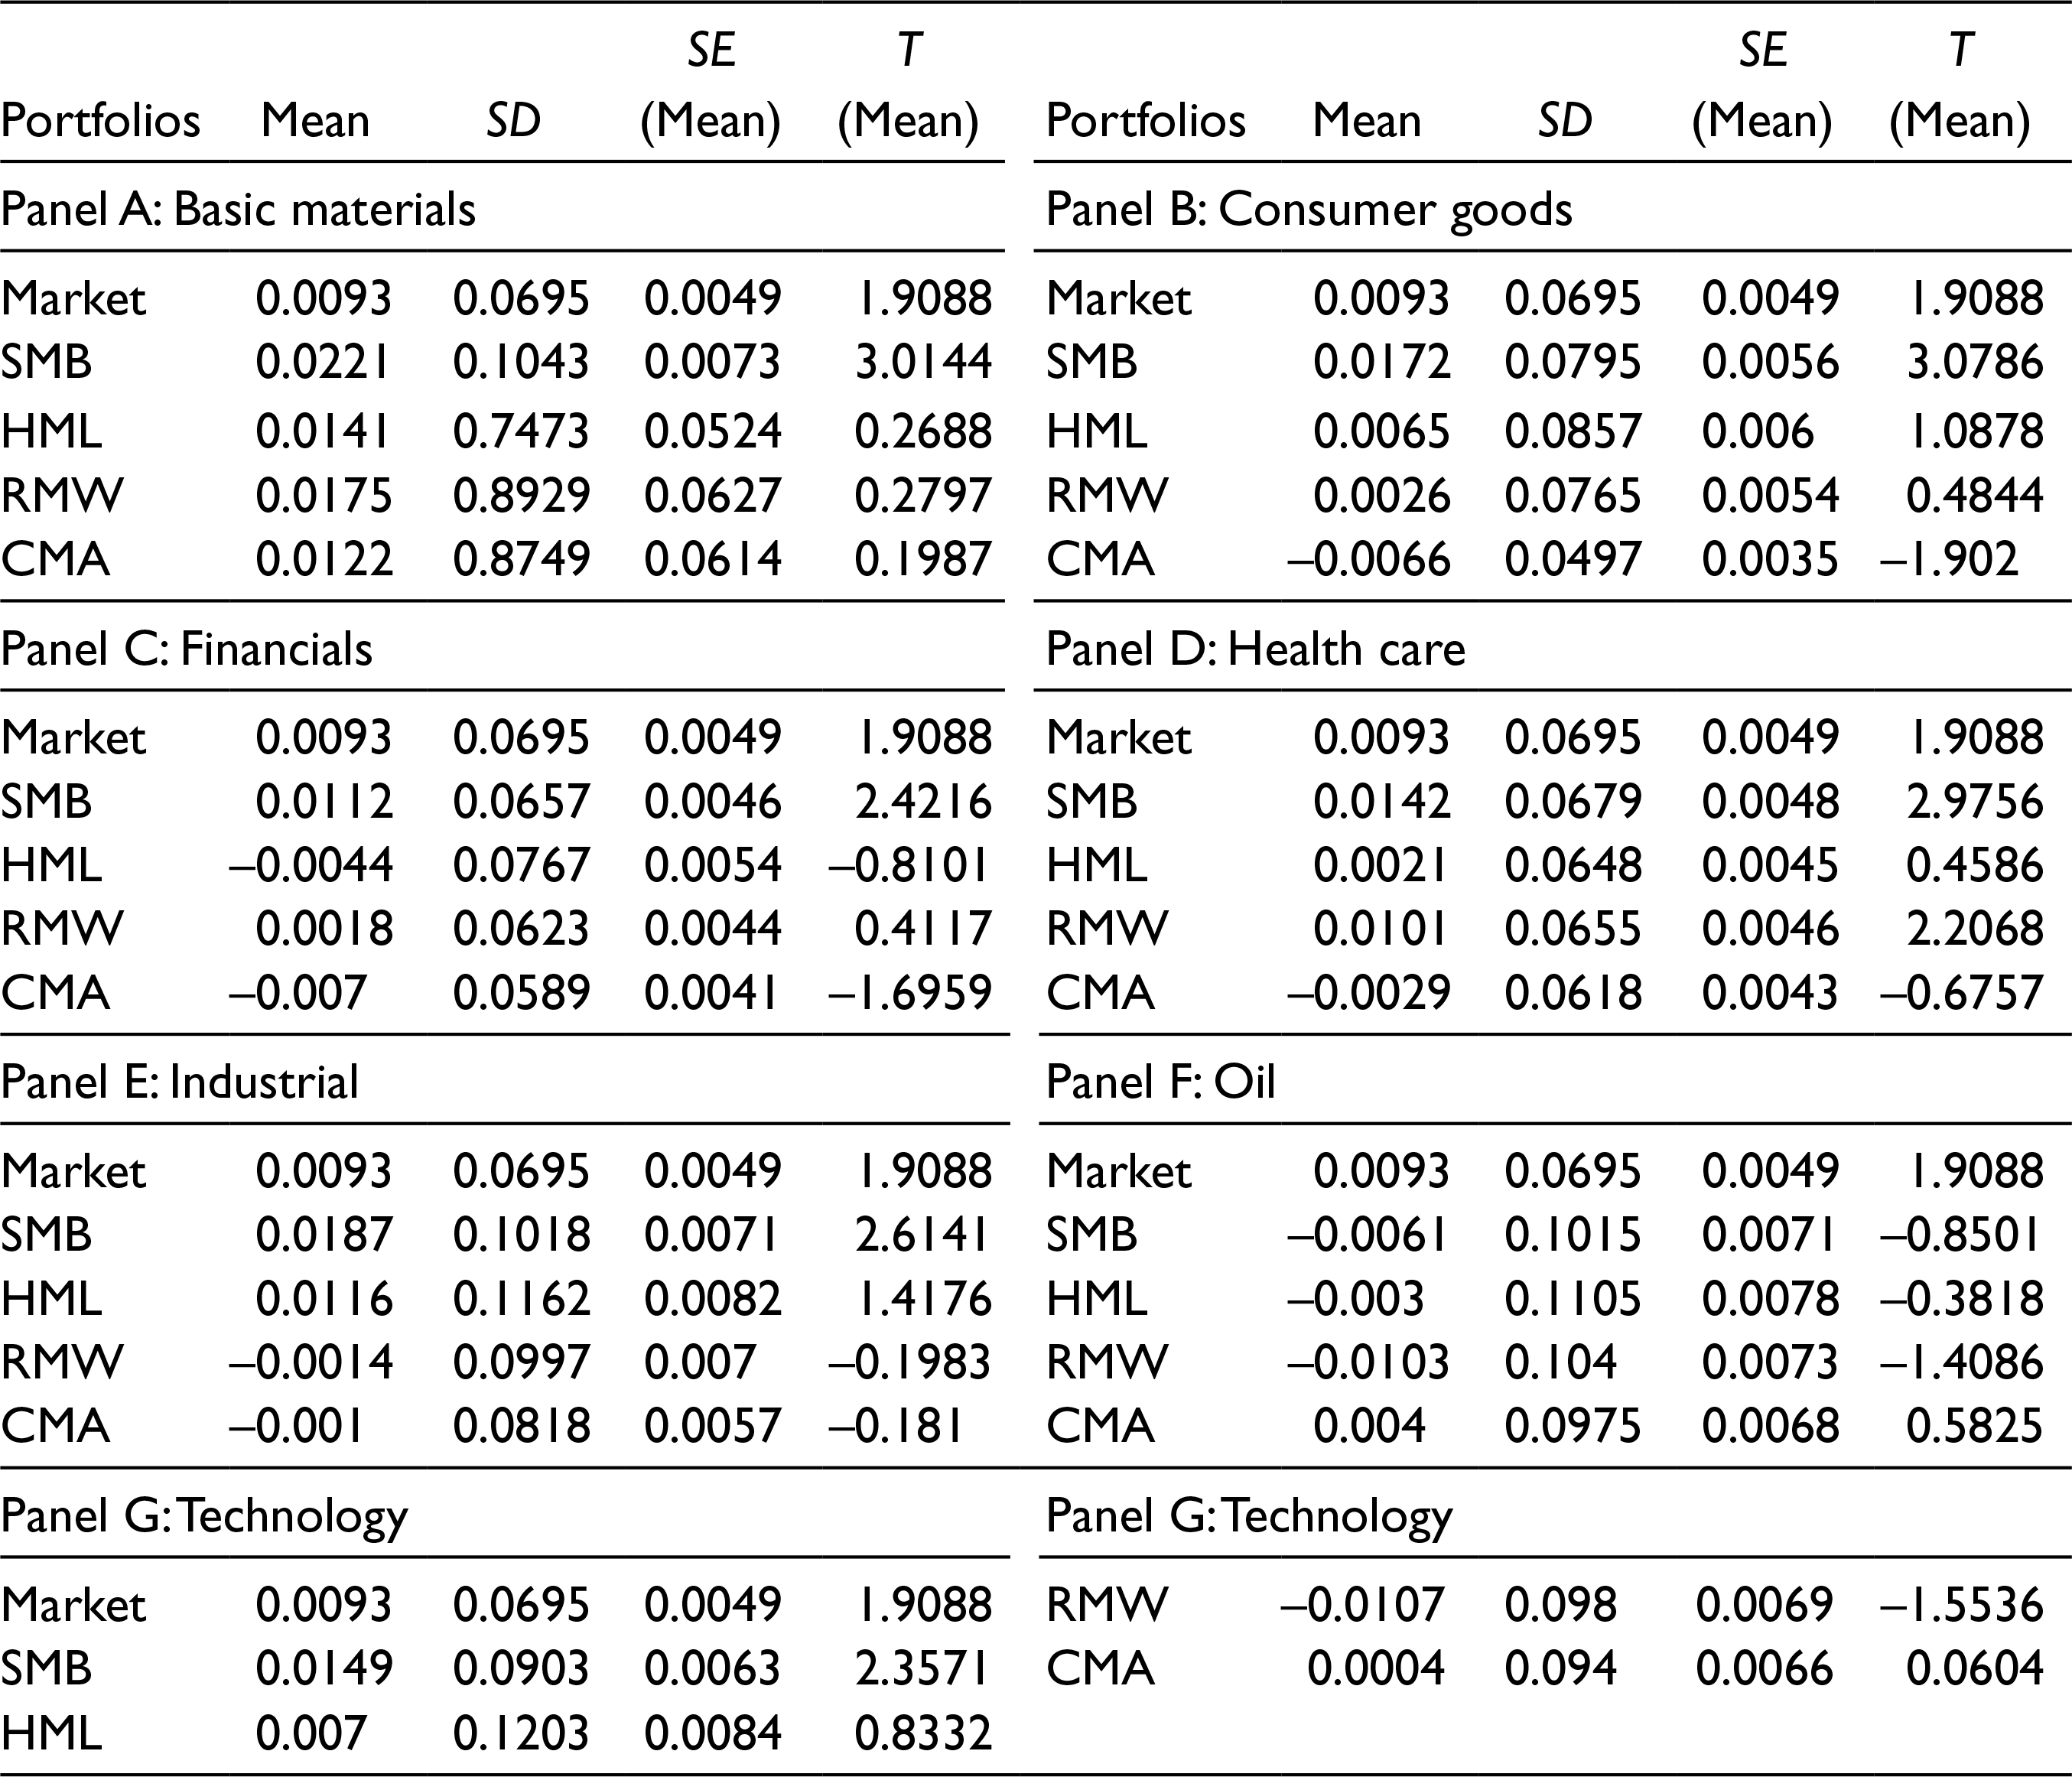
Table 3 sheds a light on the regression results of the Fama–French three-factor model. It is evident from the results that with the incorporation of two more risk factors, a significant reduction in the alpha value is being observed. The presence of positive and significant alpha denotes the possibility of other risk factors which have the capacity to affect the portfolio’s excess returns. Thus, after controlling for the market, size, and value risk factors, alpha values are found to be statistically insignificant. In terms of model performance, as indicated by the adjusted R2, the result highlights the outperformance of the three-factor over one-factor asset pricing model for the industries, namely Basic Materials, Consumer Goods, Health Care, Industrial, Oil, and Technology. The result indicated the improved explanatory power for such industries.
Regression Results of Three-Factor Model
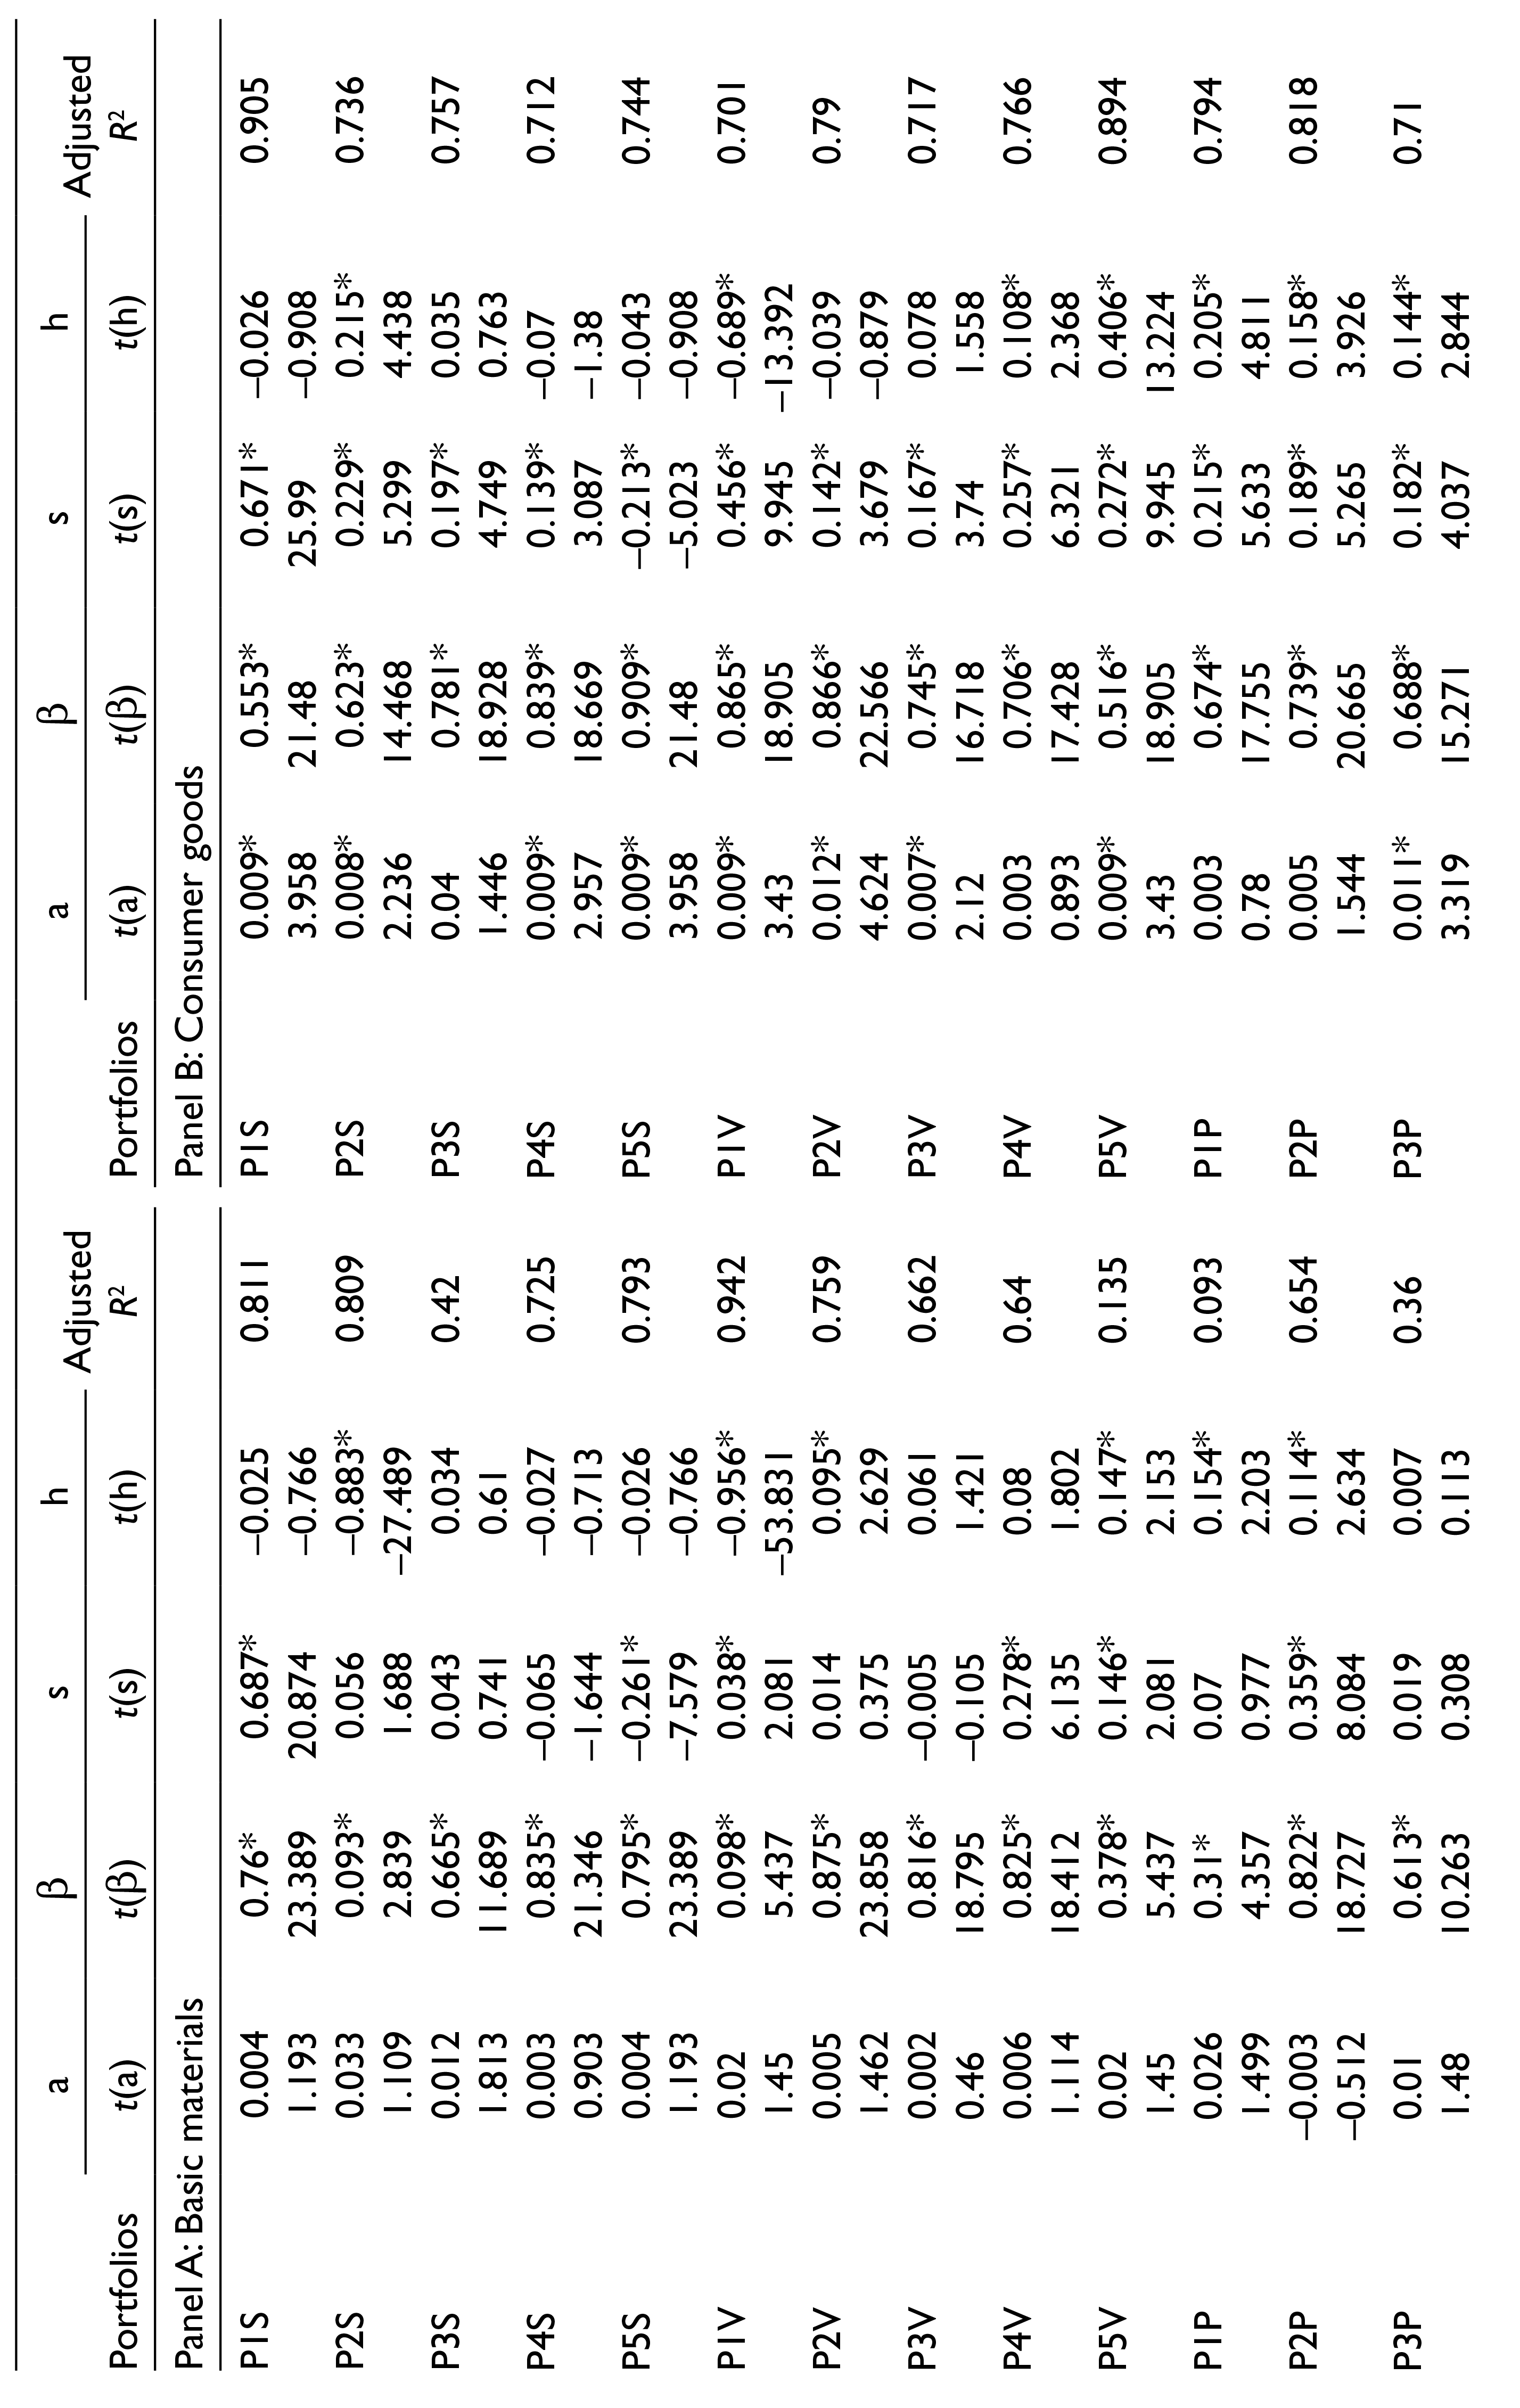
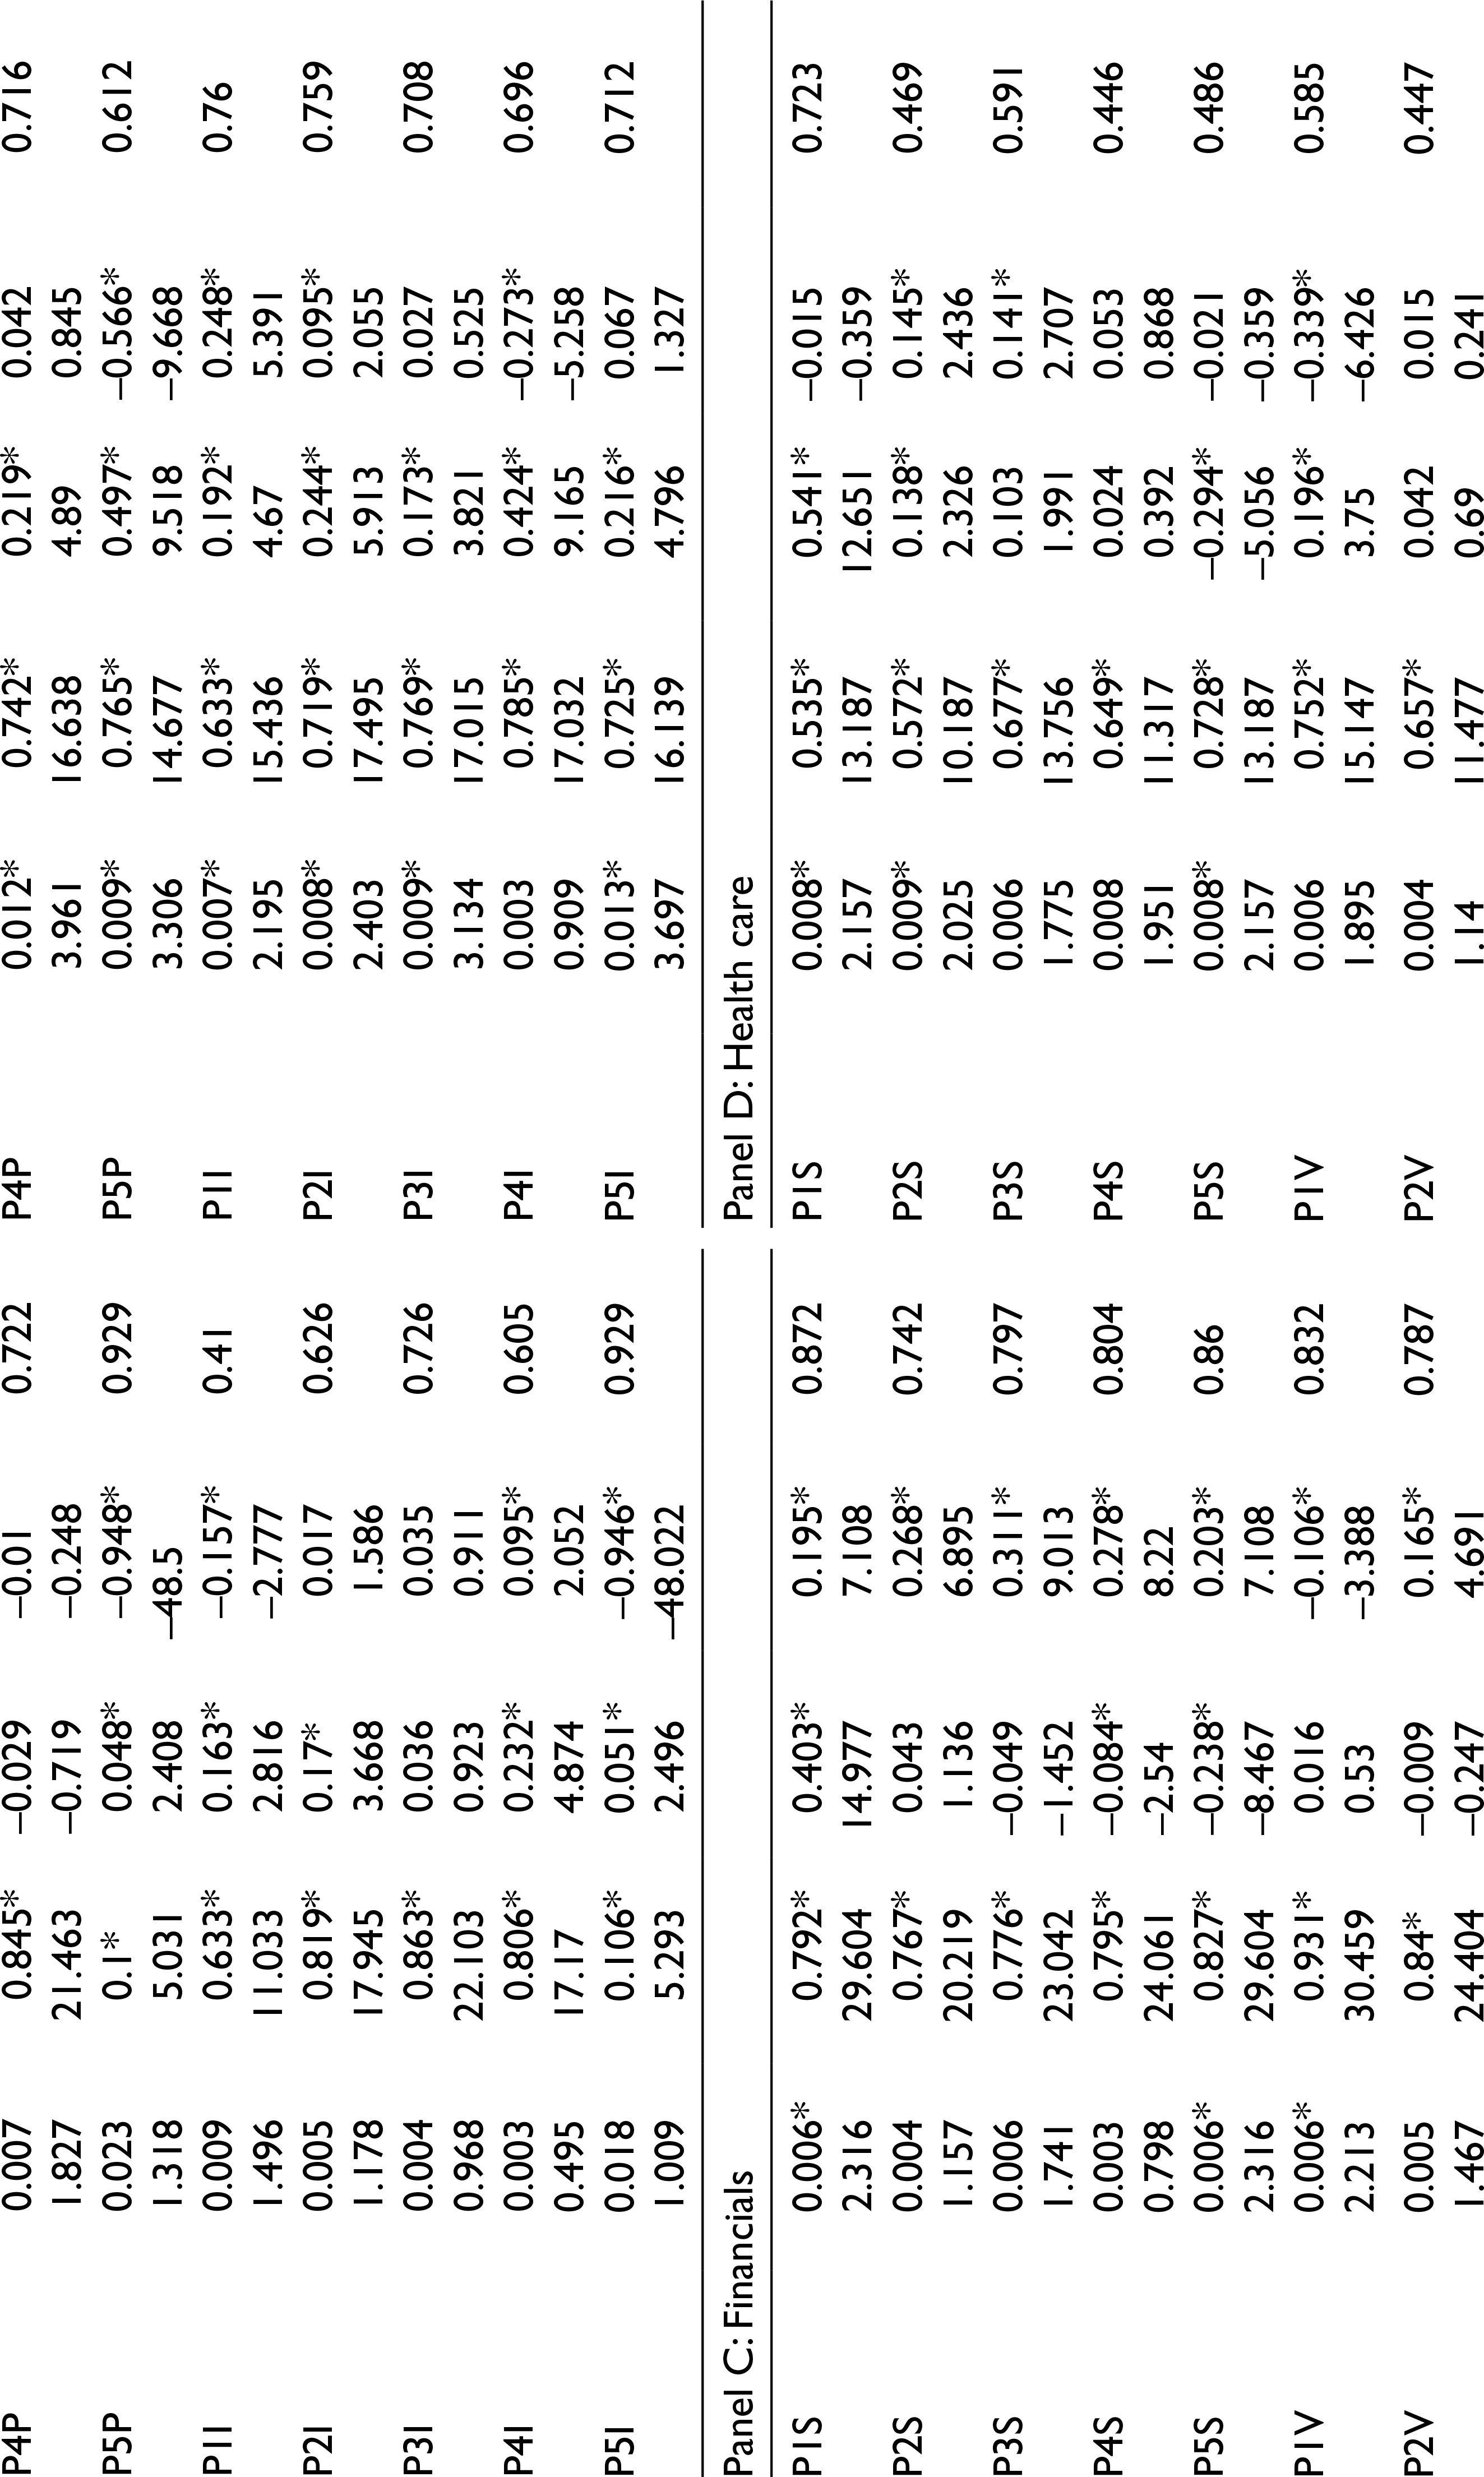
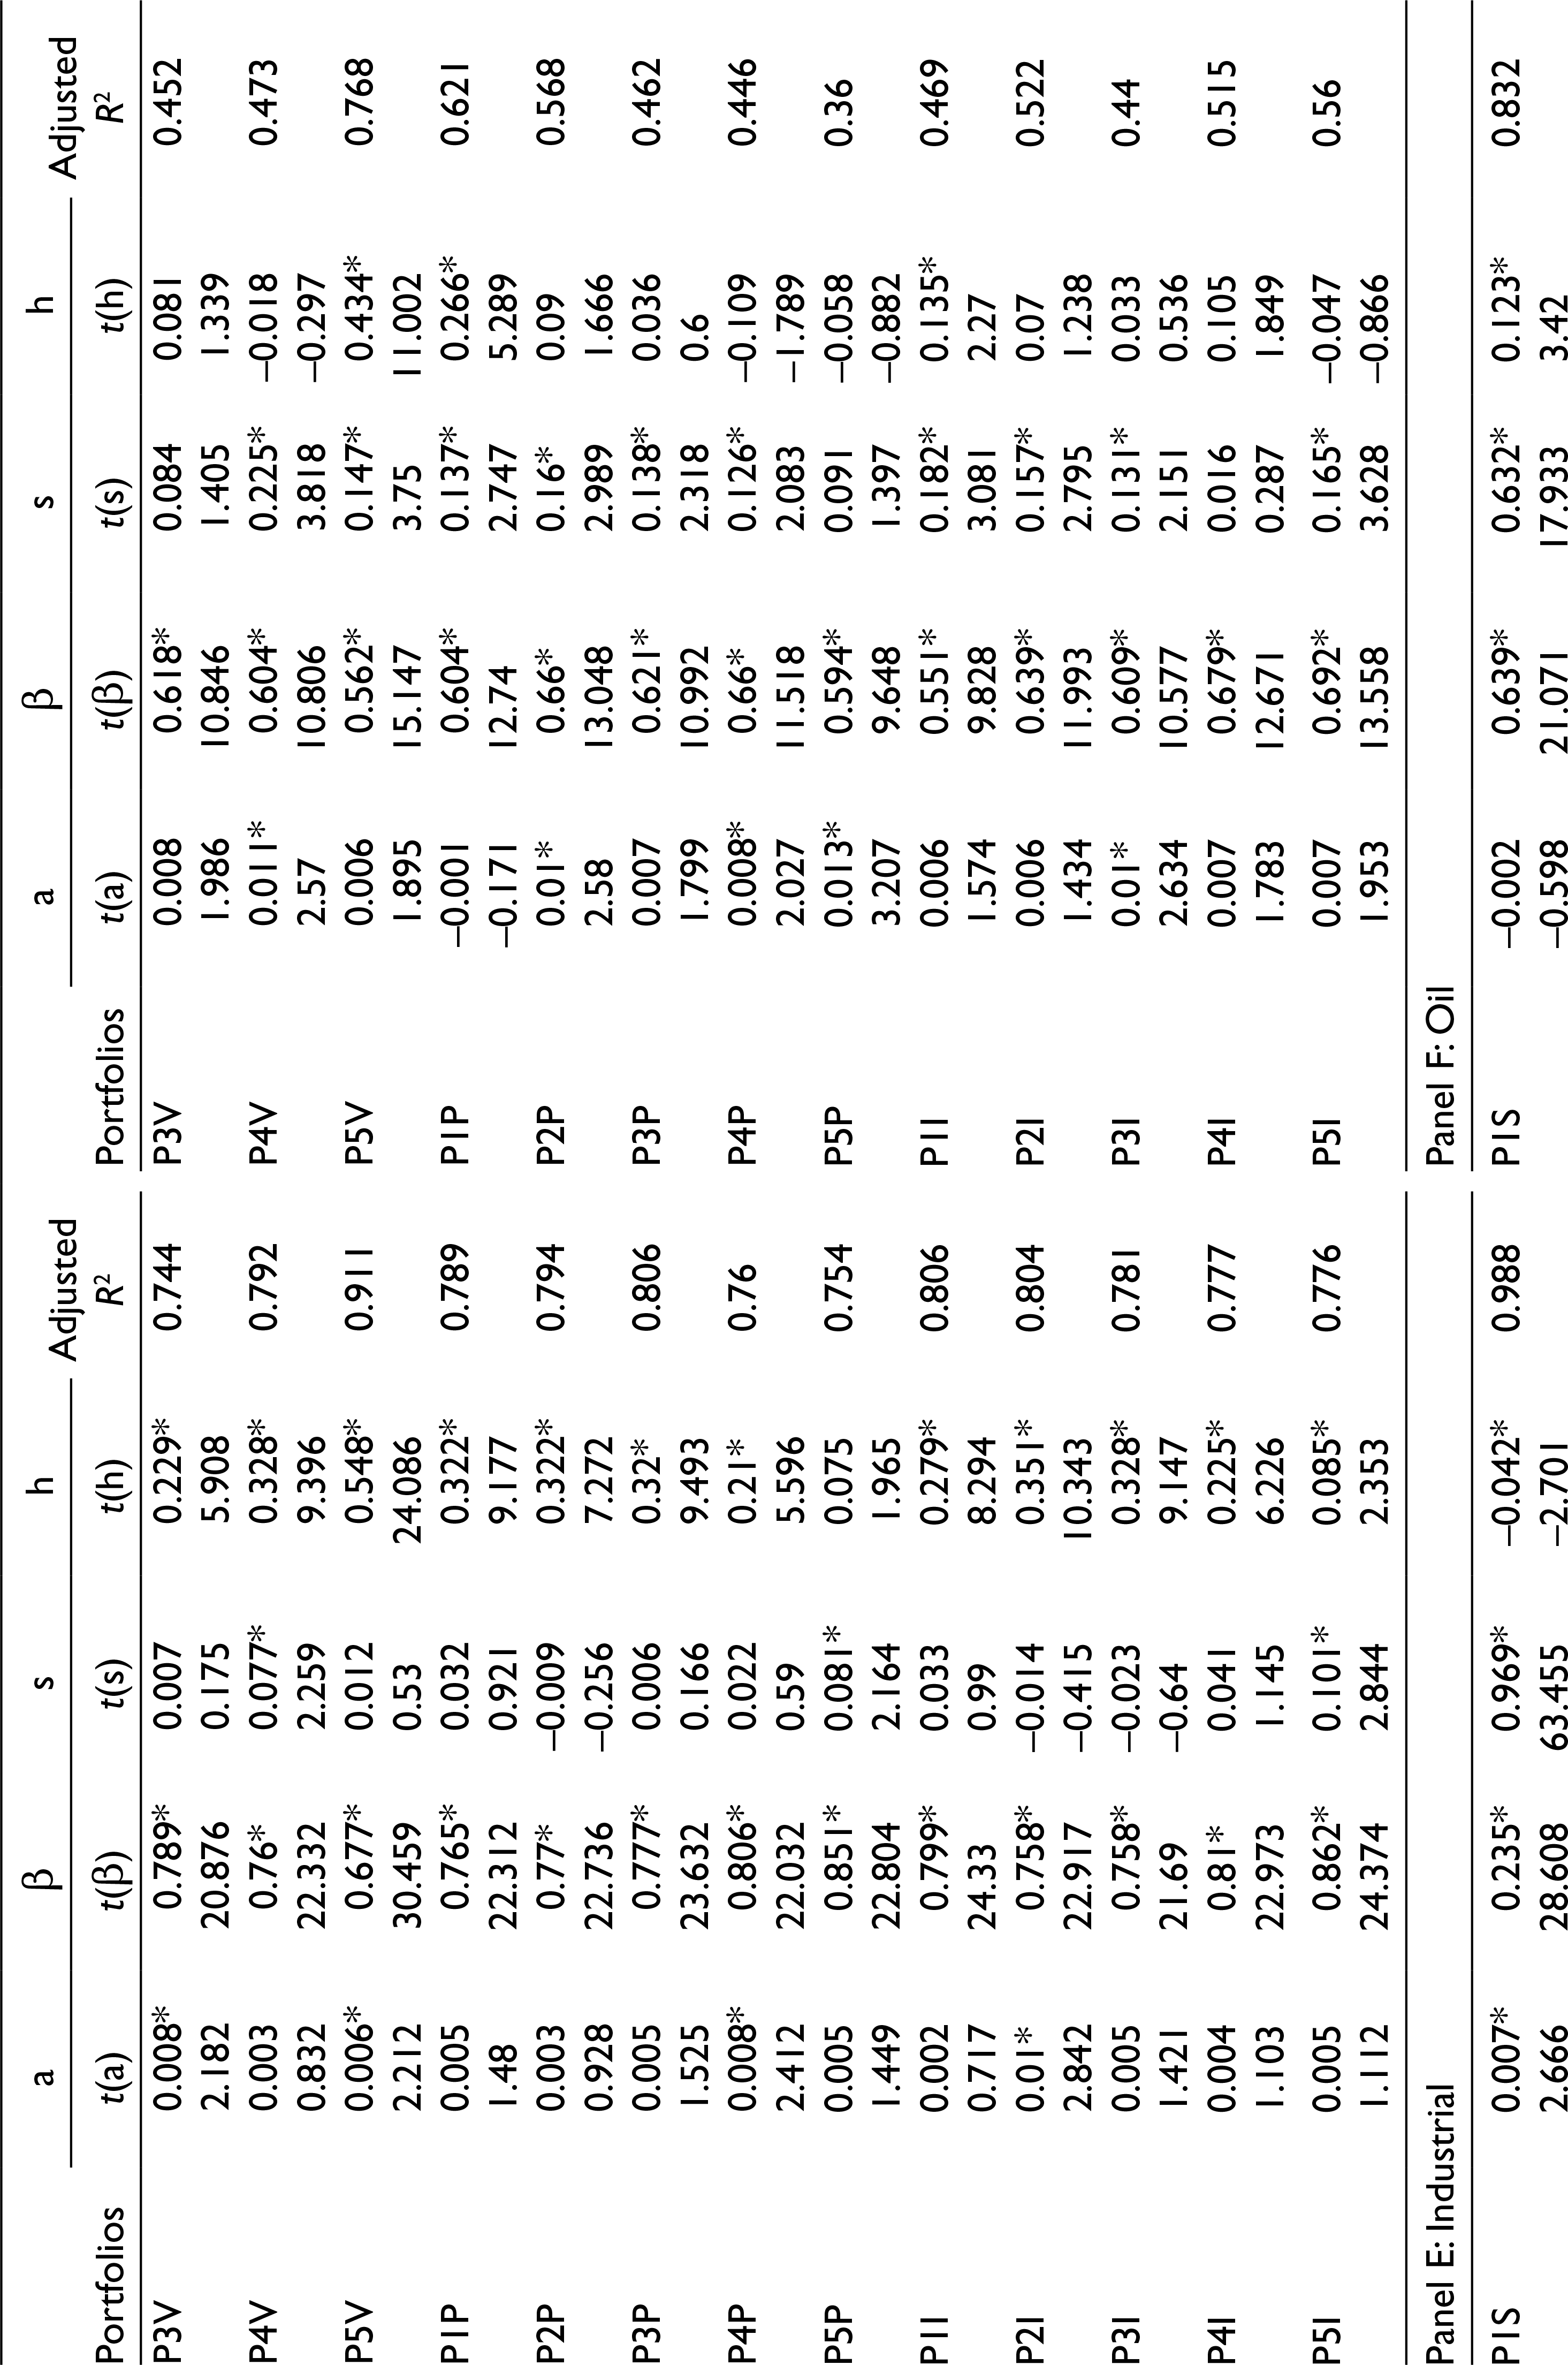
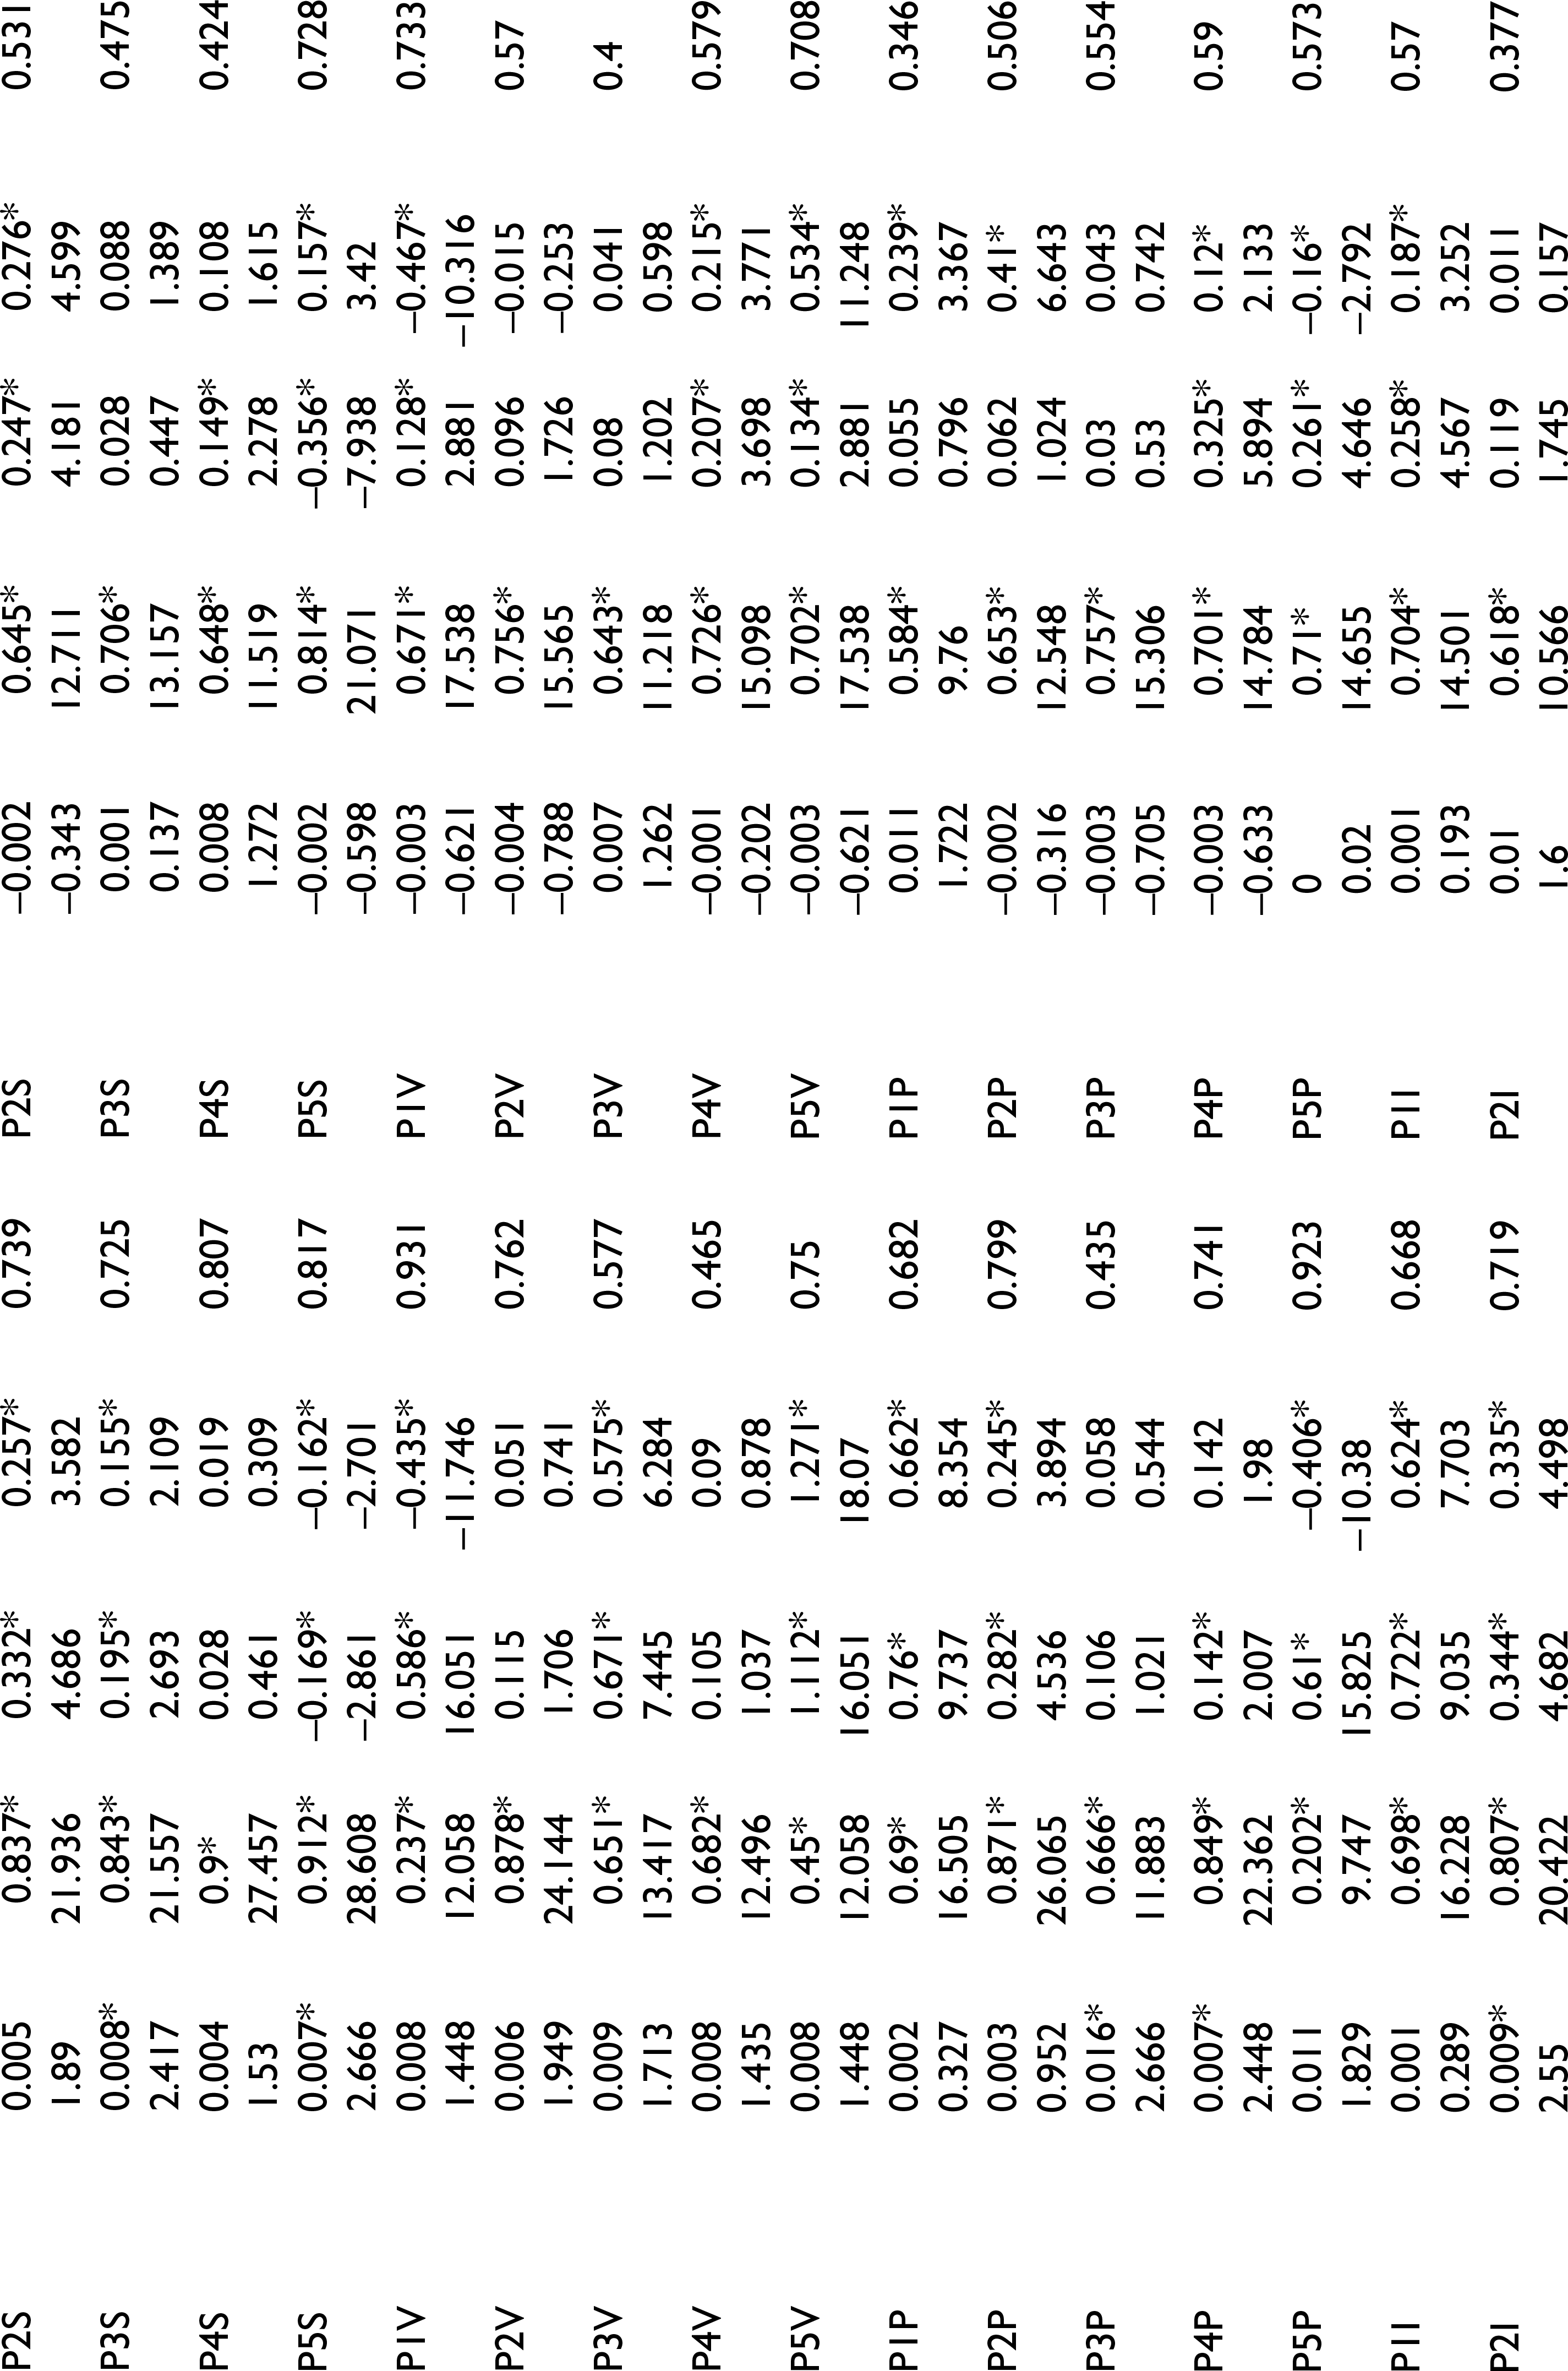
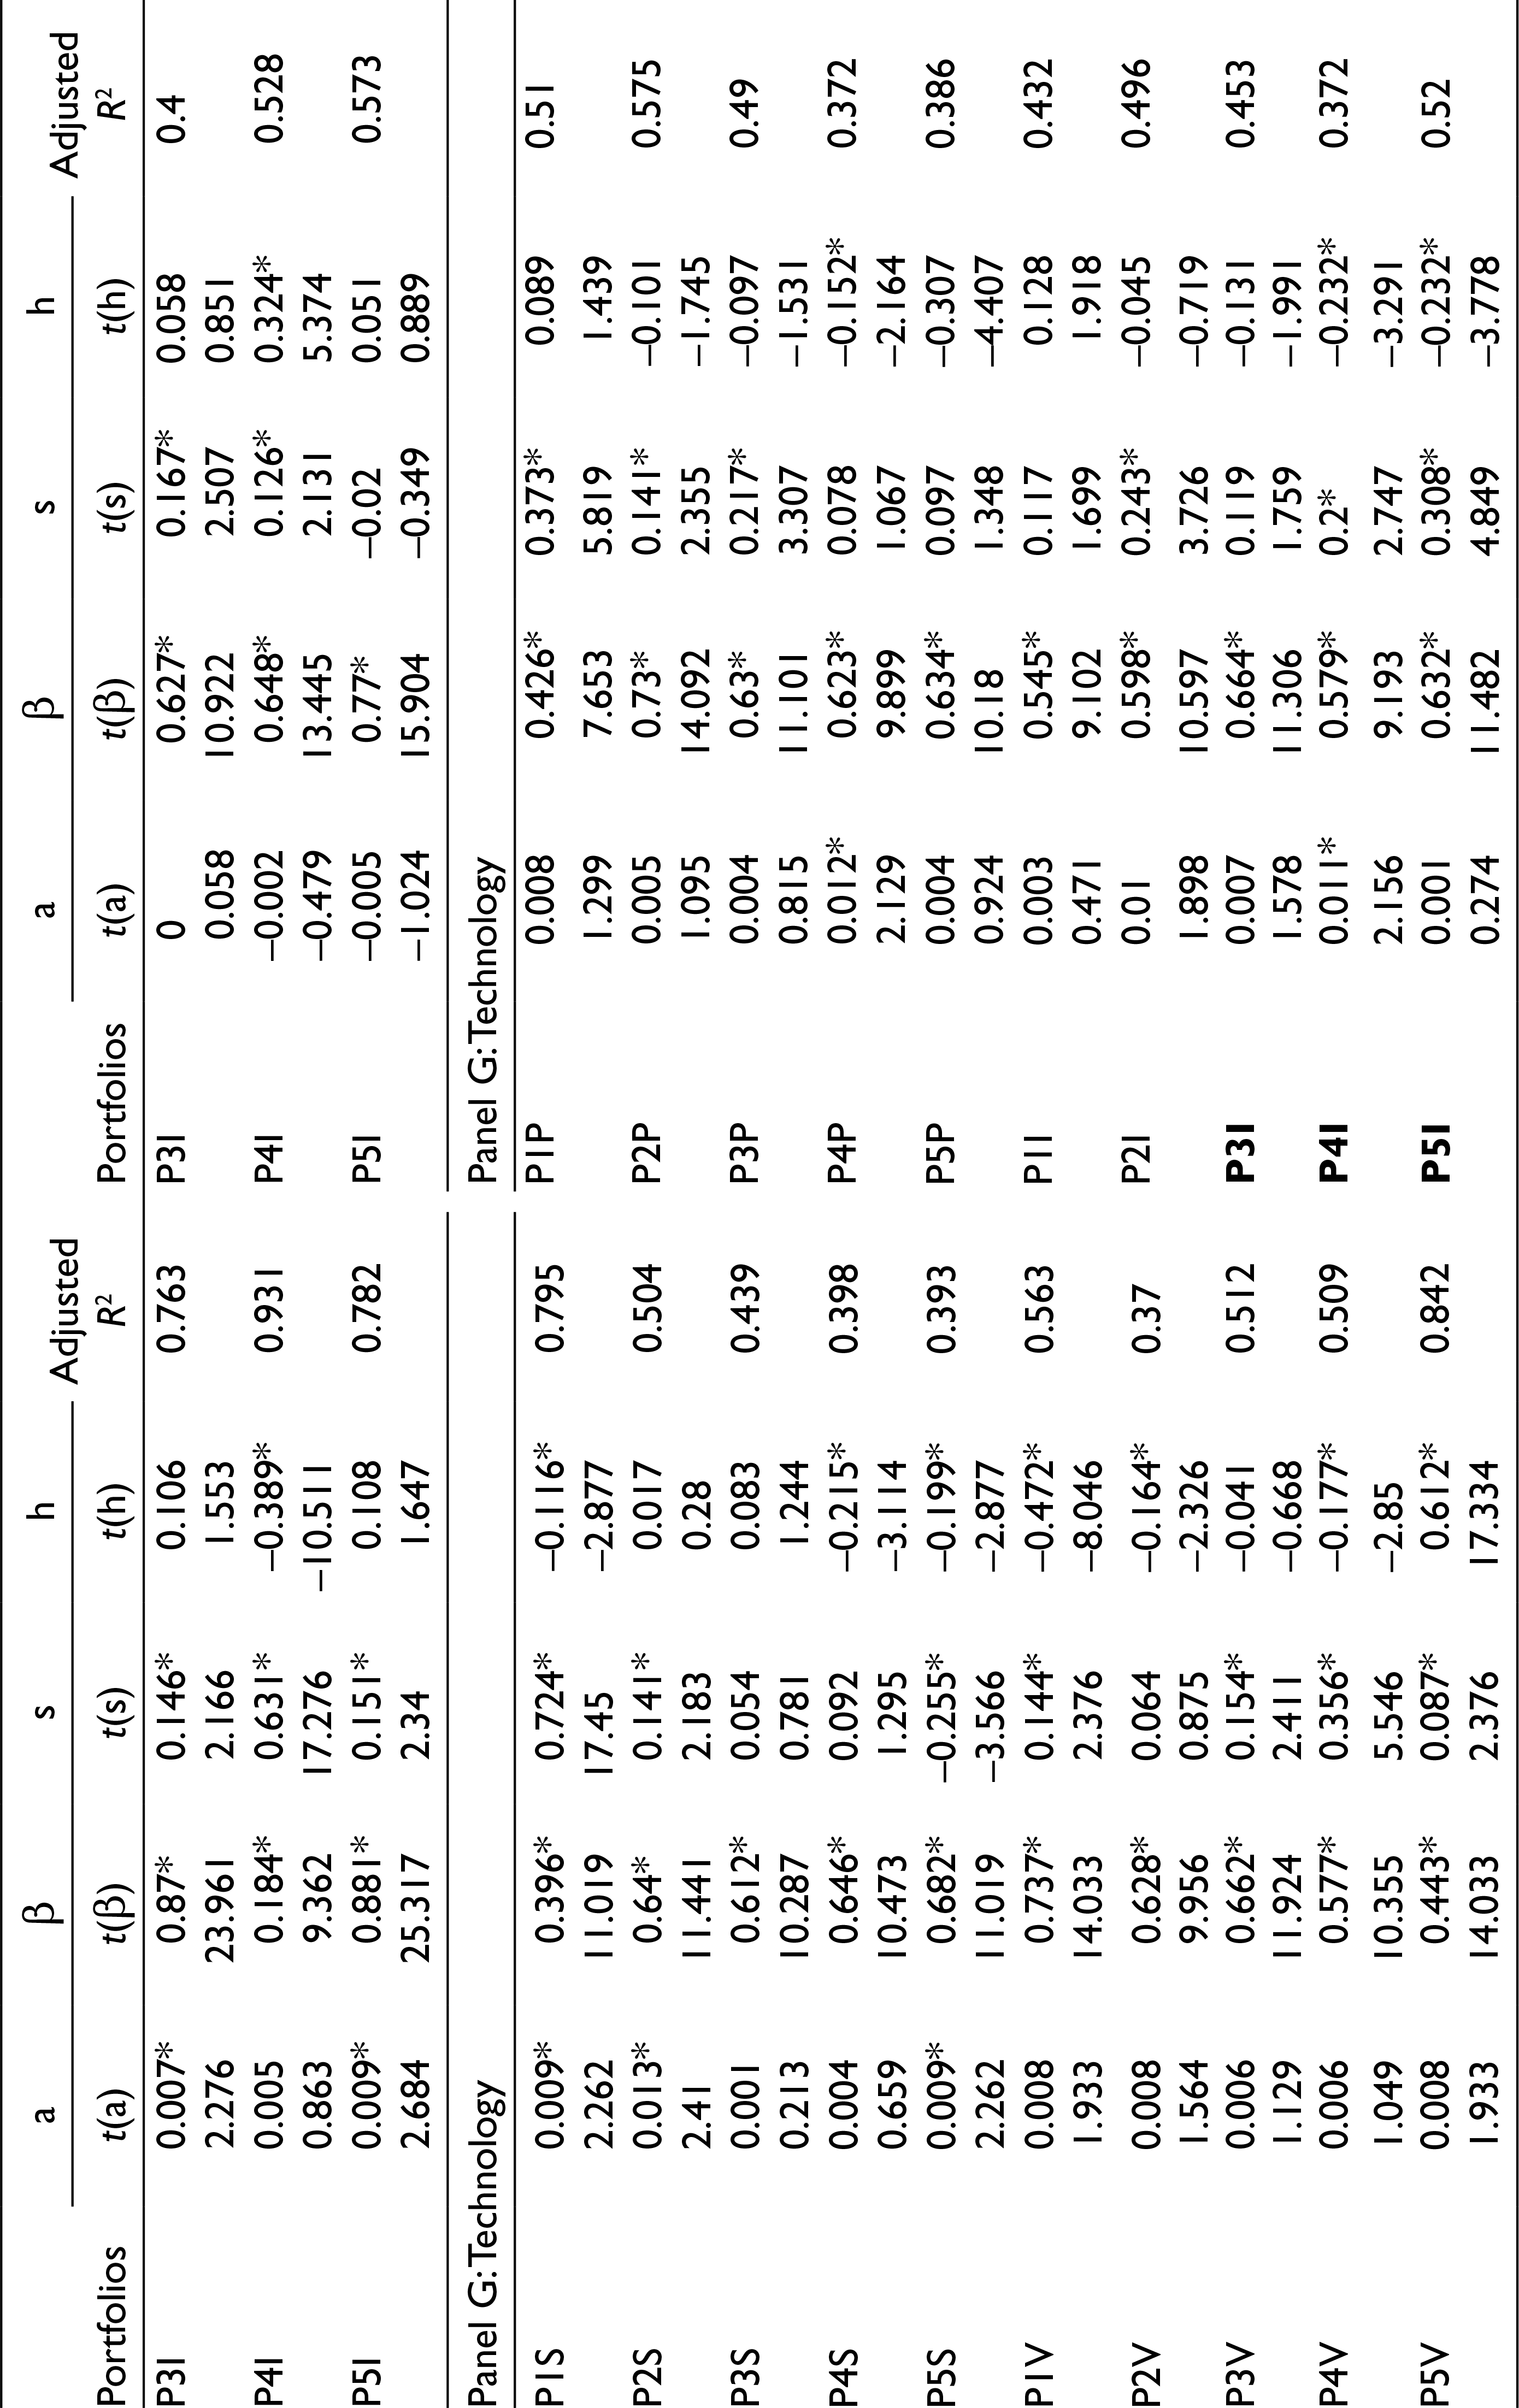
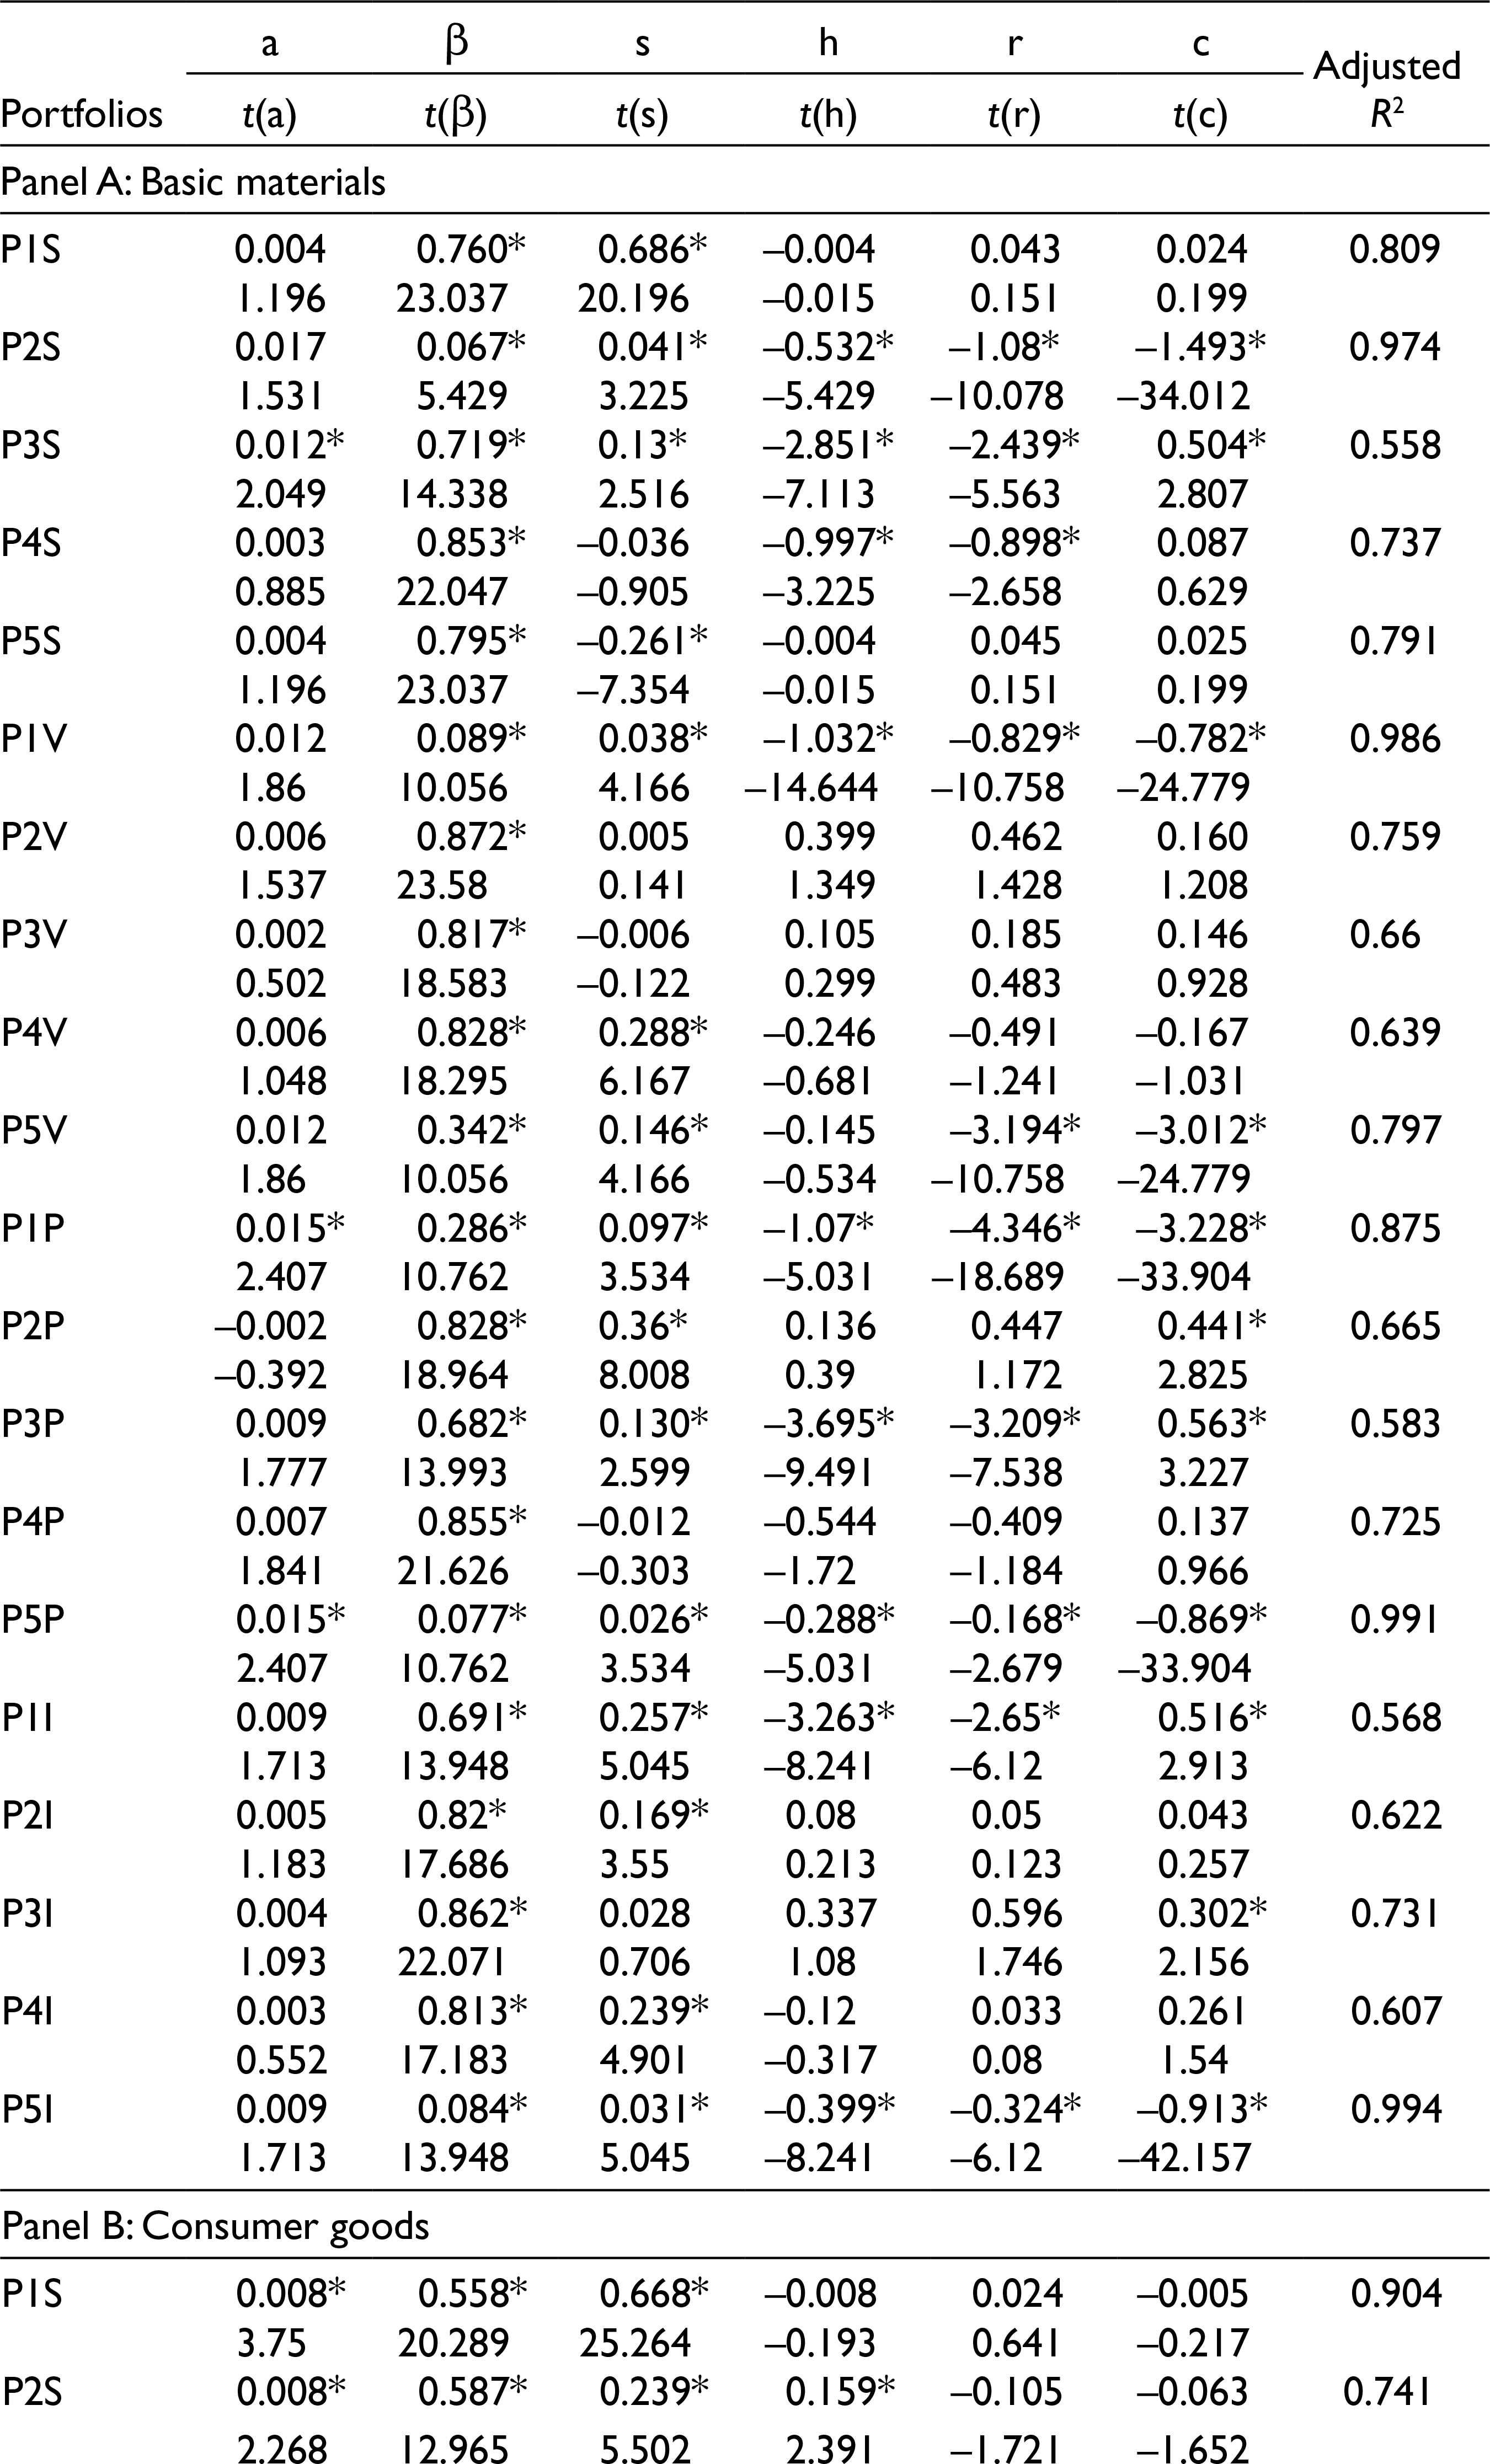
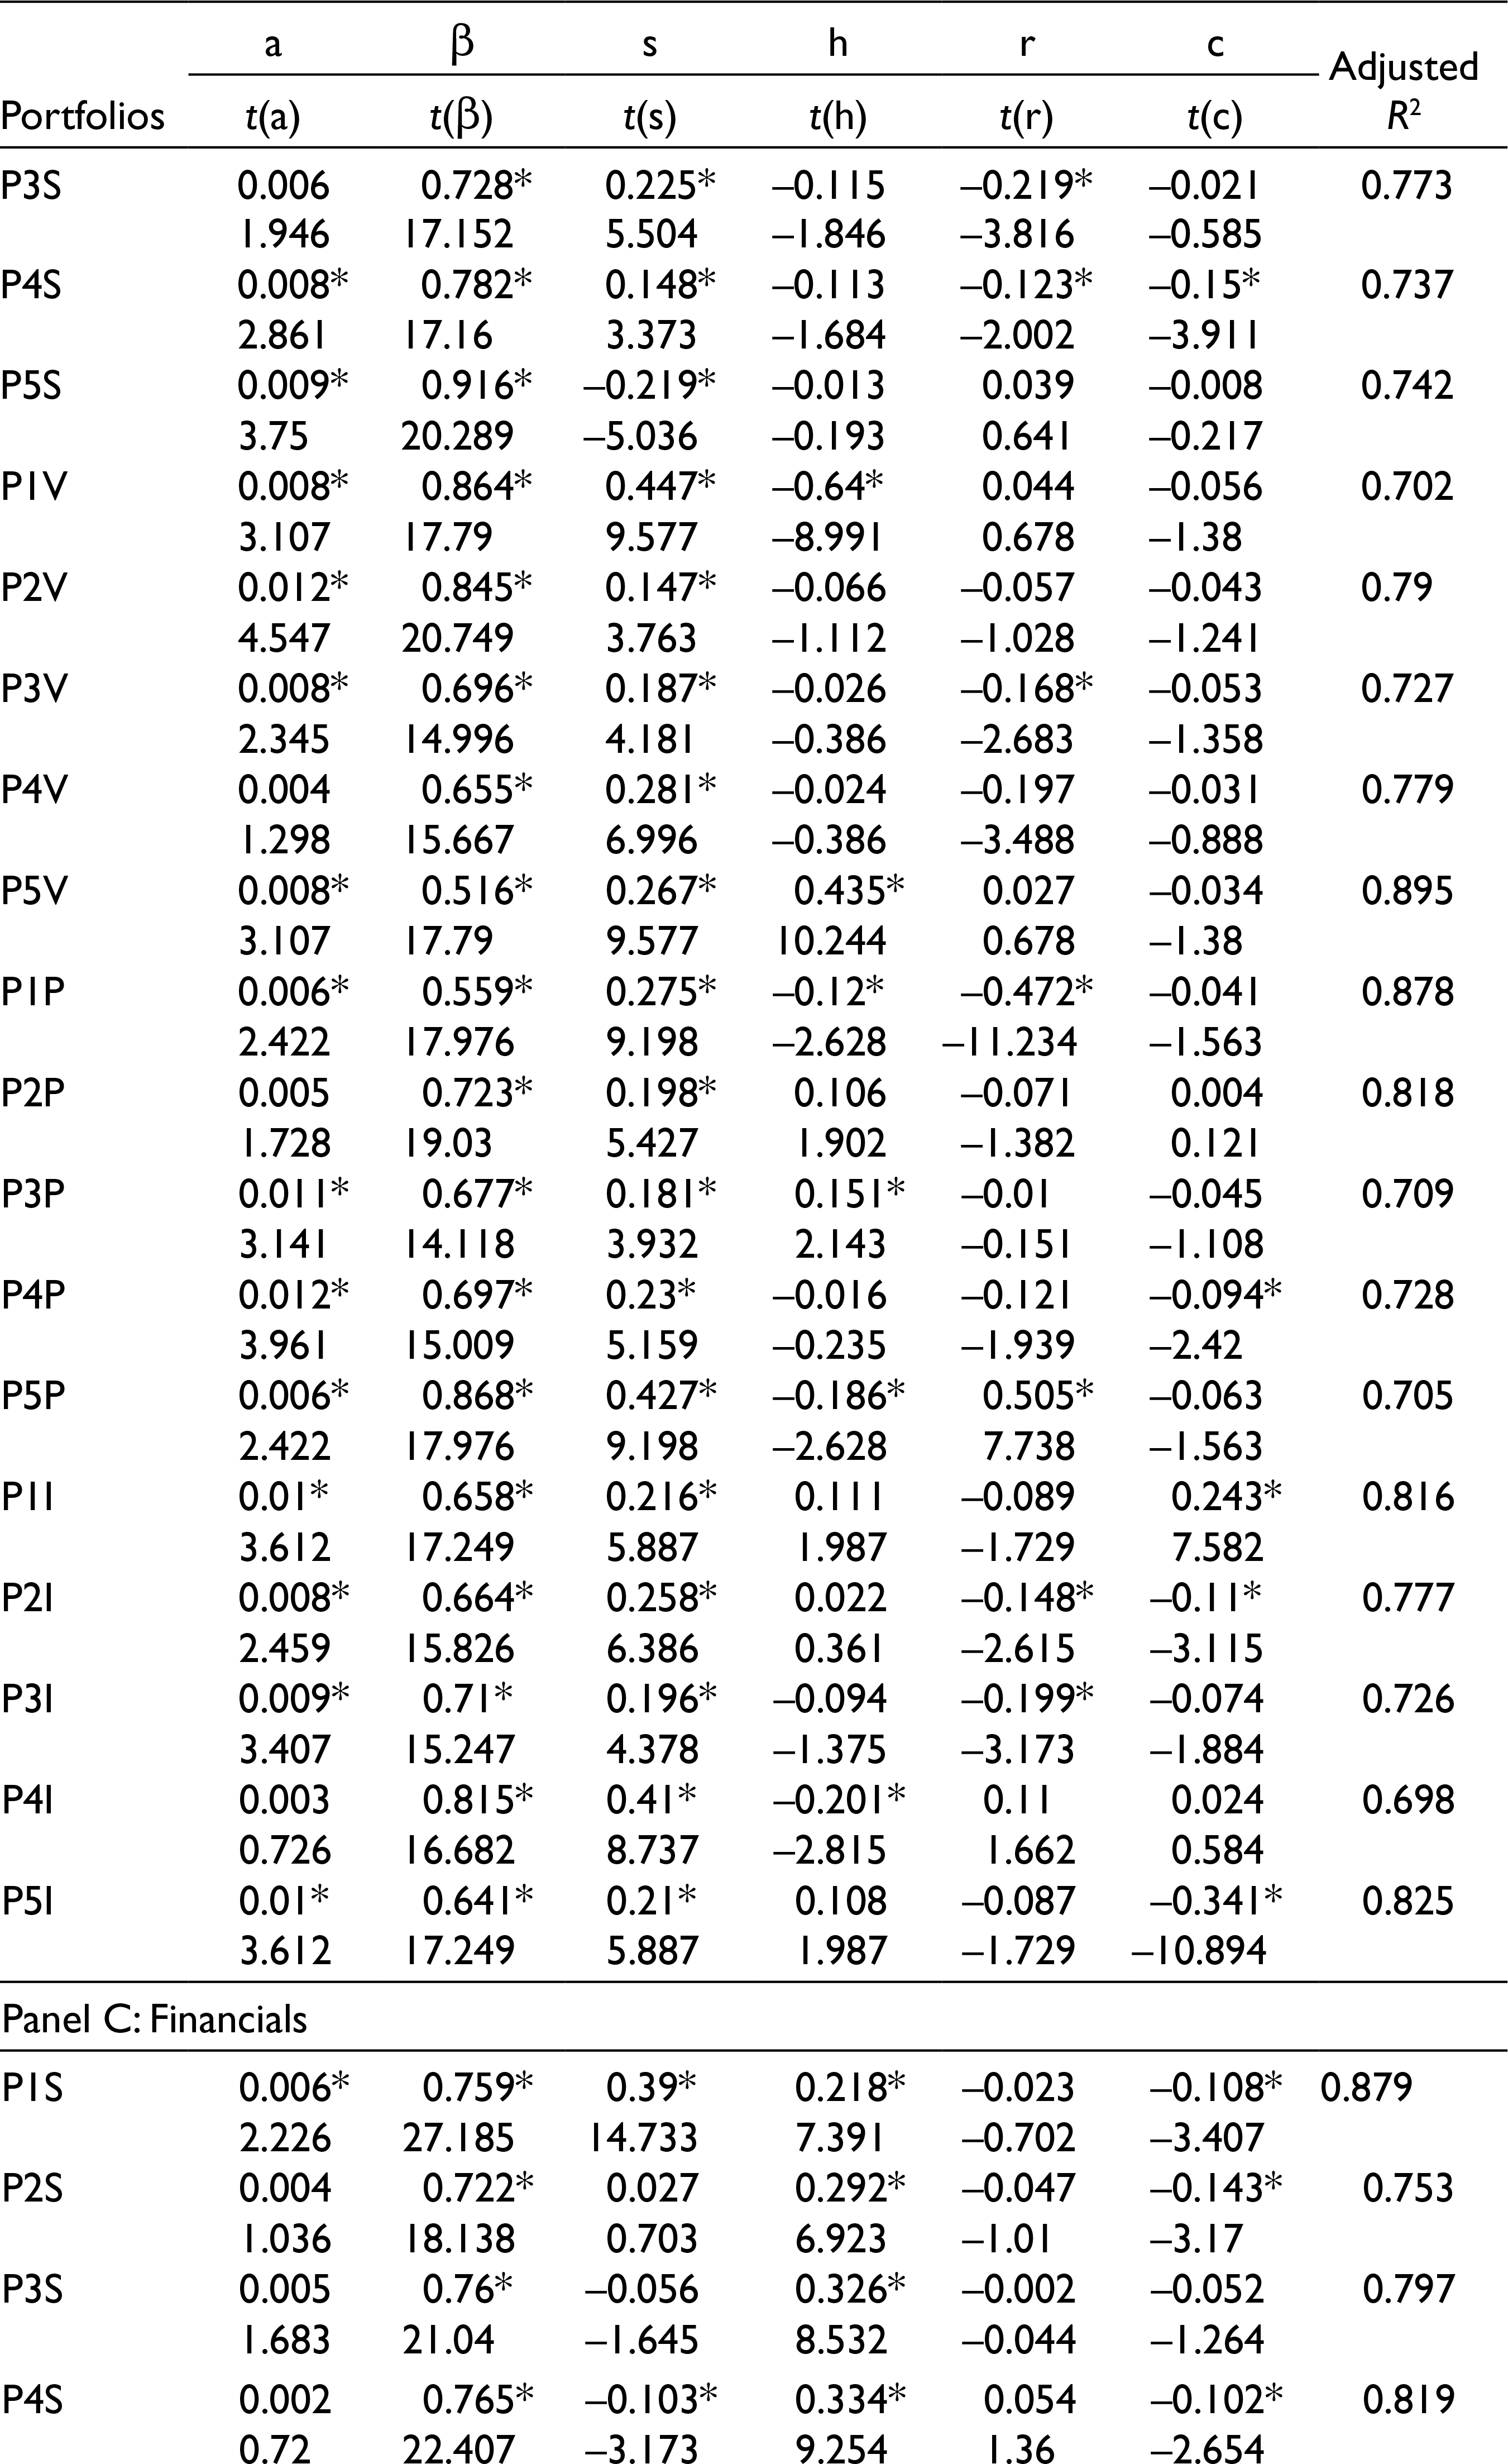
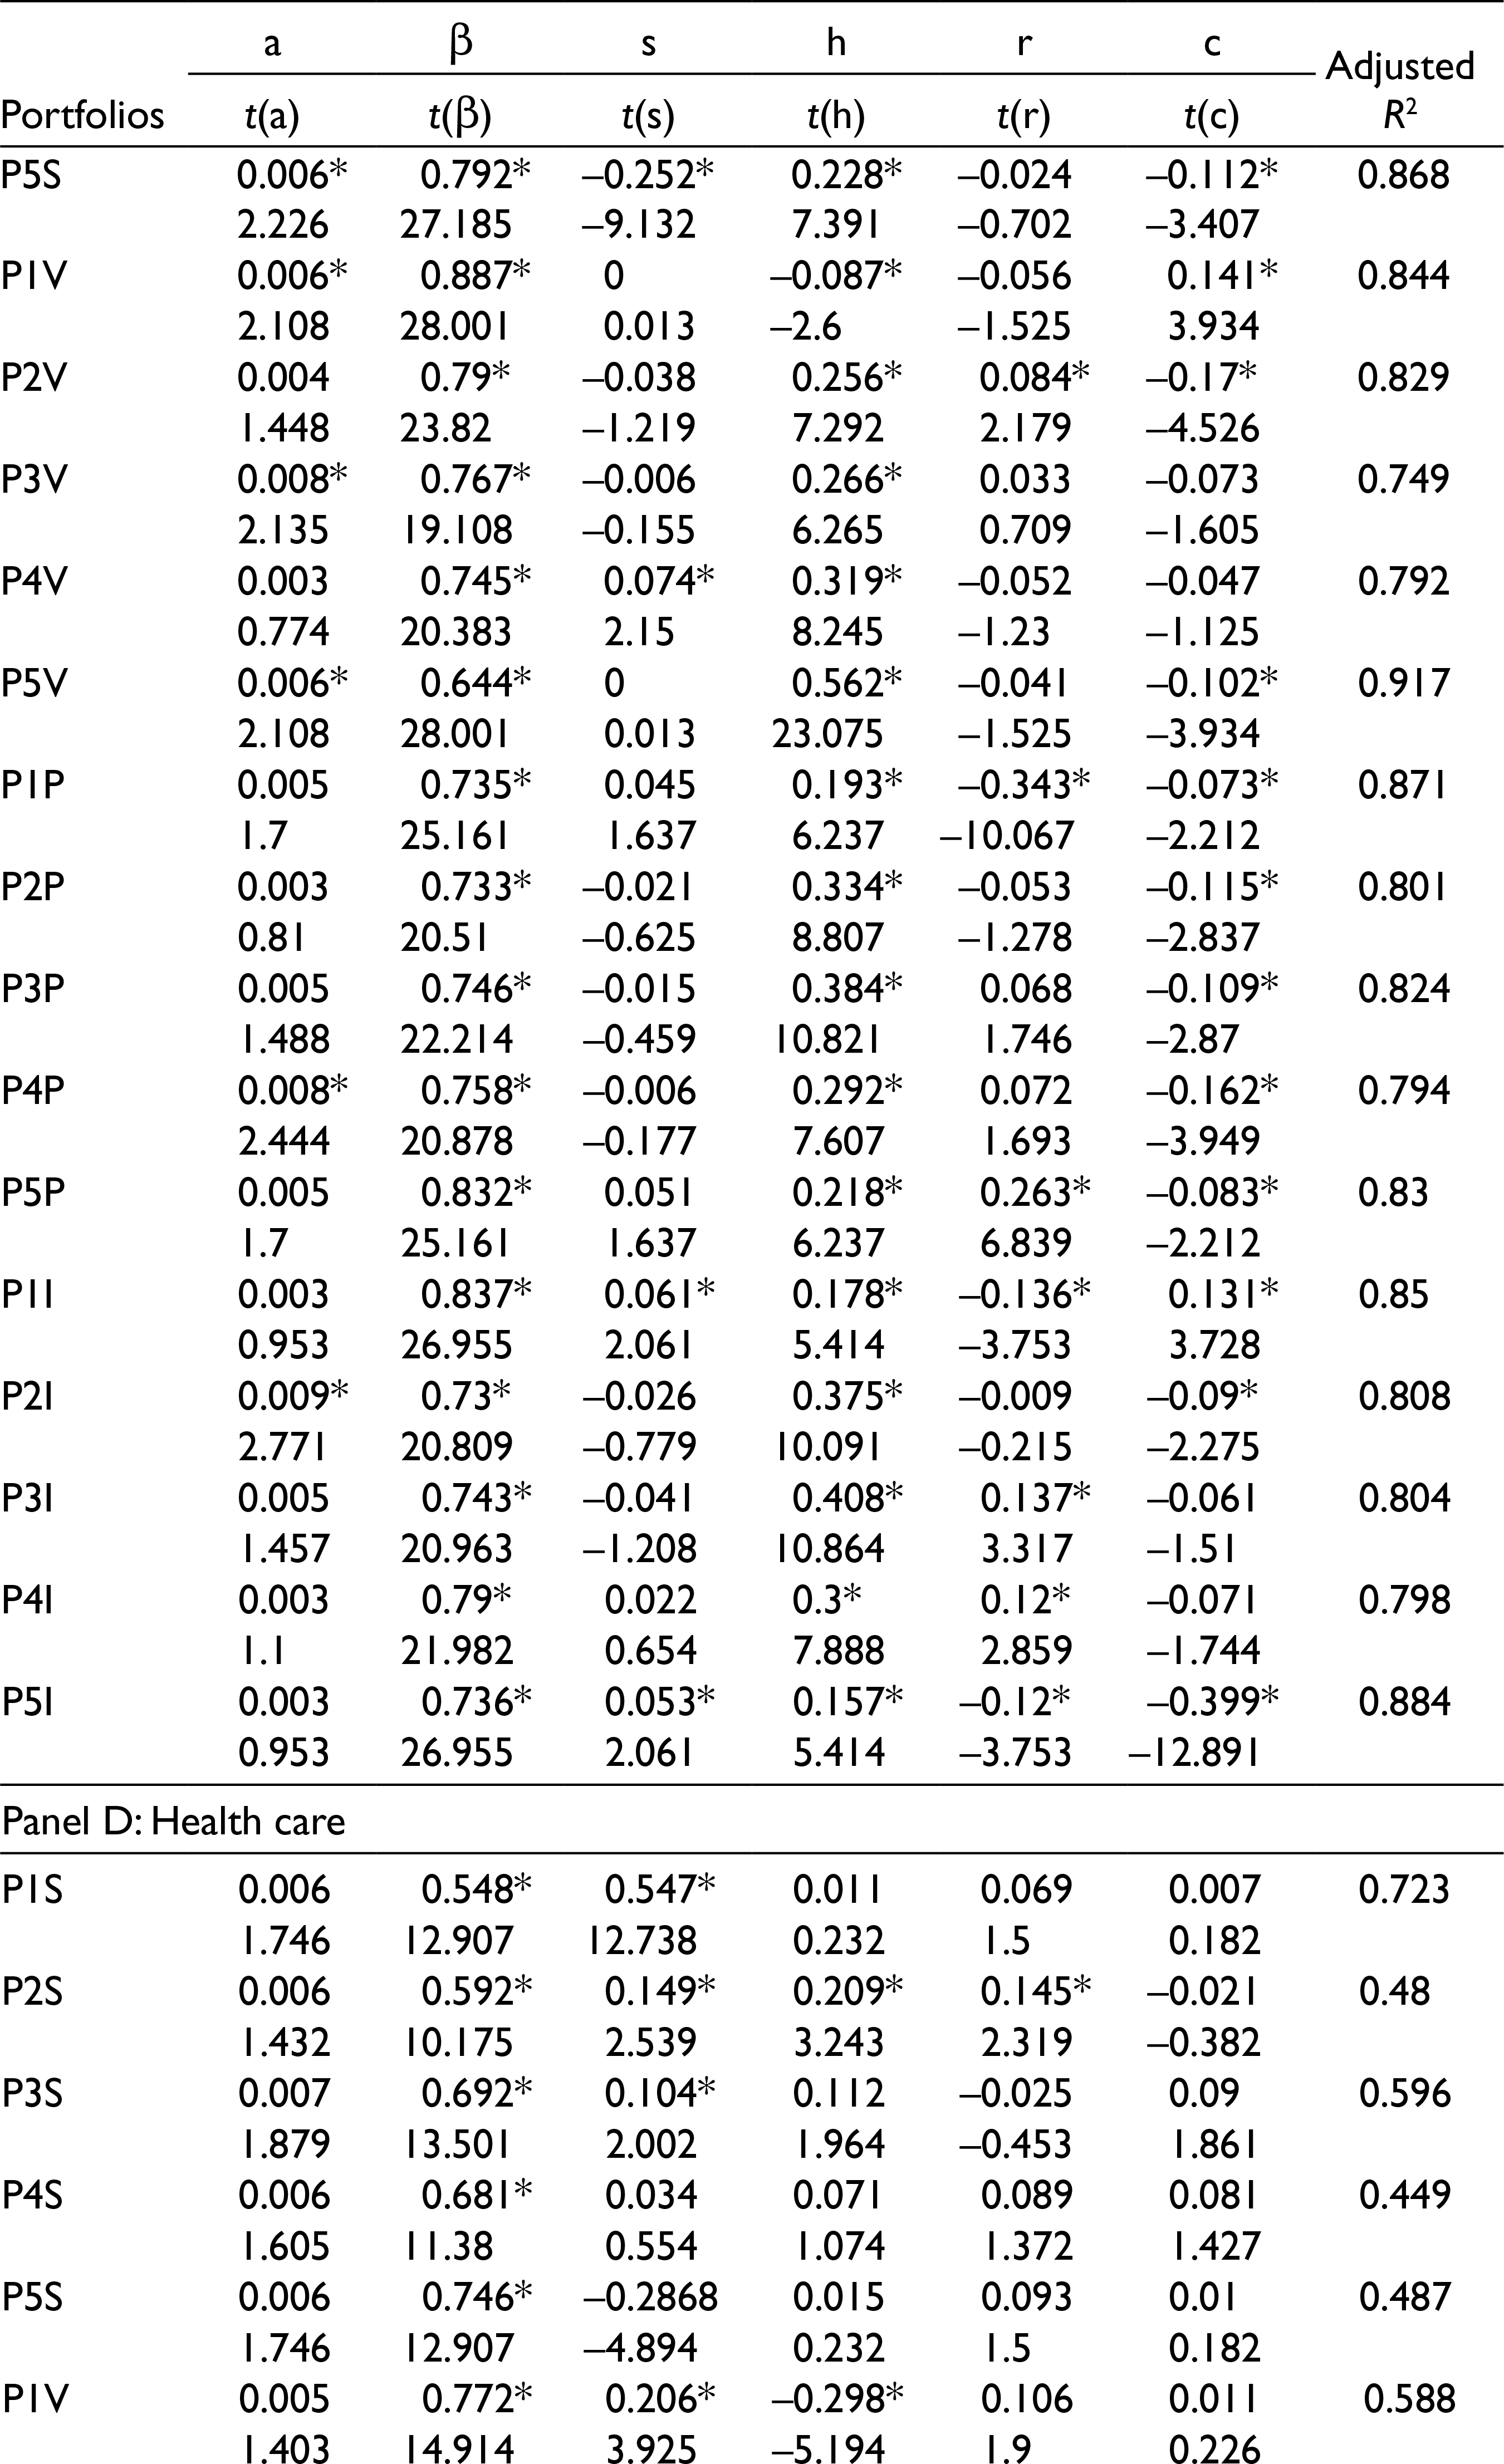
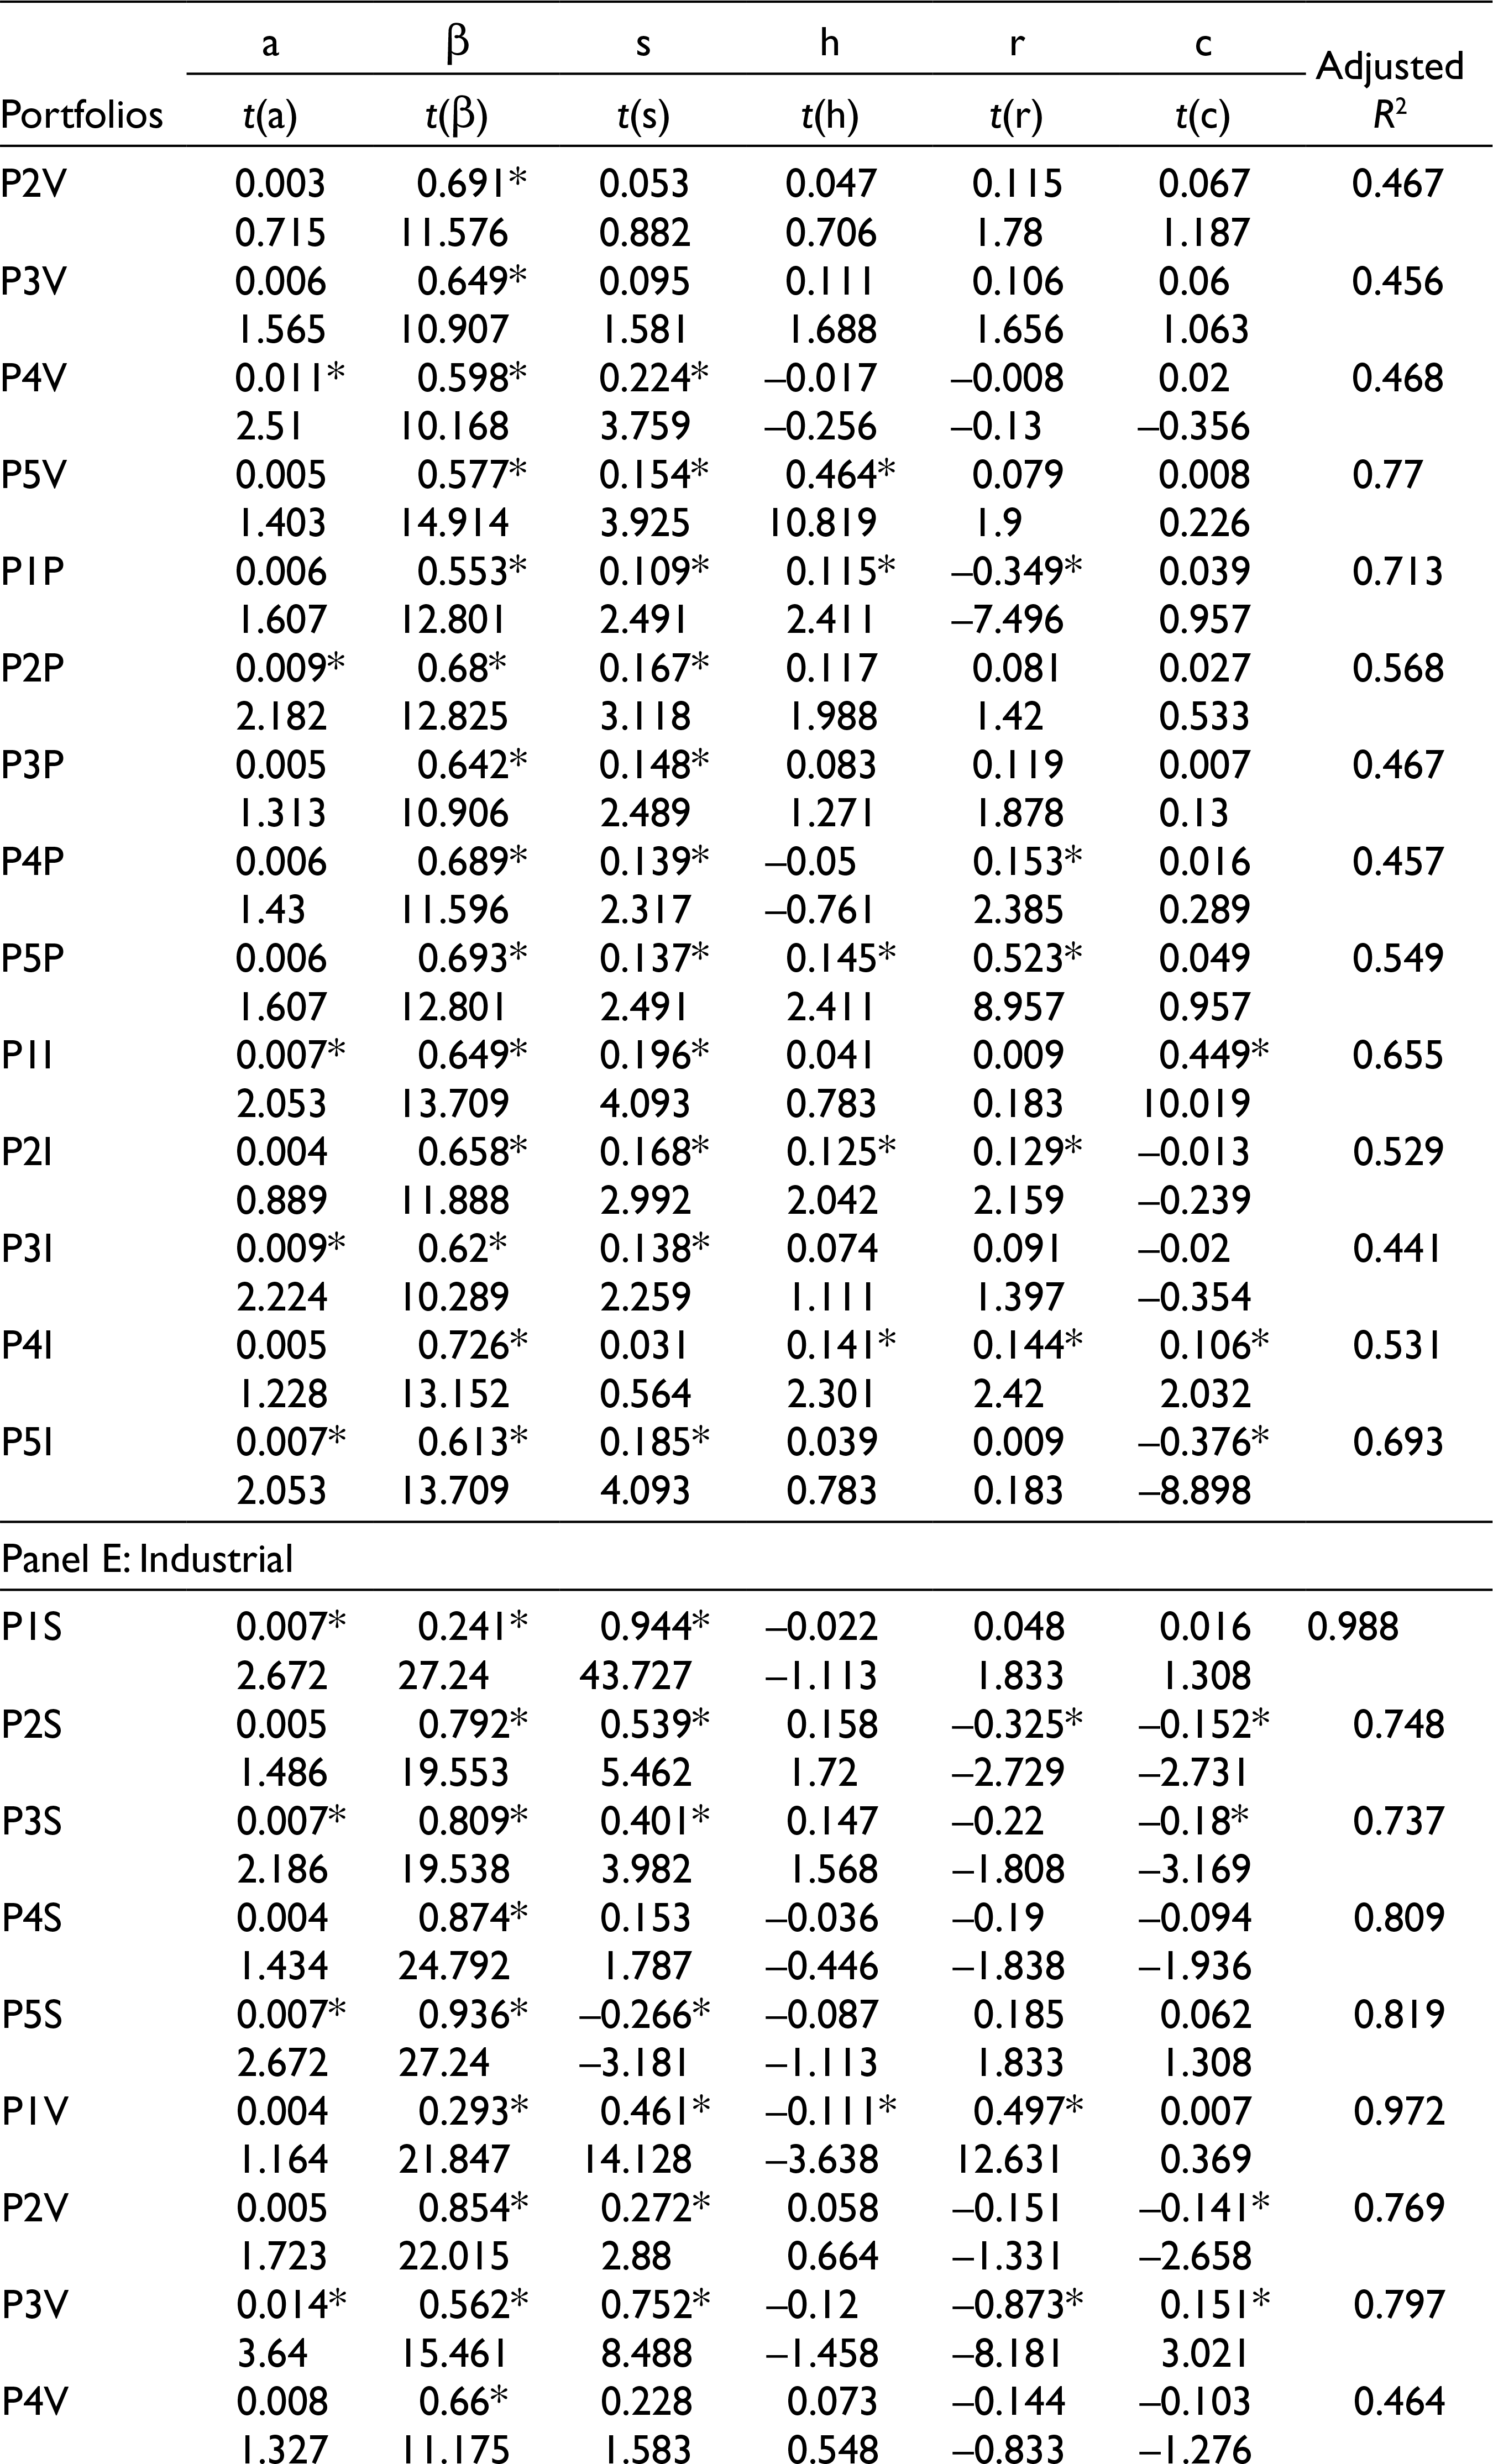
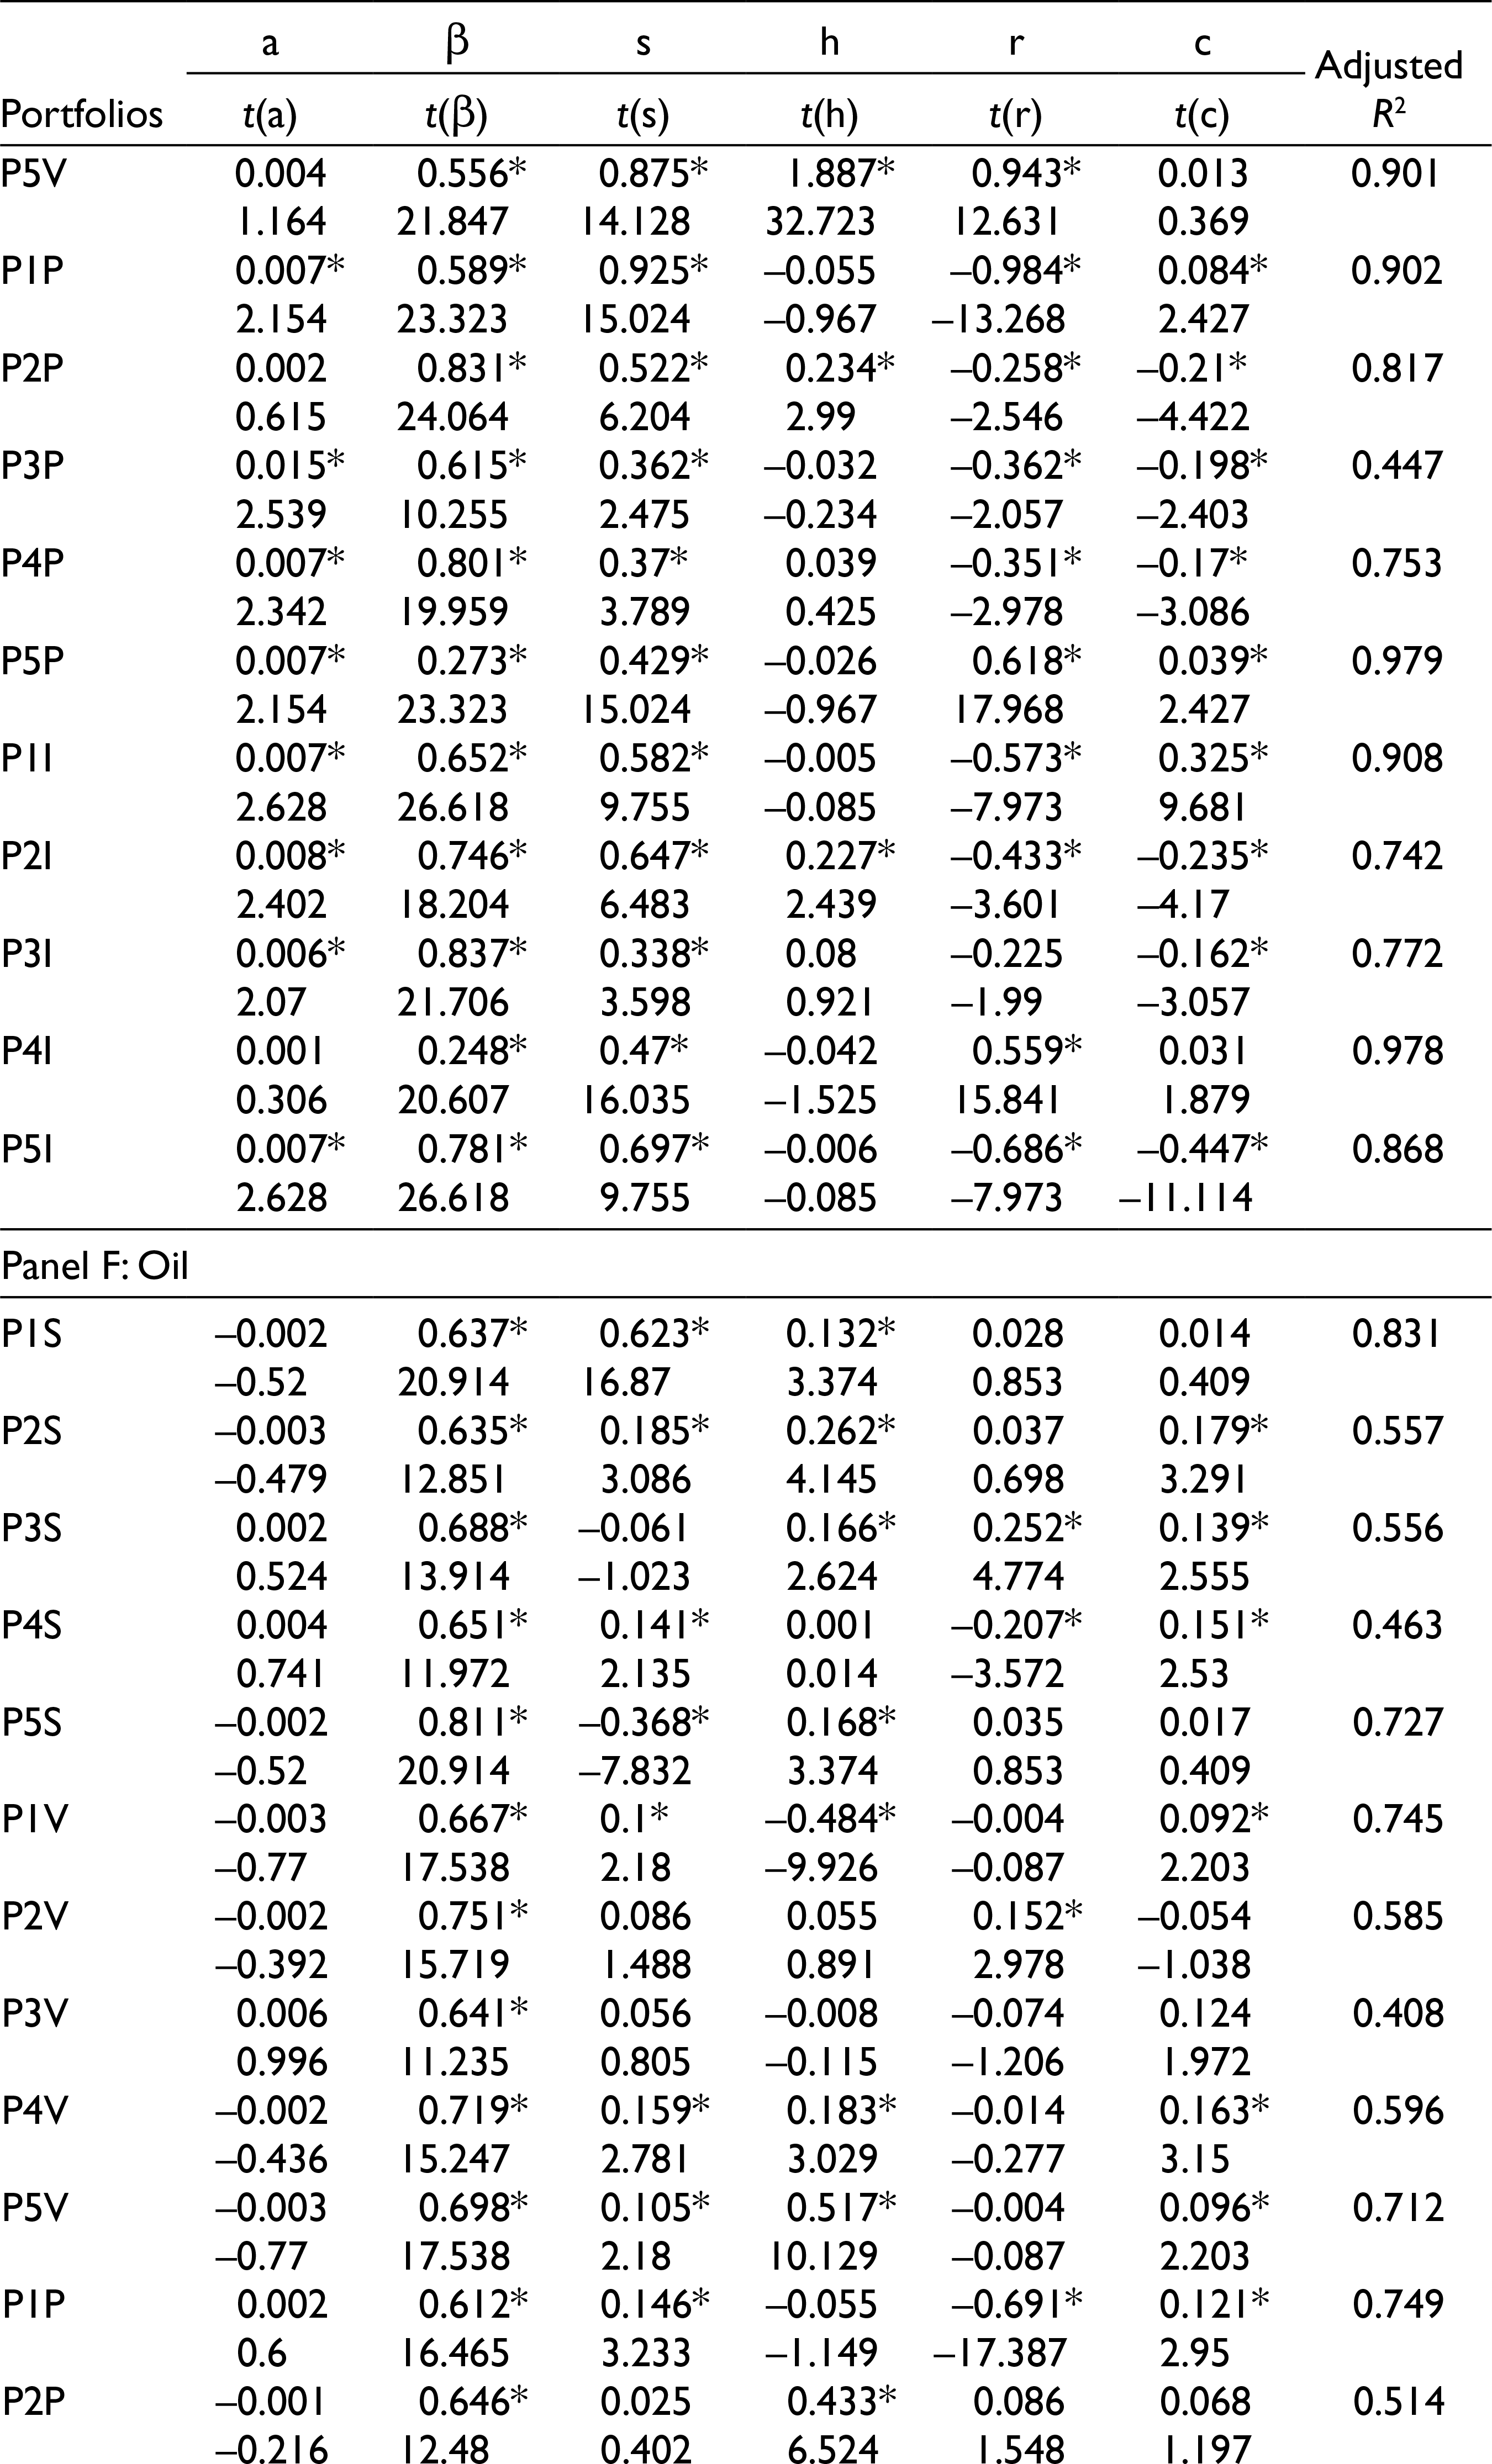
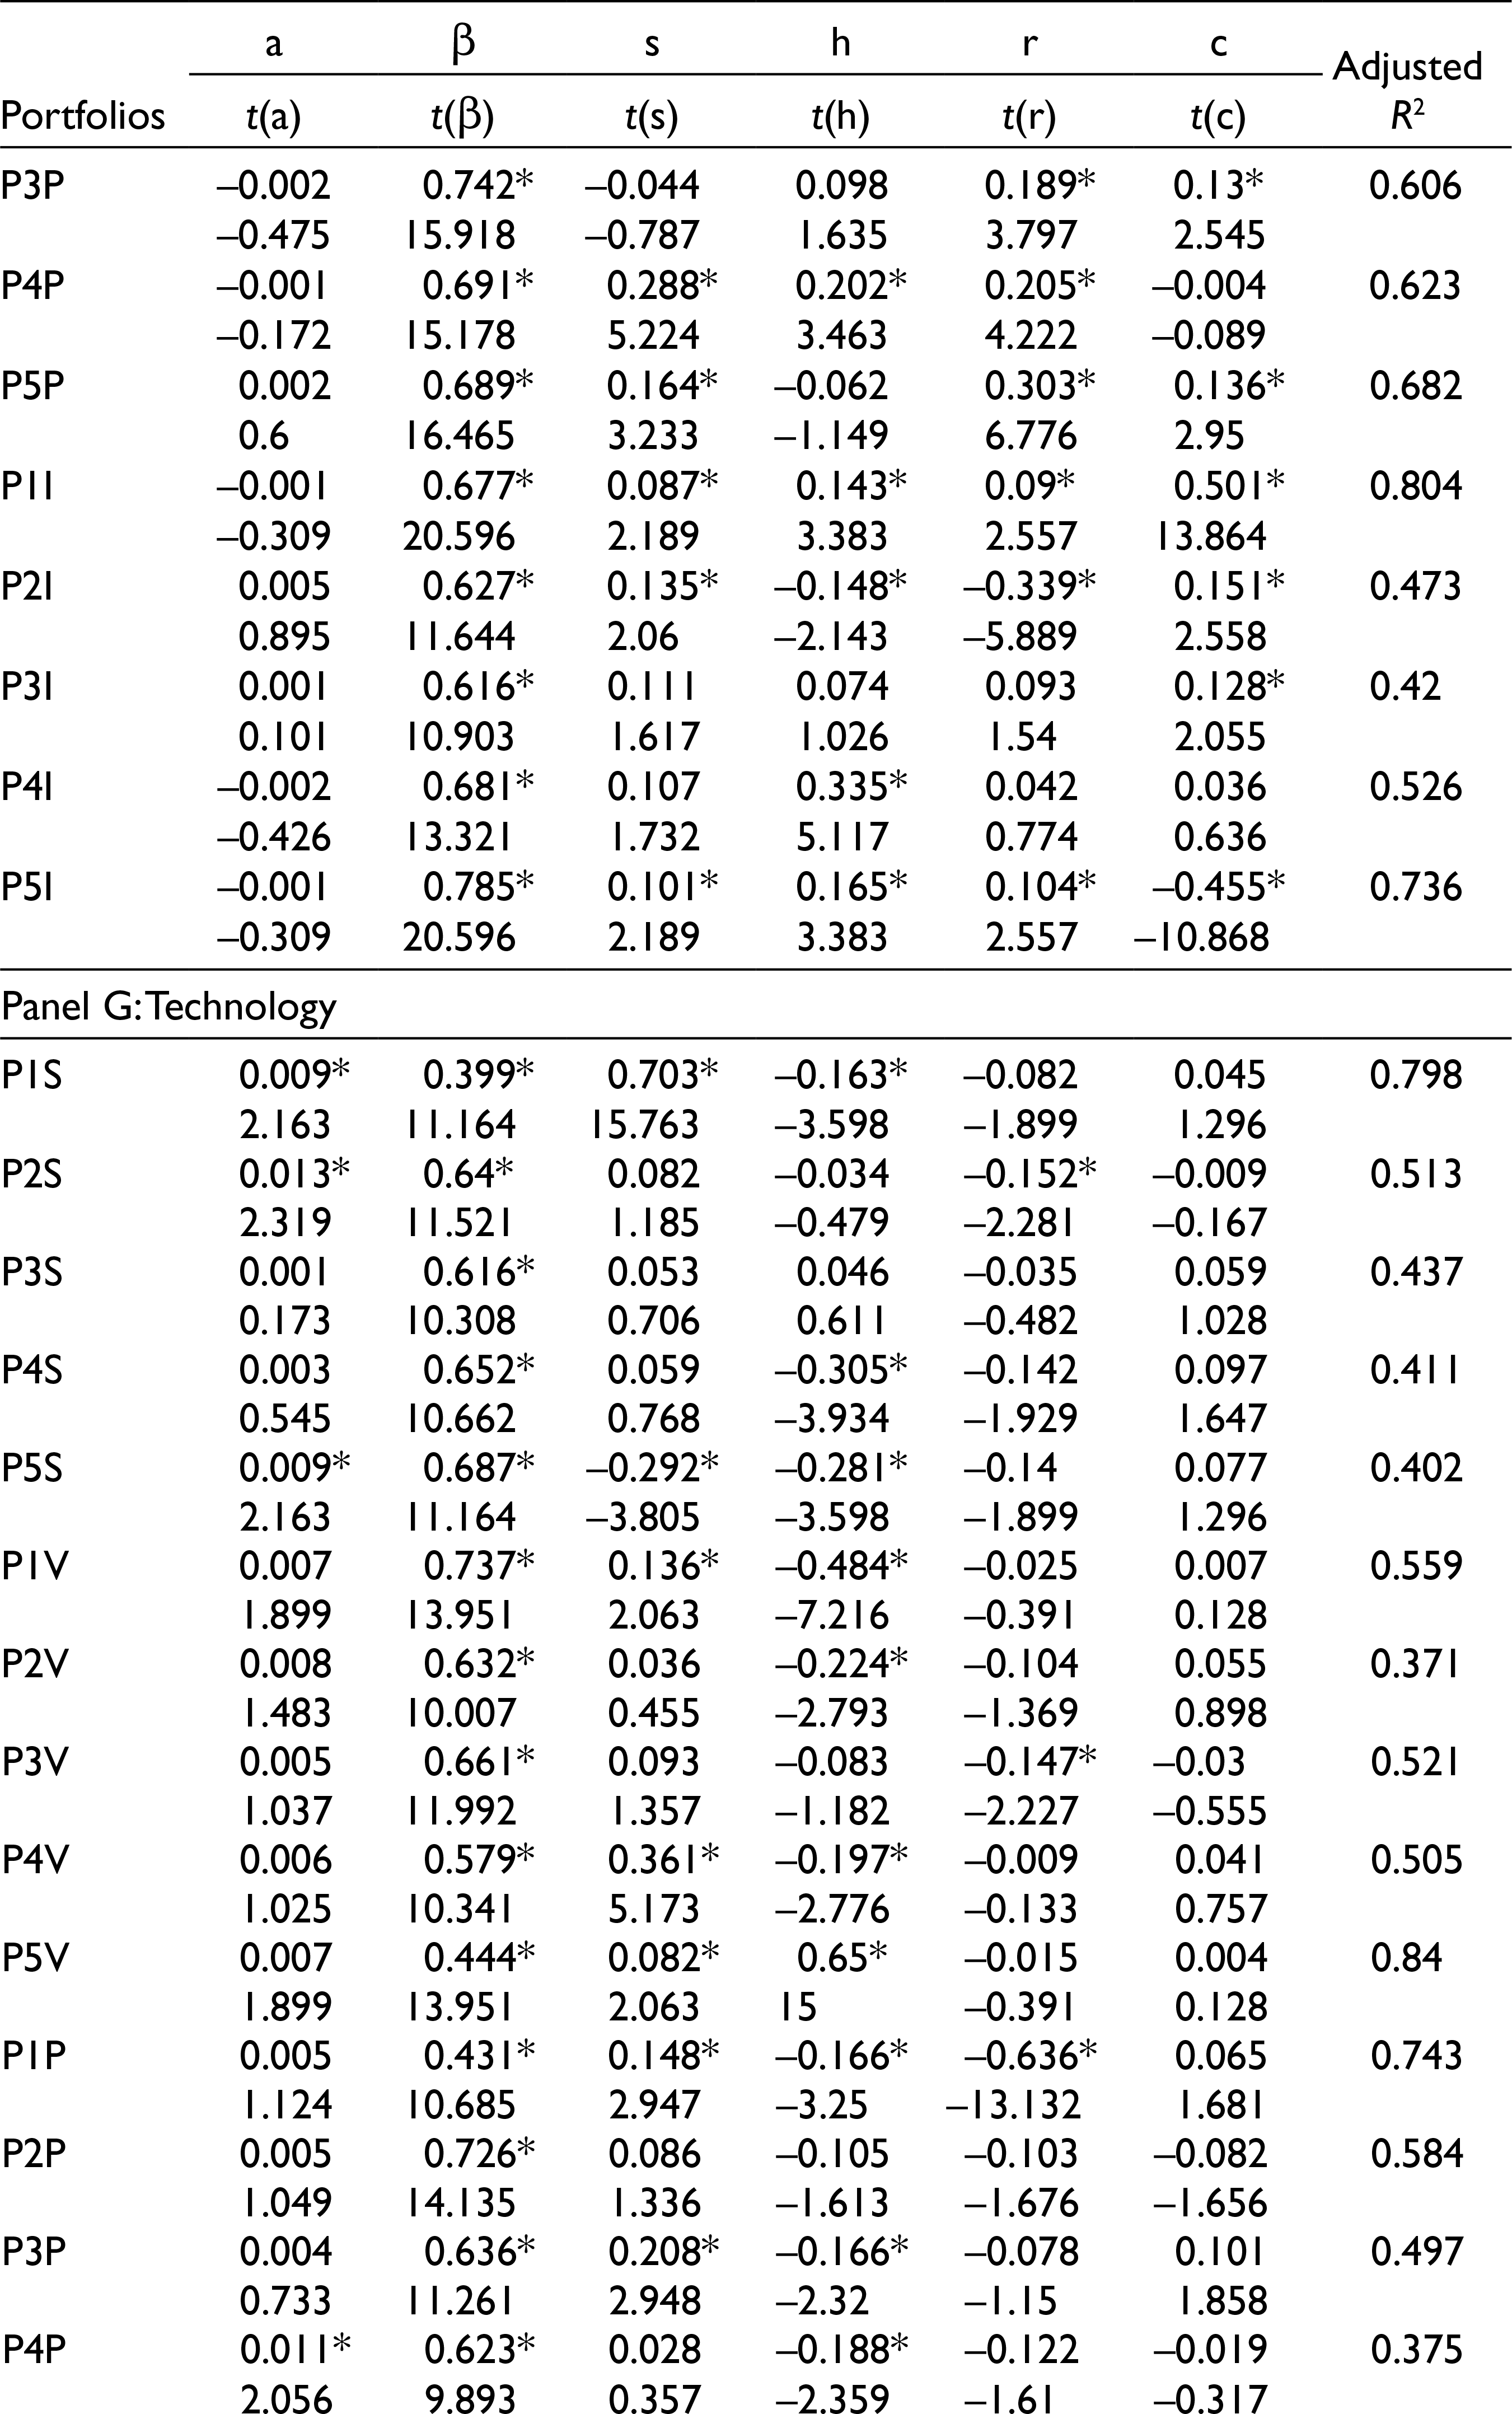
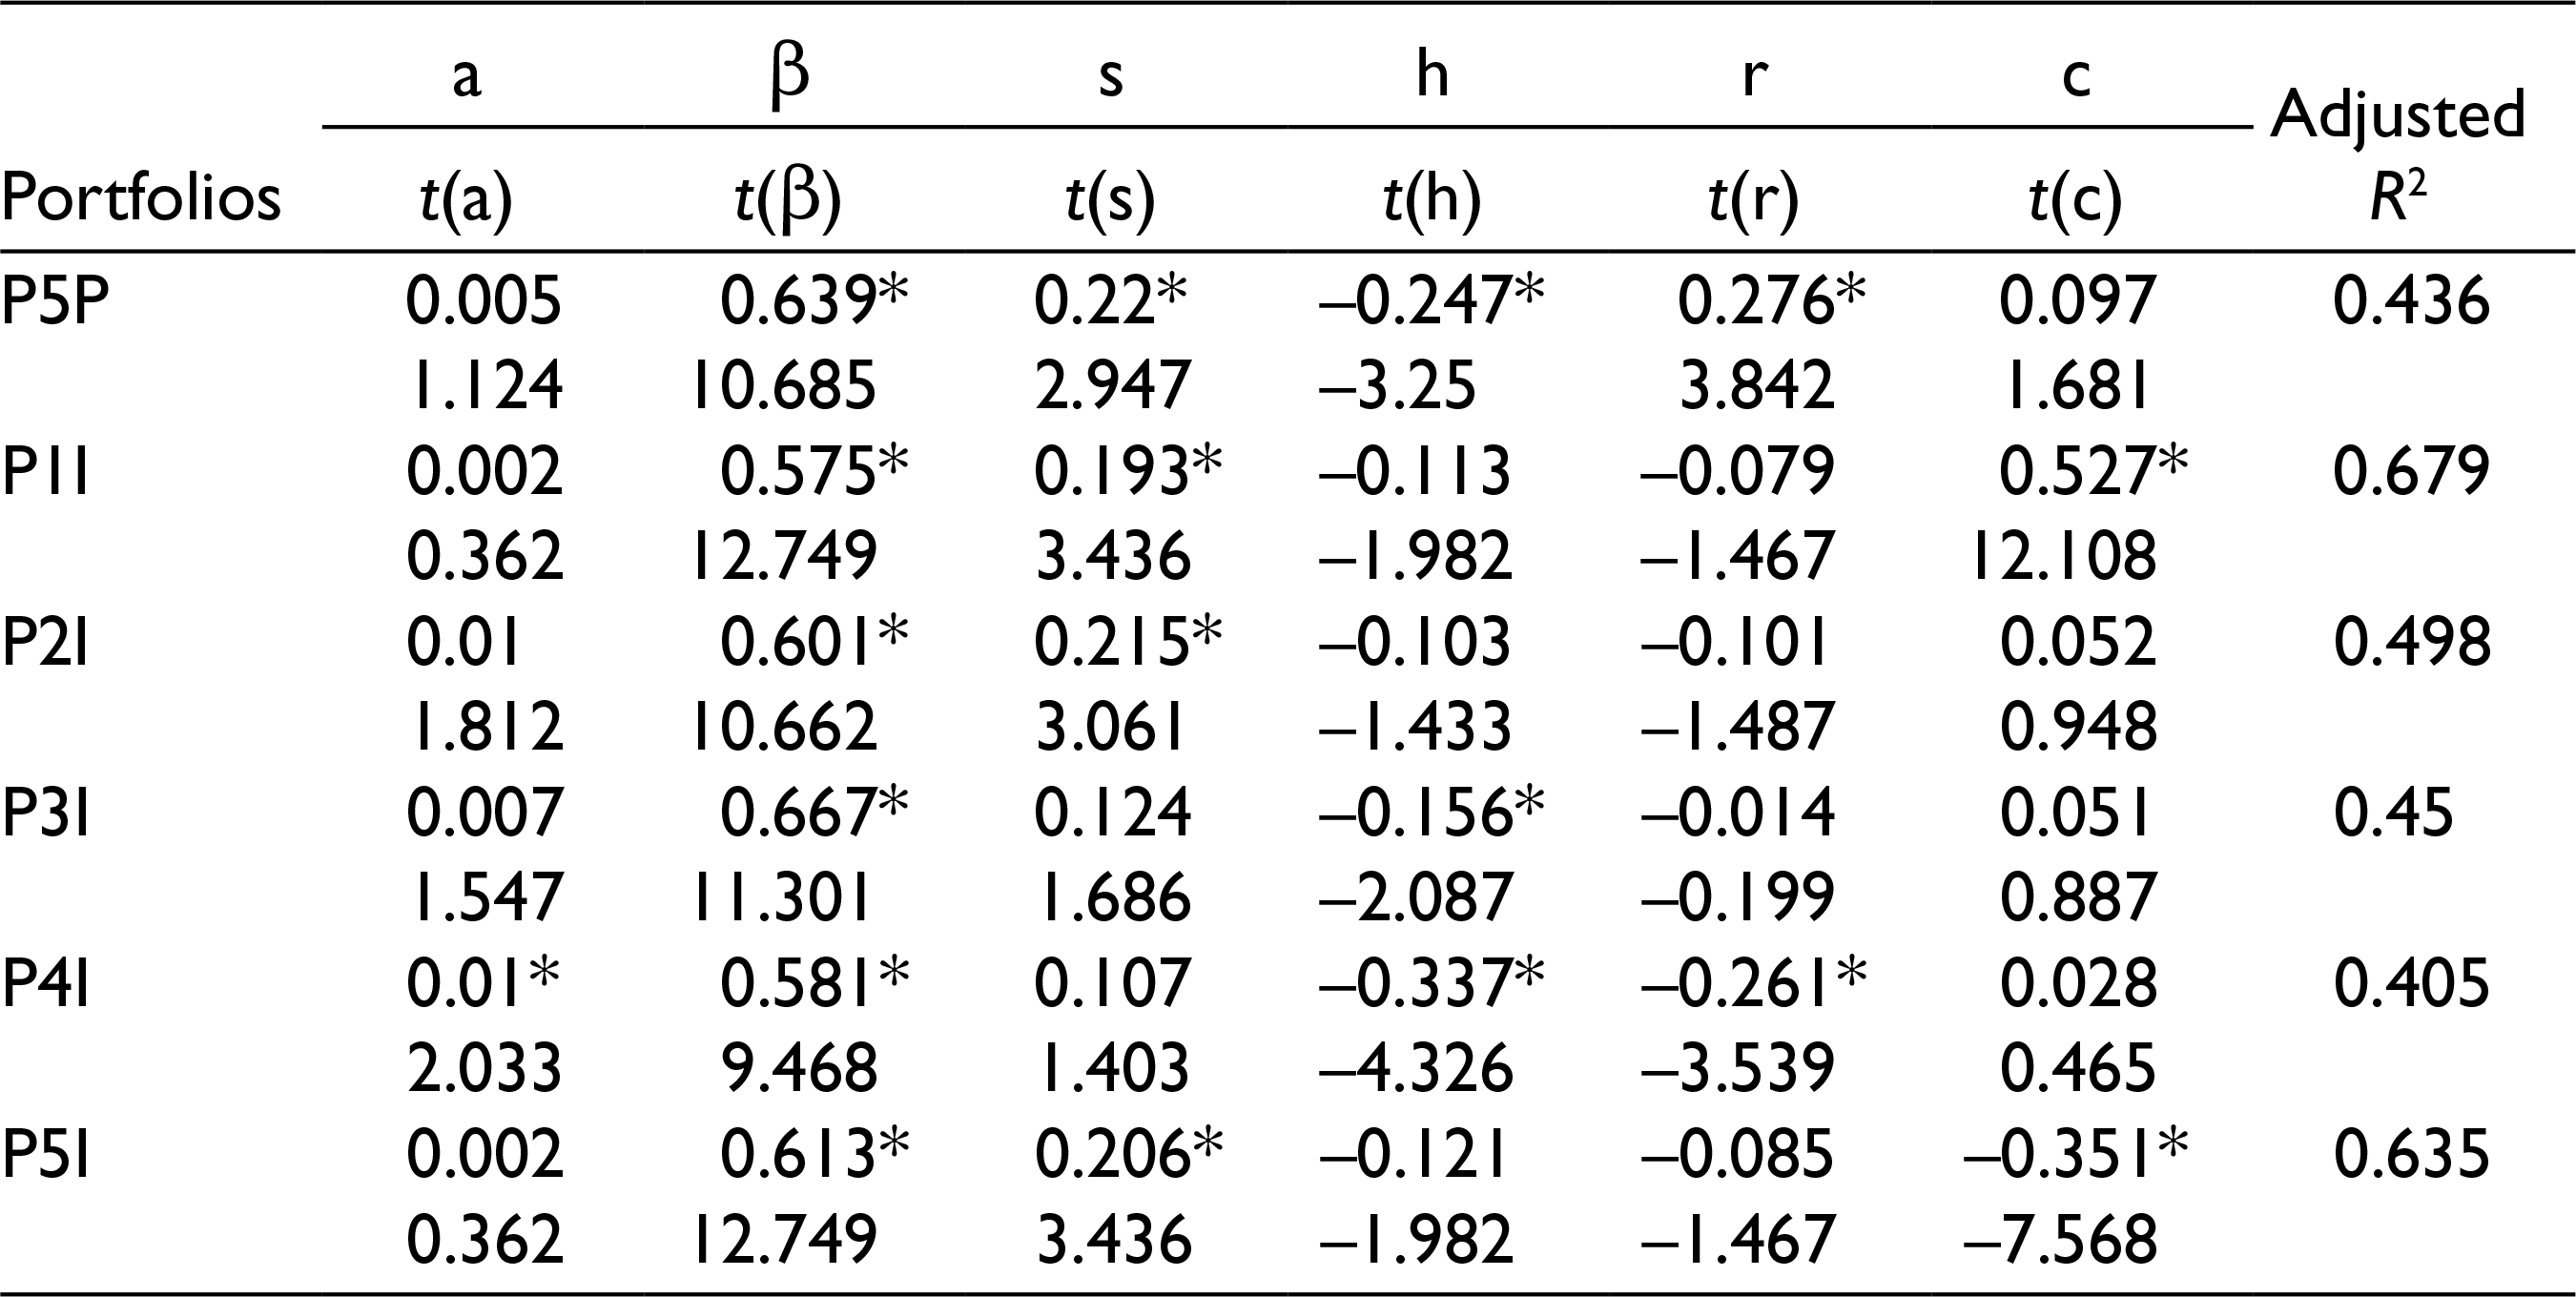
Table 2 shows the regression results of the Fama–French five-factor model for various sectors. Regressing monthly portfolio excess returns on the five-factor model for the “Basic Materials” industry leads to a slight improvement in the regression intercepts. The regression intercepts of the five-factor model are found to be more shrink towards zero in comparison to the three-factor model regression intercepts for the “Basic Material” industry. The intercepts of the five-factor model are not found to be distinguishably different from zero and, thus, leads to non-rejection of the null hypothesis of intercepts being equal to zero. Similar evidence are revealed from the “Health Care” and “Technology” sectors showing a marginal decline in the regression intercept value with a movement from the three-to five-factor model. Parallel results are also witnessed for the “Consumer Goods” industry. However, the presence of significant abnormal returns in the regression results of the specific industry highlights the presence of other risk factors not covered by the five-factor model but have the capacity to affect the portfolio’s excess return. In terms of the explanatory power of a model, the average adjusted R2 of Basic Materials, Consumer Goods, Health Care, Industrial, Oil, and Technology are found to be 75.4%, 77.4%, 82.6%, 55.4%, 80.4%, 61.6%, and 53.3%, respectively. The result shows a better explanatory power of the five-factor model for all the specific sectors. There appears to be a marginal improvement in the asset pricing model performance with the inclusion of two more risk factors, namely profitability and investment in the “Health care” and “Technology” sectors.
Regression Results of the Fama–French Five-Factor Model
Conclusion
In this article, we tried to test the empirical applicability of the Fam-French five-factor model amongst various sectors of India with an objective to find out that whether the five-factor model can explain the industry’s expected return or not. The results of sectoral-specific analysis for India shows that after controlling for risk factors, the profitability and value effect comes out to be non-existent in the “Basic Material” industry. The regression results of other industries exhibited moderate to strong size, value, profitability, and investment effect. The findings further stipulated that the five-factor model works well in the “Basic Material” and “Oil” industries. However, for the “consumer” industry, the five-factor model combining with market, size, value, profitability, and some other risk factors might work well. The result further demonstrated the better explanatory power of the five-factor model in explaining the portfolio excess return for the “Industrial” sector. However, there is still a possibility of other risk factors which can better explain the expected return in the “Industrial” sector. The result further showed that the one-factor model or model combining with market, value, and investment factors holds valid for the “Financials” sector in the Indian stock market. Results also highlighted the low explanatory power of the three-factor model in explaining the expected return in the “Health Care” industry while a better performance of a three-factor model is found in the “Technology” sector. As far as practical applications are concerned, the study will help the portfolio managers in evaluating the sectoral-specific performance of the portfolios and determining the cost of equity of various sectors of India. The study will also aid the investors in their investment decision-making by helping them to identify the average stock return in different sectors. The application of the asset pricing model will further assist the policymakers in making efforts for greater financial integration and long-term economic cooperation. The study will help the researchers to identify the additional risk factor supported by theoretical evidence which can improve the explanatory power of a model. The future study can try to evaluate the sectoral-wise applicability of the asset pricing model in other emerging nations of the world.
Footnotes
Declaration of Conflicting Interests
The authors declare that there is no conflict of interest.
Funding
The authors received no financial support for the research, authorship, and/or publication of this article.