
Abstract
Type 2 diabetes mellitus (T2DM) affects bone health, increasing the risk of fracture despite normal or elevated bone mineral density (BMD). This paradox is attributed to impaired bone quality, microarchitectural defects and advanced glycation end-products-related damage. Additionally, complications of diabetes, such as neuropathy, retinopathy and medication side effects, contribute to increased fall and fracture risk. Traditional diagnostic tools like dual-energy X-ray absorptiometry and Fracture Risk Assessment Tool→ often fail to capture these caveats, while newer techniques such as trabecular bone score and high-resolution peripheral quantitative computed tomography offer better insights but remain limited by accessibility. Refining risk assessment models, integrating novel imaging and adopting tailored management strategies are crucial to mitigating fracture risk and improving skeletal health in T2DM.
Introduction
The relationship between diabetes and skeletal health has drawn attention as evidence linking diabetes to bone integrity and fracture risk has mounted. Traditionally, diabetes complications have been categorised as microvascular, such as retinopathy, neuropathy and nephropathy, or macrovascular, including cardiovascular disease. However, recent research highlights bone health as a critical yet under-recognised domain of diabetes-related complications.[1] This emerging understanding emphasises the need for comprehensive approaches to assessing and managing bone health in individuals with diabetes.
The paradoxical findings of normal or even elevated bone mineral density (BMD) in individuals with type 2 diabetes mellitus (T2DM) coupled with a significantly higher risk of fractures have challenged traditional methods of evaluating bone health.[2] Unlike type 1 diabetes mellitus (T1DM), where BMD is often reduced due to insufficient insulin and its direct effects on bone formation,[3] T2DM presents a more complex picture. Elevated BMD in T2DM does not translate to lower fracture risk, as impairments in bone quality, microarchitectural integrity and the accumulation of advanced glycation end-products (AGEs) weaken the bone matrix. These subtleties necessitate a deeper exploration into the mechanisms, risk factors and advanced tools for assessing bone health in diabetes.[4]
Furthermore, diabetes introduces additional layers of complexity through its systemic effects. Peripheral neuropathy, poor glycaemic control, visual impairments and the side effects of certain antidiabetic treatments like thiazolidinediones and sulphonylureas heighten the risk of fractures. Sarcopenia, the age-related reduction in skeletal muscle mass, quality and function, is another factor that increases the risk of falls and fractures.[5] The combined effects of compromised bone quality and an elevated propensity for falls create a dual burden that significantly impacts the quality of life and functional independence of individuals with diabetes.[6]
This article analyses the intricate interplay between T2DM and bone health, focusing on the tools and techniques for assessing bone fragility in this population. It highlights the limitations of conventional diagnostic approaches such as dual-energy X-ray absorptiometry (DXA) and the Fracture Risk Assessment Tool (FRAX)→ and explores advancements in assessing bone health in diabetes.
Assessing Bone Health in Type 2 Diabetes Mellitus
Bone Mineral Density
BMD, measured using DXA, is traditionally the gold standard for osteoporosis diagnosis and fracture risk assessment.[7] However, in T2DM, BMD often does not correlate with fracture risk. Individuals with T2DM typically exhibit normal or increased BMD but remain at elevated risk for fractures due to compromised bone quality [Table 1].
Summary of advantages and disadvantages of modalities for assessing bone health in T2DM
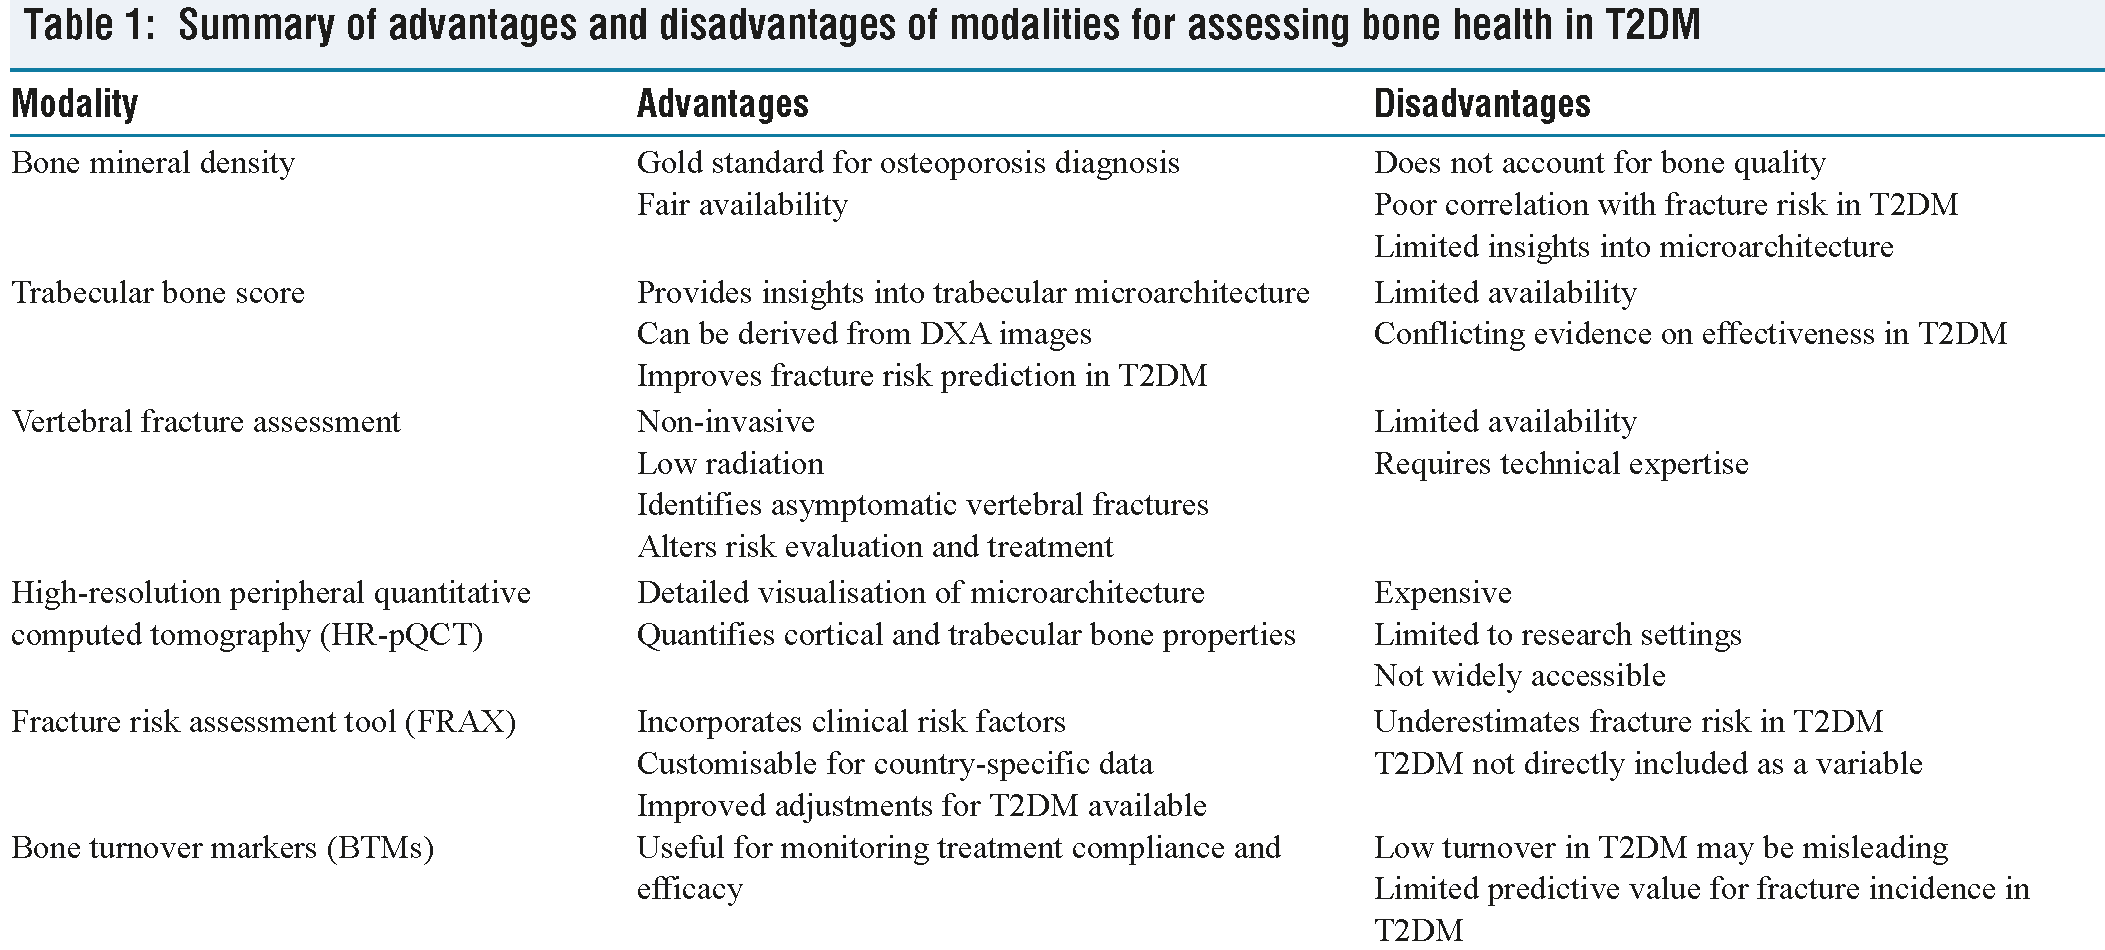
A recent meta-analysis of 30 observational studies involving 6470 participants did not show difference in overall BMD between individuals with and without T2DM [mean difference (MD) = −0.07 (−0.17, 0.03), P = .15]. Interestingly, BMD at the lumbar spine was higher in individuals without T2DM compared to those with T2DM [MD = −0.14 (0.22, −0.06), P = .0009). Similarly, femoral neck BMD was also higher in the non-T2DM group [MD = −0.11, (−0.18, −0.04), P = .002).[8]
Numerous studies have highlighted the association between T2DM and an elevated risk of fractures. In the Women’s Health Initiative observational cohort, which monitored 93,676 generally healthy postmenopausal women over seven years, those with T2DM at baseline showed a 20% greater likelihood of fractures at any site, even after accounting for variables such as fall frequency.[9] Similarly, the Study of Osteoporotic Fractures followed 9,654 women aged 65 or older for an average of 9.4 years, verifying fractures through radiological evidence. Women diagnosed with T2DM after the age of 40 experienced a 30% increased risk of nonvertebral fractures (VFs) and an 82% higher risk of hip fractures (HFs), although VF rates did not show a significant rise.[10] Other studies have specifically explored the connection between T2DM and VFs. A cross-sectional study conducted in Japan to assess VFs in individuals over 50 years found that the T2DM increased the possibility for prevalent VFs with odds ratio (ORs) of 1.86 in women and 4.73 in men, even after correcting for lumbar spine BMD.[11] Body mass index (BMI) strongly correlates with BMD in T2DM and partially explains the observed higher BMD. Nonetheless, many studies demonstrate that elevated BMD persists even after adjusting for BMI, suggesting additional factors, such as hyperinsulinemia, may play a role.[12]
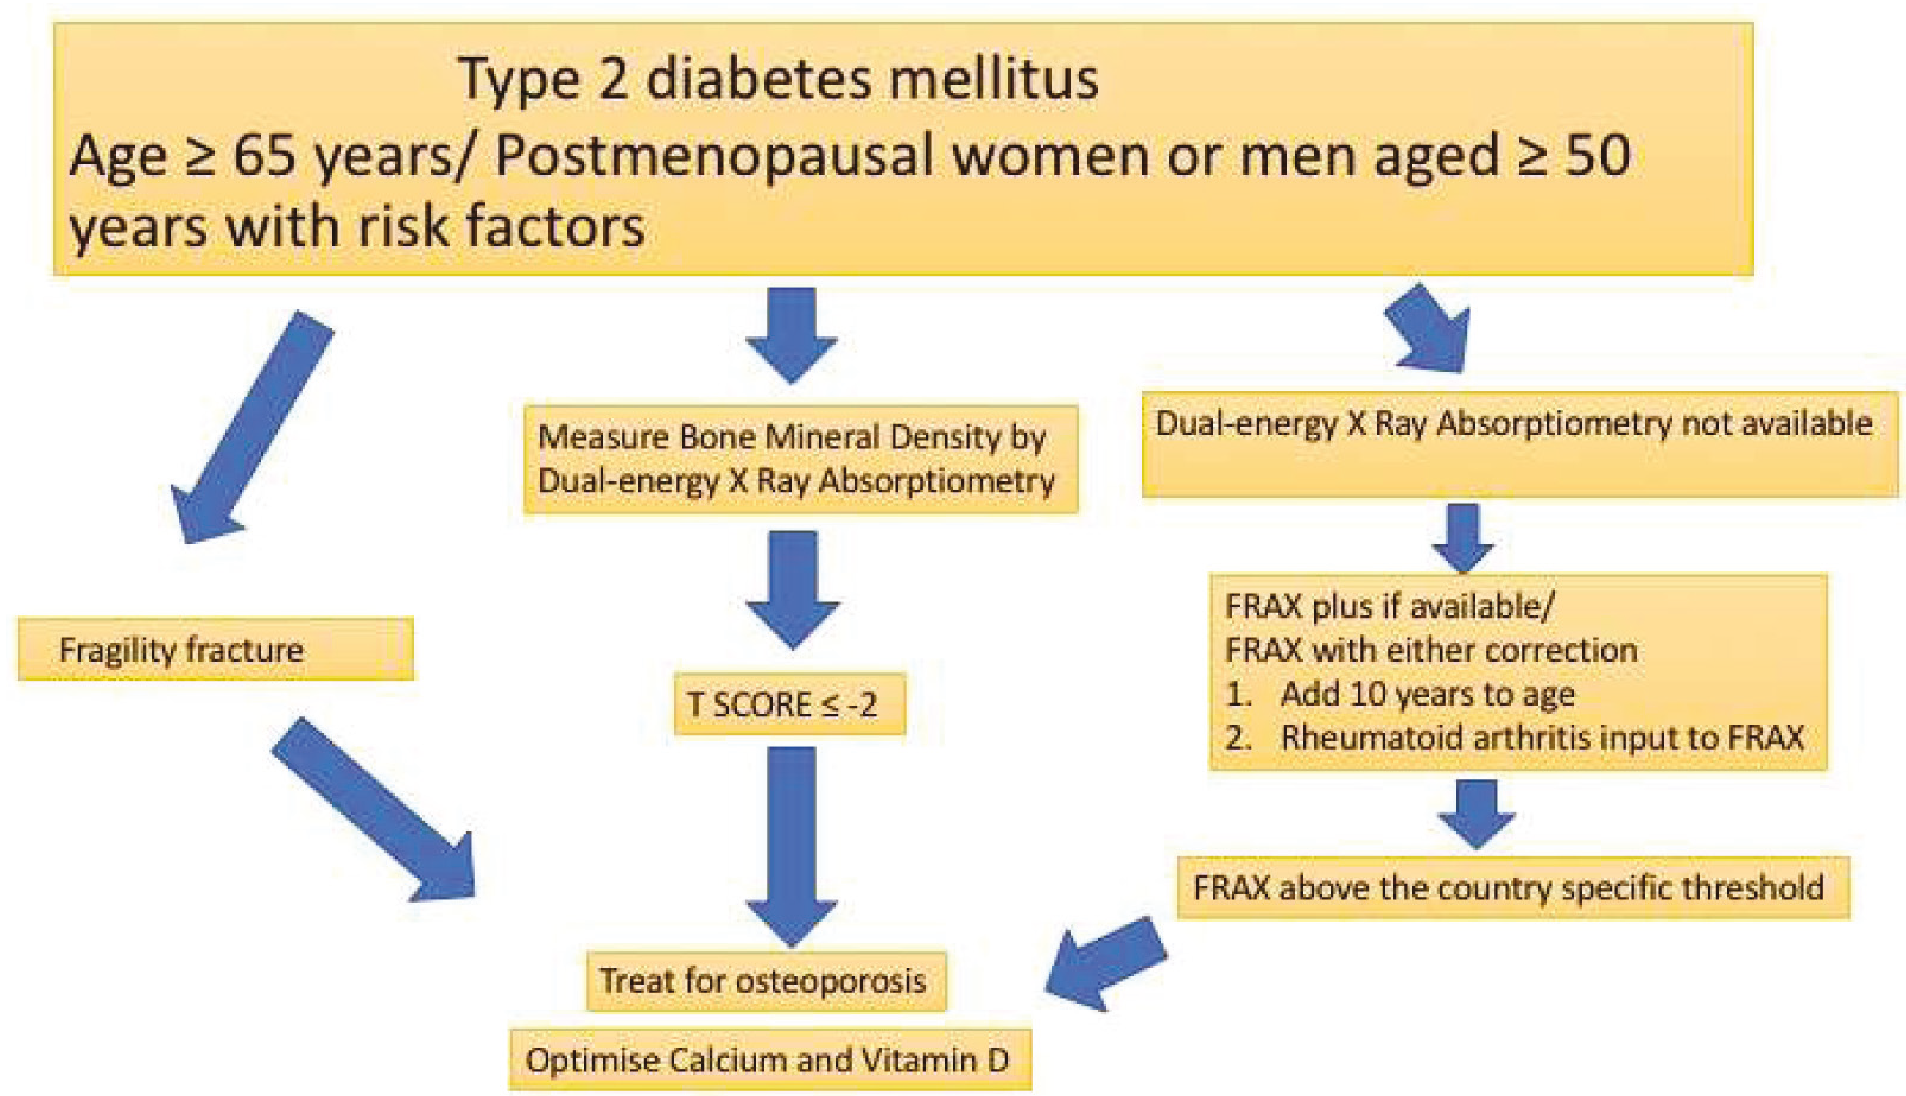
The American Diabetes Association recommends that BMD should be monitored with DXA in adults ≥65 years and T2DM and in younger individuals (postmenopausal women or men aged ≥ 50 years) with T2DM and multiple risk factors. These diabetes-specific risk factors include diabetes duration more than 10 years, frequent hypoglycaemic events, haemoglobin A1C (HbA1C) > 8%, frequent falls, microvascular complications, glucocorticoid use and diabetes medications known to increase fracture risk. Reassessment is advised every two to three years, based on the initial screening results and the presence of additional risk factors.[13] Both antiresorptive and anabolic agents decrease fracture risk in T2DM, though the evidence favouring antiresorptive drugs is more.[14] An algorithm for managing bone health in individuals with T2DM is presented in Figure 1.
Trabecular Bone Score
Trabecular bone score (TBS) is a noninvasive assessment derived from DXA images that evaluates the texture of trabecular bone. By analysing pixel grey levels, TBS provides information on bone microarchitecture, which BMD alone cannot capture.[15] Diabetes may influence bone microarchitecture, leading to the hypothesis that patients with T2DM would have lower TBS measurements. Supporting this, several observational studies have reported that TBS is lower in individuals with diabetes compared to those without.[16-18] However, other studies have found no statistically significant association between TBS and diabetes.[19,20] These conflicting findings are likely due to variations in population characteristics, sampling methods and analytical approaches. Additionally, factors such as the duration of diabetes, use of antidiabetic medications and HbA1c levels may contribute to these discrepancies. A meta-analysis including 12 studies reported that patients with T2DM exhibited a significantly lower TBS compared to non-T2DM, with a standardised MD of −0.31 (95% confidence interval [CI]: −0.45 to −0.16). The difference in TBS was more pronounced in women (−0.50; 95% CI: −0.69 to −0.32) than in men (−0.04; 95% CI: −0.17 to 0.10).[21]
Approach to bone health in Type 2 diabetes mellitus
Vertebral Fracture Assessment
VFs are the most prevalent type of osteoporotic fractures and are linked to reduced quality of life, as well as significant morbidity and mortality. The presence of a VF increases the risk of subsequent fractures. However, many VFs go clinically unnoticed and undiagnosed. DXA provides a cost-effective, low-radiation, convenient, and reliable method for VF assessment. Detecting previously unrecognised VFs can alter fracture risk evaluation, diagnostic classification and treatment approaches.[22] The prevalence of vertebral compression fractures is high among individuals with T2DM. In a study of Korean postmenopausal women with T2DM, the prevalence of spinal compression fractures, including grade 1 (mild) fractures, was 46%. Of all fractured vertebral bodies, 37% were classified as grade 2 (moderate) or grade 3 (severe).[23]
High-resolution Peripheral Quantitative Computed Tomography
High-resolution peripheral quantitative computed tomography (HR-pQCT) is an advanced imaging modality designed for in vivo three-dimensional assessments of volumetric BMD (vBMD), geometry and microstructure at the distal radius and tibia. This technology uniquely provides surrogate quantitative measures of bone strength. With its small isotropic voxel size (82 μm for first-generation scanners and 61 μm for second-generation scanners), HR-pQCT distinguishes between cortical and trabecular bone compartments and allows detailed visualisation and quantification of trabecular bone microarchitecture and cortical porosity. Its low radiation dose (<5 μSv per scan) makes it particularly suitable for paediatric populations and enables repeated testing in adults to monitor changes in bone quantity and quality resulting from disease, treatment or interventions.[24]
The Framingham HR-pQCT study revealed that after adjusting for age, sex, weight and height, individuals with T2DM exhibited lower cortical vBMD (P < .01), higher cortical porosity (P = .02) and a smaller cross-sectional area (P = .04) at the tibia, but not at the radius. Trabecular indices in T2DM were either similar to or better than those without T2DM. Associations between T2DM and bone parameters were consistent across sex and obesity status (all interaction P > .05); however, differences emerged when stratified by fracture history. Specifically, cortical vBMD at the tibia and cortical thickness at the radius were lower in the presence of a fracture in those with T2DM versus those without. Conversely, cortical porosity at the radius was higher in T2DM, but only in those without a prior fracture. These findings from a large, community-based cohort of older adults highlight that modest cortical bone deterioration and reductions in bone area are characteristic of diabetic bone disease in older adults.[25] Despite its utility, HR-pQCT is not widely accessible and is primarily employed in research settings, which limits its integration into routine clinical evaluations.
Fracture Risk Assessment Tool
FRAX→, a widely used tool to estimate 10-year fracture probability, underestimates fracture risk in T2DM. It is a computer-based algorithm that estimates the 10-year probability of major osteoporotic fractures (MOF) as well as HF. Fracture risk is calculated using easily obtainable clinical risk factors, with the optional inclusion of femoral neck BMD. FRAX→ is tailored to specific countries and has been calibrated for use in more than 60 countries.[26]
Despite its strengths, concerns have been raised about the performance of FRAX→ in individuals with T2DM, as diabetes is not directly included as an input variable. Although T2DM is associated with higher BMD, it is also an independent risk factor for osteoporotic fractures beyond what is captured by FRAX→. In light of these limitations, several strategies have been proposed to enhance FRAX’s performance for individuals withT2DM. Four specific adjustments have been suggested: (a) using rheumatoid arthritis as a surrogate input in FRAX→, (b) incorporating the TBS into FRAX→ calculations, (c) reducing the femoral neck T-score input by 0.5 standard deviations, and (d) increasing the age input by 10 years. A study by Leslie et al. demonstrated that each of these methods improved FRAX’s ability to assess fracture risk in this population.[27] FRAXplus→ incorporates a further adjustment for the duration of T2DM which also influences fracture risk.[28]
Bone Turnover Markers
Bone turnover markers (BTMs), such as C-terminal telopeptide (CTX) and procollagen type I N-terminal propeptide (P1NP), offer insights into bone remodelling dynamics. Several studies have demonstrated that markers of bone formation and resorption are lower in T2DM as compared to non-T2DM.[29,30] This finding was further validated by a recent systematic review and meta-analysis of 66 studies which confirmed that T2DM is characterised by a state of low bone turnover, with a MD in CTX of −0.10 ng/mL (−0.12 to −0.08) and PINP of −10.80 ng/mL (−12.83 to −8.77).[31] High BTMs are generally associated with an increased fracture risk. However, in T2DM, BTM levels are low and are not consistently predictive of fracture risk, meaning they should not be interpreted as indicative of a low fracture risk in these patients. Despite this, in T2DM patients with low BMD and/or fragility fractures who are initiated on antiosteoporotic treatments such as bisphosphonates, BTMs remain valuable for monitoring drug compliance and treatment efficacy. There is speculation that antiresorptive therapies might negatively impact bone quality by further reducing already low bone turnover. However, recent studies have confirmed that reducing bone turnover with antiresorptive drugs does not increase fracture risk in diabetic patients; on the contrary, it is associated with a decreased risk of fractures.[32]
Conclusion
The close association of T2DM and bone health highlights the need for innovative diagnostic and therapeutic approaches. Use of advanced imaging, personalised risk assessment and integrated care can mitigate fracture risk and improve outcomes for individuals with T2DM. Ongoing research and adherence to evolving guidelines will be pivotal in achieving these goals.
Footnotes
Declaration of conflicting interests
The authors declared no potential conflicts of interest with respect to the research, authorship and/or publication of this article.
Funding
The authors received no financial support for the research, authorship and/or publication of this article.
Institutional ethical committee approval number
Ethical approval is not necessary, as this is a review article.
Credit author statement
Lakshmi Nagendra helped in conceptualisation, methodology, data curation, data analysis, writing, reviewing and editing.
Saptarshi Bhattacharya was involved in conceptualisation, methodology, data analysis, writing, reviewing and editing.
Data availability
Not applicable.
Use of artificial intelligence
Not applicable.