
Abstract
Introduction:
The relationship between Vitamin D levels and asymptomatic hyperuricaemia is gaining attention due to its potential implications for public health. This study investigates this association, focussing on the interplay between Vitamin D, serum uric acid and parathyroid hormone (PTH) levels in adults.
Materials and Methods:
This cross-sectional observational study, conducted from April to June 2023, involved 100 adult participants (65 males, 35 females) from the general population. Participants were selected based on specific inclusion and exclusion criteria. Data collection included a comprehensive questionnaire, physical examinations and blood sample analysis. Vitamin D levels were measured using liquid chromatography-tandem mass spectrometry, uric acid levels through an enzymatic colorimetric test, and PTH levels via a chemiluminescent immunoassay. Statistical analysis was performed using SPSS version 25.0, IBM Corp, Chicago, IL, USA.
Results:
The study found an inverse correlation between Vitamin D and serum uric acid levels. Participants with lower Vitamin D levels had higher serum uric acid and PTH levels. The mean serum Vitamin D level was 32.17 ng/mL, and the mean serum uric acid level was 9.99 mg/dL. The study categorised Vitamin D levels as deficient, insufficient and sufficient, observing significant variations in PTH and uric acid levels across these categories.
Conclusion:
The study suggests a significant relationship between Vitamin D levels and serum uric acid concentrations in adults, with implications for the management of asymptomatic hyperuricaemia and related metabolic conditions. Despite limitations, such as the cross-sectional design and small sample size, this study highlights the potential significance of Vitamin D levels in the management of asymptomatic hyperuricaemia and related metabolic disorders.
Introduction
The interplay between Vitamin D levels and asymptomatic hyperuricaemia in adults has become an important research focus, particularly given the potential public health implications of their association. Hyperuricaemia, marked by elevated serum uric acid levels, has been identified as a key risk factor for cardiovascular diseases (CVD) and functions as an antioxidant defense within the body.[1–3] Concurrently, Vitamin D deficiency is increasingly recognised for its role in various metabolic dysfunctions. Vitamin D deficiency may trigger elevated parathyroid hormone (PTH) levels, which could potentially increase serum uric acid concentrations.[4,5] Moreover, low levels of Vitamin D have been independently linked to an elevated risk of CVD, suggesting a multifaceted relationship between Vitamin D, PTH and hyperuricaemia.[6]
The evidence from the NHANES 2007-2014 data underscores an inverse relationship between serum 25(OH) D levels and Vitamin D intake (both dietary and supplemental) with hyperuricemia in males.[7] In females, this inverse association is evident with serum 25(OH) D and dietary Vitamin D intake, but not with supplemental Vitamin D intake.[6] Furthermore, the causal relationship between Vitamin D and uric acid has been explored through studies employing bidirectional mediation analysis. These studies suggest that genetic factors, specifically variations in certain genes, may influence the levels of 25(OH)D and uric acid, thus hinting at a genetic underpinning in the association between Vitamin D and hyperuricemia. However, the clinical implications of these genetic associations are currently limited due to the small effect sizes observed.[8]
In light of these findings, the primary aim of this study is to investigate the association between Vitamin D levels and asymptomatic hyperuricaemia among adults. To achieve this, the study has set specific objectives: first, to analyse serum levels of Vitamin D among adults; second, to assess serum uric acid concentrations; and third, to evaluate hormone PTH levels in this demographic. This study, therefore, seeks to build on existing research by examining these associations in an adult population, with a view to contributing to the broader understanding of metabolic disorders and their interrelations. The outcomes of this research could offer significant insights into the prevention and management strategies for conditions associated with Vitamin D deficiency and hyperuricaemia.
Materials and Methods
Study design and participants
This study conducted between April and June 2023, adopted a cross-sectional observational design. It involved the recruitment of 100 adult participants, comprising 65 males and 35 females, from the general population. Participants were chosen based on convenience sampling. The study’s ethical protocol was duly approved by the Institutional Ethics Committee.
Inclusion and exclusion criteria
The inclusion criteria for participants encompassed individuals aged 18 –65 years who were willing and able to provide informed consent. Importantly, participants had no history of chronic illness or long-term medication use. Conversely, exclusion criteria comprised individuals with a known history of renal disease, liver disease or metabolic bone disease. Additionally, those currently or recently (within the last six months) using medications affecting Vitamin D, uric acid or PTH metabolism, such as diuretics or Vitamin D supplements, were excluded. Pregnant or breastfeeding women and individuals with any condition that could potentially interfere with the study’s outcomes were also excluded.
Data collection and analysis
The data collection process involved the administration of a comprehensive questionnaire to obtain demographic information, medical history and lifestyle factors from the participants. Furthermore, physical examinations were conducted, including measurements of height, weight and blood pressure.
Sample collection and analysis
Blood sample collection was performed under fasting conditions in the morning between 7:00 and 9:00 AM, with samples drawn from the antecubital vein using aseptic techniques. After collection, blood samples were subjected to specific processing and storage procedures. Blood was allowed to clot for 30 minutes at room temperature before centrifugation at 3,000 rpm for 10 minutes. The resulting serum was separated and aliquoted into cryovials and then stored at -80°C until further analysis.
Laboratory measurements
For the quantification of Vitamin D levels, the study employed the liquid chromatography-tandem mass spectrometry method. The unit of measurement was ng/mL, with an analytical range of 4.8–150 ng/mL. Uric acid levels were determined using an enzymatic colorimetric test with uricase, measured in mg/dL, within an analytical range of 1.5–9.0 mg/dL. PTH levels were assessed through a chemiluminescent immunoassay, measured in pg/mL, with an analytical range of 15–65 pg/mL.
Statistical analysis
Statistical analysis included assessing the normality of data using the Shapiro-Wilk test. Descriptive statistics were presented with mean and standard deviation for numerical data and percentages for categorical data. All data analysis was performed using SPSS version 25.0, IBM Corp, Chicago, IL, USA.
Quality control and ethical considerations
Quality control measures were rigorously implemented throughout the study, including regular calibration and validation of analytical instruments and participation in inter-laboratory comparison programmes. Ethical considerations emphasised the confidentiality of participant data and ensured that participants had the right to withdraw from the study at any time. Confidentiality of patient data was maintained by using password-protected folders, with access provided only to the authors.
Results
Study population characteristics
The study encompassed a total of 100 patients. The gender distribution of the study population was skewed towards males, comprising 65% (n = 65) of the participants, while females constituted 35% (n = 35). The average age of the participants was 48.70 years, with a standard deviation of 12.53 years, indicating a middle-aged demographic.
Biochemical parameters
Serum vitamin D levels
The range of serum Vitamin D levels in the study participants varied from a minimum 9.17 ng/mL to a maximum of 36.87 ng/mL. The mean Vitamin D level was 32.17 ng/mL with a standard deviation of 9.33 ng/mL.
Serum uric acid levels
The study recorded serum uric acid levels ranging between 4.56 mg/dL and 12.56 mg/dL. The mean serum uric acid level was found to be 9.99 mg/dL with a standard deviation of 2.56 mg/dL.
PTH levels
PTH levels in the study population were noted with a range from 23.56 pg/mL to 70.23 pg/mL. The mean PTH level was 23.56 pg/mL, accompanied by a standard deviation of 13.67 pg/mL.
Vitamin D levels
The study population was categorised based on their Vitamin D levels into three groups: deficient (<20 ng/mL), insufficient (20.1–30 ng/mL), and sufficient (30.1–100 ng/mL). A sizable portion (48%) of participants were found to have insufficient Vitamin D levels, with a mean of 26.87 ng/mL (±19.65). The deficient and sufficient categories comprised 37% and 15% of the population, respectively.
Parathyroid hormone concentrations according to vitamin D range
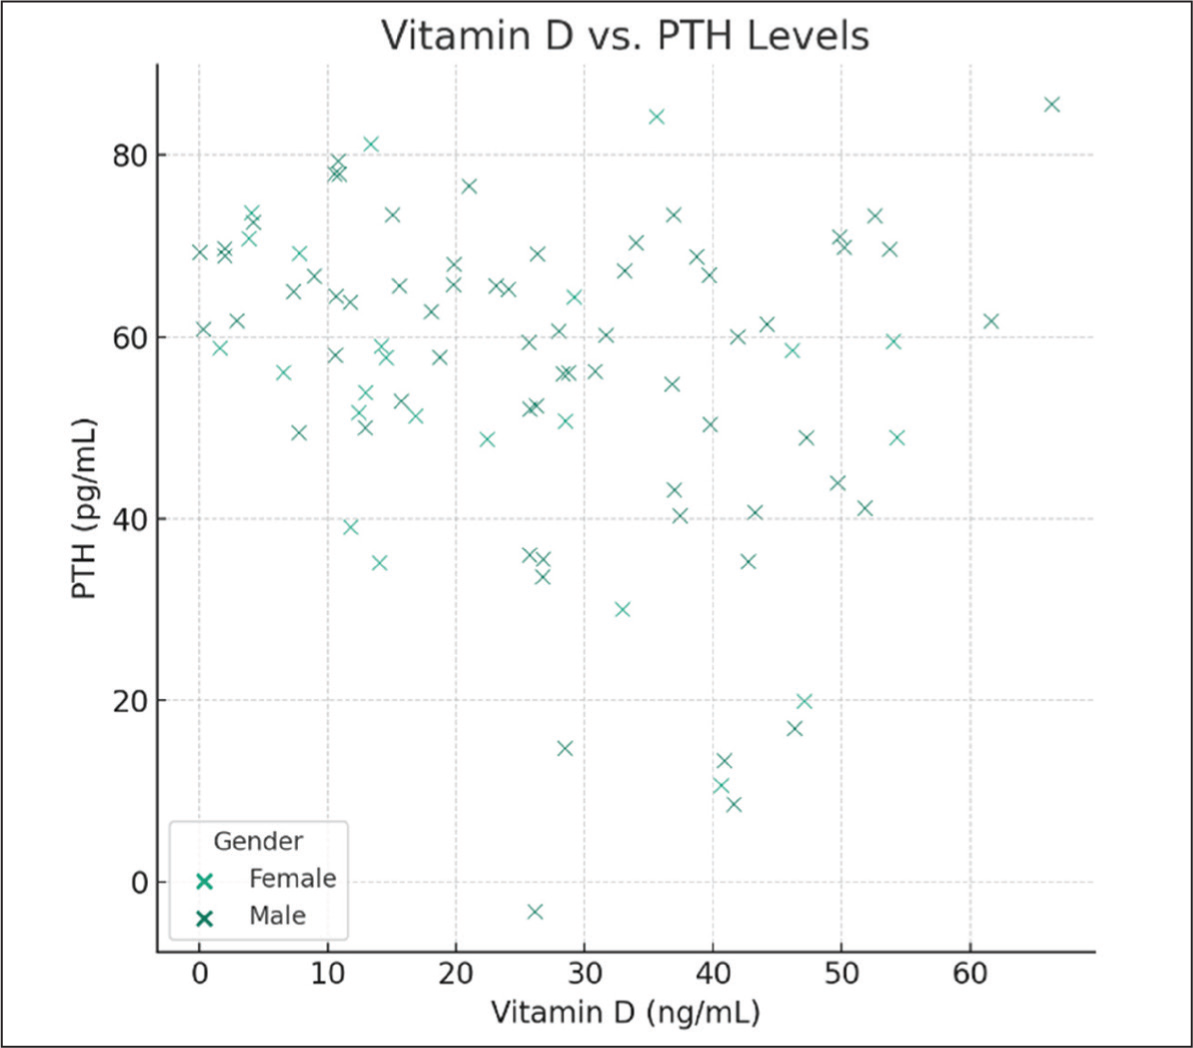
PTH concentrations varied considerably across different Vitamin D level categories. In Vitamin D deficient participants (<20 ng/mL), the mean PTH level was markedly higher at 70.23 pg/mL (±5.20). This level decreased progressively in the insufficient (57.89±10.13 pg/mL) and sufficient (23.56±13.67 pg/mL) Vitamin D categories, indicating a potential inverse relationship between Vitamin D levels and PTH concentrations. Vitamin D levels inversely correlate with PTH levels. The regression model indicates that an increase in Vitamin D is associated with a decrease in PTH levels, highlighting the interplay between Vitamin D and calcium-phosphorus metabolism regulated by PTH (Figure 2).
Serum uric acid levels according to vitamin D levels
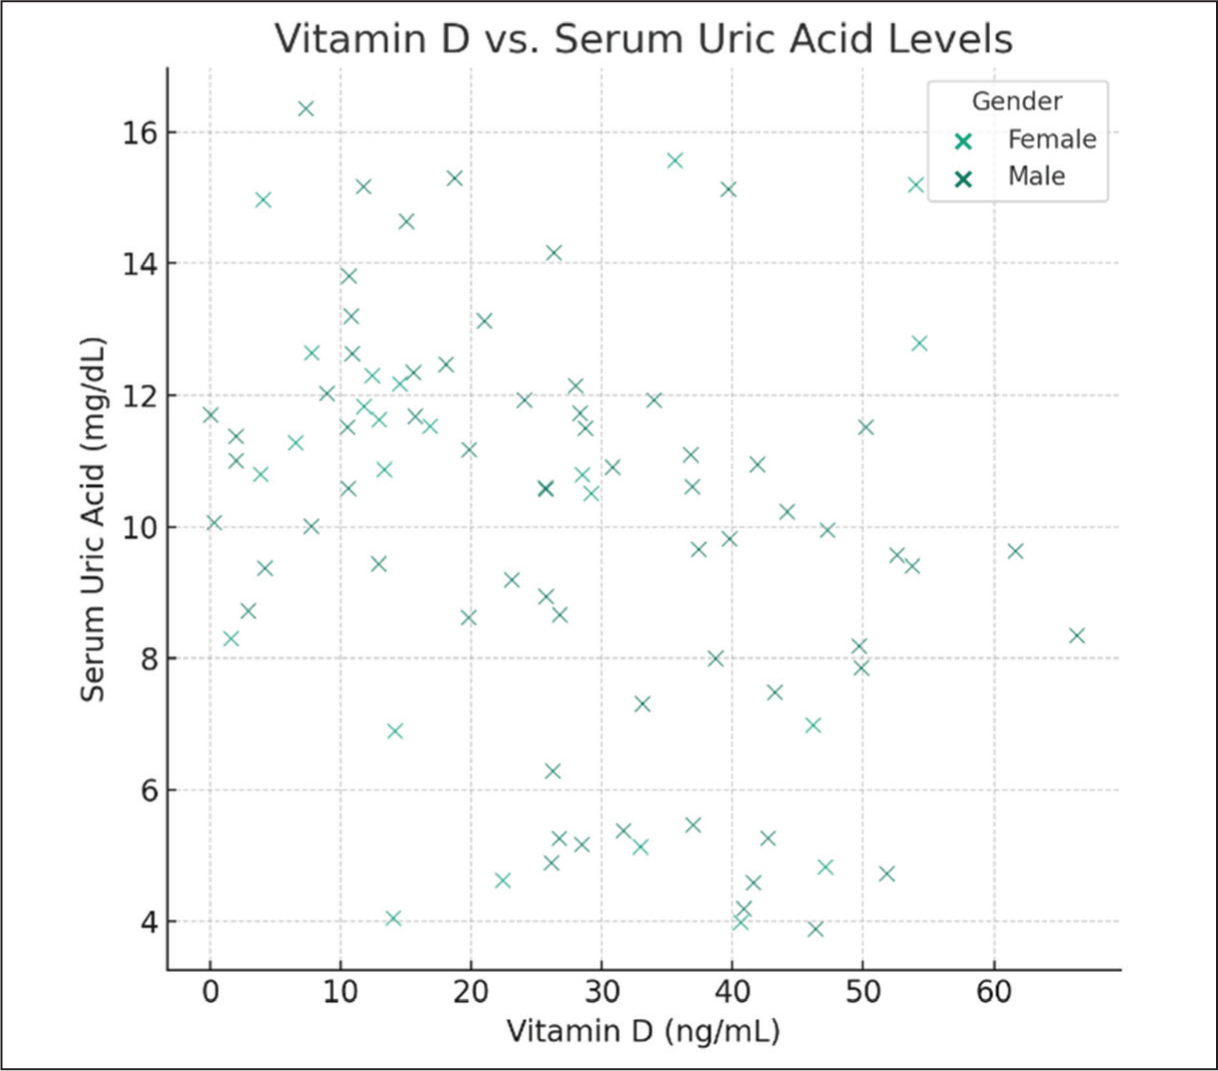
Similarly, serum uric acid levels demonstrated significant variation based on Vitamin D status. In the deficient category (<20 ng/mL), the mean serum uric acid level was the highest at 12.56 mg/dL (±2.10). This level decreased in the insufficient (10.34 ± 1.78 mg/dL) and sufficient (4.56 ± 0.78 mg/dL) categories, suggesting a potential correlation between lower Vitamin D levels and higher serum uric acid levels. Linear regression analyses revealed a significant relationship between Vitamin D levels and serum uric acid levels. Specifically, for each unit increase in Vitamin D (ng/mL), there is an associated decrease in serum uric acid levels by approximately 0.066 mg/dL, adjusted for age and gender (Figure 1). This association underscores the potential role of Vitamin D in modulating serum uric acid, a marker often linked with metabolic disorders.
Scatter plot of Vitamin D vs serum uric acid levels (There is a dispersion of data points across the Vitamin D spectrum for both genders, indicating variability in serum uric acid levels among the study population)
Scatter plot of Vitamin D vs PTH levels (PTH: parathyroid hormone; there is a dispersion of data points across the Vitamin D spectrum for both genders, indicating variability in PTH levels among the study population)
Correlation analysis
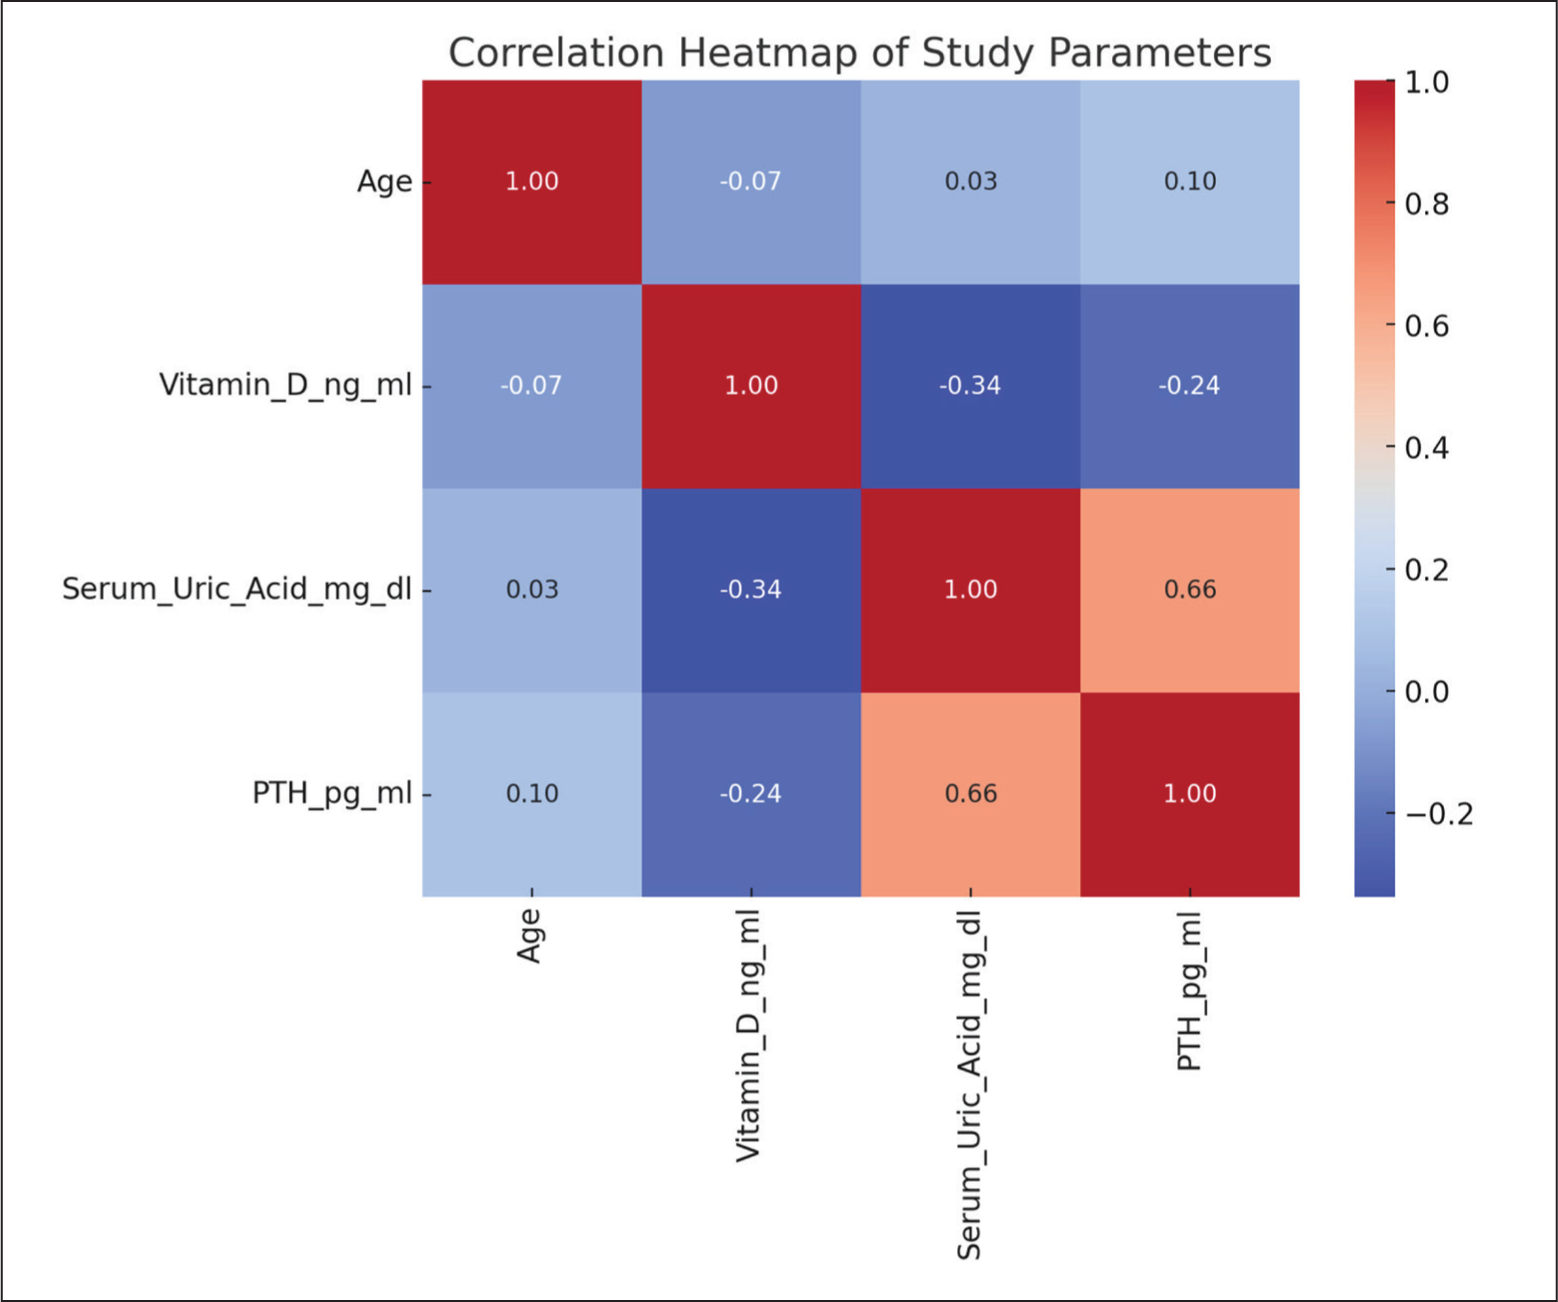
The correlation matrix analysis unveils significant relationships among biochemical parameters. Notably, higher Vitamin D levels correlate moderately (–0.339) with lower serum uric acid levels and inversely (–0.239) with PTH levels, indicating its potential roles in uric acid reduction and calcium homeostasis, respectively. Moreover, a strong positive correlation (0.662) between serum uric acid and PTH levels suggests a link between uric acid metabolism and parathyroid function, as depicted in Table 1, Table 2 and Figure 3.
Linear regression coefficients for serum uric acid and PTH levels
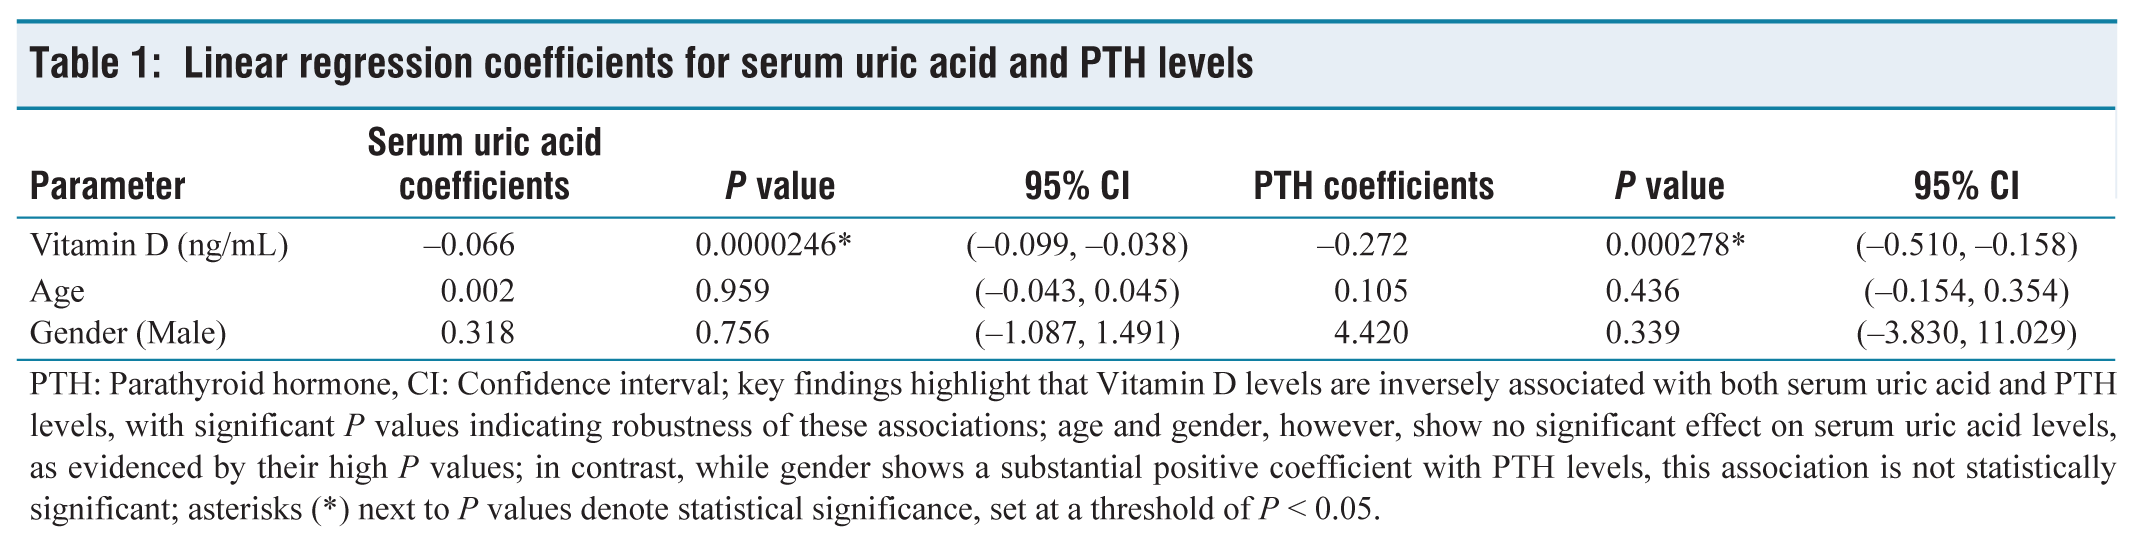
PTH: Parathyroid hormone, CI: Confidence interval; key findings highlight that Vitamin D levels are inversely associated with both serum uric acid and PTH levels, with significant P values indicating robustness of these associations; age and gender, however, show no significant effect on serum uric acid levels, as evidenced by their high P values; in contrast, while gender shows a substantial positive coefficient with PTH levels, this association is not statistically significant; asterisks (*) next to P values denote statistical significance, set at a threshold of P < 0.05.
Correlation matrix of study parameters
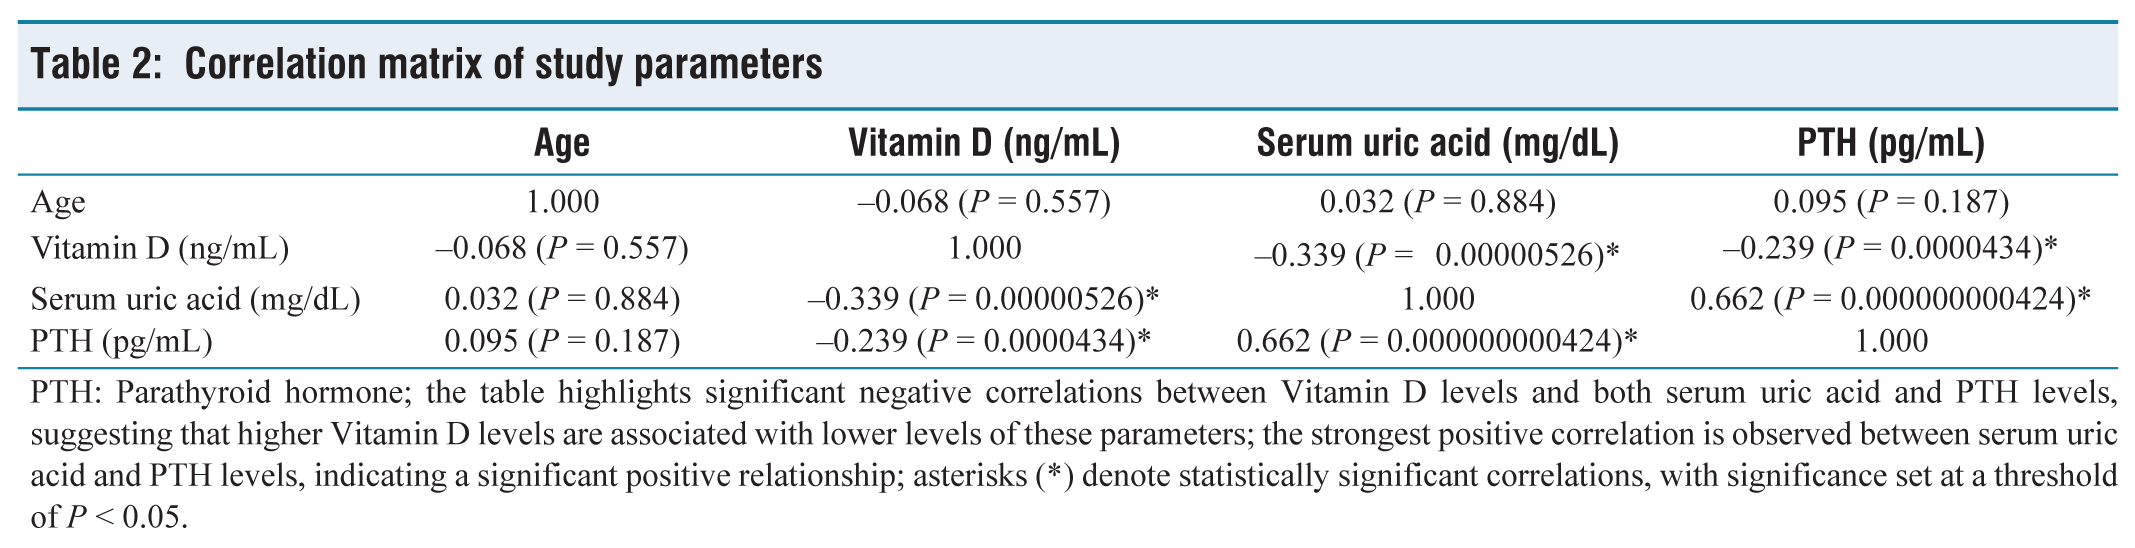
PTH: Parathyroid hormone; the table highlights significant negative correlations between Vitamin D levels and both serum uric acid and PTH levels, suggesting that higher Vitamin D levels are associated with lower levels of these parameters; the strongest positive correlation is observed between serum uric acid and PTH levels, indicating a significant positive relationship; asterisks (*) denote statistically significant correlations, with significance set at a threshold of P < 0.05.
Correlation heat map (The heatmap provides a visual representation of the Pearson correlation coefficients between each pair of parameters. The scale on the right-hand side indicates the correlation coefficient values, with 1.0 representing a perfect positive correlation, −1.0 a perfect negative correlation, and 0 no correlation. The colour intensity varies from blue to red, where blue signifies a negative correlation, red signifies a positive correlation and the colour intensity reflects the strength of the relationship. A strong positive correlation (0.66) is observed between serum uric acid levels and PTH levels, indicated by a deep red colour. Conversely, there is a moderate negative correlation between Vitamin D levels and both serum uric acid and PTH levels, shown by the blue shades)
Discussion
The complex interplay between Vitamin D levels and asymptomatic hyperuricaemia in adults forms the crux of extensive research, with various studies elucidating a nuanced and multifaceted relationship. Our investigation contributes to this critical area of study by analysing this association in an adult population, with a specific focus on the serum levels of Vitamin D, uric acid and PTH. Our findings suggest a possible inverse correlation between Vitamin D and serum uric acid levels, as well as an association between Vitamin D deficiency and elevated levels of PTH. These observations are in harmony with prior research, thereby enriching our understanding of this complex relationship. Numerous studies have highlighted an inverse relationship between Vitamin D levels and serum uric acid. A systematic review and meta-analysis revealed that lower serum Vitamin D levels are associated with hyperuricemia.[5] This is corroborated by an analysis of the NHANES 2007–2014 data, which found that serum 25-hydroxyvitamin D [25(OH)D] might be negatively associated with hyperuricaemia in US adults.[7] These studies suggest a potential protective role of Vitamin D against hyperuricaemia, which could be attributed to the regulatory effects of Vitamin D on renal function and its impact on the excretion of uric acid.
The exploration of potential causal links between Vitamin D and uric acid has led to intriguing findings. A study utilising bidirectional mediation analysis suggested that genetic variations could influence the levels of 25(OH)D and uric acid, indicating a genetic component in the Vitamin D-hyperuricaemia association.[8] Contrarily, a study employing Mendelian randomisation did not find evidence to support a direct causal role of 25(OH)D on serum uric acid levels.[9] This highlights the complexity of these associations and suggests that genetic factors, along with environmental and lifestyle factors, may play a significant role. Demographic variables, particularly age and ethnicity, are crucial in this relationship. A study focussing on middle-aged and elderly Chinese Han women found that Vitamin D insufficiency was associated with elevated serum uric acid.[10] This underscores the importance of considering demographic factors when interpreting the relationship between Vitamin D and hyperuricaemia, as these factors can influence both the prevalence of Vitamin D deficiency and the metabolism of uric acid.
In our study, the mean serum Vitamin D level was found to be 32.17 ng/mL, contrasting with findings from a study on myocardial infarction patients, where Vitamin D deficiency was defined as levels below 20 ng/mL.[11] This variation in Vitamin D levels across different studies highlights the importance of context in interpreting Vitamin D status and its potential links with various health conditions, such as coronary artery disease. Regarding serum uric acid levels, our study observed a mean of 9.99 mg/dL. This is particularly noteworthy when compared with a study on middle-aged and elderly Chinese Han women, which defined elevated uric acid levels based on the 90th percentile but did not specify an average level.[10] The demographic differences between these studies, in terms of age and ethnicity, emphasise the potential for variation in uric acid levels across populations. This variation suggests that standards for defining elevated uric acid levels may need to be adjusted based on specific population characteristics. Furthermore, our study’s findings are supported by a systematic review and meta-analysis that also explored the relationship between Vitamin D levels and serum uric acid.[12] This study confirmed an inverse relationship, echoing our observations and reinforcing the potential impact of Vitamin D status on serum uric acid levels. The consistency of these findings across different studies and contexts underscores the potential importance of Vitamin D status in managing and understanding hyperuricaemia.
Our study enriches this developing research area through detailed data on a particular adult cohort. We found that serum Vitamin D levels varied inversely with serum uric acid levels. Additionally, participants with lower Vitamin D levels were more likely to have higher PTH levels. This observation is in line with the hypothesis that Vitamin D deficiency could trigger the release of PTH, which may subsequently elevate serum uric acid levels. This mechanism may be part of a broader physiological response to Vitamin D deficiency, involving alterations in calcium metabolism and changes in renal function that could affect uric acid excretion. The clinical implications of these findings are significant. Hyperuricaemia is a known risk factor for CVD, and uric acid plays a role in antioxidant defense within the body. Given prior evidence that low Vitamin D is associated with increased CVD risk, our findings indicate a complicated interaction between Vitamin D, PTH and hyperuricaemia. This interplay could be crucial in the pathogenesis of metabolic disorders and CVD, highlighting the need for a holistic approach to patient management that considers these interrelated factors.
The present study has several limitations that need acknowledgement. It adopts a cross-sectional design, preventing the establishment of causality between Vitamin D levels and asymptomatic hyperuricaemia. The relatively small sample size of 100 participants, with skewed gender distribution, may limit the generalisability of findings. Furthermore, the study exclusively focusses on asymptomatic hyperuricaemia and lacks data on dietary and lifestyle factors that influence Vitamin D and uric acid levels. Laboratory measurement limitations should also be considered. Prospective longitudinal studies could clarify the temporal relationship between Vitamin D levels and serum uric acid. Expanding the study population’s diversity and including individuals with varying degrees of hyperuricemia would enhance generalisability. Detailed assessments of lifestyle factors and genetic studies may provide a more comprehensive understanding. Lastly, interventional studies on Vitamin D supplementation’s effects on uric acid levels could offer therapeutic insights.
Conclusion
Our study provides valuable insights into the relationship between Vitamin D levels, serum uric acid and PTH concentrations among adults. The findings suggest an inverse relationship between Vitamin D and serum uric acid levels, and a potential association between Vitamin D deficiency and elevated PTH levels. These observations contribute to the understanding of the complex interplay between these parameters and their potential role in the pathogenesis of metabolic disorders and CVD. Despite of limitations, such as the cross-sectional design and small sample size, this study highlights the potential role of Vitamin D levels in asymptomatic hyperuricaemia and related metabolic disorders. Future studies may focus on longitudinal and interventional approaches.
Footnotes
Declaration of Conflicting Interests
The authors declared no potential conflicts of interest with respect to the research, authorship and/or publication of this article.
Funding
The authors received no financial support for the research, authorship and/or publication of this article.
Institutional Ethical Committee Approval Number
Institutional Ethical Committee Approval Number: Dr MGR – ERI/SLMCH/2023/004 dated 08.02.2023.
CRediT Author Statement
Conception: RH; Investigations: RH, NJ, SR; Data curation: AK, AM; Original draft: NJ, SR; Review and corrections: RH, NJ, SR; Visualizations: SR; Supervision: RH.
Data Availability
Data is available within the manuscript.
Use of Artificial Intelligence
Not applicable.