
Abstract
Background and Objectives:
When it comes to the nature of the relationship between tuberculosis (TB) and Vitamin D, the available literature offers contradictory findings. The purpose of this study was to assess the relationship between Vitamin D and TB, as well as the relationship between Vitamin D and functional capacity in TB patients from Central India.
Materials and Methods:
This case–control study comprised 400 participants divided into two equal groups: cases (200 TB patients) and controls (200 healthy household contacts). The study involved subjecting participants to standard laboratory tests in accordance with the management guidelines implemented by the institute. Abbott Architect i1000SR PLUS was used to test the Vitamin D levels while the Karnofsky Performance Status Scale score was used for the functional capacity of cases. Vitamin D levels were categorized into deficient, insufficient, and sufficient for every participant. Information related to the study was noted down on a structured pro forma.
Results:
The difference in Vitamin D values between the two groups was statistically significant, with 62.5% of deficient patients in the case group compared to 15% in the control group (confidence interval = 95%, χ 2 = 173.97, P = 0.001). The relationship between Vitamin D concentration and Karnofsky scale categories was statistically significant (r = 0.752, P = 0.01).
Interpretation and Conclusions:
Vitamin D deficiency is associated with TB and a decrease in functional capacity in the region of Bundelkhand, highlighting the vital role of Vitamin D for TB patients.
Introduction
India reported 19,33,381 incident tuberculosis (TB) cases in 2021, up 19% from the previous year.[1] Studies conducted globally have indicated a correlation between pulmonary TB and reduced levels of Vitamin D.[2-4] Inconsistent findings regarding the status of Vitamin D have also been reported across regions.[5,6] The present investigation was conducted with the aim of assessing levels of Vitamin D in recently confirmed TB patients at our health-care facility and to ascertain whether there exists a statistically significant distinction between the Vitamin D status of TB patients and that of their healthy household contacts (HHCs). In addition, the study also investigated any potential association between circulating levels of Vitamin D and the functional capacity of TB patients.
Materials and Methods
The present study was an institution-based case–control investigation that was carried out at our tertiary care institute over a period from June 2021 to October 2022. The present investigation was commenced subsequent to obtaining the required authorization from the institutional ethics review committee and was carried out in compliance with the Helsinki Declaration of 1975, as amended in 2000. Informed and written consent from each participant was obtained prior to their recruitment for the study. The study involved a total of 400 participants who were evenly distributed into two distinct categories, namely cases (n = 200) and controls (n = 200). The sample size for the study was calculated using G*Power software version 3.1. Developed at the Institute for Experimental Psychology, (Dusseldor, Germany). We kept α at 0.05, power at 0.8, and exposure likelihood among controls at 0.32; the ratio of controls to cases was one. The required sample size came out to be 371; then, we rounded it off and reached the sample size of 400 participants.
The case group included 200 consecutively recruited newly diagnosed TB patients admitted to the chest and TB unit of the department of medicine. The control group consisted of 200 healthy HHCs of hospitalized patients who were matched by age and gender. In the control group, TB was ruled out through a detailed history and clinical evaluation. HHC refers to a person who shared the same enclosed living space with the index TB patient for one or more nights or for frequent or prolonged daytime periods in the 3 months preceding the current TB treatment.[7]
For the case group, patients who met the following criteria were included: being above 18 years of age and having a confirmed diagnosis of TB through positive smear, polymerase chain reaction, culture of Mycobacterium tuberculosis in sputum, or radiology. In order to diagnose extrapulmonary TB cases, radiology, biopsy, and cytological specimen analysis were utilized.
Patients on Vitamin D supplementation within 3 months of the study, malabsorption syndromes, cystic fibrosis, celiac disease, asthma, chronic obstructive pulmonary disease, renal disease, liver disease, and pregnant cases were excluded from the study.
A chest X-ray, sputum smear acid-fast bacillus staining, fine-needle aspiration cytology testing of lymph nodes, a cytological examination of the pleural fluid, and adenosine deaminase (ADA) were utilized to diagnose TB. A thorough laboratory assessment of all subjects in accordance with the management protocols established by the institution was also performed, which included a complete hemogram, plasma glucose concentration, HIV ELISA testing, HBsAg and antibodies against HCV, and albumin and serum calcium concentrations.
The primary outcome measure for the study was Vitamin D level in TB patients and compared with HHC, for which 5 ml sample of venous blood was drawn into a disposable syringe to measure the amount of Vitamin D. The Abbott Architect i1000SR PLUS was then used to test the Vitamin D levels in the serum using chemiluminescence. The identification of Vitamin D deficiency was based on serum 25(OH) D levels of 20 ng/mL. Categorization as insufficiency was established when serum 25(OH) D concentration was in the range of 20–30 ng/mL. Vitamin D levels were deemed sufficient when serum 25(OH) D concentration was above 30 ng/mL.[8]
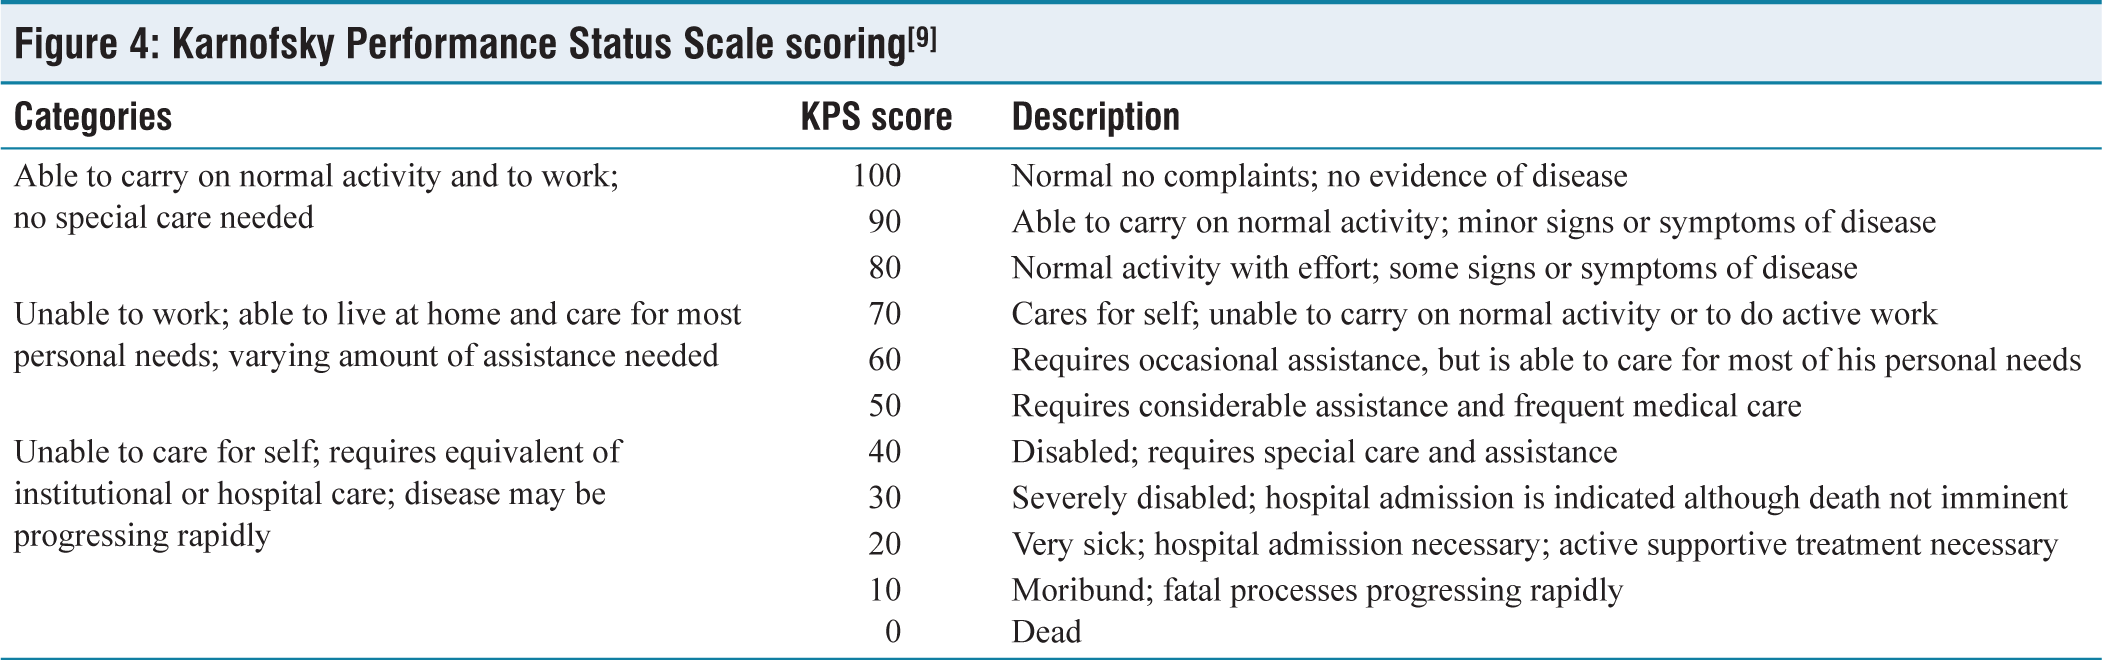
For the secondary outcome of the study, which was exploring the relationship between the functional capacity of the TB patients and Vitamin D levels, the Karnofsky Performance Status (KPS) Scale score [Figure 4], which is a frequently used technique to evaluate a patient’s functional condition, was utilized.[9]
Demographic information, clinical assessment, detailed history, and all the relevant information pertaining to the study were taken from the participants and noted down on a structured pro forma developed particularly for the study.
The data were initially processed and coded on MS Excel version 2021. The Statistical Package for the Social Sciences, 23 (IBM Chicago, Illinois, USA), was utilized for the statistical analysis. By using the Kolmogorov–Smirnov and Shapiro–Wilk tests, the normality of the data was evaluated. For categorical variables, frequency and proportions were used in the descriptive analysis, while mean and standard deviation were used for continuous variables. Categorical outcomes were compared between the groups using the Chi-square test, and to determine the association between continuous variables, a student-independent samples t-test was used. Spearman correlation coefficient was used to evaluate the relationship between KPS Scale score and Vitamin D status. P <0.05 was considered statistically significant at the 95% confidence interval (CI).
Results
We recruited 200 newly diagnosed TB patients (case group) and included 200 age- and sex-matched HHC (control group) for each participant. The majority of participants (40%) in each of the groups under observation were between the ages of 31 and 40 years. The case group had a mean age of 32.83 ± 14.37 years, while the control group had a mean age of 33.23 ± 14.07 years. In contrast to the control group, in which 60% of the participants were men and 40% women, the case group had 65% of men and 35% of women. The gender distribution revealed no statistically significant difference between the groups under observation [Table 1] (CI = 95%, χ 2 = 1.06, P = 0.301).
Sociodemographic characteristics of the participants (n=400)
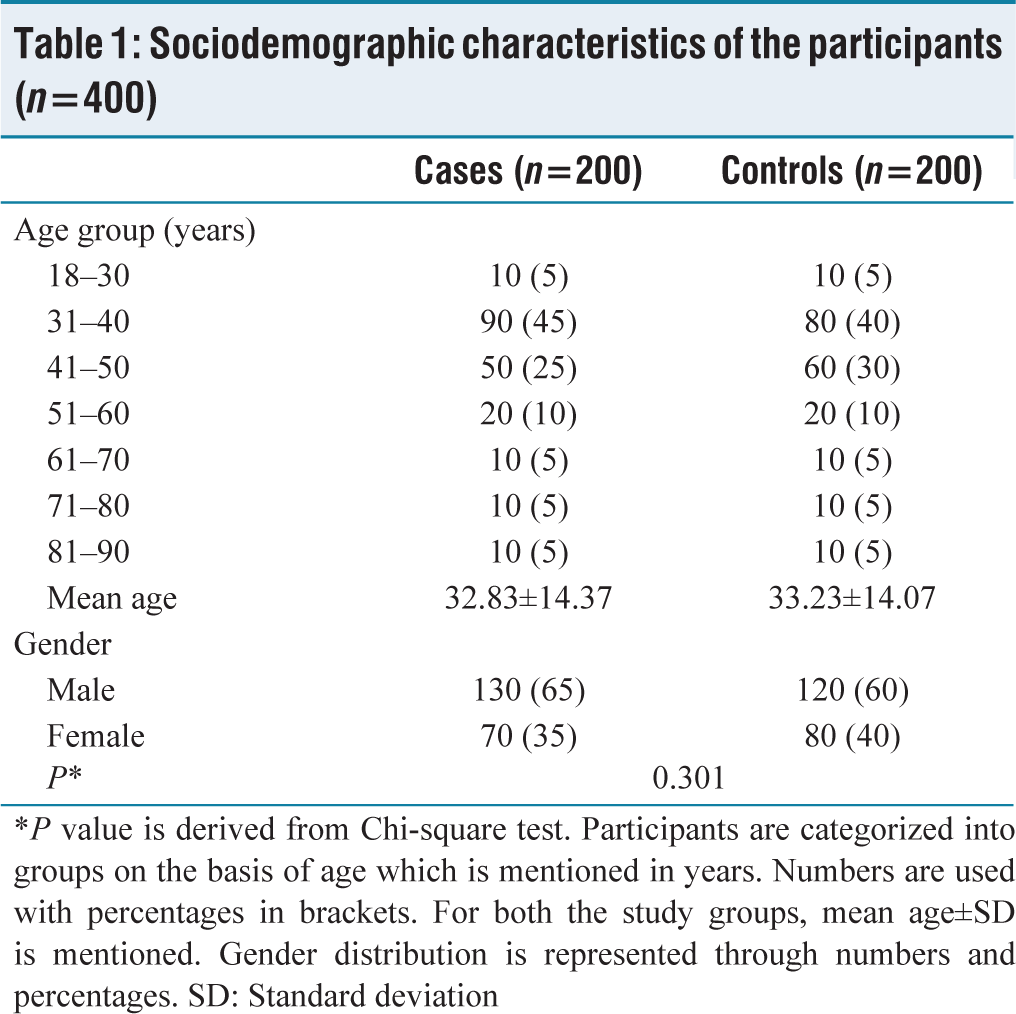
*P value is derived from Chi-square test. Participants are categorized into groups on the basis of age which is mentioned in years. Numbers are used with percentages in brackets. For both the study groups, mean age±SD is mentioned. Gender distribution is represented through numbers and percentages. SD: Standard deviation
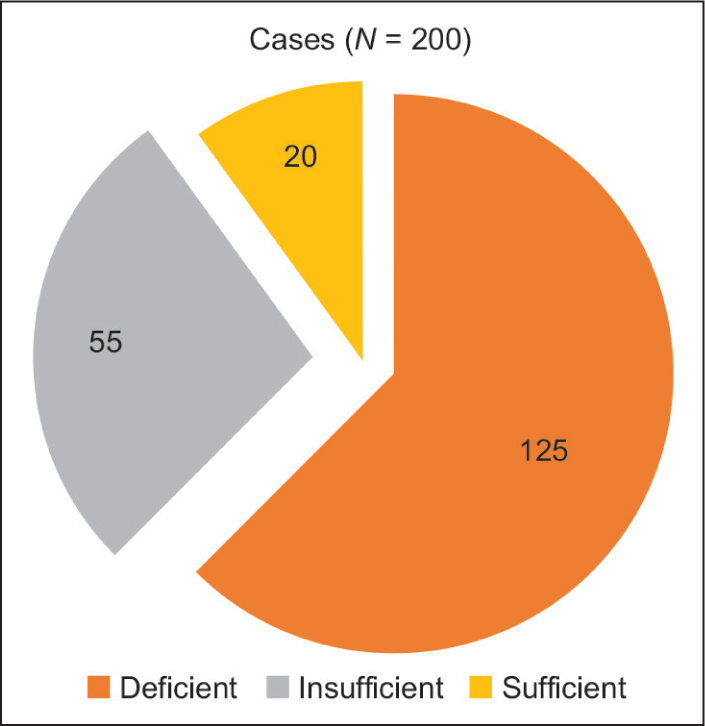
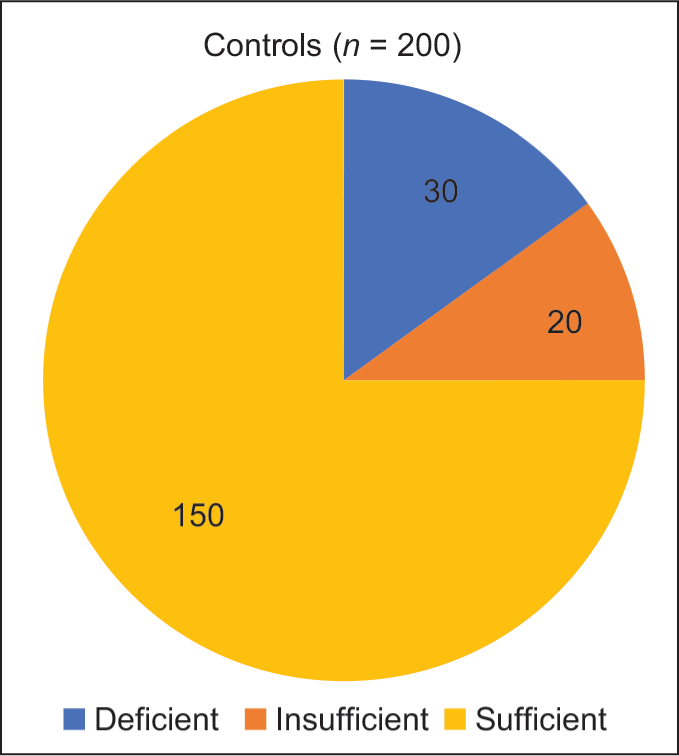
The mean Vitamin D level for the case group was calculated to be 17.6 ± 7.2 ng/dL, while the mean Vitamin D level in the control group was 32.34 ± 13.79 ng/dL. The results of the study revealed that a majority of the participants in the case group, precisely 62.5%, were deficient in Vitamin D. Furthermore, 27.5% of the cases fell into the Vitamin D insufficiency category, while only 10% of the participants had sufficient Vitamin D levels [Figure 1]. The result of the current investigation showed that 15% of the participants in the control group were Vitamin D deficient, 10% had insufficient Vitamin D concentration, and 75% had sufficient levels of Vitamin D in their serum [Figure 2]. These observed differences in Vitamin D levels between the control and case groups were of statistical significance, indicating an association between TB and Vitamin D [Table 2] (CI = 95%, χ 2 = 173.97, P = 0.001).
Pie chart depicting the distribution of tuberculosis cases in relation to Vitamin D levels (n = 200)
Pie chart depicting the distribution of healthy household contacts in relation to Vitamin D levels (n = 200)
Vitamin D levels among the study participants (n=400)
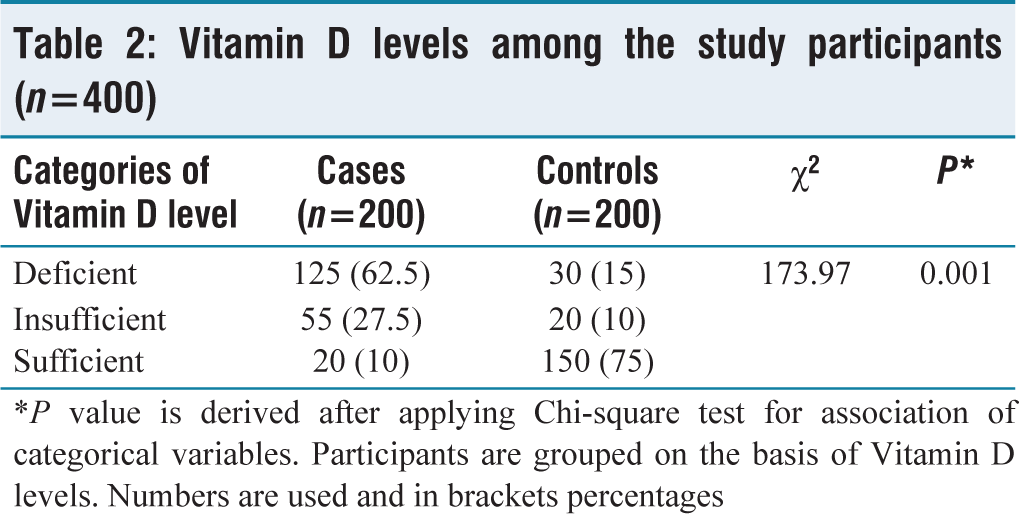
*P value is derived after applying Chi-square test for association of categorical variables. Participants are grouped on the basis of Vitamin D levels. Numbers are used and in brackets percentages
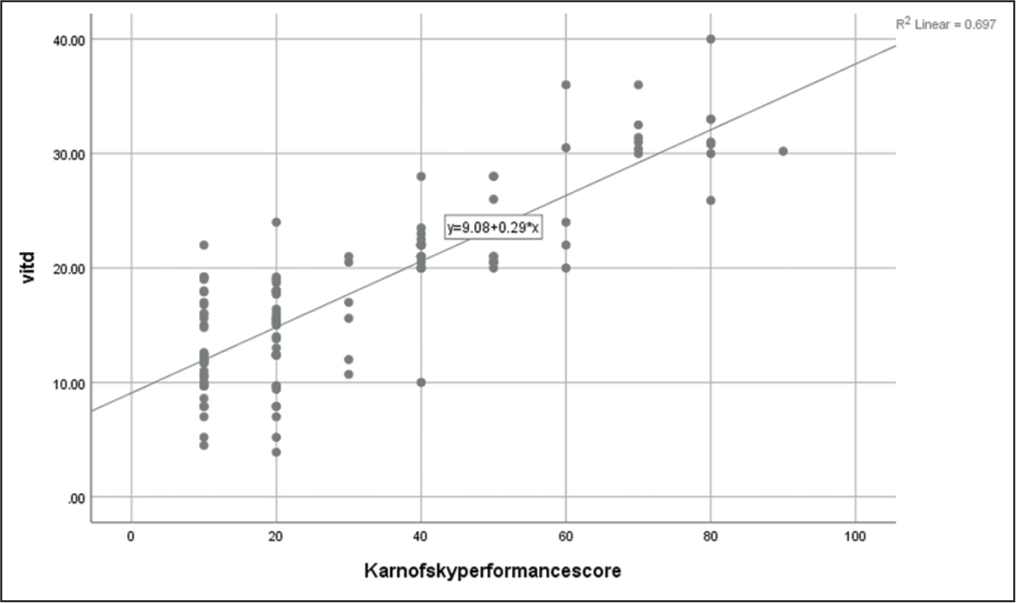
In our study, we explored the relationship between the Vitamin D concentration and the Karnofsky scale score of patients with TB using the Spearman correlation test. The statistical analysis revealed a significant association between the concentration of Vitamin D and the various categories of the Karnofsky scale score (r = 0.752, P = 0.01), indicating Karnofsky values changed with changes in Vitamin D in the TB patients [Table 3] [Figure 3].
Vitamin D values in different Karnofsky scale (range of performance status) groups among the tuberculosis cases (n=200)
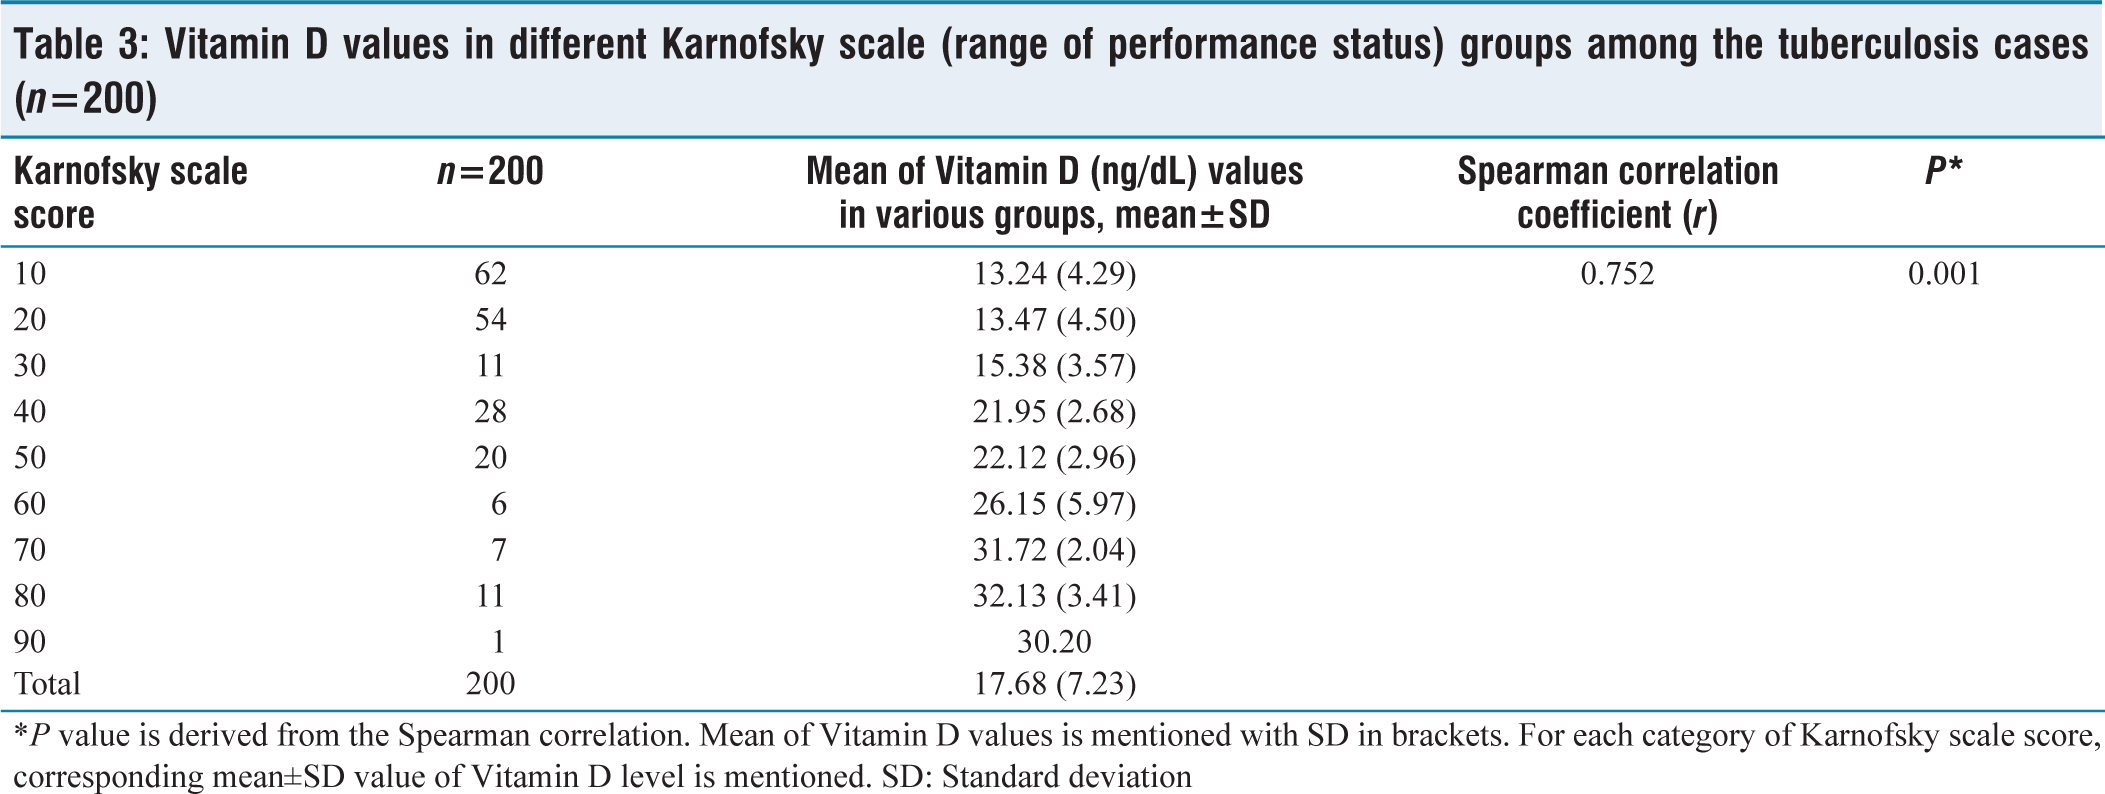
*P value is derived from the Spearman correlation. Mean of Vitamin D values is mentioned with SD in brackets. For each category of Karnofsky scale score, corresponding mean±SD value of Vitamin D level is mentioned. SD: Standard deviation
Scatter plot depicting the relation between Vitamin D and range of performance in tuberculosis (TB) patients (n = 200). We can clearly see the relation between the Vitamin D level and the range of performance is positive one, indicating that as the value of Vitamin D increases, the range of performance will increase, and this increase can be attributed to 68% (R2 = 0.68) of the patients of TB in our study
TB patients were further categorized into pulmonary and extrapulmonary, drug susceptible or resistant, and HIV positive or negative. The mean value for Vitamin D concentration in pulmonary TB patients was 18.02 ± 7.58 ng/dL and 17.26 ± 6.58 ng/dL in extrapulmonary cases, but with no statistical difference (CI = 95%, t = 0.730, P = 0.466). The mean value of Vitamin D concentration was found to be 17.65 ± 7.26 ng/dL for HIV-negative TB patients and 17.48 ± 7.13 ng/dL for HIV-positive TB patients. However, this difference between the concentrations of Vitamin D in the two categories was not of statistical significance (CI = 95%, t = 0.102, P = 0.919). The results also demonstrated that the difference in the mean value of Vitamin D concentration between patients with drug-susceptible TB (17.82 ± 7.36 ng/dL) and those with drug-resistant TB (17.25 ± 6.50 ng/dL) was without any statistical significance for the current study [Table 4].
Discussion
Vitamin D is known to play an important part in maintaining the immunity of the host against M. tuberculosis. The physiologically useful variant of Vitamin D known as calcitriol escalates the generation of what is known as cathelicidin peptide. Cathelicidin is a naturally occurring antimicrobial peptide that possesses microbicidal properties, which enable it to combat the causative agent of TB.[10]
The primary objective of investigation was to evaluate the Vitamin D concentration of TB patients presenting to our tertiary care institute, with a specific focus on examining any possible relationship that exists between TB and Vitamin D. The results revealed that 62.5% (125) of patients in the case group were Vitamin D deficient, while only 15% of healthy HHCs in the control group had the deficiency. These findings suggest a higher proportion in the case group of individuals with Vitamin D deficiency in comparison to healthy HHCs. The difference in serum concentration of Vitamin D between TB patients and the HHC was of statistical significance (P = 0.001), with the Vitamin D concentration being significantly higher in the case group than the HHC group.
Different categories of tuberculosis cases with their comparison based on Vitamin D (ng/dL) values (n=200)
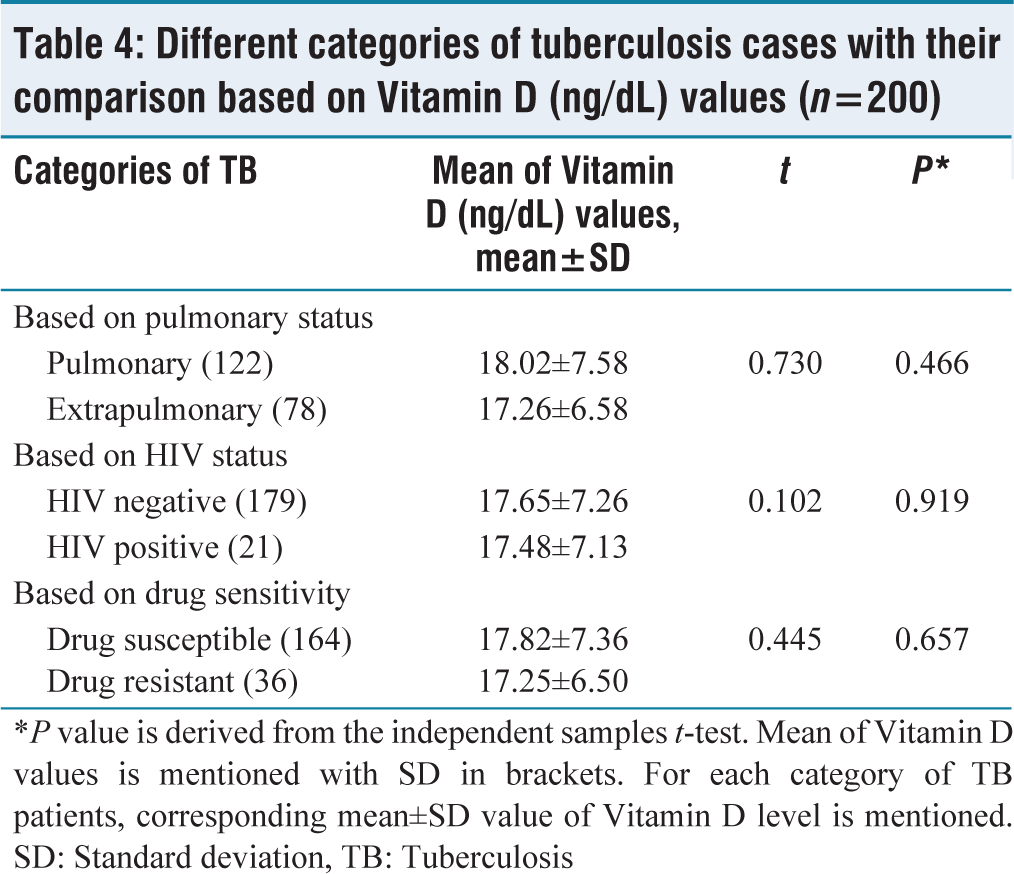
*P value is derived from the independent samples t-test. Mean of Vitamin Dvalues is mentioned with SD in brackets. For each category of TB patients, corresponding mean±SD value of Vitamin D level is mentioned. SD: Standard deviation, TB: Tuberculosis
Karnofsky Performance Status Scale scoring[9]
In line with the results of our investigation, research done in Vietnam involving TB patients and controls demonstrated that the proportion of Vitamin D deficiency among males with TB was 35.4%, in comparison to 19.5% for the control group (P = 0.001).[11] A research investigation from Greenland included TB patients and controls, and it revealed that individuals with 25(OH) D levels below 30 ng/mL or above 56 ng/mL were susceptible to developing TB.[12] A prospective study conducted on healthy HHCs in Pakistan revealed a significant correlation between vitamin D deficiency and TB, suggesting a linkage between the two variables.[2] A study undertaken in Kerala by Sasidharan et al. on TB patients revealed that the concentration of Vitamin D was significantly reduced in TB patients when compared to healthy controls.[13] A study carried out by Ho-Pham et al. in Vietnam showed that there was no significant distinction in Vitamin D concentration between individuals with TB and those without TB. This finding stands in contrast with the findings in our own study.[14] However, a study conducted in Tanzania revealed a higher serum concentration of Vitamin D in individuals with TB in comparison to those without TB who served as controls.[15]
According to the meta-analysis performed by Zeng et al., a blood plasma Vitamin D concentration of 25 nmol/L was seen to be associated with an elevated risk of TB, while 26–50 nmol/L was correlated with a possibly increased risk, and 51–75 nmol/L was linked to no risk of developing TB.[16] A different meta-analysis performed by Aibana et al. revealed a dosage-dependent association between Vitamin D and the likelihood of TB, with the maximum risk being observed in HIV-positive people with significant Vitamin D deficiency.[17]
The observed discrepancies in the concentrations of Vitamin D across various studies may be attributed to several factors, including variations in the definitions of Vitamin D deficiency, diverse methodologies employed for measuring Vitamin D levels, the geographical locations of these studies, differences in eating behaviors, and the presence of other comorbidities. We determined and compared the means of the Vitamin D concentrations with various categories of the Karnofsky scale score, which indicates that higher serum Vitamin D concentrations in TB patients were associated with higher performance on the scale, resulting in less disease severity. These differences in the concentration of Vitamin D were of statistical significance (P = 0.01). This result suggests that TB patients with a sufficient concentration of serum Vitamin D might have a higher functional capacity in comparison to those with a lower concentration of serum Vitamin D.
The current investigation aimed to examine the potential variations in serum Vitamin D levels among three distinct categories of TB patients. We divided the participants with TB based on the site, if they were drug susceptible or resistant to drugs for TB, and their HIV status. According to our data, no statistically significant changes in Vitamin D concentration were found among the aforementioned TB groups.
HIV infection increases susceptibility to TB, which has also been recognized as a contributing factor to Vitamin D inadequacy.[18] The present study sought to examine whether there was any association between HIV status and the concentration of serum Vitamin D in patients with TB. The findings from our study indicated that the differences in Vitamin D levels between HIV-positive and HIV-negative TB patients were not statistically significant (P = 0.919) between the two groups. Consistent with our research, a study conducted in South Africa also reported no significant difference of statistical importance in the proportion of cases of Vitamin D deficiency between TB patients who were HIV positive and those who were HIV negative.[19]
The significance of the research lies in the fact that there has been a dearth of recent studies on serum Vitamin D concentration of TB patients in the Bundelkhand region of India. Therefore, the present study aims to fill this gap in knowledge by investigating the Vitamin D levels in TB patients from this region. The present study is characterized by the inclusion of HHCs as a means of comparison for Vitamin D concentration. This approach is advantageous as it allows for the matching of controls with cases, thereby eliminating any potential bias that may arise from the sociodemographic characteristics of the population.
Our findings indicate a statistically significant association between a deficiency of Vitamin D and TB. However, it should be noted that the study was unable to establish a definitive causal relationship between Vitamin D levels and TB. This limitation is due to the fact that we assessed the Vitamin D levels of TB patients only after the diagnosis of TB had been made. From our study, it is not possible to determine whether low Vitamin D levels contributed to the development of TB or whether TB itself led to a decrease in Vitamin D levels. Further research that is prospective in nature might be able to clear this conundrum.
This study was conducted in our tertiary health care setting, as it was not possible to conduct a study in multiple locations due to limitations such as time, cost, and facility. As a result, there is a chance that some TB cases from the community may have been missed. In the future, if the situation for conducting a more comprehensive study is feasible, then we should definitely aim for a multicentric study prospective study involving every public health facility in the Bundelkhand region.
Conclusions
From the study, we can conclude that the Bundelkhand region of India has a high prevalence of Vitamin D deficiency among patients diagnosed with TB. The study confirms an association of significance between Vitamin D deficiency and TB, highlighting the importance of Vitamin D in the management of TB patients. In addition, the study revealed a significant association between a decrease in functional capacity and lowering levels of Vitamin D, further emphasizing the crucial role of Vitamin D in improving the outcome of TB patients. These findings underscore the need for further research to explore the potential benefits of Vitamin D supplementation in the prevention and treatment of TB.
Footnotes
Declaration of Conflicting Interests
The authors declared no potential conflicts of interest with respect to the research, authorship and/or publication of this article.
Funding
The authors received no financial support for the research, authorship, and/or publication of this article.
Institutional Ethical Committee Approval Number
This study was carried out after receiving approval from the institutional ethics committee.
CRediT Author Statement
SZ1 and ZS2: Definition of intellectual content, literature survey, prepared first draft of manuscript, implementation of study protocol, data collection, data analysis, and manuscript preparation; NA3 and SZ1: Concept, design, clinical protocol, manuscript preparation, editing, and manuscript revision; and M4 and MS5: Design of study, literature survey, statistical analysis and interpretation, manuscript preparation, review, and submission of article.
Data Availability
Raw data were generated at Maharani Lakshmi Bai Medical College, Jhansi. Derived data supporting the findings of this study are available from the corresponding author SZ on reasonable request.
Use of Artificial Intelligence
Any kind of generative AI has not been used for the writing of this manuscript, nor for creation of graphics, images, tables or their captions.