
Abstract
Introduction:
One of the primary reasons for fatalities and impairments on a global scale is cardiovascular disease (CVD), encompassing a cluster of illnesses impacting the heart and blood vessels. A CVD risk assessment is a screening tool that measures an individual’s risk of developing CVD.
Objective:
The objective of this study was to compare and evaluate cardiovascular risk using internationally recognized CVD risk scoring systems.
Methodology:
A prospective, cross-sectional study was carried out for 2 months after the approval of the ethics committee. Naive myocardial infarction (MI) patients presenting to the cardiology department and conforming to the inclusion criteria were enrolled in the study. Patients who are taking statins or any lipid-lowering drugs, as well as patients who are on low-dose aspirin and antidiabetic medications. Using the aforementioned gathered data, the cardiovascular risk scores were computed employing the American College of Cardiology/American Heart Association (ACC/AHA), Framingham risk scores (FRS), European Society of Cardiology (ESC) – CVD risk calculator, and QRISK→3-2018, and subsequently categorized as low risk, intermediate, or high risk based on the individual risk scores.
Results:
We enrolled 42 patients, with a mean age of 60 years with male dominance. The mean body mass index was 25.5. With a cholesterol/high-density lipoprotein (HDL) ratio of 4.9, the mean systolic blood pressure/diastolic blood pressure was 126/77 mm of Hg. The mean ACC/AHA cardiovascular risk score for 10-year atherosclerotic cardiovascular disease (ASCVD) risk was 11.34%, FRS mean score was 12%, ESC CVD risk calculator mean score was 15.45%, and QRISK3-2018 risk calculator mean score was 20.87% in patients presenting with first time with MI.
Conclusion:
QRISK3-2018 risk calculator is the most effective out of all the risk calculators with a maximum detection rate of MI in first time presented patients with Naïve MI patients.
Introduction
In India, cardiovascular diseases (CVDs) remain a significant contributor to mortality, accounting for 28.1% of all during 2018, as per reports.[1] CVD is a group of diseases that affect the heart and blood vessels, a leading cause of death and disability worldwide. As India experiences an epidemiological transition with an increasing burden of CVD, it is crucial to strengthen preventive strategies. AVD risk assessment, also known as a heart disease risk assessment, is a screening tool that measures an individual’s risk of developing CVD. Risk factors for CVD include high blood pressure, smoking, high cholesterol, diabetes, inactivity, being overweight or obese, a family history of CVD, increasing age, being male, an unhealthy diet, and excessive alcohol consumption. Early detection and management of these risk factors can prevent complications such as congestive heart failure, stroke, kidney disease, and artery disease. With an increasing number of young adults being affected by myocardial infarction (MI) in India, it is important to identify and address these risk factors to reduce the burden of CVD in the country.[2]
Despite the existence of multiple long-term studies that have identified risk factors and devised risk assessment scoring systems, these scoring systems may not account for ethnicity or cater specifically to the Indian population. In this study, we aim to analyze which risk scoring system, among the American College of Cardiology (ACC), European Society of Cardiology (ESC) CVD risk calculator, Framingham risk score (FRS), and QRISK→3-2018, is the most reliable for the Indian population. These four scoring systems are the most used worldwide. By identifying the most reliable score, we hope to improve timely interventions and help mitigate the burden of CVDs in India, as part of the ongoing epidemiological transition.[3-6]
Objectives
To evaluate cardiovascular risk using internationally recognized CVD risk scoring systems
To compare and correlate various internationally accepted CVD risk scores.
Methodology
A prospective, cross-sectional study was carried out for 2 months after the approval of the institutional ethics committee. Naive MI patients presenting to the cardiology department and conforming to the inclusion criteria were enrolled in the study.
Inclusion criteria
Patient of naïve myocardial infarction
Patients of either sex, above the age of 18 years
Patients willing to give written informed consent.
Exclusion criteria
Patient on statins or any lipid-lowering drug
Patient on low-dose aspirin
Patients on antidiabetic drugs.
Data were collected after obtaining written informed consent. Demographic data, history of presentation, and risk factors were noted.
The diagnosis of MI was determined in accordance with the fourth universal definition of MI.[4] In addition, the angiographic findings of patients with MI were recorded. Laboratory values including complete blood counts, serum electrolytes, fasting lipid profile, renal function tests, liver function tests, glycated hemoglobin, cardiac troponins, and fasting blood sugar were also taken into consideration. Based on the data collected above, the predicted cardiovascular risk scores based on ACC/American Heart Association (AHA), FRS ESC-CVD risk calculator, and QRISK→3-2018 were calculated and divided into low risk, intermediate, and high risk based on the categorization of the risk scores individually.
These data were collected for 8 weeks and were entered in the standard Case Record Form.
Parameters to assess
ACC/AHA CVD risk calculator: the ACC and the AHA score is intended to estimate a person’s risk of experiencing a cardiovascular event, such as a heart attack or stroke, over the next 10 years. The assessment is derived from conventional risk elements such as age, gender, blood pressure, cholesterol levels, smoking habits, and diabetes. It assigns a score ranging from 0% to 100%, where a higher score signifies an elevated likelihood of experiencing a cardiovascular event. The purpose of this score is to assist physicians in making informed decisions regarding preventive measures and treatment options. One of the key features of the ACC/AHA risk score is that it was developed using a large, diverse population, which allows for its generalization to other populations. It is also been extensively validated in multiple studies, which increases its clinical usefulness. In addition, the score has been modified to include additional risk factors, such as kidney function and atrial fibrillation, which help improve its accuracy. Other factors such as family history, occupation, socioeconomic status, lifestyle, and other medical conditions should be considered when assessing a patient’s overall risk[5]
Framingham risk score calculator: the FRS is a tool used to estimate a person’s risk of developing CVD over the next 10 years. The FRS is based on several traditional CVD risk factors, including age, sex, total cholesterol, high-density lipoprotein (HDL) cholesterol, systolic blood pressure (SBP), and smoking status. It also includes information about a family history of early CVD (before age 55 for men and before age 65 for women) and the use of hypertension medication. The score ranges from 0 to 30, with higher scores indicating a higher risk of developing CVD over the next 10 years.
One of the key features of the FRS is that it was developed using data from the Framingham Heart Study, which followed a large and diverse population over several decades. This allows for the generalization of its results to other populations. In addition, it has been extensively validated in multiple studies, which increases its clinical usefulness[3]
The ESC CVD risk calculator: it is a tool designed to estimate an individual’s risk of developing CVD over the next 10 years. The ESC CVD risk calculator uses a combination of traditional risk factors, including age, sex, total cholesterol, HDL cholesterol, SBP, smoking status, and whether or not the individual has diabetes. It also includes information about a family history of CVD and the use of hypertension medication. The score ranges from 0 to 10, with higher scores indicating a higher risk of developing CVD
One of the key features of the ESC CVD risk calculator is that it is based on the most up-to-date scientific evidence and guidelines from the ESC. This ensures that the tool provides an accurate and reliable estimate of an individual’s CVD risk. In addition, the calculator has been validated in several studies, which increases its clinical usefulness. Other factors such as family history, occupation, socioeconomic status, lifestyle, and other medical conditions should be considered when assessing a patient’s overall risk. It is also important to note that the ESC CVD risk calculator is not appropriate for patients with known CVD, diabetes, or other conditions that affect the risk of developing CVD. It is also not suitable for use in people with a high risk of developing CVD, such as those with familial hypercholesterolemia
QRISK→3 2018 CVD SCORE CALCULATOR: QRISK→3 2018 is a CVD risk assessment tool that is used to estimate an individual’s risk of developing CVD over the next 10 years. It was developed by the UK-based QRISK→ algorithm development group, which is a collaboration of researchers, clinical experts, and representatives from the primary care sector.
QRISK→3 2018 is based on a large dataset of electronic health records from general practices in the UK and uses more than 50 variables to calculate an individual’s risk of CVD. These include traditional risk factors such as age, sex, total cholesterol, HDL cholesterol, SBP, smoking status, and whether or not the individual has diabetes. In addition, QRISK→3 2018 also includes information about ethnicity, family history of CVD, and use of hypertension medication. This is particularly relevant for populations in the UK, where there are significant differences in CVD risk between different ethnic groups.[4]
Sample size calculation
For calculating the sample size in proportions, the formula employed is: n = (z^2 × p × [1 − p])/e^2. Here, n represents the sample size, z denotes the standard score corresponding to the desired confidence level, p signifies the proportion of the population with the specific characteristic of interest, and he represents the margin of error. In the case of a confidence level of 95% and a margin of error of 5%, the standard score is 1.96.
Substituting these values into the formula, we get:
n = (1.96^2 × 0.15× [1 − 0.15])/(0.05^2) n = (3.84 × 0.15 × 0.85)/0.0025 n = (0.576 × 0.85)/0.0025 n = 0.48/0.0025 n ≈ 192
Hence, the sample size was 192. Ours is a duration-based study, so not able to achieve this much sample size.
Statistical analysis
The complete data were entered in Microsoft Excel 2019 and SPSS 26.0 version, (IBM SPSS Armonk, State: New York, United States). Statistical significance testing was performed to assess differences in the proportion of high-risk groups across various risk assessment models using the Chi-square test. Student’s t-test was utilized to determine the statistical significance of differences in mean values. The Pearson correlation coefficient was computed to examine the relationship between different cardiovascular risk assessment models. P < 0.05 was considered the threshold for statistical significance.
Results
Baseline characteristics
A total of 42 naïve MI patients presenting first time enrolled in this cross-sectional study. Baseline characteristics are presented in Table 1. The average age of the study population was 60.02 ± 13.76 years. Males were predominant in all enrolled naïve MI patients. The mean body mass index was 25.6, so most of them were in the obese category. Majority were nonsmokers. Among 42 patients, only one patient with CKD was included; otherwise, naïve MI patients who presented for the first time were enrolled in the study. Mean TC was 177.85 ± 49.66, which was lower than expected. Mean HDL and LDL were 36.58 ± 8.79 and 142.17 ± 50, respectively, which found to be deranged. Chl/HDL ratio was also high than the normal range of 4.92 ± 1.24. Mean SBP and diastolic blood pressure were 126 ± 19 mmHg and 77.36 ± 8.96 mmHg, respectively.
10-year atherosclerotic cardiovascular disease risk score
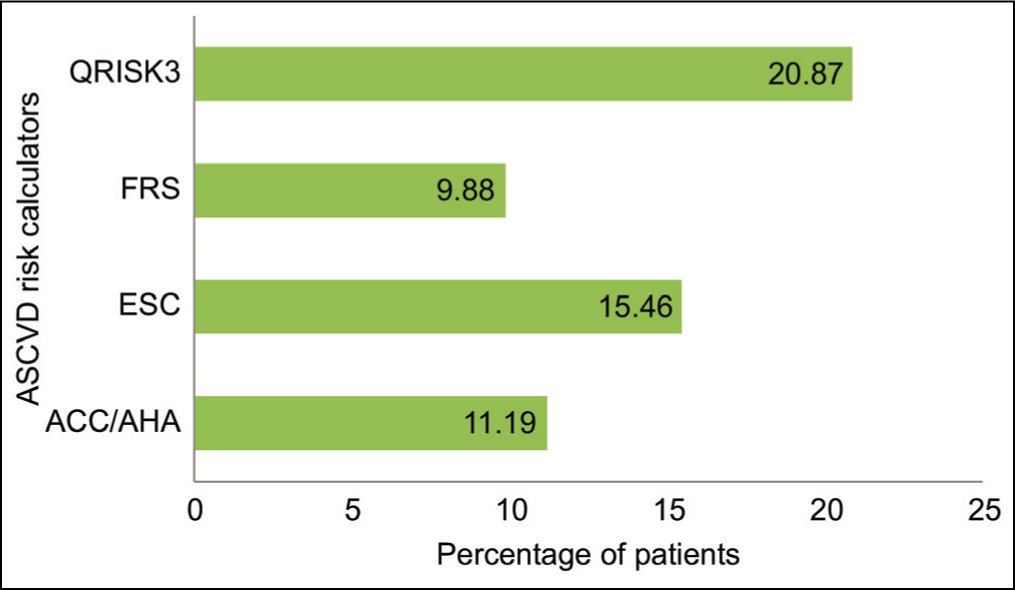
All 42 naïve MI patients were assessed for 10-year risk by ACC/AHA, FRS, ESC, and QRISK3 scoring systems. Figure 1 shows data on 10-year risk by different score calculators. Among all, QRISK3 could identify a maximum number of patients with high CVD risk (risk score 20%). The mean current 10-year ASCVD risk by ACC/AHA is 11.9%, followed by the ESC scoring calculator (15.46%). Moreover, worst performed score in our study was FRS (9.88%).
Naïve MI patients were exposed to different four risk calculators and analyzed different parameters. Tables 2-5 show ACC/AHA, ESC-CVD, FRS, and QRISK3 risk calculator.
If we see a correlation between the different scores for the 10-year ASCVD risk detection rate, there were no statistically significant values we found. Table 6 shows two-tailed significant values for different risk calculators.
Baseline characteristics of enrolled patients
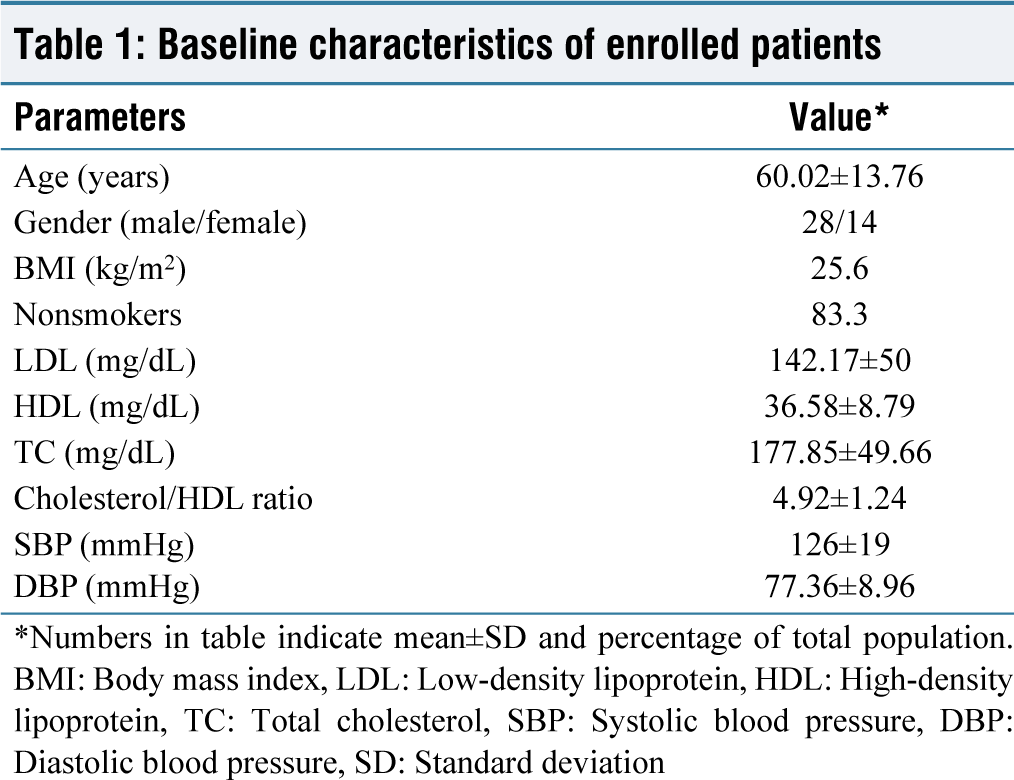
*Numbers in table indicate mean±SD and percentage of total population. BMI: Body mass index, LDL: Low-density lipoprotein, HDL: High-density lipoprotein, TC: Total cholesterol, SBP: Systolic blood pressure, DBP: Diastolic blood pressure, SD: Standard deviation
Percentage of naïve myocardial infarction patients for atherosclerotic cardiovascular disease 10-year risk. ASCVD: Atherosclerotic cardiovascular disease, MI: Myocardial infarction, FRS: Framingham risk score, ACC/AHA: American College of Cardiology/American Heart Association, ESC: European Society of Cardiology
American College of Cardiology/American Heart Association risk calculator
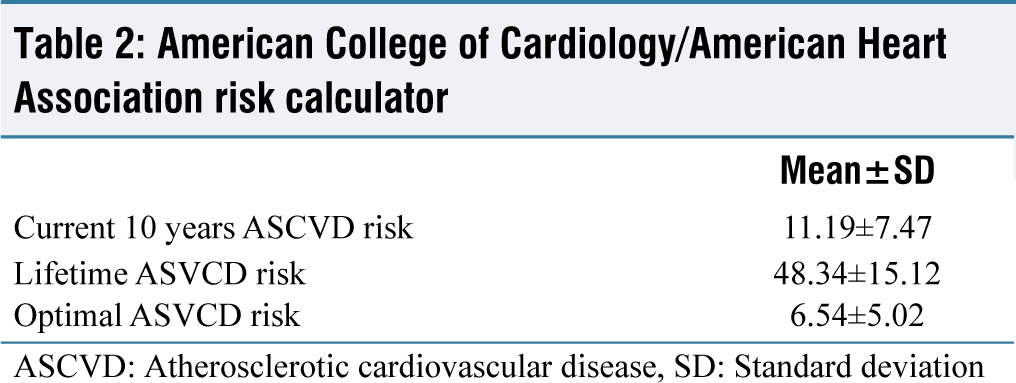
ASCVD: Atherosclerotic cardiovascular disease, SD: Standard deviation
European Society of Cardiology cardiovascular disease risk calculator
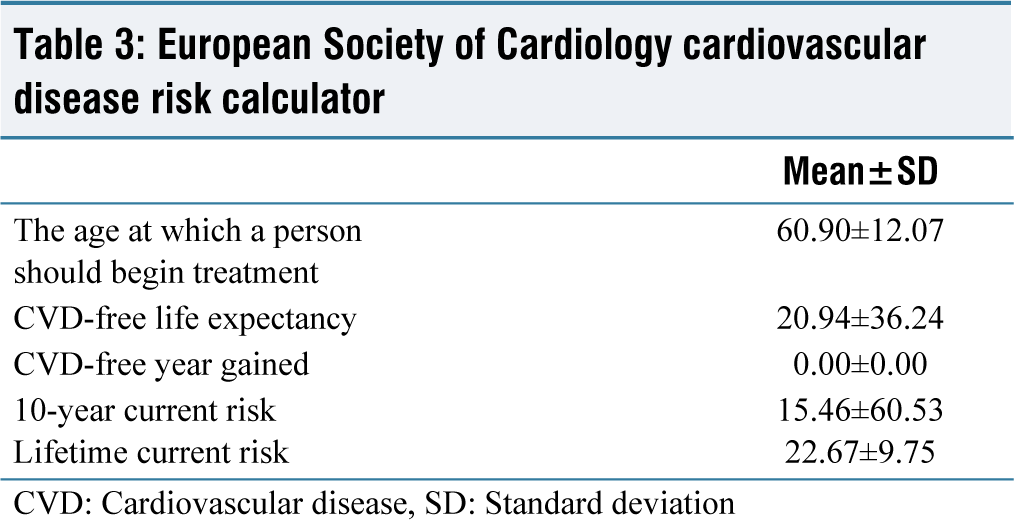
CVD: Cardiovascular disease, SD: Standard deviation
Framingham risk score risk calculator
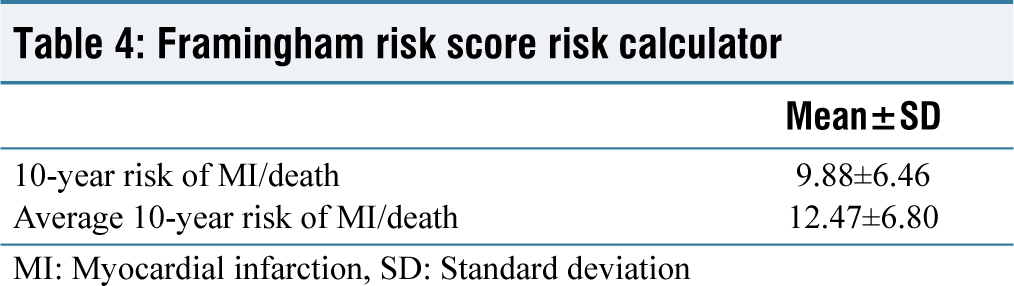
MI: Myocardial infarction, SD: Standard deviation
QRISK3 risk calculator
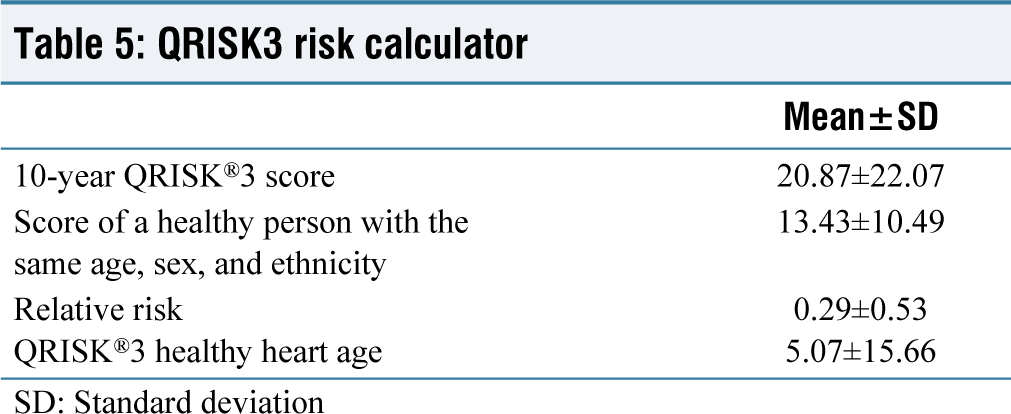
SD: Standard deviation
Correlation between different 10-year atherosclerotic cardiovascular disease risk
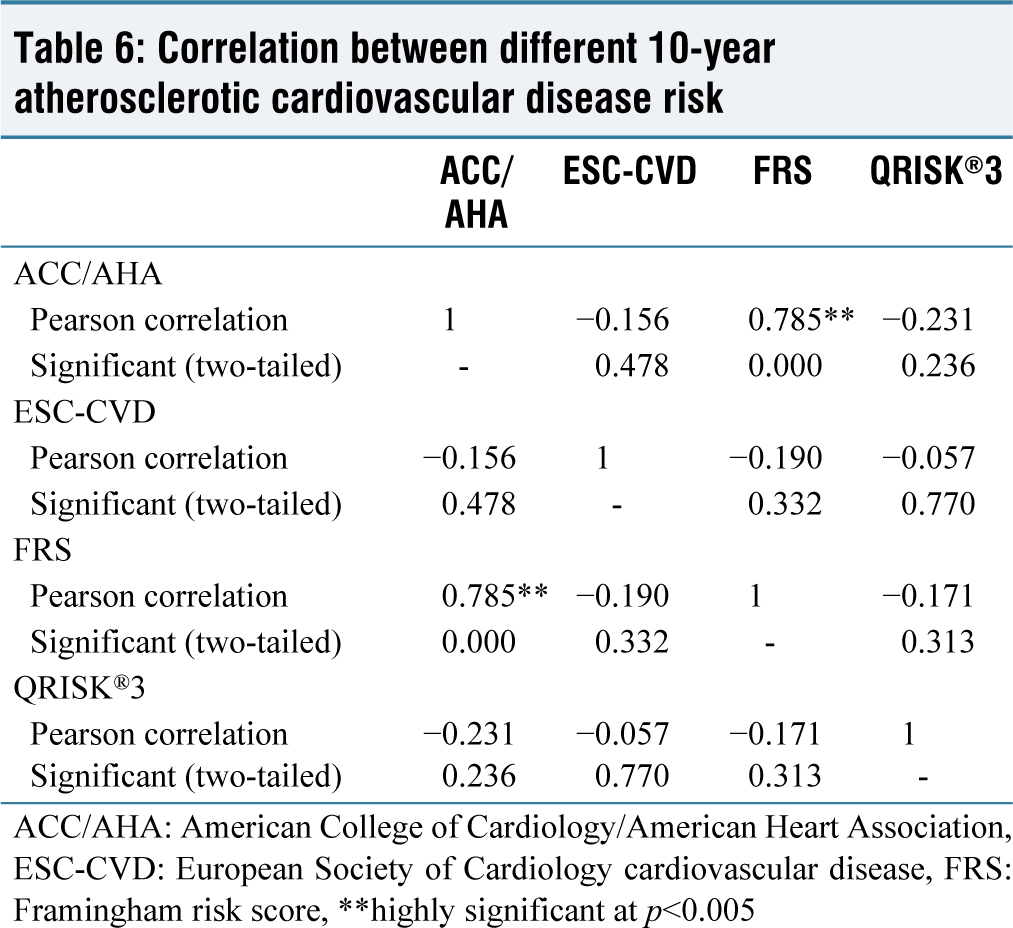
ACC/AHA: American College of Cardiology/American Heart Association, ESC-CVD: European Society of Cardiology cardiovascular disease, FRS: Framingham risk score, **highly significant at p<0.005
Discussion
In the current study, naive MI patients were evaluated for cardiovascular risk based on ACC/AHA, FRS, ESC-CVD risk calculator, and QRISK→3-2018 assessment tools. We also compared different assessment tools for their detection rate in patients presenting first time with MI. There are many risk assessment models available, but which one is applicable best to the Indian population that is still questionable.
In the present study, the mean age was 60 years which is comparable to Garg et al. (57 y) and Hasabullah et al. (63 y) studies.[7,8] Regarding CVD risk assessment tools, data evaluated that the QRISK3-2018 risk calculator is the most effective out of all the risk calculators with maximum detection rate which is analogous to the Hasabullah et al. study.[8] Whereas Garg et al.’s study evaluated that the most appropriate tool for the Indian population was QRISK2, especially for the estimation of the 10-year risk of MI and stroke.[7] In contrast, the FRS-CVD score was come out as most useful in Raj et al. study (the study did not include the QRISK tool).[9]
If we compare individual tools, we found 11. 35% by ACC/AHA ASCVD risk score, whereas Garg et al. study got with 28.3%.[7] Furthermore, Chia et al. which was the validity of the pooled cohort by ACC/AHA ASCVD risk score, was assessed in the Asian Study, which concluded that it is suitable for risk prediction in a primary setting without treatment. However, the study also found that the risk score overestimated the risk when individuals received treatment for risk factors.[10] Our study found that the mean FRS was 12% which is in contrast with 33.3% found in Raj et al. study and 20% in Garg et al. study with statin eligibility.[7,9] ESCCD (SCORE) tool was not considered applicable in a study done by Hasabullah et al. (22.5%), which is also comparable to our study (15.45%).[8] In another older study, Kanjilal et al. compared FRS-1998, JBS, and SCORE risk calculators in unaffected Asian Indians with a family history of CAD and showed that it underestimated the risk. Only 5% they found in high risk as such except family history; other major CVD risk factors were very low in their cohort.[11] In Bansal et al.’s study, they compare four risk models risk. FRS, Risk WHO, Risk ACC/AHA, and RiskJBS, among them RiskJBS are likely to identify the largest proportion of the patients as at “high risk” as compared to others.[12] We opted not to incorporate the JBS3 tool into our study. This decision was driven by the fact that the JBS3 risk calculator relies exclusively on QRISK data, specifically QRISK lifetime data. Instead, our study used a newer QRISK3 model for comparison. Another study done in the Nigerian population showed 50.2%, 16.9%, and 15.2% were classified as high risk using the ACC/AHA ASCVD Risk Estimator, FRS 2008, and WHO/ISH risk chart, respectively.[13]
QRISK3 demonstrated better performance in predicting the risk of CVD in the Zhu et al. study, which is comparable to our study.[14] One of the Indian studies done by Aggarwal et al. evaluated that modified QRISK2 by the addition of smokeless tobacco helps in better prediction of 10-year cardiac risk as compared to QRISK2 score.[15] In Badawy et al.’s study, they compared QRISK and WHO/ISH scores in which they found QRISK was most accurate in several study population.[16] One more study encounters that QRISK2 is more accurate in identifying high-risk population for CVD s by Collins and Altman study.[17]
Our study does have certain limitations. For instance, it follows a cross-sectional design and due to time constraints, we ended up with a relatively small sample size. However, our study has pointed out issues in the applicability of multiple validated risk scores. With aim to find out relevant risk scores to be used in riskiest, Indian population was being fulfilled by this present study.
Conclusion
QRISK3-2018 risk calculator is the most applicable risk calculator with the maximum detection rate of MI in first-time presented patients with Naïve MI patients. Still, there is a need for additional research with a large pool of data. This study was the first of its kind as a comparison of various cardiovascular risk scores in Indian patients and those who are presenting for the first time with MI. This study helped us in evaluating the role of preventive measures in CVD like MI and also helped us to evaluate different predisposing factors for MI. This study in the near future will help in the development of the INDIAN CARDIOVASCULAR DISEASE RISK SCORE. Our study was a stepping stone, so it calls for the development of more culturally specific and accurate risk prediction tools.
Footnotes
Declaration of Conflicting Interests
The authors declared no potential conflicts of interest with respect to the research, authorship and/or publication of this article.
Funding
The authors received no financial support for the research, authorship, and/or publication of this article.
Institutional Ethical Committee Approval Number
Smt. NHLMMC Institutional Review Board approval taken, Ahmedabad.
CRediT Author Statement
All authors have equal contribution toward the manuscript.
Data Availability
Yes.
Use of Artificial Intelligence
No use of AI