
Abstract
Background:
The pancreas contains Vitamin D (Vit.-D) and an enzyme that regulates insulin levels. Vitamin D deficiency is associated with several severe health conditions, such as cardiovascular disease, diabetes, various cancers, and multiple sclerosis (MS). Therefore, the objective of the current study is to investigate the correlation between Vitamin D levels and glycosylated hemoglobin (HbA1c) in both patients and controls.
Materials and Methods:
The study enrolled 163 T2DM (Group I) and 174 healthy (Group II) subjects to estimate the level of Vit.-D and HbA1c in the blood serum of all subjects, using radioimmunoassay and high-performance liquid chromatography, respectively.
Results:
The results revealed that Group I had a lower level of Vit.-D (17.82 ± 2.23 ng/mL) than Group II. Similarly, they have high HbA1c levels, showing significant (P < 0.001; Student’s t-test). Further, in Group I, Vit.-D levels were negatively correlated with HbA1c levels (P < 0.001; r2 = 0.07, linear regression). Group I and II combined analysis revealed an inverse relationship between Vit.-D levels and HbA1c (P < 0.001; r2 = 0.021).
Conclusion:
The study concluded a negative correlation between Vit.-D levels and HbA1c levels in T2DM. However, Vit.-D therapy can recover this correlation, which helps control glycemic levels.
Keywords
Introduction
Globally, type 2 diabetes mellitus (T2DM) has become increasingly prevalent.[1] The World Health Organization reports that diabetes affects over three hundred and sixty million people. World top scientists and experts predicted that the number will rise to 552 million in 2030.[1] T2DM can be screened by decreased insulin secretion, persistent hyperglycemia, poor glucose tolerance, and complications brought on by oxidative stress.[2] Vitamin D (Vit.-D) is an essential secosteroid hormone associated with skeletal integrity, bone health, and function.[3] In addition, various studies have reported that T2DM seems to be associated with an insufficient level of Vit.-D[3,4] and acts as a risk factor for T2DM; it has been identified as mild-to-moderate Vit.-D deficiency.[5] Furthermore, metabolic syndrome has been linked to Vit.-D insufficiency[6] and specific polymorphisms in the Vit.-D receptor gene associated with metabolic syndrome symptoms.[7] However, some reports show that high levels of Vit.-D have been linked to a decreased possibility of developing diabetes mellitus (DM).[5-7]
Sunlight, nutrition, and supplements are all individual Vit.-D sources.[8] The skin produces Vit.-D3 (cholecalciferol) through exposure to ultraviolet rays.[8] Vit.-D in Vit.-D2 may be found in various plant foods and supplements (ergocalciferol). Vit.-D refers to both of these types, Vit.-D3 and Vit.-D2. Vit.-D has two phases of hydroxylation to obtain biological activity: the first phase in the C-25 position, completed in the liver with the synthesis of 25-hydroxy Vitamin D (25[OH]D); the second phase in the C-1 position. Universally, the substance 25(OH) D is recognized as the primary indicator of Vit.-D status.[8]
In addition, it has been shown that Vit.-D levels in people with T2DM negatively correlate with glycosylated hemoglobin (HbA1c); however, Vit.-D may also affect how glucose is regulated.[9] In addition, lacking or low level of Vit.-D appears to increase the risk of developing T2DM in people of all ages.[9,10]
This present study aimed to estimate the levels of 25(OH) D3 and HbA1c and also examined the association between those levels and glycemic management in individuals with T2DM and non-T2DM (NT2DM).
Materials and Methods
Study subjects, study design, and sample size
In the current study total sample size, 336 subjects were recruited and further divided into two groups: in Group I, 163 patients with T2DM were enrolled, while Group II considered 176 healthy individuals of the same sex and age (20–70). The inclusion criteria were age 20–70, mean age 56.64 ± 11.27 years, and 25(OH) D3 levels, and those with 6.5% or more than HbA1c levels are T2DM. This cross-sectional study was carried out from June 2021 to June 2022. Subjects were enrolled after taking signed informed consent forms from participants in the present study. All participants were screened to determine whether they should be as the inclusion criteria (age-related Vit.-D deficiency in participants who have T2DM). The current study was conducted in the Department of Internal Medicine and Obstetrics and Gynaecology of two hospitals – (1) Moti Lal Nehru Hospital, Allahabad, and (2) Sir Sunderlal Hospital, Varanasi, of the Indian state of Uttar Pradesh. The ethics committees have provided approval for the study.
The study applied specific exclusion criteria, including the following: patients who had taken Vitamin D supplements within three months prior to or during the study, individuals with extreme obesity (defined as a body mass index [BMI] of ≤35 kg/m²), pregnant participants, individuals with granulomatous diseases, those with depression, individuals with malabsorption syndrome (MAS) or liver failure, participants with a glomerular filtration rate ≥60 mL/min/1.73 m², individuals with hypercalcemia, and those who had experienced allergic reactions to Vitamin D therapy. Additionally, having 25(OH) D3 levels ≤60 ng/mL was considered a potential risk factor for hypercalcemia.
Anthropometric data collection
The anthropometric analysis involved measuring the heights and weights of enrolled subjects using specific instruments. The subjects’ heights were measured to the nearest centimeter (cm) using a wall-mounted stadiometer machine. The subjects’ weights were assessed on a medical scale while wearing light indoor attire. For calculating the subjects’ BMI, each subject’s weight in kilograms (kg) was divided by the square of their height (H) in meters. This calculation yields a numerical value to determine whether a person is underweight, normal, overweight/or obese. It is important to note that the BMI calculation has limitations and may not accurately indicate body fatness for specific individuals, such as athletes or older adults. However, for the general population, BMI can be useful for assessing health risks associated with weight.
Sampling technique
To collect blood samples for serum separation, drew 3 mL of blood from each enrolled subject. These samples were carefully labelled and then stored in vials at a temperature of 4°C. Then, the centrifuge vials were placed in the centrifuge for the serum separation at 5000 rpm for 10 min; the further serum was used for the Vit.-D estimation through radioimmunoassay (RIA).
Radioimmunoassay technique for measurement of Vitamin D level
RIA was used to estimate Vit.-D through two steps. In the first step, acetonitrile was used to extract Vit.-D and other hydroxylated metabolites from serum quickly. Following extraction, an antibody with specificity for Vit.-D was used in a competitive RIA to analyze the treated samples. At 20°C to 25°C, the sample (serum), antibody (ab), and tracer were incubated for 90 min. After 20 min of 20°C to 25°C incubation with a second ab precipitating complex, phase separation was achieved. After this incubation, the buffer was added before centrifugation to lessen nonspecific binding. The assay’s sensitivity was 1.6 ng/mL or less. With 25(OH)D3, recovery was close to 100%. The precision within and between batches was 12% and 11%, respectively.
High-performance liquid chromatography techniques for a measure of glycosylated hemoglobin
High-performance liquid chromatography was used to estimate the level of HbA1c, with a total precision of 1.16%, a within-run coefficient of variation of 0.78%, and a between-run coefficient of variation of 0.52%. HbA1c was separated through chromatography and a cation-exchange cartridge. The process used for hemoglobin (Hb) analysis involved ion-exchange liquid chromatography principles. The first step was to dilute and inject the samples into an analysis cartridge automatically. In the cartridge, the Hbs were separated based on their ionic interactions with the cartridge material, and then, this separation was achieved by using a programmed buffer gradient of increasing ionic strength. Once the Hb was separated and directed to a filter photometer’s flow cytometer, in this case, the flow cytometer was used to measure the amount of Hb present in the sample. The filter photometer within the flow cytometer used filters to select specific wavelengths of light, which were then used to detect and measure the Hbs in the sample.
Data analysis
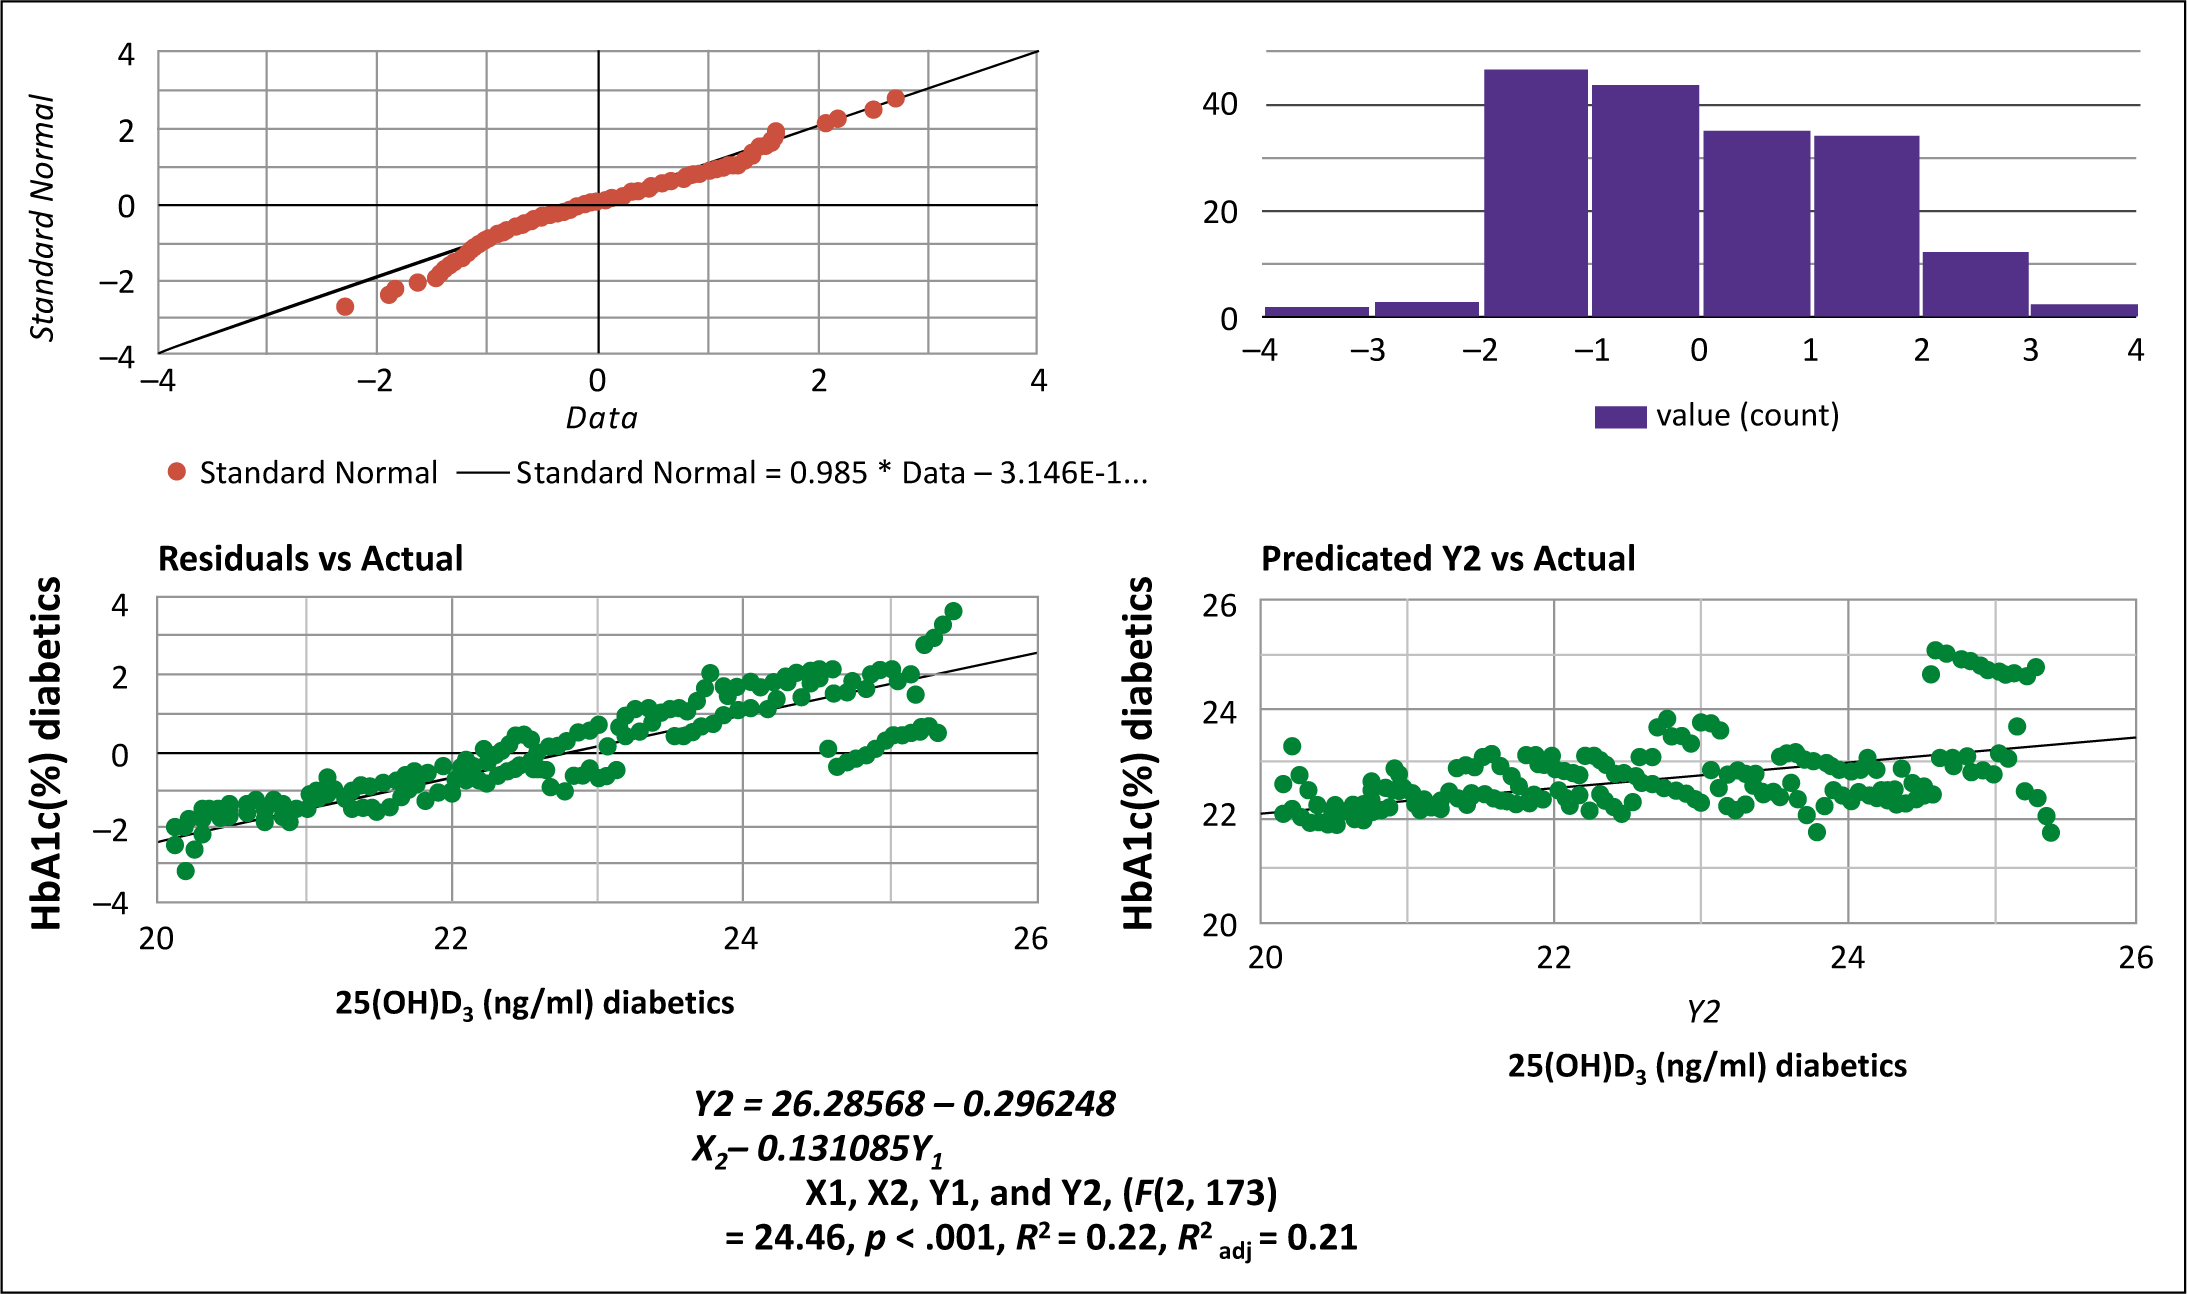
The statistical software SPSS-19 (IBM Corporation, Armonk, New York, United States) was used to assess the findings statistically. Group I was compared with Group II (control group) using the Student’s t-test. The correlation between Vit.-D and HbA1c levels was analyzed using regression. Regression analysis parameters were tested for normality using histograms of standardized residuals and p-p plots of standardized regression residuals. A Chi-squared test was used to compare how many people in the patient and control groups had Vit-D deficiency and insufficiency.
Results
Table 1 represents sociodemographic data – the ages, sexes, and different forms of BMI of DM and NT2DM after analysis. Age between study groups and between the sexes was not significantly different. We found that having DM usually correlated with a high BMI.
Mean±standard deviation data of demographic parameters of diabetic mellitus and nondiabetic mellitus subjects
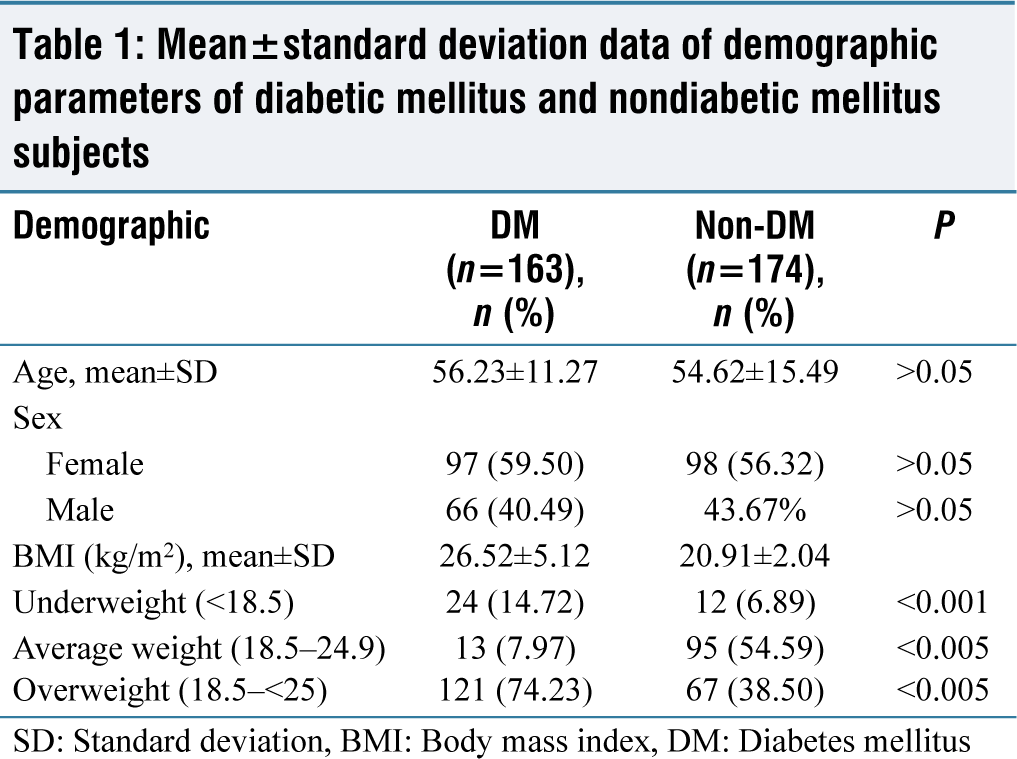
SD: Standard deviation, BMI: Body mass index, DM: Diabetes mellitus
HbA1c percentages were 8.03% ±0.49% in Group I (T2DM) and 4.62% ±1.06% in Group II (control), respectively (P < 0.001). The study revealed that higher concentration of HbA1c in Group I (T2DM) than Group II [Table 2]. Similarly, levels of Vit.-D was lower in Group I than in Group II (17.82 ± 2.23 ng/mL and 24.31 ± 3.20 ng/mL), respectively (P < 0.001) [Table 1].
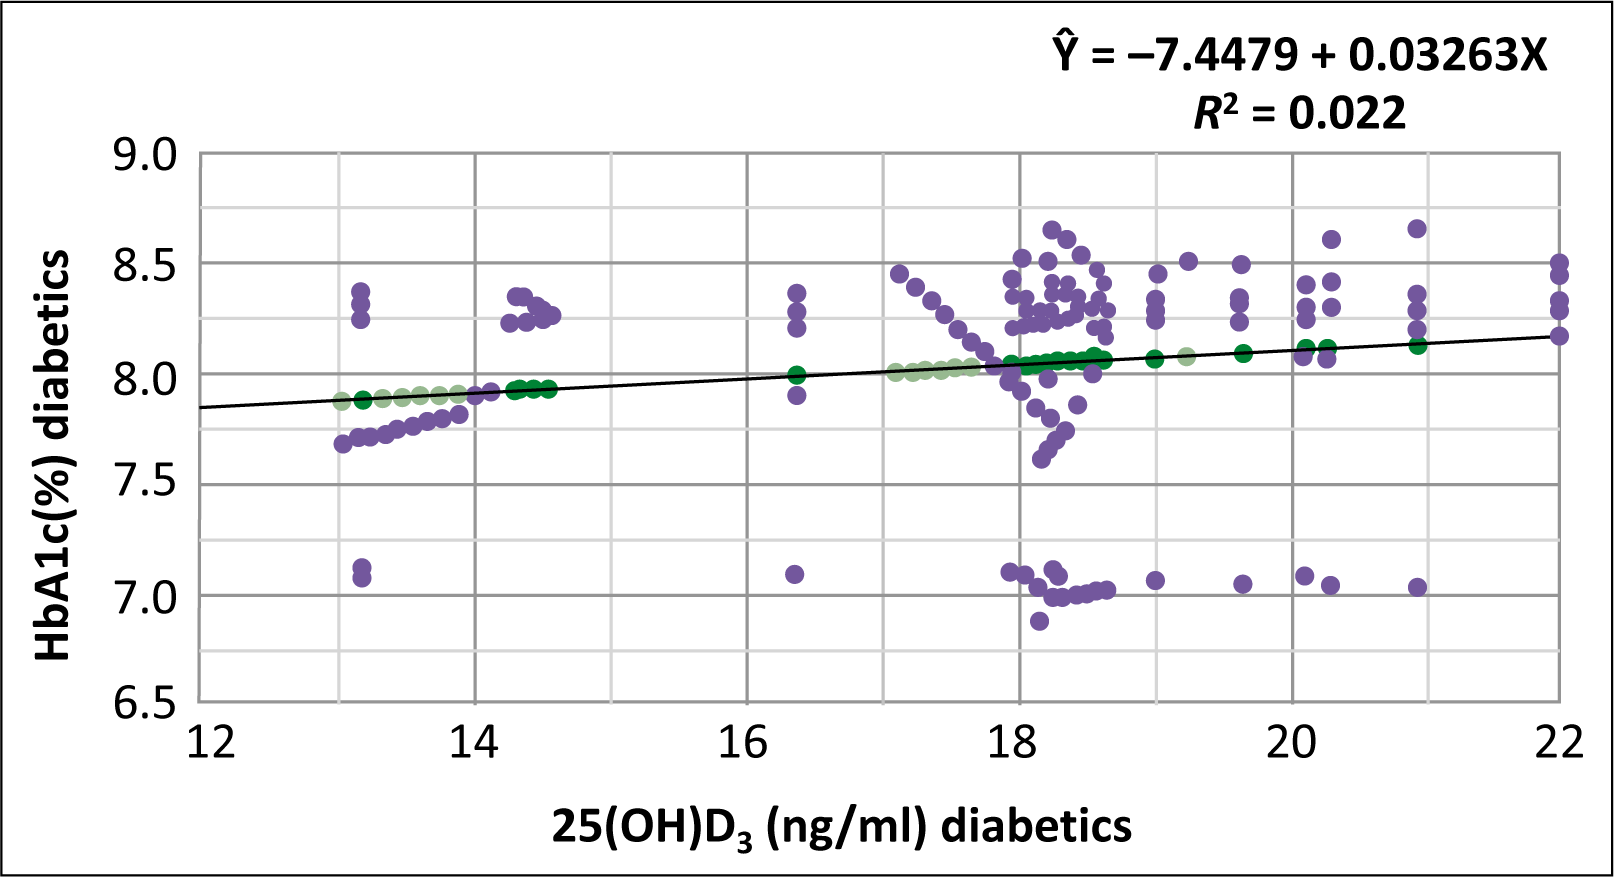
Table 2 shows the mean and standard deviation (mean ± SD) values for the two groups (T2DM and control), 25(OH) D3 (ng/mL), and HbA1c (%), as well as their statistical significance (Student’s t-test), as well as the number and percentage of subjects with 25(OH) D3 deficiency and insufficiency (25[OH] D3 10 ng/mL and 20 [Chi-squared test]). In Group I, Vit.-D levels were observed to be inversely related to HbA1c percentage (P < 0.001, r = 0.07; linear regression analysis) [Figure 1], and it found that Vit.-D levels were negatively correlated with HbA1c levels (P < 0.001: r2 = 0.021) [Figure 2].
Analyze mean and standard deviation for 25(OH)D3 and HbA1c in T2DM and Control groups, assess statistical significance with Student’s t-test, and compare 25(OH)D3 deficiency and insufficiency percentages using chi-squared test
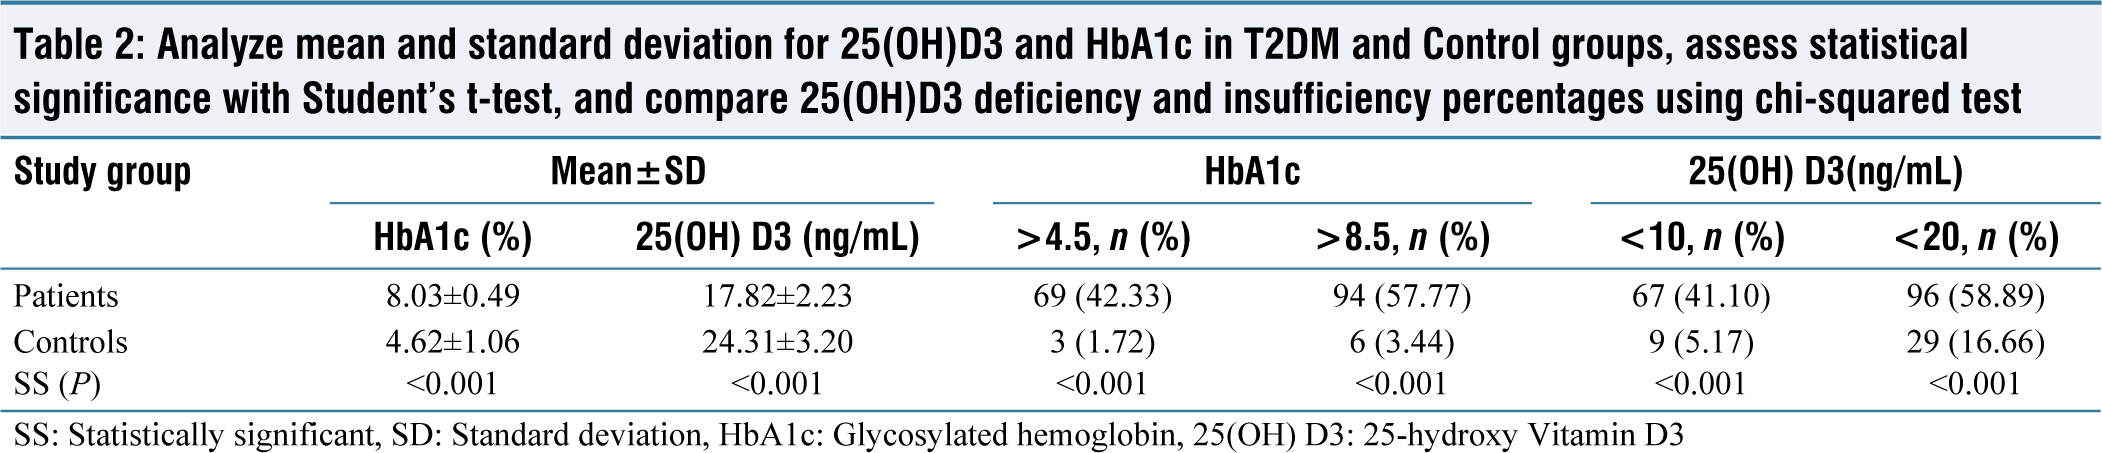
SS: Statistically significant, SD: Standard deviation, HbA1c: Glycosylated hemoglobin, 25(OH) D3: 25-hydroxy Vitamin D3
The inverse relationship between individuals with diabetes mellitus type 2 and 25-hydroxy Vitamin D3 (ng/mL) and glycosylated hemoglobin (%) (P = 0.001, r2 = 0.022, linear regression analysis). 25(OH)D3: 25-hydroxy Vitamin D3, HbA1c: Glycosylated hemoglobin
In both the overall study population and the healthy controls for type 2 diabetes, we observed an inverse correlation between the levels of 25-hydroxy Vitamin D3 (measured in ng/mL) and glycosylated hemoglobin (expressed as a percentage). This correlation was statistically significant with a p-value of 0.001 and an r-squared value of 0.021, as determined through linear regression analysis. Here, 25(OH) D3 represents 25-hydroxy Vitamin D3, and HbA1c stands for glycosylated hemoglobin
Discussion
Vit.-D is an essential steroid hormone that plays several vital roles in the body, including supporting bone health, promoting immune function, and regulating mood and mental health.[11] However, many people are unaware of the importance of Vit.-D and may not receive enough of it through their diet or exposure to sunlight.[11]
In tropical regions, people may avoid indoor activities to increase their exposure to sunlight, a natural source of Vit.-D. However, even in these regions, people may still be at risk of Vit.-D deficiency if they spend most of their time indoors or have darker skin, which can reduce the skin’s ability to produce Vit.-D from sunlight. In addition to sunlight, Vit.-D can be obtained through regular intake of foods such as fatty fish, fortified dairy products, and some mushrooms. It is essential to consider these natural sources of Vit.-D when considering the body’s overall Vit.-D status. Thus, adequate intake of Vit.-D through sunlight and diet can help promote optimal health and prevent deficiency-related health problems.[11]
Vit.-D is critical in regulating cellular, neuromuscular, and ossification functions.[11] Children who lack Vit.-D can develop rickets, while adults who lack Vit.-D can develop osteocalcin, osteoporosis, cancer, diabetes, and autism;[12] therefore, its supplements are essential to treat Vit.-D deficiency-related diseases such as diabetes, cancer, multiple sclerosis (MS), and cardiovascular-disease.[9]
The Canadian Dietary Guidelines for Recommendation propose 600 international units (IU) of Vit.-D for the age group from 1 to 70 years and 800 IU for people aged 71 years and above 71.[13] However, developed and developing countries have been shown to lack sufficient Vit.-D[14] and also noted that more than 36% of individuals in the United States (US) are associated with Vit.-D.[15] In developing countries, 41% of Children in developing countries suffer from a severe Vit.-D deficiency, and around 87% of pregnant women revealed an epidemic in females.[16,17]
In this study, the Vit.-D levels were observed within the normal range in only Group II (control). Still, they were found below average (lower or insufficient) ranges in Group I (T2DM) subjects. Furthermore, there was an inverse correlation with Group II, which suggests that Vit.-D levels may affect glucose control in T2DM.[18]
In our study, when we combined Type 2 diabetes patients (Group I) and controls (Group II), we observed an inverse relationship between the levels of Vitamin D and HbA1c. This means that as Vitamin D levels increased, HbA1c levels decreased in the combined group. The study was supported by several authors[17]. Thus, it seems that Vit.-D appears to be associated with T2DM glucose control. Furthermore, percentage wise, T2DM patients had significantly higher rates of Vit-D insufficiency or deficiency. Subsequently, a few studies have shown a higher prevalence of Vit.-D deficiency in T2DM, which is significantly associated with depressive symptoms.[17] Individuals with severe impairment were usually older than 70 years and more likely to have a mood problem. Although several studies have produced contradictory findings, Vit.-D deficiency has been linked to anxiety and depression.[17,18]
Several other cross-sectional studies have found an inverse correlation between Vit.-D and markers of glucose metabolism, such as fasting insulin, fasting glucose, and glucose tolerance test readings.[19] This suggests that low levels of Vit.-D may be associated with impaired glucose metabolism and an increased risk of developing T2DM.[20]
Further, a recent study supports this association by demonstrating an inverse relationship between 25(OH) D3 levels and insulin resistance, which is a crucial feature of T2DM. This relationship was most substantial at 25(OH) D3 levels between 16 and 36 ng/mL.[20]
Although the proper mechanisms underlying the association between Vit.-D and glucose metabolism are not fully understood, some studies suggest that Vit.-D may improve insulin sensitivity and reduce inflammation, essential for maintaining healthy glucose metabolism.[20] These findings highlight the importance of maintaining adequate Vit.-D levels for optimal glucose metabolism and overall health. However, further research is needed to fully understand the relationship between Vit.-D and glucose metabolism and the potential benefits of Vit.-D supplementation in preventing or managing T2DM.[20]
Other studies have shown that higher plasma Vit.-D levels were linked to a decreased risk/possibility of T2DM.[21] However, higher plasma Vit.-D evaluated repeatedly was related to a decreased probability of developing diabetes in high-risk patients, as reported in a prospective observational-clinical trial study with a mean follow-up of 2.7 years.[20,21]
A robust negative connection between baseline 25(OH) D3 and fasting glucose at follow-up was found in a longitudinal study of the factors influencing insulin resistance and metabolic syndrome.[22] Vit.-D levels were inversely related (negative relationship) to an incidence of diabetes.[5]
T2DM patients had lower 25(OH) D3 levels than controls in the current study. A previous study discovered an increased risk for insulin resistance and metabolic syndrome associated with Vit.-D deficiency.[23,24] In another study, the National Health and Nutrition Examination Survey-III, it was found that people (8421 participants) with metabolic syndrome had significantly associated with lower levels of Vit.-D.[5]
Conclusion and Intervention Implementation in the Treatment
Our study revealed a high frequency of Vitamin D deficiency in Group I. Furthermore, the discovery of a negative correlation between Vitamin D levels and HbA1c levels is an exciting finding. It is well-established that Vit.-D plays a vital role in glucose metabolism and insulin sensitivity; therefore, its deficiency can contribute to the development and progression of T2DM.
The intervention studies that showed improvement in glucose control with Vit.-D supplementation are consistent with previous research on the topic. However, it is essential to note that the optimal dosage and duration of Vit.-D supplementation for individuals with T2DM is still debated among researchers. While the recommendation for clinicians to recommend 2000 IU of cholecalciferol daily for 16 weeks is a good starting point, it is essential to consider each individual’s Vit.-D status, medical history, and any potential drug interactions before making a recommendation. A personalized approach to Vit.-D supplementation is necessary to ensure safety and efficacy. Our study highlights the importance of assessing Vit.-D status in individuals with T2DM and the potential benefits of Vit.-D supplementation in improving glucose control.
Limitation of study
The current study was not eligible to conclude a cause-and-effect relationship between Vit.-D deficiency and T2DM due to the observational nature of the investigation. Furthermore, as recommended, Vit.-D was selected as a marker of Vit.-D inadequacy. However, the active form of Vit.-D is 25(OH)2 D3, which circulates in the blood in various forms. Assessing Vit.-D deficiency in humans, particularly those with diabetes, requires more research using better instruments. Long-term glycemic control and Vit.-D supplementation monitoring require additional research in T2DM.
Footnotes
Acknowledgements
We want to express our gratitude to the senior members of the Department of General Medicine at Moti Lal Nehru Medical College, Prayagraj, Uttar Pradesh, India, for their invaluable assistance and direction during the research study. This study’s completion was primarily possible thanks to their expertise and assistance. We sincerely appreciate their ongoing support and encouragement throughout the research process.
Declaration of Conflicting Interests
The authors declared no potential conflicts of interest with respect to the research, authorship and/or publication of this article.
Funding
The authors received no financial support for the research, authorship, and/or publication of this article.
Institutional Ethical Committee Approval Number
Ethical approval was sought from the Banaras Hindu University and Ethical Review Committee, institute of Medical Sciences and patients consented accordingly (ethical approval reference number K.11022/10/2009 DCC.
CRediT Author Statement
Jitendra Shukla and Anand Singh conducted a study at the study site and managed all comprehensive studies. They also involve manuscript preparation, data analysis, data collection, study review, and proofreading.
Nidhi Sachan contributed to data collection, study review, and manuscript preparation.
Radhey Shyam Verma provided expertise in data analysis and manuscript preparation.
Rinki Kumari assisted with data collection and study review.
GP Dubey contributed to the conception and design of the study research, data collection and analysis, and manuscript preparation.
Collectively, the authors played integral roles in the different stages of this research, ensuring its completion and quality.
Data Availability
Yes
Use of Artificial Intelligence
No