
Abstract
Transport infrastructure development projects play a vital role in improving accessibility, which has dynamic effects on the regional economy as well as increases property values. This research aims to assess the land price variability in control and catchment areas before and after the Dasuria-to-Dhalarchar railway development project in Pabna district, Bangladesh. A set of independent variables was considered to measure the correlation between development project and land price through a questionnaire survey and focus group discussion. The impact of a railway project on land price was determined by the ordinary least squares method, after which the method was justified through Cook’s distance, P-P plot and scatter plot. The data analysis reveals a strong association between land price and distance to a central business district. The data shows that the land price increased significantly after implementation of the railway project with different intensities, as functional characteristics vary among selected stations.
Introduction
A transportation infrastructure development project is carried out to increase regional or urban connectivity and alleviate traffic congestion (Levkovich et al., 2015). Improvements to transportation infrastructure and services will boost the overall economic output by lowering transportation costs and raising accessibility, directly lowering input costs, increasing private investment, promoting trade, creating employment and indirectly improving labour productivity (Deng, 2013). Rapid population growth and regional employment opportunities put pressure on transport infrastructure development (Cervero, 2009). Rail transit is a viable alternative to driving because it reduces the number of cars on the road and encourages compact growth trends by bringing people closer to rail stations (Bowes & Ihlanfeldt, 2001). Bangladesh’s rail network, mostly British-built, connects most of the country’s major cities. The economic growth of lower-middle income countries like Bangladesh depends a lot on their transportation infrastructure. Over the past decade, governments in Bangladesh have invested massive amounts of money in developing mega transportation projects to increase the transit connectivity of the country, including road and rail line construction.
The impact of rail transit becomes apparent at the regional level as regional economic growth or productivity increases as a result of rail transit development (Pan, 2013). At the local level, there is improved accessibility in the vicinity of stations (Bollinger & Ihlanfeldt, 1997; Pan, 2013). Over the past several decades, numerous studies have been carried out on the effect of transportation infrastructure construction on the regional economic growth, with the primary goal of examining the financial returns of transportation investments to determine an appropriate investment pattern (Aschauer, 1989; Canning & Bennathan, 2013; Munnell, 1990; Ozbay et al., 2003; Yu et al., 2013). With its traditional externalities, transport infrastructure investment is an important government responsibility and a key tool for controlling the economy and encouraging economic development (Xueliang, 2013). Rail transit investment has several public interest benefits, including increased physical activity, reduced traffic congestion, reduced emissions and increased customer amenities (Berawi et al., 2020; Bhattacharjee & Goetz, 2012; Freeland et al., 2013; Rahman et al., 2018; Sharma et al., 2014; Zheng et al., 2016). New mass transit infrastructure such as rail lines and railway stations enhance accessibility for both existing and new users, and improvements in mobility also translate into higher land value, a phenomenon known as land value uplift (Mulley, 2013).
Earlier studies investigated the impact of a transport development project on the livelihood pattern at the local and regional levels (Canning & Bennathan, 2013; Yu et al., 2013). Other studies have been conducted on large and medium-sized transport development projects to monitor land price variability, mainly in large urban areas (Arum & Fukuda, 2020; Mulley, 2013). It is important to note that most previous studies have considered only statistical tools and techniques to assess the effects of new transport development projects on local and regional economies. This study focused on the newly constructed Dasuria-to-Dhalarchar railway project to monitor the impact of the railway development project on land price variability. Also, the study considered the station area as the control area and the surrounding areas as the catchment area to analyse the impact of a newly developed railway project on relative land values. No previous article has yet analysed the comparative benefits of the control area and catchment area due to a transport construction project. This study examines land price variability in the control and catchment areas at a regional level for the first time.
Various models have been applied to examine the impact of rail transit on land price (Pan, 2013). The most widely used one is the hedonic price model, which estimates the impact of the rail line and rail stations on property values (Bowes & Ihlanfeldt, 2001; Nelson & McCleskey, 1990; Pan, 2013). Hedonic methods estimate transit value to station area residents (Workman & Brod, 1997). The recently invented ordinary least square (OLS) model is a much more effective method of identifying the impact of transportation infrastructure on property value. The estimate will include transportation and any non-use benefits of transit derived from a neighbourhood and the impact on general livability (Workman & Brod, 1997). The possible outcome of the OLS model would be identifying property values using the linear regression equation. A geographic information system (GIS) is a valuable geospatial tool commonly used to assess land cover characteristics (Bhuiyan et al., 2020; Jahan et al., 2021). Secondary sources of Google map data have been used for land cover scenario analysis (Nagne et al., 2018). The objective of the article is to measure the variability of land price before and after the rail infrastructure development project through the OLS model particularly in the control and catchment areas in the study region.
Methodology
The Dasuria-to-Dhalarchar railway project of Pabna district in Bangladesh is considered as the study region, on which construction started in 2010 and was completed in 2018. Before the project, only Ishwardi Upazila, Chatmohar Upazila, Bhangura Upazila, Bera Upazila and Faridpur Upazila of Pabna district were connected with the rail network. The 78.8 km new line and the 7.9 km loop line, along with 533 m small bridges and 952 m big bridges, connect the Pabna district with other regions of Bangladesh (Rahman, 2018). The Dasuria, Pabna and Dhalarchar stations are selected as the sample study area to analyse the impact of a railway project on land value in both control and catchment areas (Figure 1).
Study Area Map.
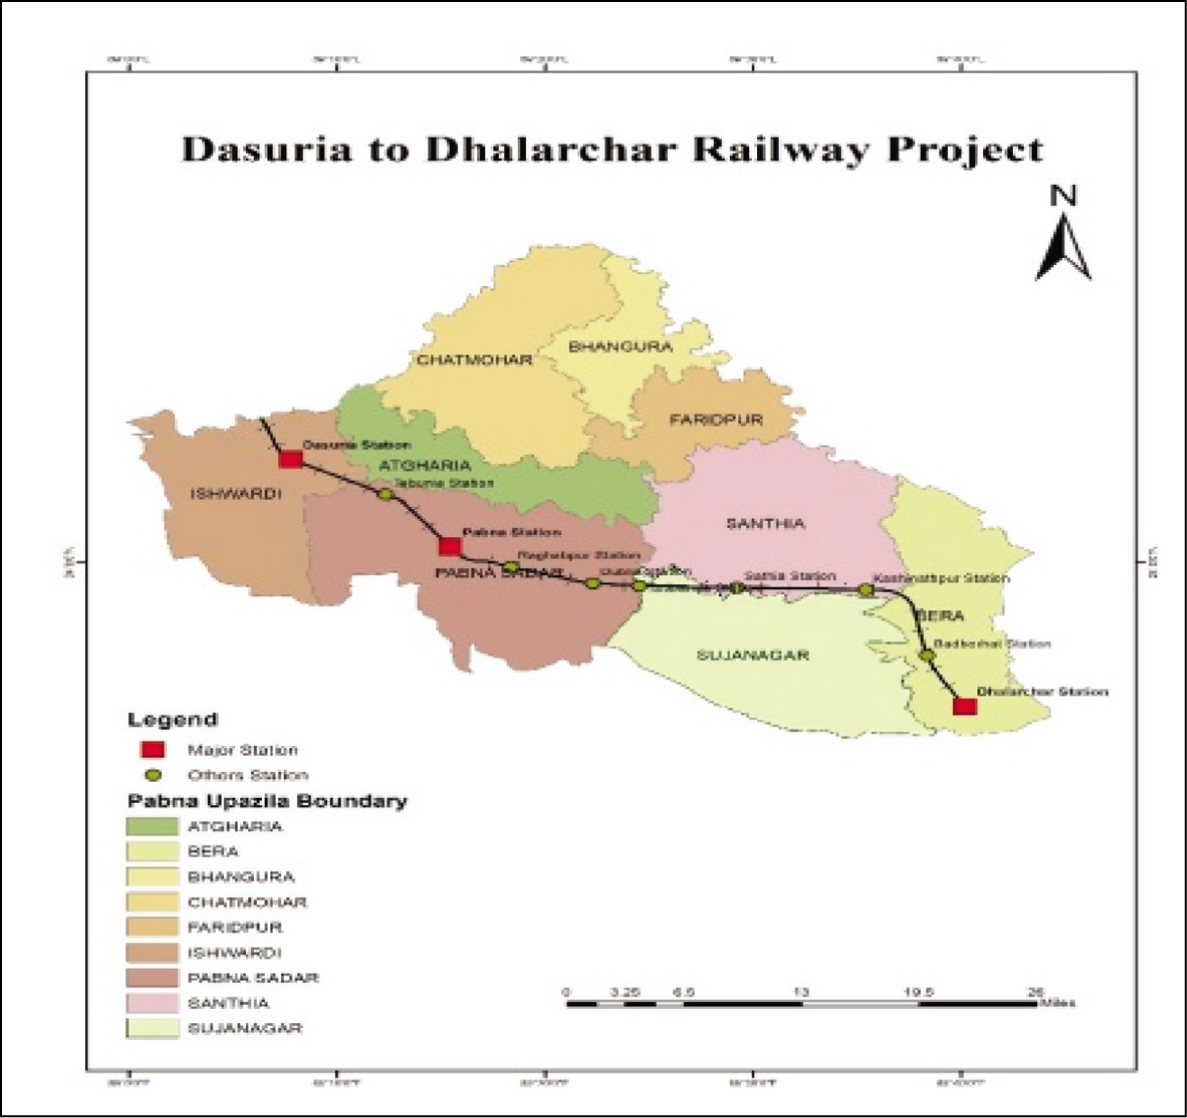
The railway project has multiple sub-stations and in most cases is located far from human settlement. Therefore, it’s quite difficult to fix any specific mathematical equation to identify the sample size. Also, the target population of this development project has not yet been identified. Calculating the sample size without identifying the target population is difficult. Considering the limitation, we fixed 100 questionnaire surveys on each of the three railway stations. So, a total of 300 questionnaire surveys were done for the research. A questionnaire survey was conducted to collect data on the various effects caused by transportation development in the study area. It was administered to local stakeholders and residents impacted by the railway development project. Also, six focus group discussions (FGDs) were conducted in the study region, with two FGDs in each station. These discussions provided an understanding of the residents’ opinions on the project region and the risks and effects that the project poses to them. In addition, government publications, websites, books, journal papers and internal records were used as secondary data sources for the study.
Impact on Property Value (Ordinary Least Square Method)
The OLS method is often utilized (Pavelescu & Marius, 2004) to determine the impact of railway development projects on land price. The connection between the dependent and independent variables determines how the model is generally specified (Berawi et al., 2020). Property values may be calculated using multiple regression analysis based on structural qualities, neighbourhood characteristics, accessibility and land use types, among other variables (Berawi et al., 2020). The model designates the following formula.

where
Y = Dependent variable (property prices)
α = Regression constant
β = Regression coefficient
x = Independent variables
e = Error value (5%)
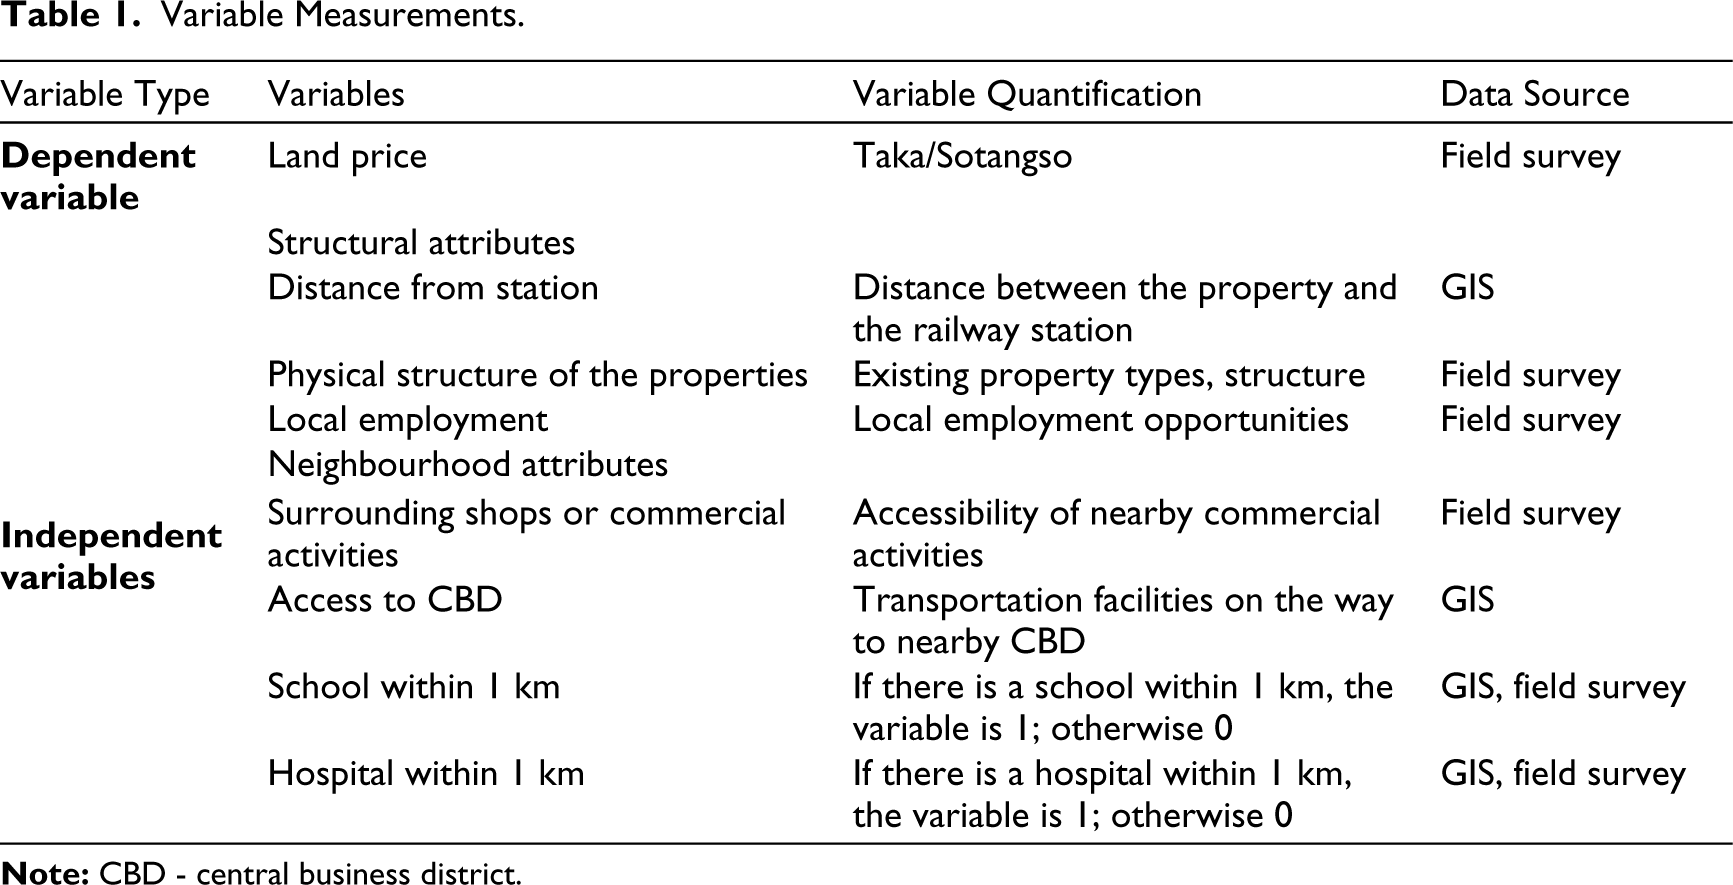
This study employs two data sources to derive values for each identified variable in the OLS models. The initial data source was gathered through data mining from a field survey conducted at the selected stations. A mix of Google maps and GIS was used to acquire secondary data such as distance, buildings and position. The variable used in the research is given in Table 1.
Variable Measurements.
Control Area and Catchment Area Impact Analysis
The concept of control and catchment area has been introduced in the study. Control area is the station area, and catchment area is the nearby local bazaar or growth centre to the railway station. An analysis of the impact on land values in the control and catchment areas can be identified through the geographic information system (GIS), questionnaires and FGD surveys.
Data Analysis and Findings
Dasuria Station
Property Value Status and Land Use Characteristics
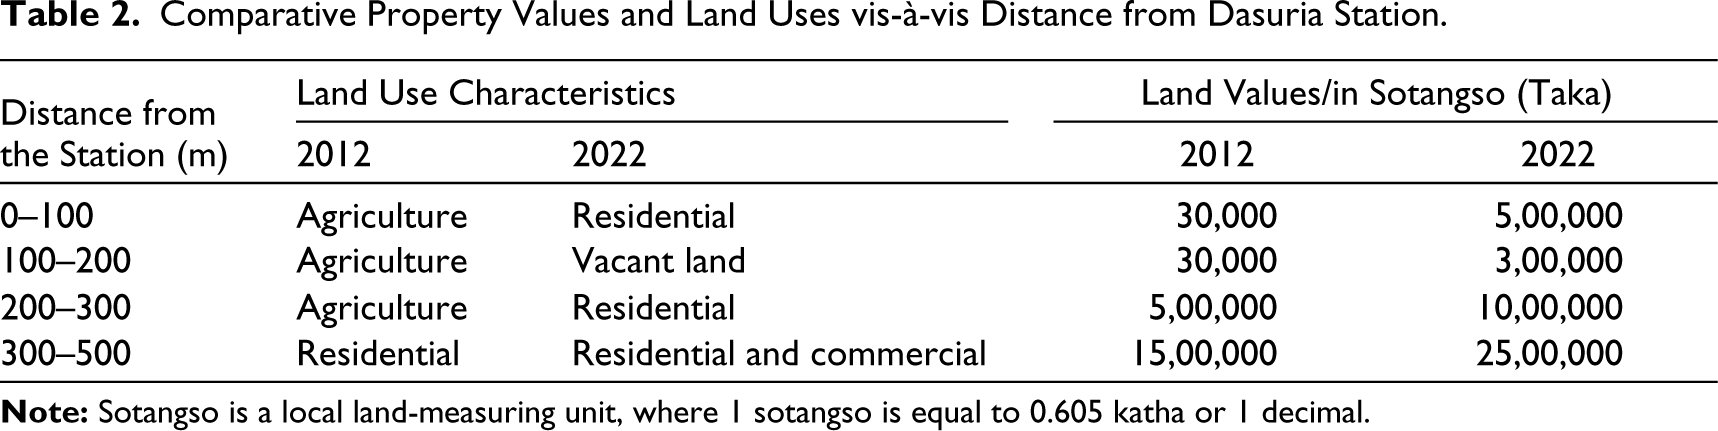
Dasuria station is located very near the Dasuria bazaar, and it is one of the critical intersection points of the Pabna district transportation system. Construction of the station was started in 2014 and completed in 2018. Changes in property values and land use types are noticeable before and after the station construction (Table 2).
Land values increased considerably within 0–100 m of Dasuria station area from 2012 to 2022. A similar increase was found within the 100 to 200 m buffer zone of Dasuria station. It is important to note that land prices have become almost double within the buffer zone of 200 to 300 m and 300 to 500 m because the major highway is situated over this buffer distance. Land use characteristics have also changed over time due to implementation of the project.
Measuring the Variability of Land Prices Through the OLS Model After the Project Was Completed
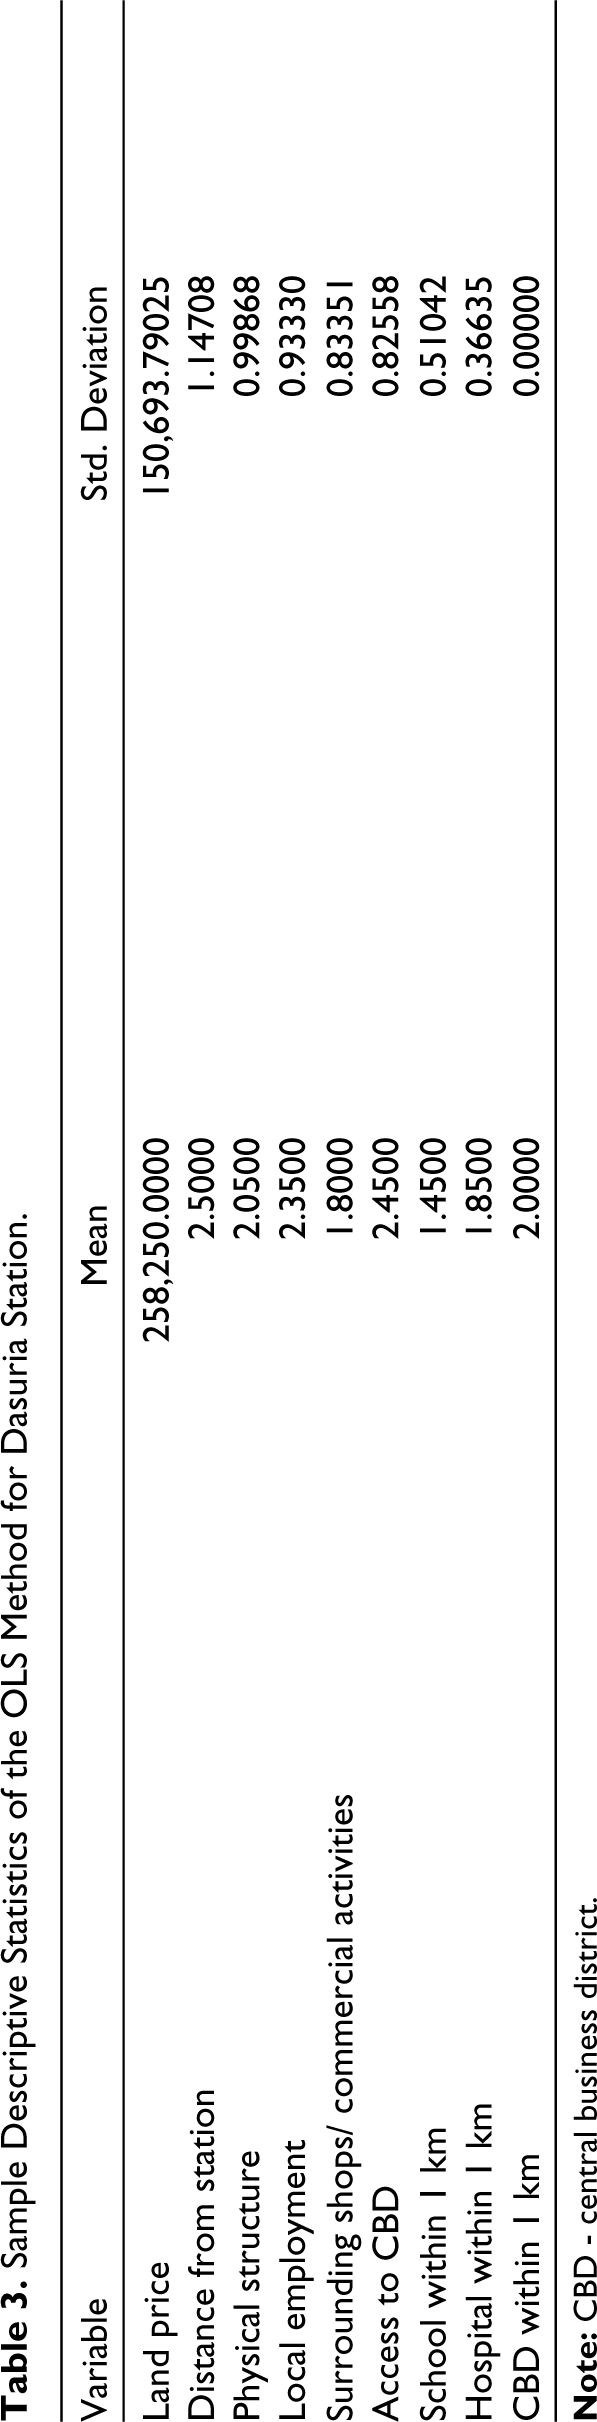
First, a correlation test was used to establish the degree of connection between the independent and the dependent variable (Berawi et al., 2020). The descriptive statistics for the dependent and independent variables are presented in Table 3. The dependent variable’s overall features and characteristics are presented by group (as determined by the independent factors) (Berawi et al., 2020). Table 3 describes the mean and standard deviation of the dependent and independent variables of the OLS method.
Comparative Property Values and Land Uses vis-à-vis Distance from Dasuria Station.
Sample Descriptive Statistics of the OLS Method for Dasuria Station.
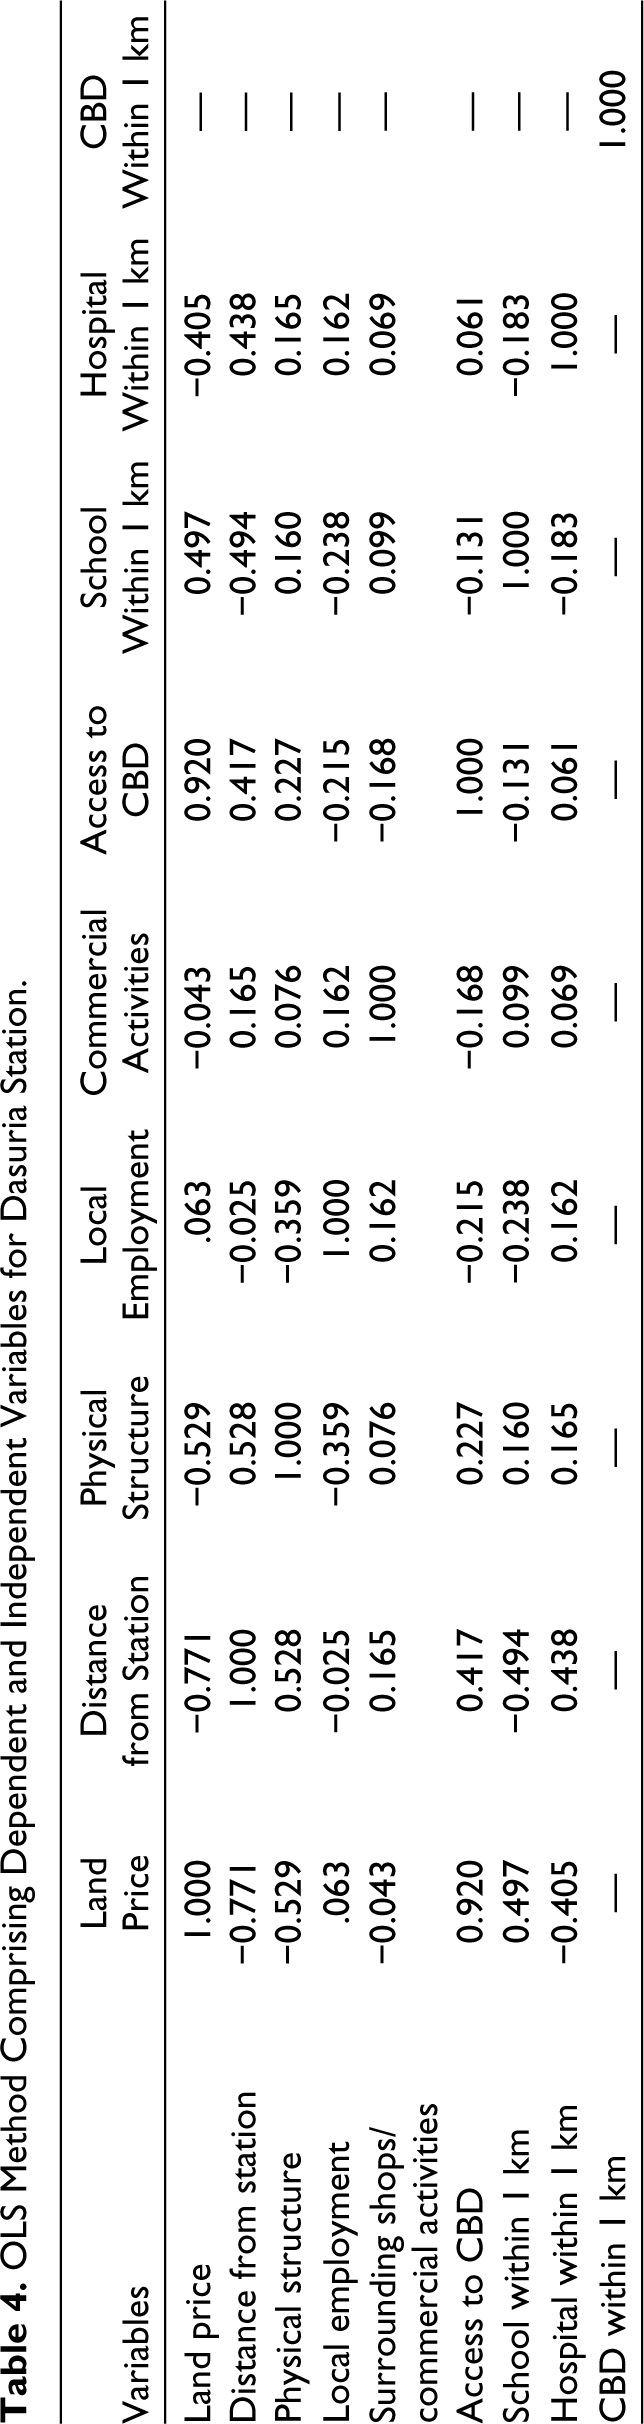
The correlation coefficient can range between −1 and 1. A number near −1 or +1 denotes a strong association between the two variables, while a value near 0 denotes a poor relationship (Berawi et al., 2020). From Table 4 it can be seen that the dependent variable land price strongly relies on access to central business district (CBD; 0.920) and distance from the station (–0.771). In this case, the land price positively relates to access to CBD. In contrast, the land prices decrease with the distance from the railway station. Other variables are not significant for increasing land value. Positive (+) and negative (−) signs, on the other hand, indicate how the two variables are related (Berawi et al., 2020). These are directly related if the value is positive.
OLS Method Comprising Dependent and Independent Variables for Dasuria Station.
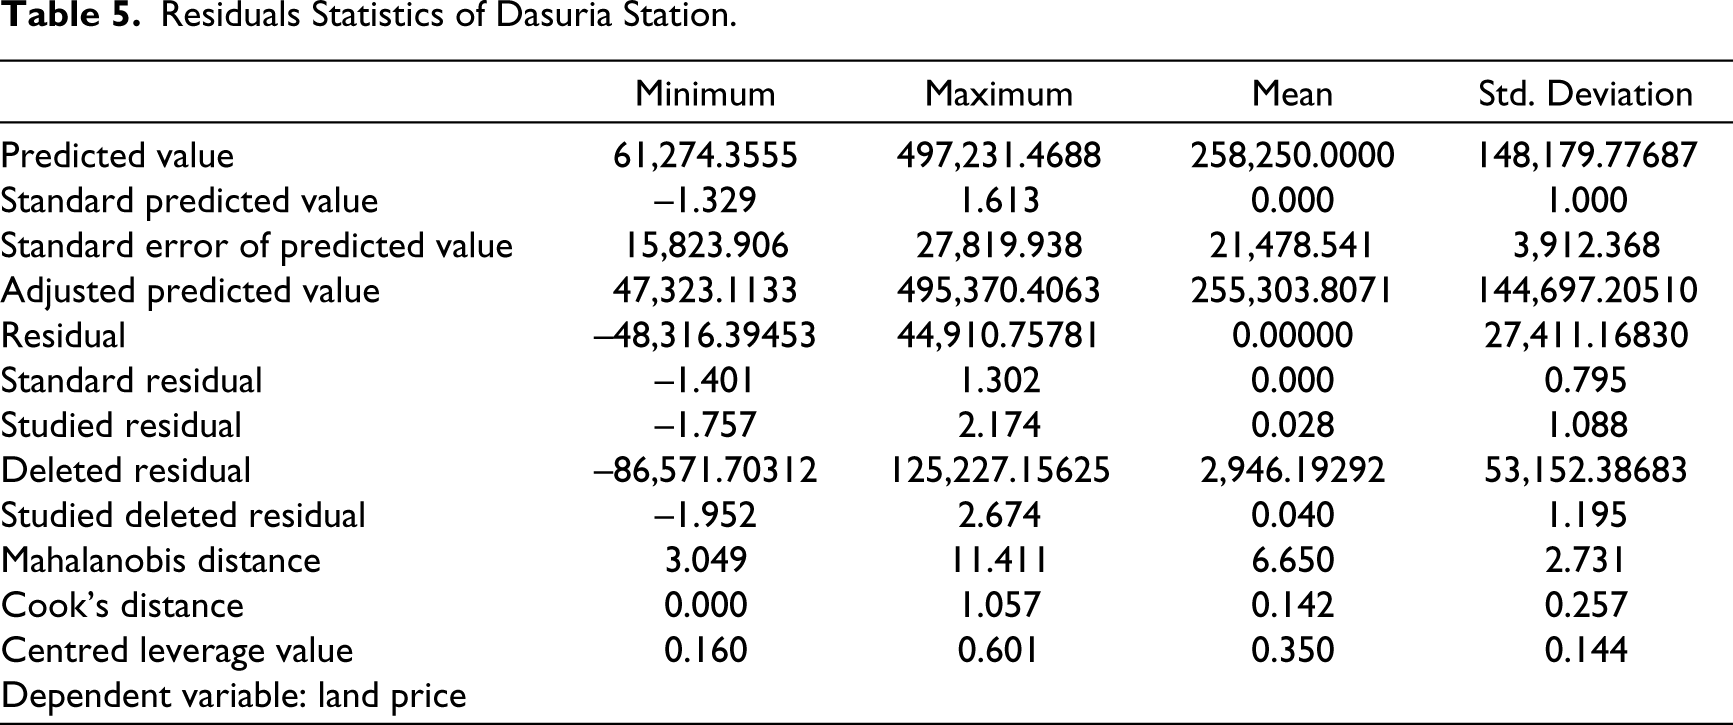
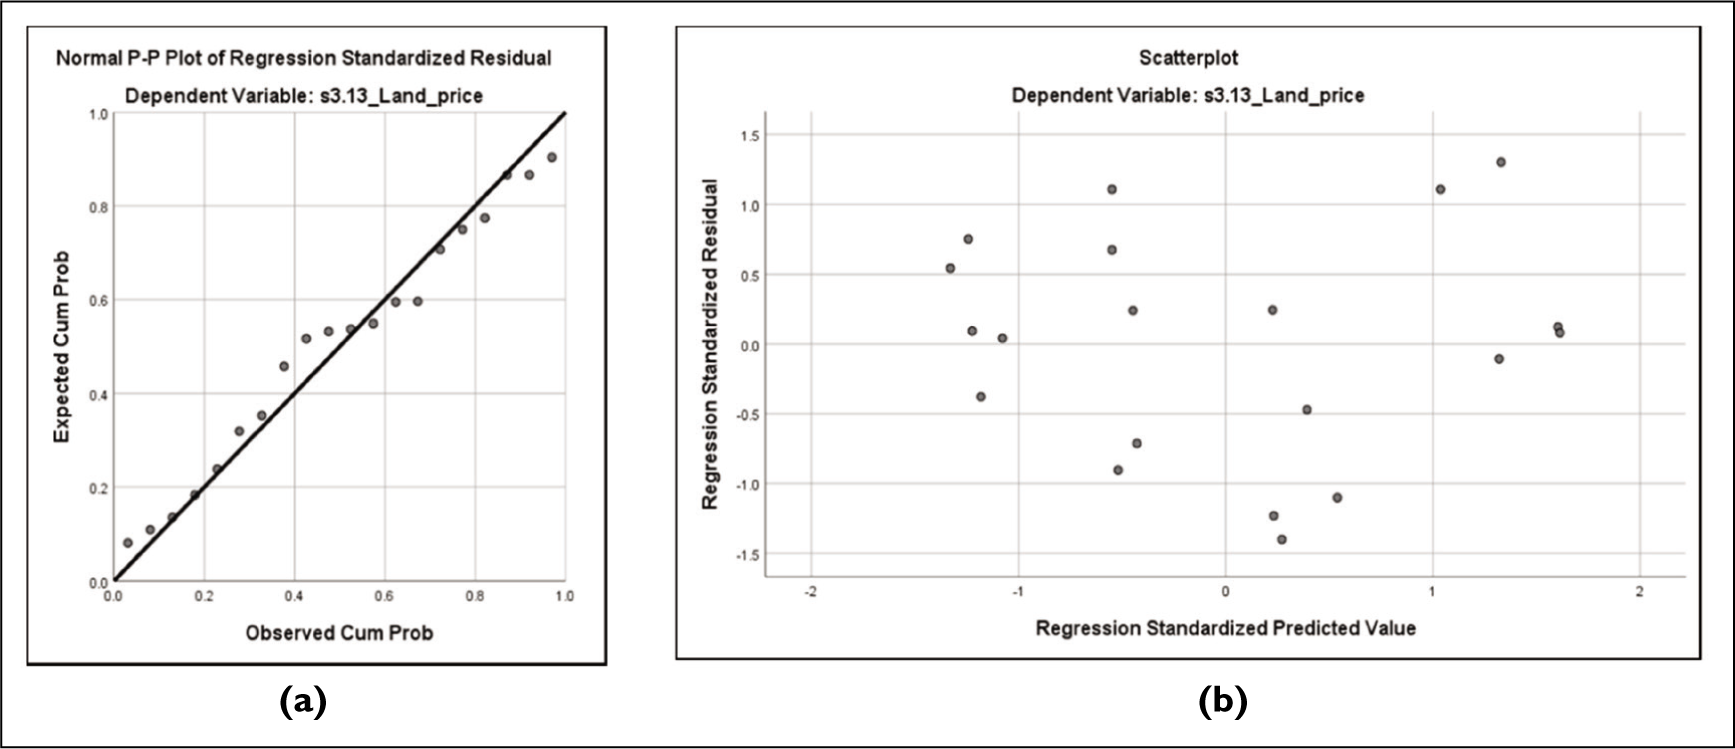
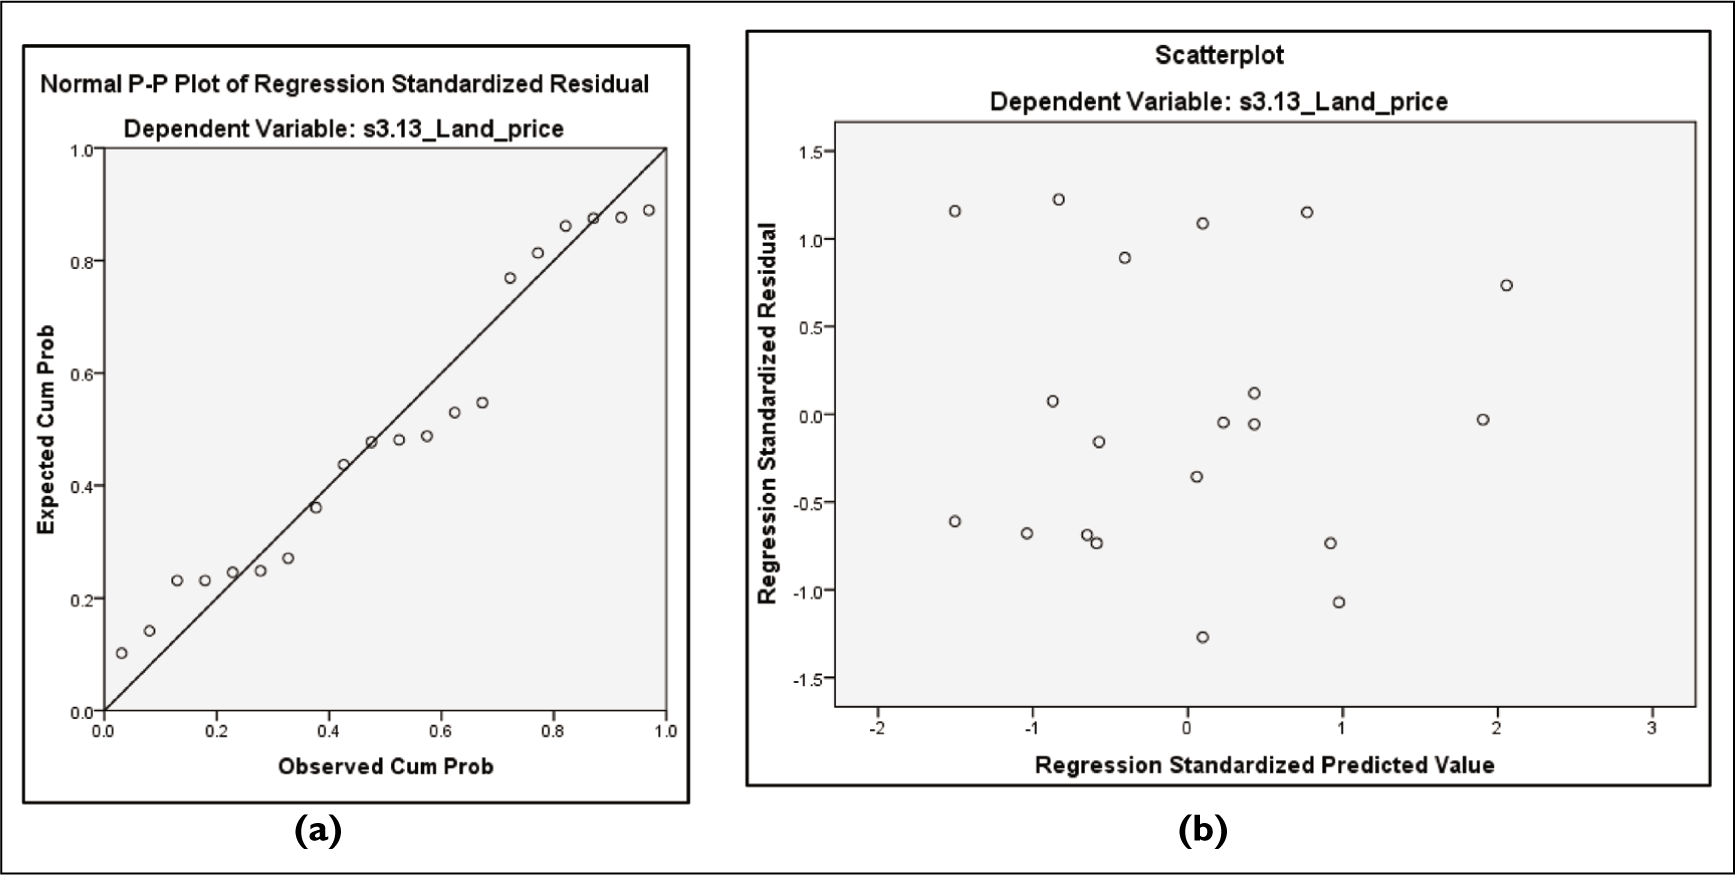
A total of three assumptions are used to justify the method for checking the accuracy of the OLS method. These are: Cook’s distance from the residuals statistics summaries table, the P-P plot and the scatter plot. If a case of Cook’s distance is more than one, it may be an unduly influential case that should be excluded from consideration (National Centre for Research Methods (NCRM), 2011). According to the formula, Table 5 shows that the maximum Cook’s distance is 1.057, which is standard. On the other hand, the P-P plot is a bit more detailed. Between the observed cumulative probability of 0.2 and 0.6, there appears to be some departure from normalcy, although it appears minimal. Figure 2(a) shows the P-P plot, which seems like a linear inline that explains the relationships among the dependent and independent variables. The residuals do not follow any pattern with the projected values, as shown in this scatter plot (NCRM, 2011). This indicates that our model satisfies the homoscedasticity assumption. Figure 2(b) shows the scatter plot required to justify the model.
Residuals Statistics of Dasuria Station.
Dasuria Station: (a) P-P Plot of Regression Standardized Residual Dependent Variable; (b) Scatter Plot of Dependent Variable.
Changes in the Control and Catchment Areas
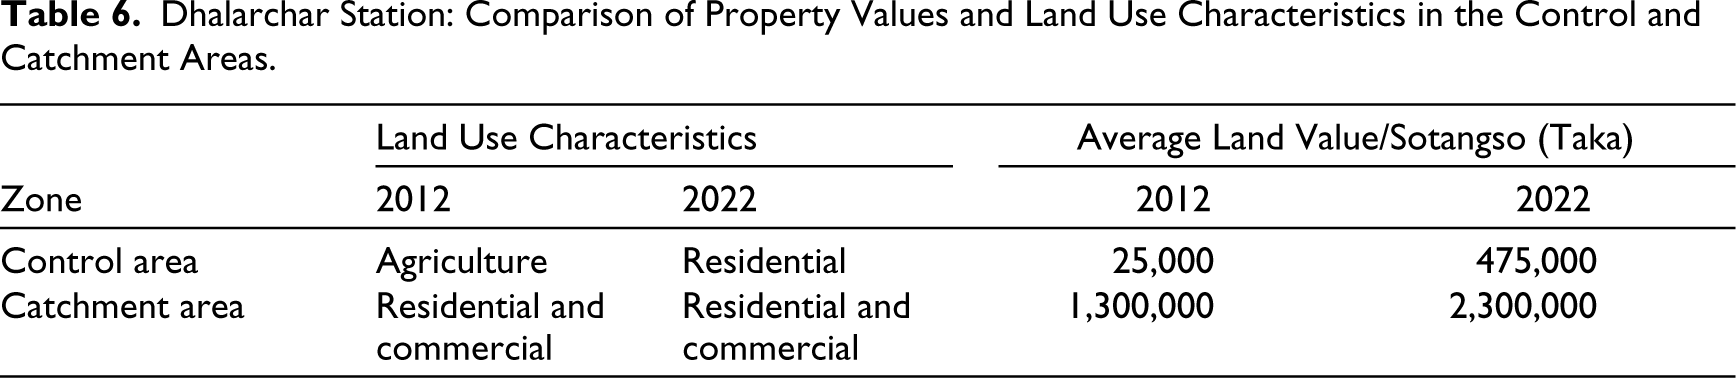
The comparative scenario of the control and catchment areas of Dasuria station is shown in Table 6. Most of the agricultural land in the control area has been converted into residential areas, where the land prices have increased by 19 times of the previous prices. The land use characteristics remain unchanged, but the prices have increased by 1,000,000 taka per sotangso in the catchment area. This clearly indicates that transport development projects are strongly associated with catchment areas.
Dhalarchar Station: Comparison of Property Values and Land Use Characteristics in the Control and Catchment Areas.
Pabna Station
Property Value Status and Land Use Characteristics
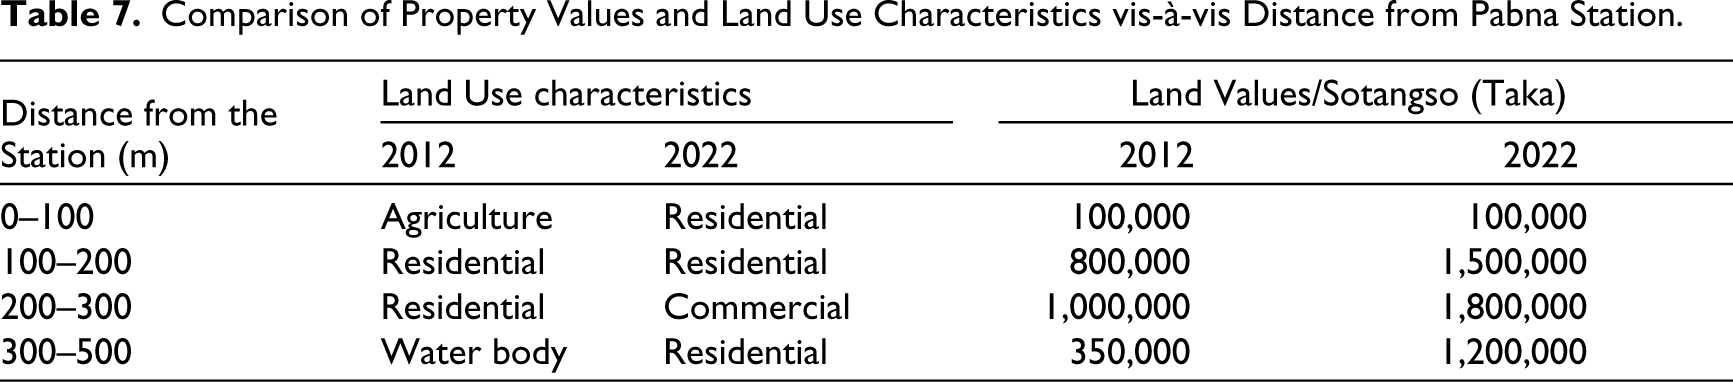
The Rajshahi–Pabna highway is located within 100 to 200 m from the Pabna railway station, and the Pabna bus terminal is located 700 m from the station. Therefore, the station has a complex impact on the local land prices. Agricultural land within 0 to 100 m has been converted into a residential area, and the water body within 300 to 500 m has also been converted into a residential area after the implementation of the project. The land values within 100 to 200 m and 200 to 300 m increased rapidly as the population increased in this region significantly. Table 7 shows the comparative scenario of property values with land use characteristics before and after the project was built.
Comparison of Property Values and Land Use Characteristics vis-à-vis Distance from Pabna Station.
Measuring the Variability of Land Prices Through the OLS Model After the Project Was Completed
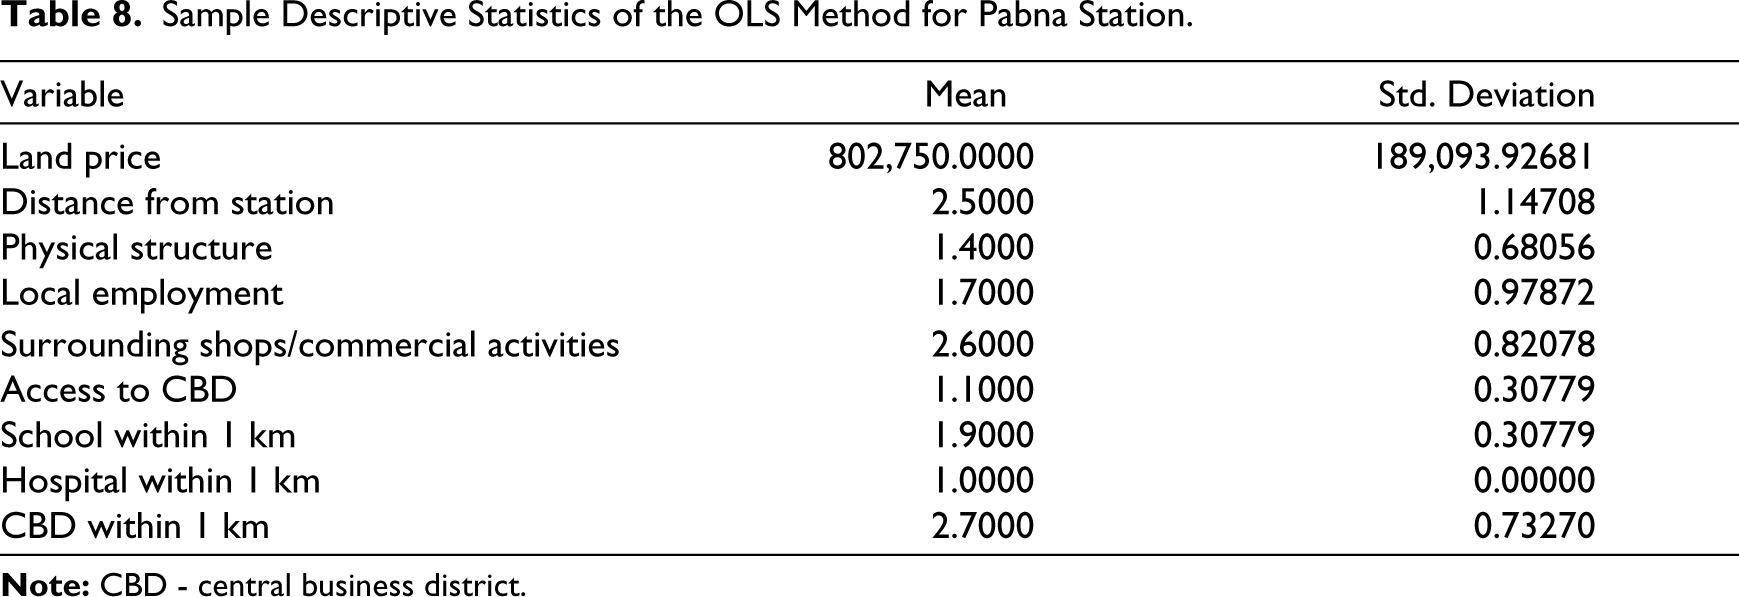
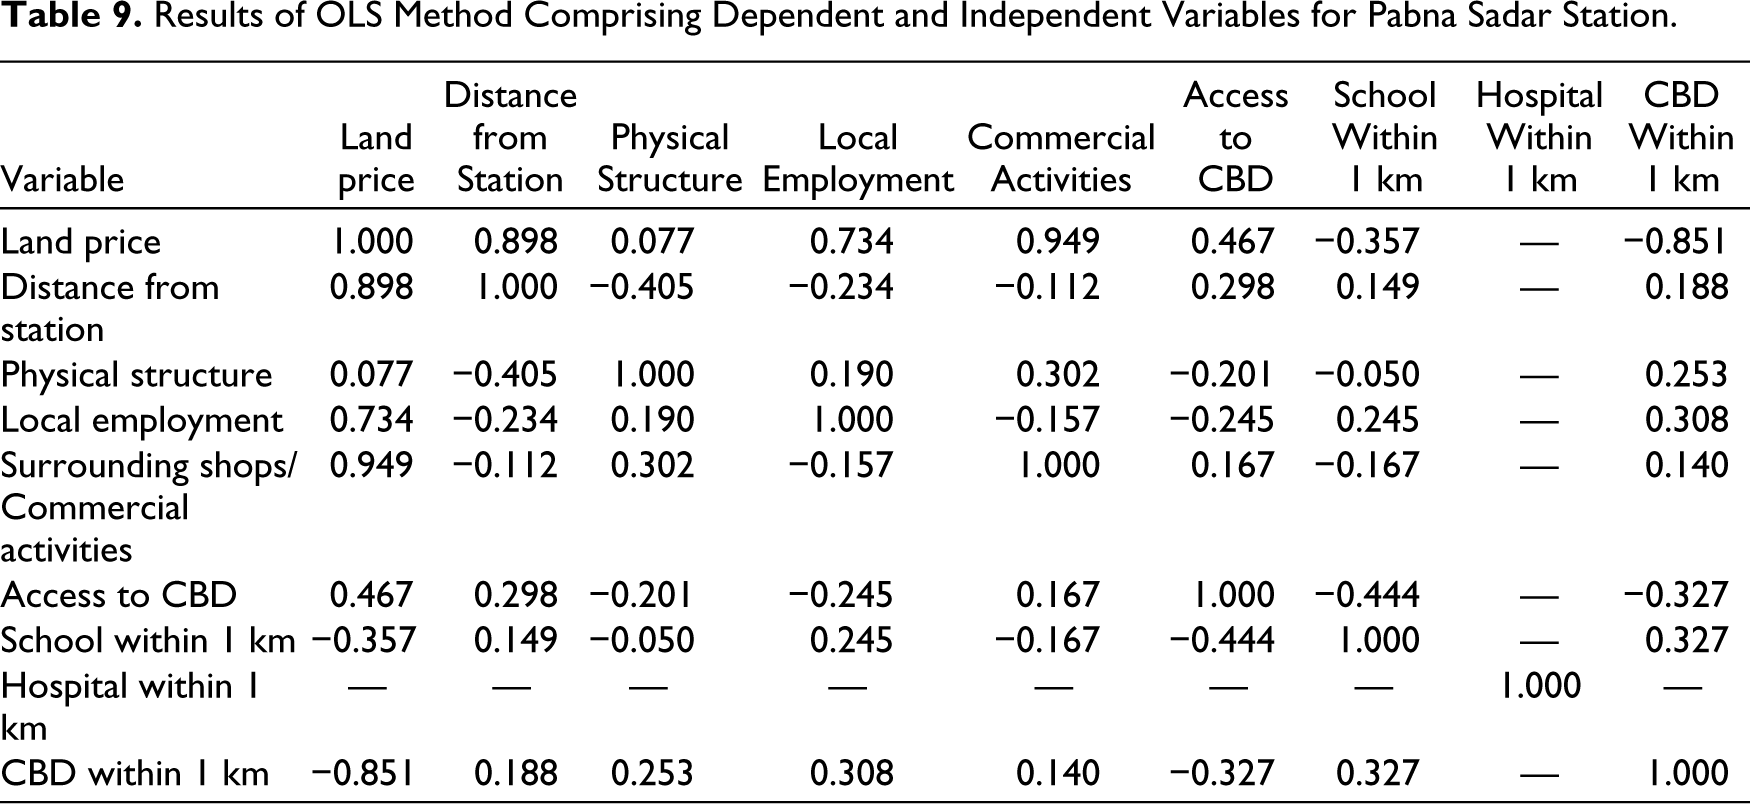
Table 8 describes the sample descriptive statistics of the OLS method, including the mean and standard deviation. In Table 9, the OLS model indicates where the dependent variable and land prices relate to several independent variables such as distance from the station, employment in the area, access to CBD and shops/commercial activities around the station. Access to CBD (0.949) or the main road is responsible for increasing the land prices. Employment opportunities (0.734) and closeness to the station (0.898) also have an impact on increasing the land values of the area.'
Sample Descriptive Statistics of the OLS Method for Pabna Station.
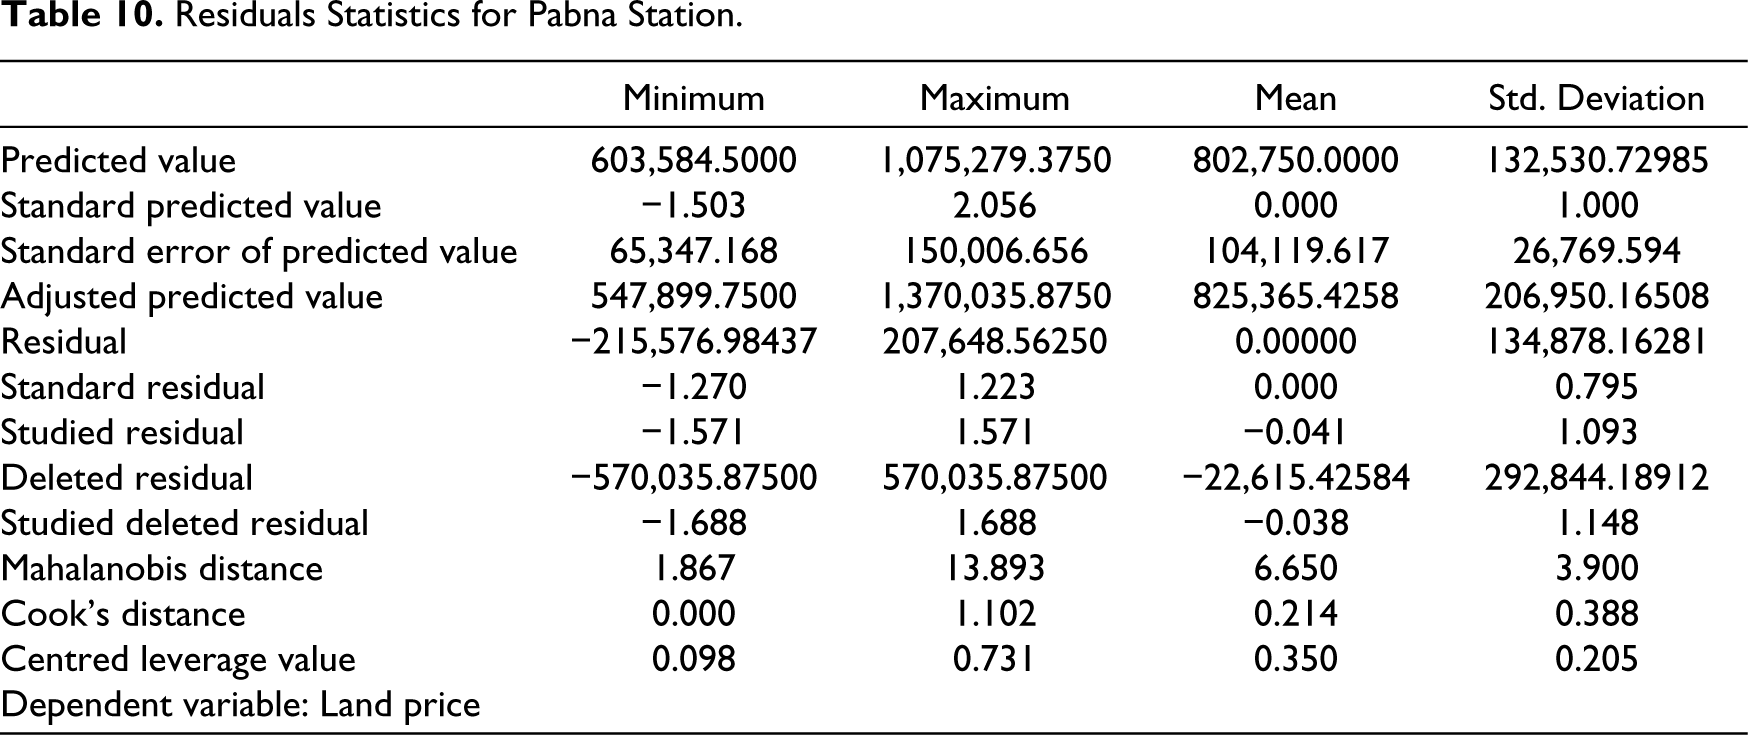
Cook’s distance from the residuals statistics of Pabna station is 1.102, which is close to the standard Cook’s distance of 1. So, this assumption is almost standard (Table 10). The P-P plot of regression shows its standard nature in Figure 3(a); also, the scatter plot in Figure 3(b) shows its usual results. So, we can say there are strong relationships between dependent and independent variables.
Results of OLS Method Comprising Dependent and Independent Variables for Pabna Sadar Station.
Residuals Statistics for Pabna Station.
Pabna Station: (a) P-P Plot of Regression Standardized Residual Dependent Variable; (b) Scatter Plot of Dependent Variable.
Changes in the Control Area and Catchment Area
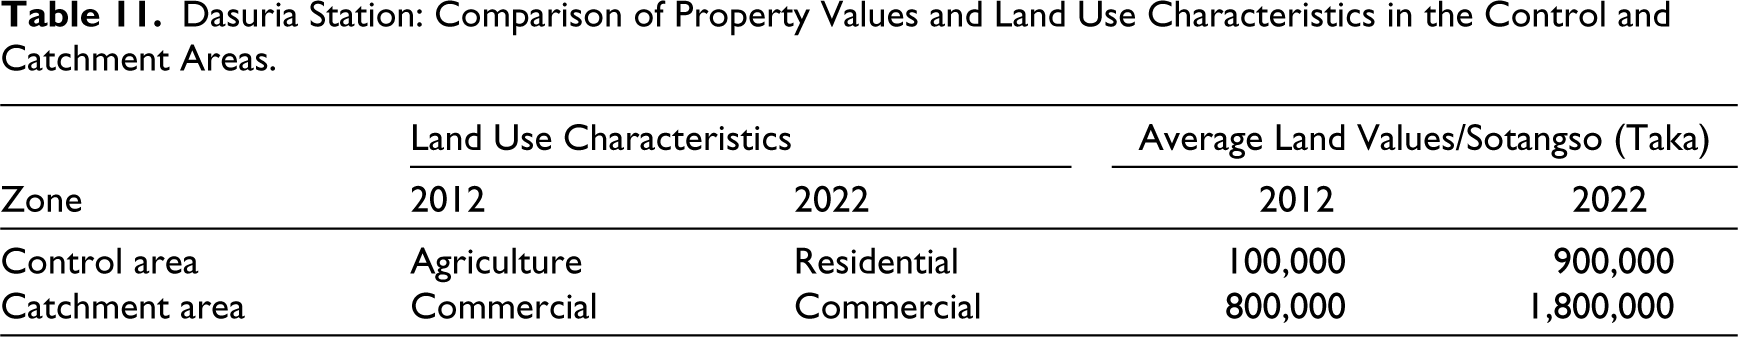
The comparative scenario of the control and catchment areas of Pabna station is shown in Table 11; there is a considerable increase in land prices in the control area of Pabna station. In addition, agricultural land has changed to residential areas due to the higher demand for residential land after the project implementation. The land use characteristics have remained unchanged in the catchment area, but the land prices have increased by 1,000,000 taka per sotangso in the study region.
Dasuria Station: Comparison of Property Values and Land Use Characteristics in the Control and Catchment Areas.
Dhalarchar Station
Property Value Status and Land Use Scenario
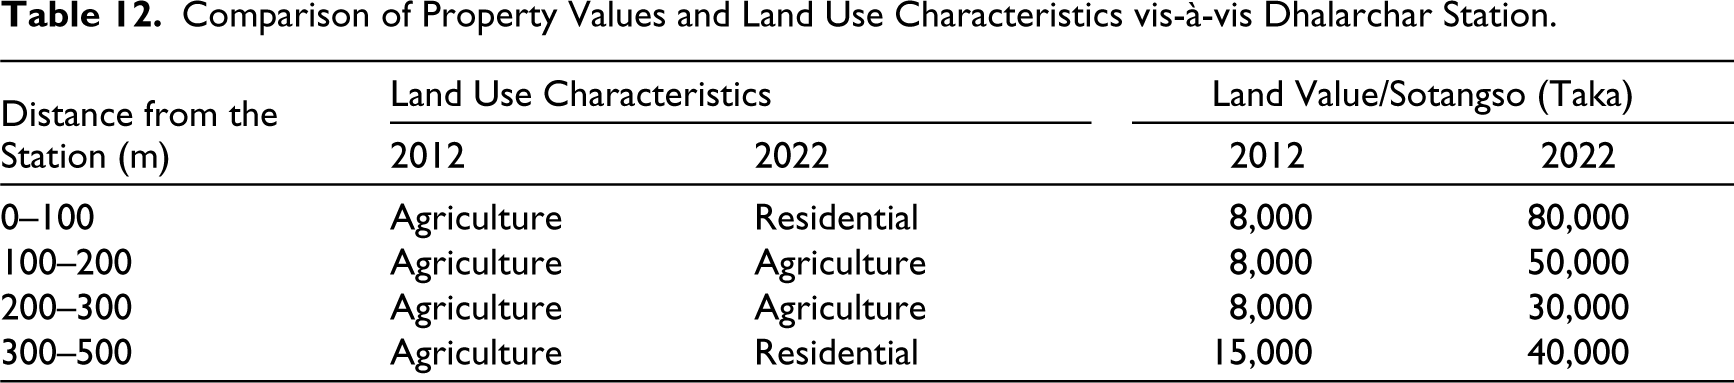
The surrounding area of Dhalarchar station was almost completely covered by agricultural land before the project. However, the land use pattern has been changing as people have started living around the station. The land price was around 8,000 taka per sotangso in 2022 in the station area, but over the years, in 2022, the land value increased to 80,000 taka per sotangso (Table 12). So, the land value has increased significantly in both the station and catchment areas (Dhalarchar bazaar).
Comparison of Property Values and Land Use Characteristics vis-à-vis Dhalarchar Station.
Measuring the Variability of Land Price After the Project Through the OLS Model
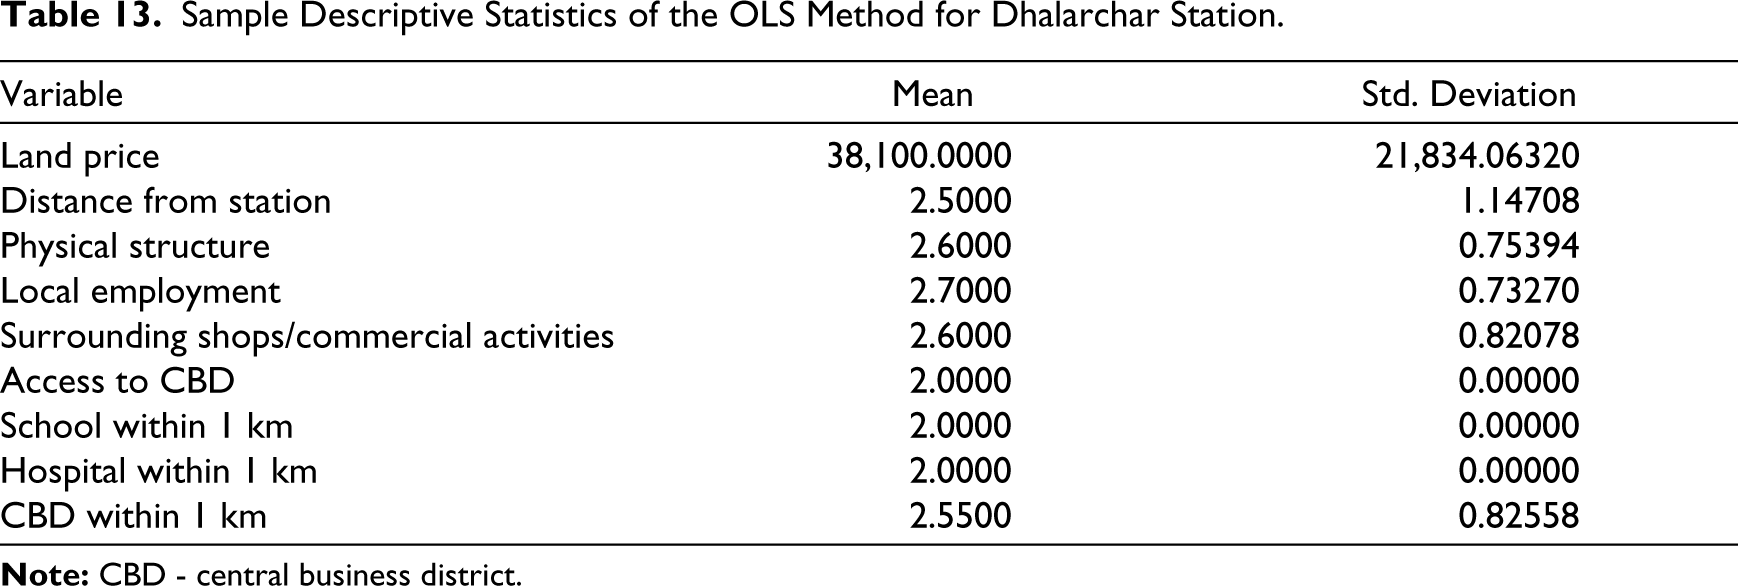
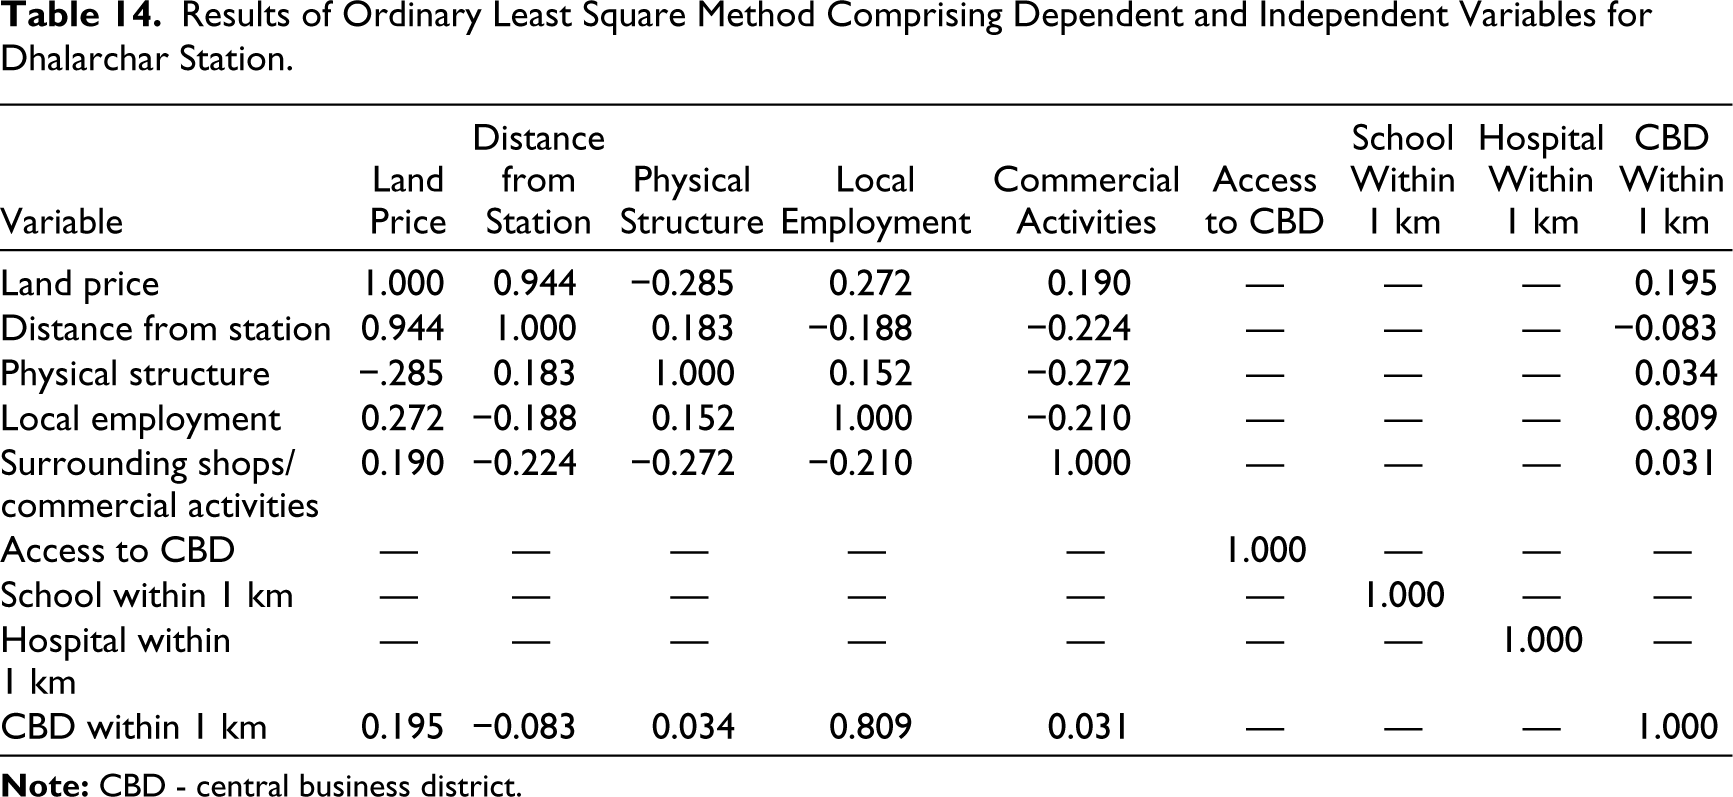
Table 13 represents the mean and standard deviation of the selected variables. Table 14 shows that the values of the dependent variable (land price) and the independent variable (distance from the station) are highly related, which is 0.944. The land price increases with nearness to the station, and the land price decreases with distance from the station. Other independent variables have no significant impact on the land price of the area.
Sample Descriptive Statistics of the OLS Method for Dhalarchar Station.
Results of Ordinary Least Square Method Comprising Dependent and Independent Variables for Dhalarchar Station.
Residuals Statistics for Dhalarchar Station.
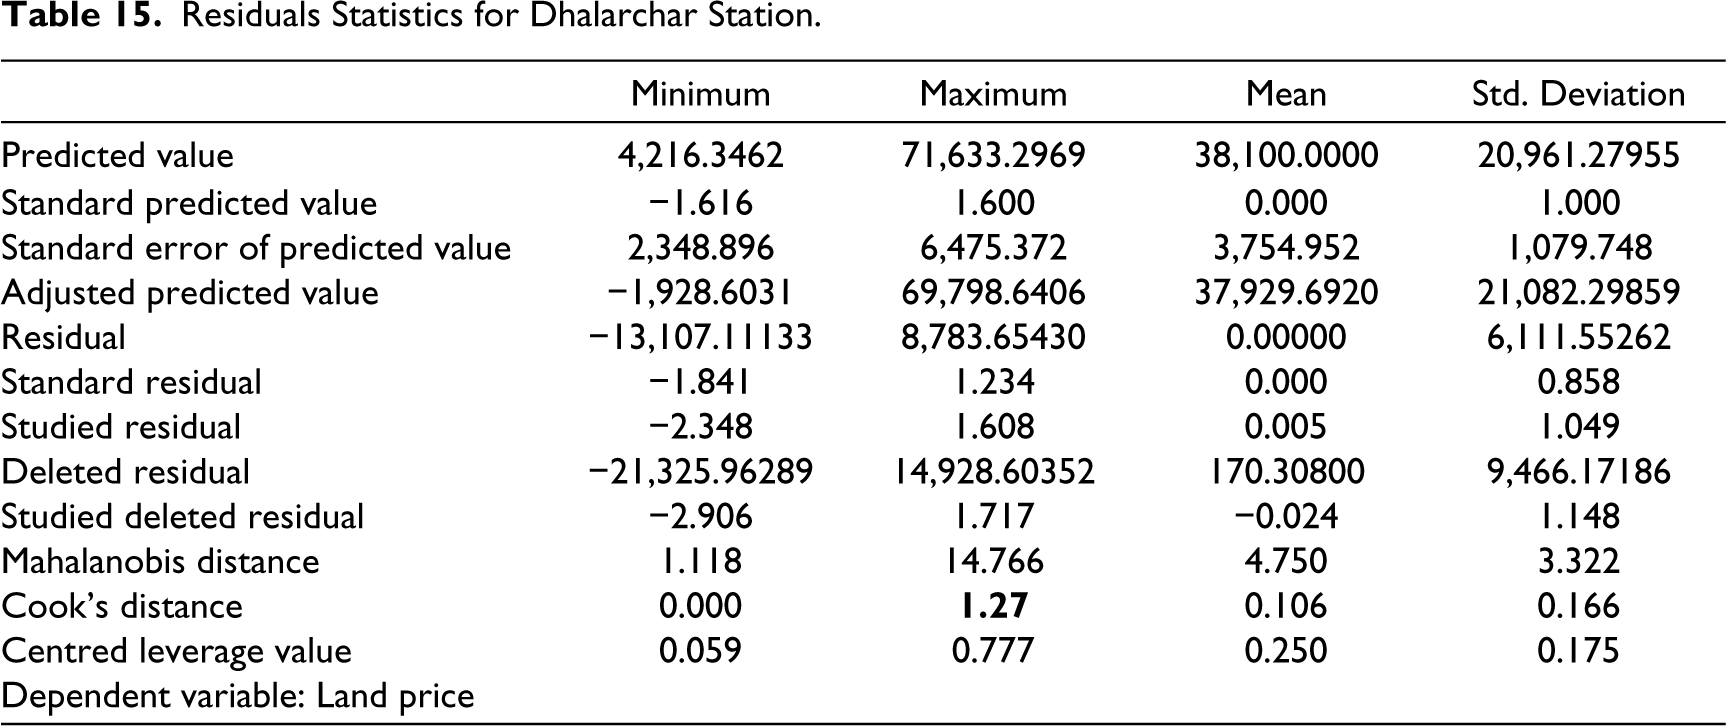
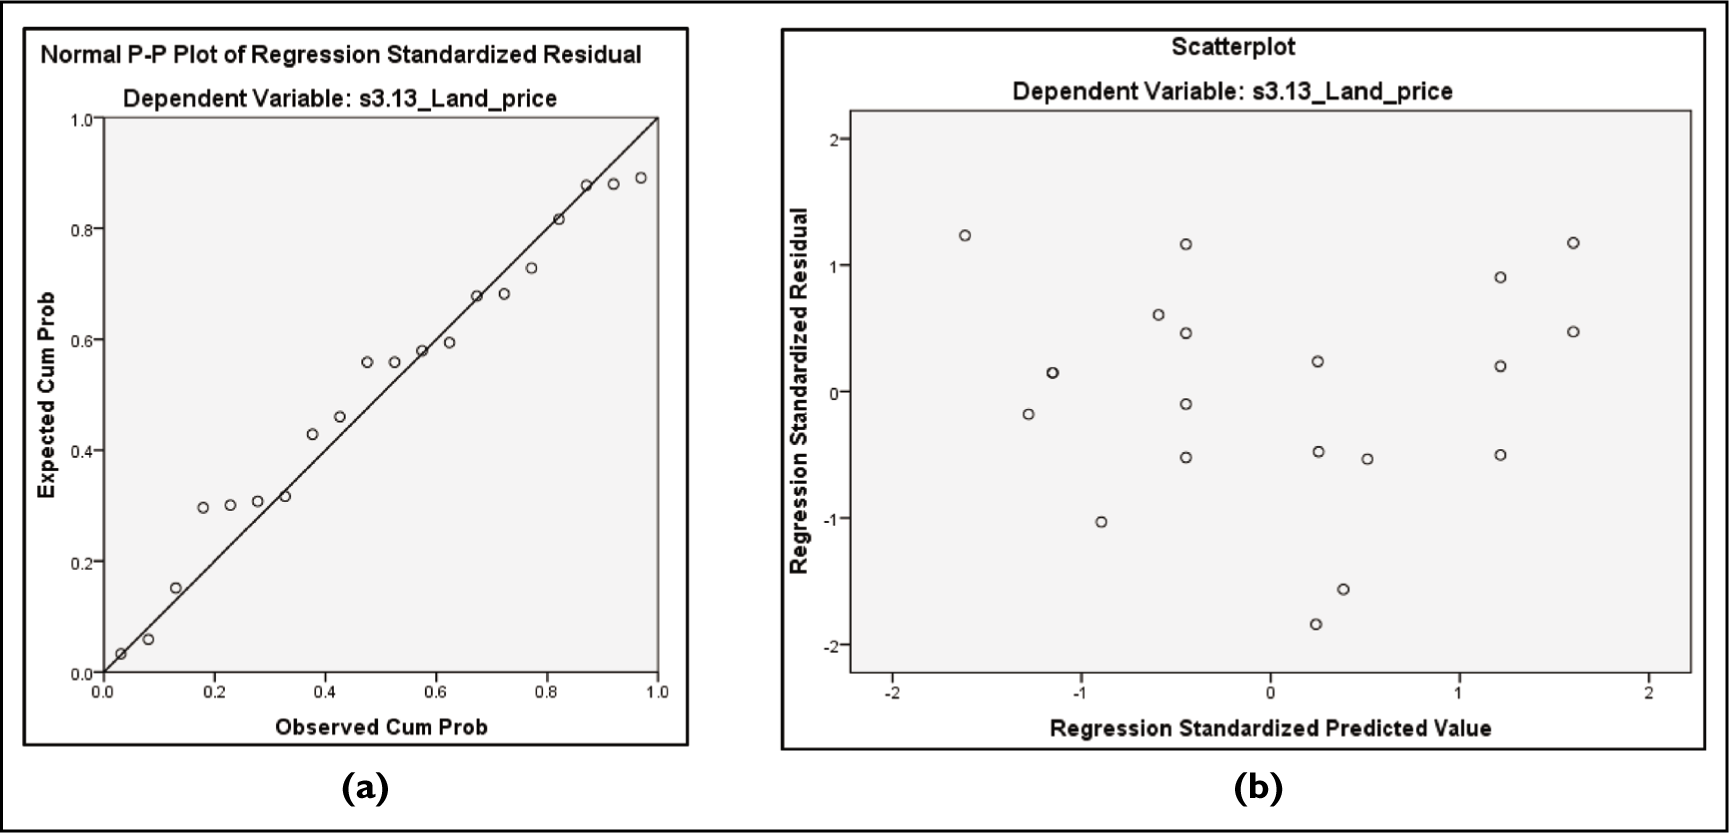
Cook’s distance of residuals statistics of Dhalarchar station is 1.27, which is close to +1. So, Cook’s distance shows the standard value justifies the model. The P-P plot of regression and scatter plot (Figure 4(a) and 4(b)) of this analysis also show the standard form.
Dhalachar Station: (a) P-P Plot of Regression Standardized Residual Dependent Variable; (b) Scatter Plot of Dependent Variable.
Changes in the Control and Catchment Areas
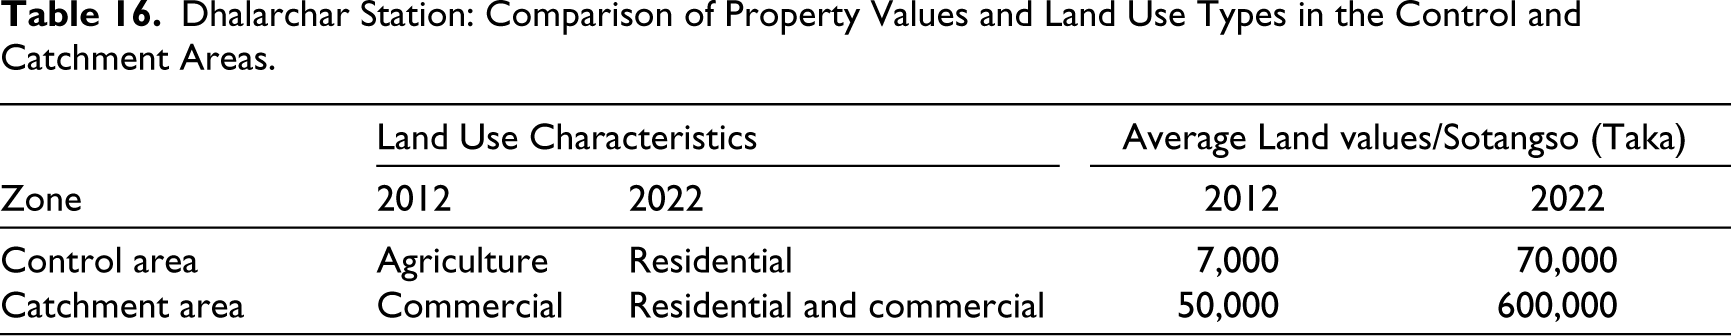
Table 16 shows that there were considerable changes in land prices before and after the project was completed. The land prices in the control area were only 7,000 taka per sotangso in 2012, which increased to 70,000 taka per sotangso in 2022. The catchment area also experienced remarkable land price shifts over the years. The land price was only 50,000 taka per sotangso in 2012 but exponentially increased to 6,00,000 taka in 2022. The land use characteristics in control and catchment areas shifted due to the active pressure of the railway construction project.
Dhalarchar Station: Comparison of Property Values and Land Use Types in the Control and Catchment Areas.
Discussion and Conclusion
Transport facilities shape the urban fabric and deeply impact the land prices (Wang et al., 2021). According to traditional urban economics theories, locations closer to railway stations tend to have higher development densities and more capital-intensive land uses. Hence, land prices there rise quickly (Pan & Zhang, 2008). The evidence has been collected from all over the world. China is the greatest example of this scenario; a 7%–9% increase in land prices has been observed after railroad development (Zhou et al., 2017). Zhou et al. showed how a high-speed railway, a new demand, has changed land use and, in some cases, increased land prices by 30%. This research has also identified the steep increase in land prices in three control areas of railroad development in Bangladesh but different incremental ratios. Several reasons have been given according to the findings of FGDs. In Bangladesh, agricultural land prices are less than residential land prices. Land owners can charge more if they sell their land as residential plots. As a result, within a decade, land prices have increased at different rates at different stations. Moreover, the resettlement procedure and rules are very complex, which has created an opportunity for price hike. Rail authorities are optimistic about increasing passenger coaches and opportunities to deliver raw materials supporting local industries on this rail route. Different local firms and export–import companies have started to bring wheat, corn, fly ash, etc., which has led to employment opportunities. This has been a chance to build godowns as the railway authorities have strict rules and regulations about the collection period of goods. Firms ordering the goods and products must collect these within a fixed time; otherwise, the railway authorities will dump the products. Moreover, significant penalties are charged for the delay. Even near Pabna station, rail authorities have built godowns and given them out for rent. The relation between rail transport and warehouse godowns for food storage has been observed in India as well (Kumar et al., 2021). Moreover, there is a plan to build a servicing industry of rail and oil distribution in this region, centring around the railway network. As the railroad starts to be built, local people have become optimistic about these opportunities, and land prices have peaked. In Dasuria station, as a result, within a 100–200 m buffer area, agricultural land has become vacant.
Dasuria railway station is closest to the Ruppur Nuclear Power Plant (about 10 km), Ishwardi Export Zone and several agro-food industries and just 700 m away from the Dasuria bus station, a major catchment area. Land prices and residential demand are already very high in Ruppur and Ishwardi. Housing rents are similar to those in Dhaka, the capital city of Bangladesh. Dasuria railway station has become another opportunity for landowners to develop the rural agricultural area as residential. There has been an approximately 17 times increase within a 100 m range and 10 times increase in the 100–200 m range. As an area at a distance of more than 200 m from the railway station was already in the Dasuria bus stand’s vicinity, the price was already higher, and the change had little effect. This is why the control area has faced a significant change (19% increase in price), and the catchment area not so significant. A similar impact has been observed by Zheng and Gu (2010) in Beijing, where the influence of rail transit is waning as nearby urban transportation networks grow.
Pabna station is the closest to the district-level CBD. The land price at 100 m from the station has increased 10 times in a decade, and a major conversion from agriculture to residential use has been observed. The project has been associated with a pucca road development from the station to the Pabna–Sirajganj highway. This connection has steered a 9 times increase in prices and residential development. The control area was more low land, not suitable for residential development as water used to get trapped. The development has increased land values and properties as well. Even the water bodies 300–500 m away from the station have been filled up and prepared as residential land. The decrease in transport costs led by railroad construction also increases surrounding land prices (Coffman & Gregson, 1998). On the other hand, the catchment area is already developed under full-functioning commercial use. This is why it has fuelled the control area land prices more. The result is proved in the OLS analysis section showing the relationship between different parameters—local employment, surrounding shops and commercial activities, etc.
Dhalachar was an underdeveloped area in every sense. The land price in 2012 was only 7,000 taka per sotangso in the control area. The railway project has increased the prices significantly, although the final price is not as high as other study areas. Moreover, more the distance from the station, lower the price. Conversely, the catchment area has the highest increase in price (12 times) in a decade as the area is developing daily after the project completion.
Dasuria is a great place for transit-oriented development (TOD). Many people travel daily to attend Ruppur and Ishwardi EPZ as rents are sky high in those areas. Dasuria is also well connected with Ruppur and Ishwardi by road and rail. However, TOD has a complex and significant impact on residential land prices based on railway line differences and service quality (Arum & Fukuda, 2020). This is why pre-planning is vital to guide urban development and land prices. Pabna station is also a great place for TOD. Moreover, there is a public university and well-known industries nearby. There is a residential zone called Monsurabad residential area, not far from the control and catchment areas. A great opportunity for real estate companies is dormant in this area. Debrezion et al. (2010) have identified that real estate prices drop by 1% for every doubling of the distance between a property’s location and the nearby railroad station. This research has also found a significant increase in residential prices and a change in land use close to the stations. These findings constitute a base for concerned authorities to design a planned development outline for the study area.
Footnotes
Declaration of Conflicting Interests
The authors declared no potential conflicts of interest with respect to the research, authorship and/or publication of this article.
Funding
The authors received no financial support for the research, authorship and/or publication of this article.