
Abstract
The process by which cities (or urban areas) expand over time has remained a key focus for geographers, ecologists and other scientists interested in urban phenomena for decades. This study investigated the use of spatial metrics and population data for defining and mapping rural-urban transition zones in Hanoi and exploring urban growth models. The analysis showed that in 2010, about 30% of communes within Hanoi could be defined as rural, 38% as peri-urban and 32% as urban. The peri-urban communes showed a greater level of landscape fragmentation and a higher pace of population growth than rural communes. The urban landscape of Hanoi in 2010 shows characteristics of both transportation corridors and dispersed sites models—the two least eco-friendly models of urbanization. This study provides an effective method for mapping such rural-urban transition and identifies forms of urbanization in places where other socio-economic data sources are limited. This is particularly useful for planners and development agencies that require reliable methods for collecting and analysing data, which can enable them to assess variables along the rural-to-urban continuum.
Introduction
The process by which cities (or urban areas) expand over time has remained a key focus for geographers, ecologists and other scientists interested in urbanization for decades (Rashed et al., 2001). Pioneering studies of urban development, such as Central Place Theory (Fischer, 2011), Concentric Zone Theory (Burgess, 2008) and Monocentric City Model (Alonso, 1964; Mills, 1967; Muth, 1969), modelled urban growth in two-dimensional space by using an outward gradient from the city centre and considering demographic and economic variables as the drivers of change. These studies simplified the city into a ‘central place’ that acted as a job centre, with declining land prices and lower population densities as distance from the city centre increased. Other attempts to delineate city centres have relied on measures of employment (Giuliano & Small, 1991; Redfearn, 2007) or on commuting for the purpose of employment (Cladera et al., 2009; Hughes, 1993). A common limitation of these models is their focus on employment since this reduces the entire experience of urban place to a simple journey-to-work exercise. Employment is indeed important to urban form, but it is not the only factor that needs to be considered for studying the landscape structure of cities (Krueger, 2012).
Historically, cities and the countryside have had a rigid dichotomy, but urban development in during the twentieth century has blurred this division (Zenner, 2002). Distinction between agricultural communities and industrial urban centres is no longer as sharp as should be. The advance of transportation (cars and highway), communication technologies as well as changing land tenure policies have softened the distinction between urban and rural areas. In particular, many rural areas located on the outskirts of established cities have become more urban in character, based on physical, economic and social elements and often have done so in a piecemeal fashion. This phenomenon of piecemeal change on the urban fringe is peri-urbanization (Webster & Muller, 2002). Peri-urbanization is a complex and dynamic process that involves significant structural changes in the demographic characteristics of the peri-urban region, including rapid population growth, changes in the structure of the peri-urban local economy and often involves a shift from an agricultural-based to a manufacturing-dominated production and employment. The change in the structure of the peri-urban economy also translates into a change in land uses, namely, the rapid conversion of agricultural and formerly marginal lands (e.g., wetlands) to industrial and residential uses.
Because of the complex and dynamic nature of peri-urban areas there has been a great deal of attention on describing and mapping these areas since the early 1990s. For example, McGee (1991) used the term ‘Desakota’ to describe the corridor development consisting of an intense mixture of agriculture, cottage industry, industrial estates, residential development and other uses co-existing side by side. Similarly, using different approaches, Rigg (2006) characterized the urban transition as a process of de-agrarianization where the following trends commonly occur over the landscape: (a) increase in diversification of occupations and livelihoods; (b) household income shifting from farm to non-farm sources; (c) livelihoods and poverty becoming delinked from land (and from farming); (d) lives becoming more mobile and livelihoods correspondingly delocalized; (e) a growing role of remittances versus agricultural income in household; (f) average age of farmers rising; and (g) cultural and social changes being implicated in livelihood modifications and in new ways. Building upon variables discussed in McGee (1991) and Rigg (2006), Saksena et al. (2014) classified and mapped rural-urban transition based on four indicators: (a) fraction of households whose main income is from agriculture; (b) fraction of land under agriculture; (c) fraction of houses using modern forms of plumbing (e.g., pour flush toilets or septic systems); and (d) vegetation density measured by normalized difference vegetation index (NDVI). A consistent aspect across previous studies is that socio-economic and biophysical factors are considered as potential drivers affecting the nature of rural-urban continuum. However, mapping rural-urban transition is often challenged by data availability. A lack of geo-referenced socio-economic and biophysical data often constrains these efforts, particularly in developing countries. However, one way to evaluate the urban form when socio-economic and biophysical data are absent is through the use of spatial metrics (e.g., patch density, edge density, etc.) (Nong et al., 2018), which characterizes urban spatial patterns and captures the relative urban nature of a place; a broad concept often referred to as ‘urbanicity’ (Dahly & Adair, 2007; Jones-Smith & Popkin, 2010; McDade & Adair, 2001; Van de Poel et al., 2009).
Urban forms are defined through the arrangement of urban patches across space and time. Burgess (2008) predicted that cities of the future will progressively expand and form five concentric rings, with areas of social and physical deterioration concentrated near the city centre and more prosperous areas located near the city’s edge. Forman (2008) adopted the concentric ring interpretation and described four models of urbanization. These are: (a) concentric rings, where built-up areas are evenly distributed around the central core; (b) satellite cities, where smaller cities become prominent in addition to the urban centre; (c) transportation corridors, where urbanization occurs along the main radial highways; and (d) dispersed sites, where built-up areas occur in equal-sized small dispersed patches (Figure 1). Each of the above urbanization models has varying ecological effects. Forman’s (2008) study of 38 urban regions worldwide concluded that in terms of ecological impacts, the order of urbanization models from best to worst is as follows: satellite cities, concentric rings, transportation corridors and dispersed sites.
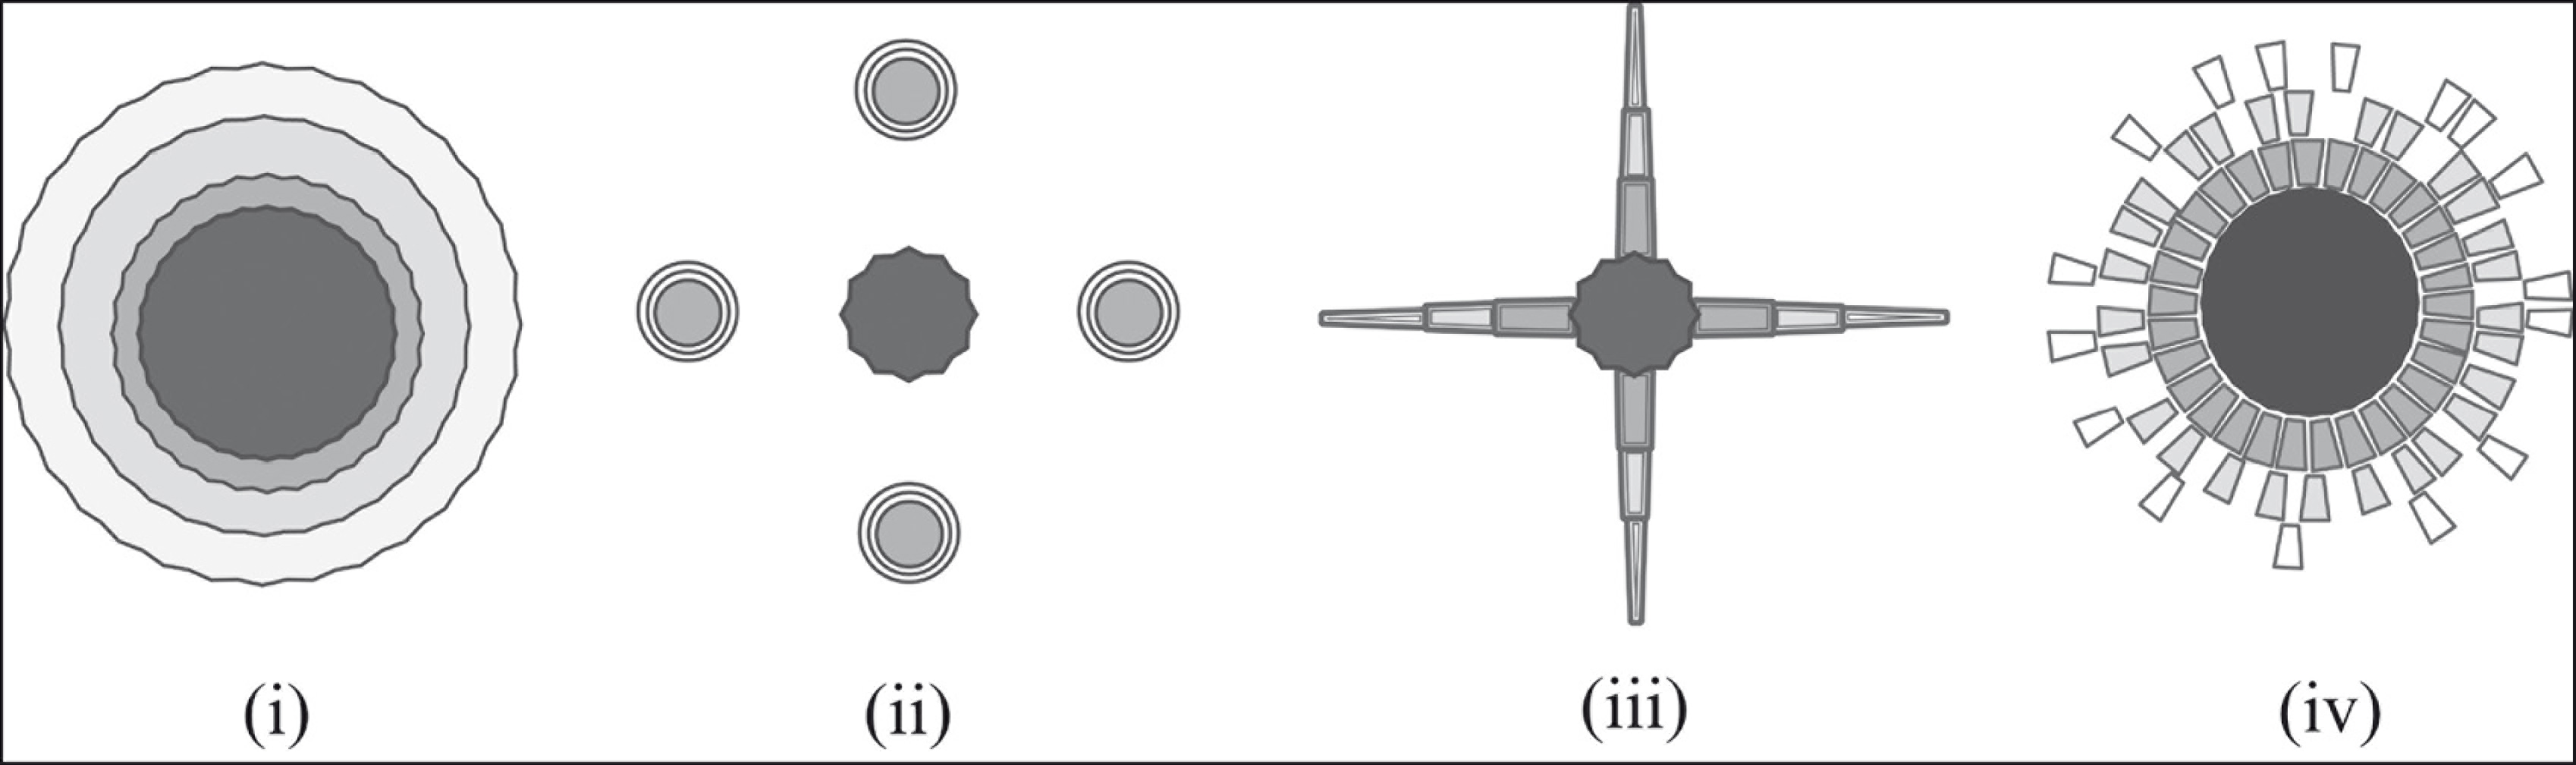
Given the various approaches and sources of data used to evaluate urbanization, our goal was to evaluate the use of spatial metrics and population data for defining and mapping rural-urban transition zones around Hanoi and exploring the urbanization models of the city. Specifically, our objectives were: (a) to map the rural-urban transition zones around Hanoi using cluster analysis of spatial metrics and population data; (b) to compare rural-urban classification of this study with the classification in Saksena et al. (2014); (c) describe the spatial pattern and population structure of the peri-urban areas; and, (d) compare the observed urbanization patterns with the four major spatial models of urbanization (i) concentric rings, (ii) satellite cities, (iii) transportation corridors and (iv) dispersed sites.
Methods
Data Sources
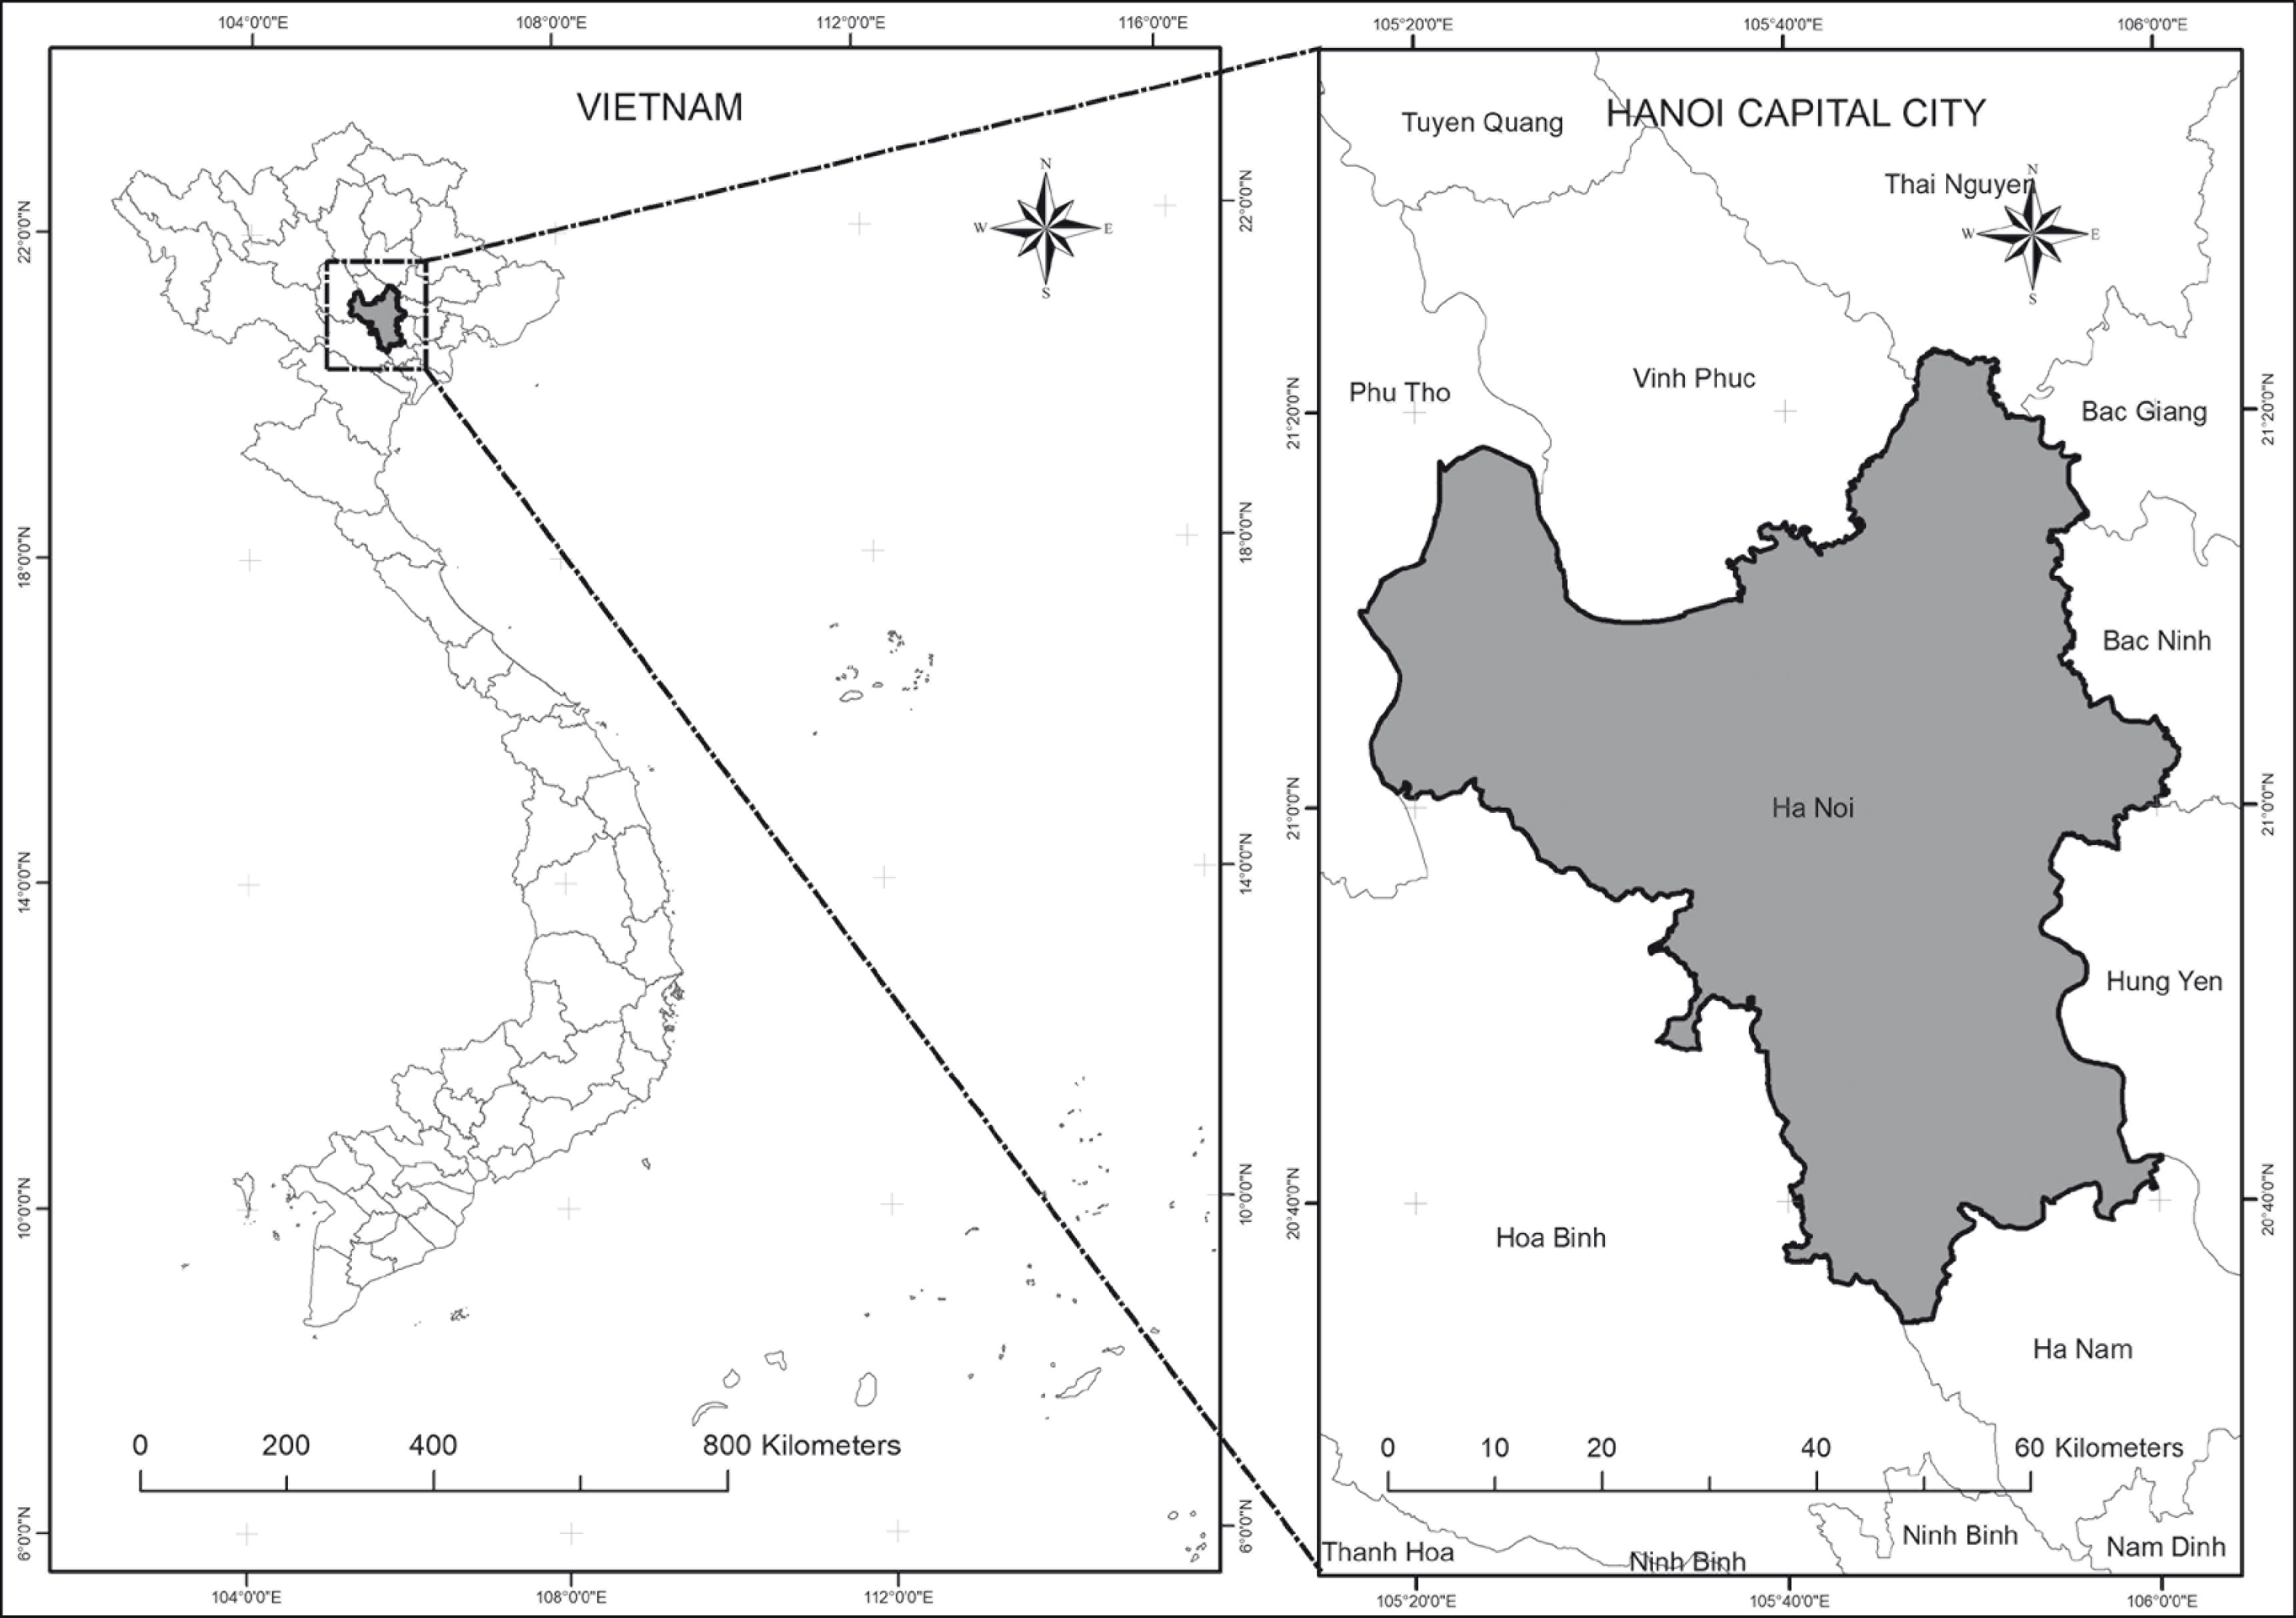
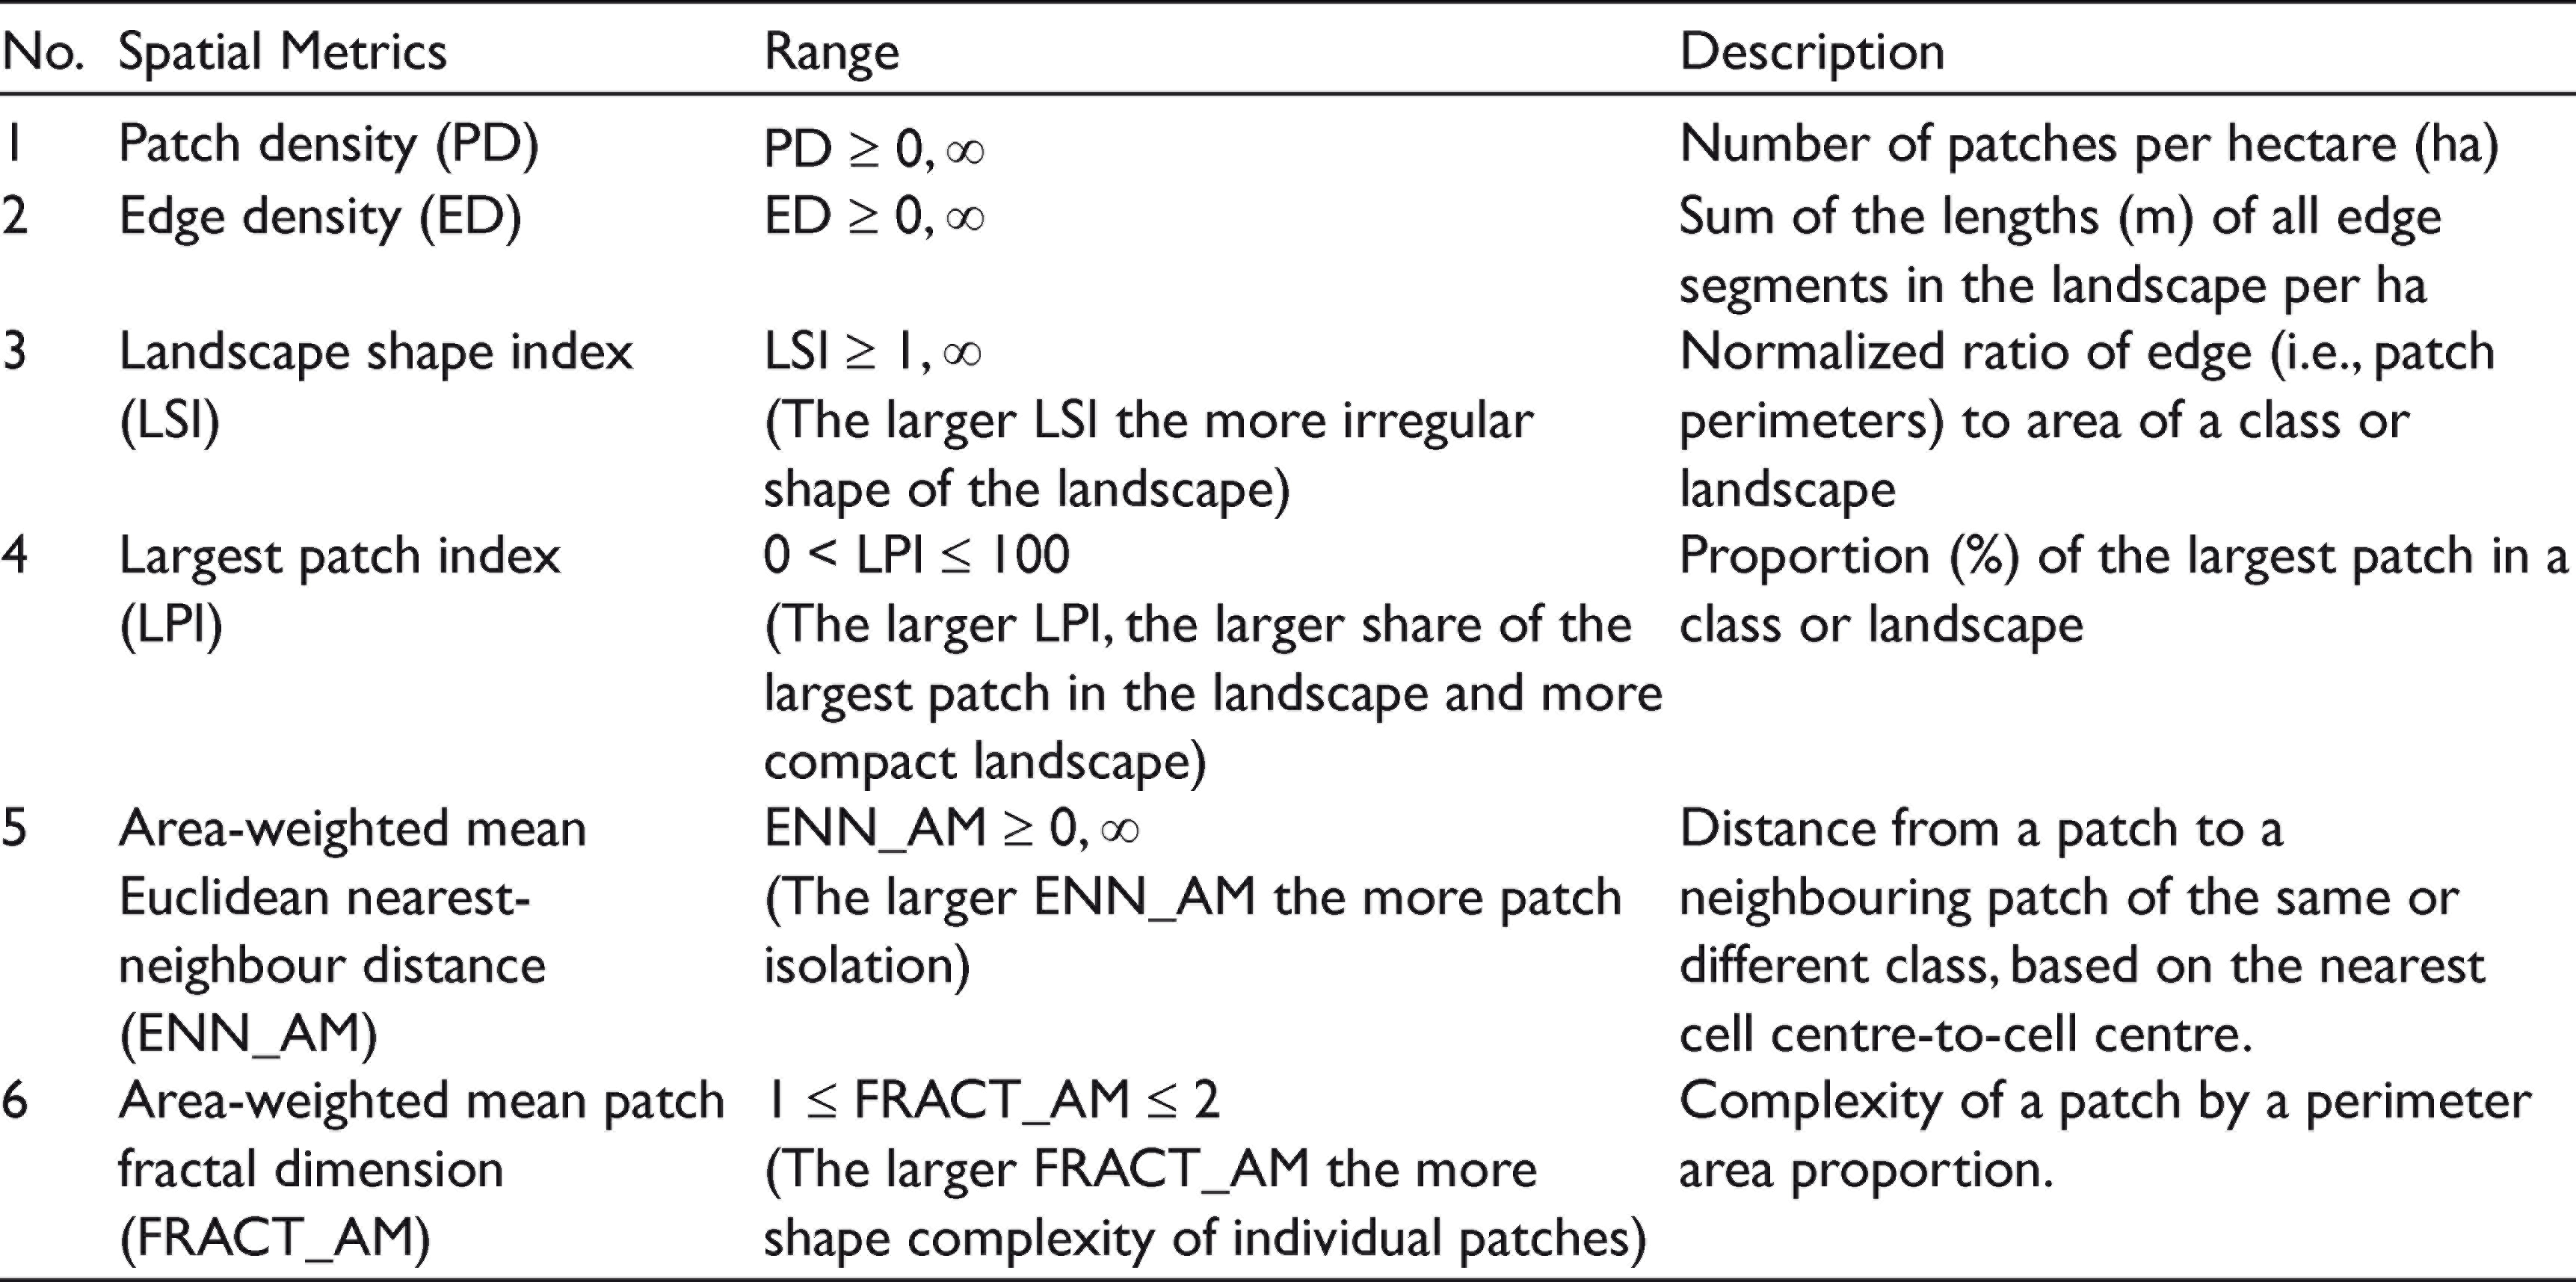
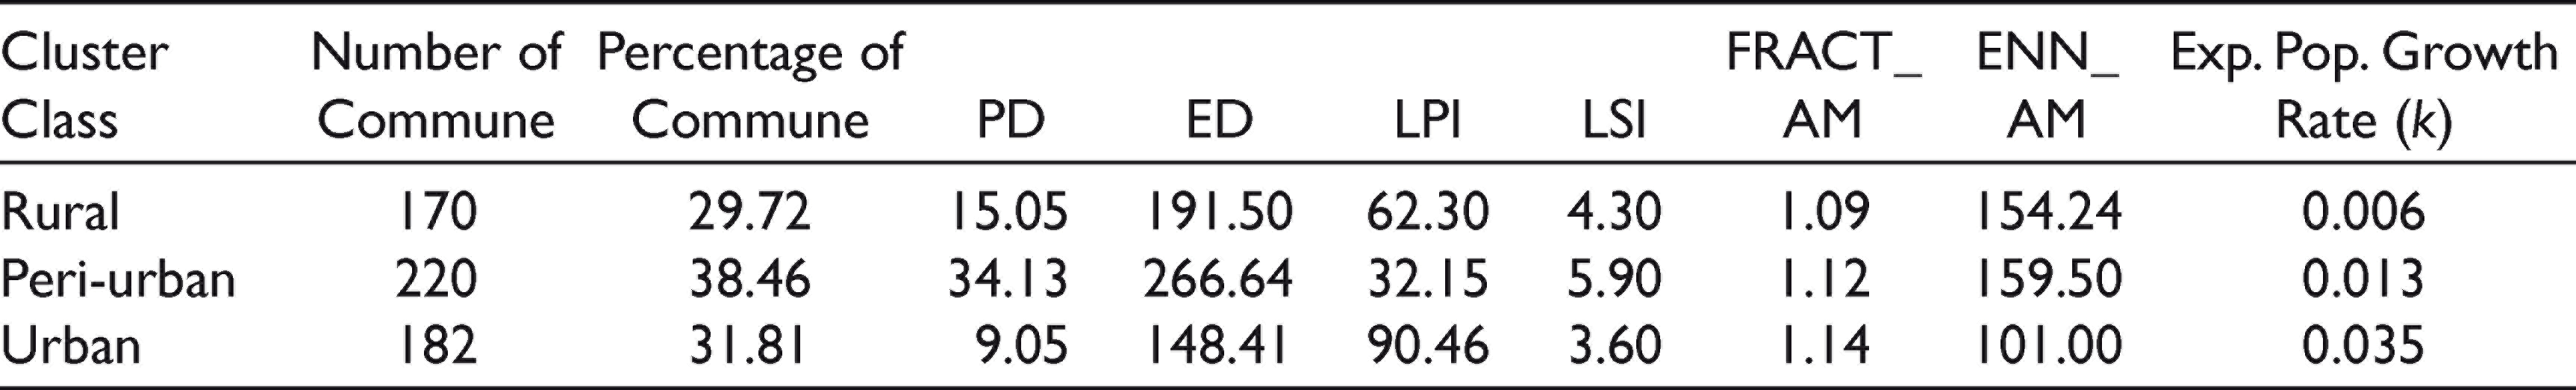
To address our research goal, we used a set of spatial metrics developed in Nong et al. (2018) as well as the Vietnam population census to map urbanicity for Hanoi, the capital city of Vietnam (Figure 2). Nong et al. (2018) used Landsat time series data from 1993 to 2010 and FRAGSTATS version 4.3 to produce a set of spatial metrics known to have explicit meanings in relation to the diffusion and coalescence of urban growth processes (Dietzel et al., 2005; Li et al., 2013; Tischendorf, 2001; Wu et al., 2011). These spatial metrics include patch density (PD), edge density (ED), landscape shape index (LSI), largest patch index (LPI), area-weighted mean Euclidean nearest-neighbour distance (ENN_AM) and area-weighted mean patch fractal dimension (FRACT_AM) (Table 1). The values of these metrics are averaged at the commune level, the smallest administrative unit in Vietnam, which is also the finest scale of census aggregation.
Previously Identified Spatial Metrics Describing Urbanization in Hanoi
Rapid population growth is considered one of the major characteristics and measures of peri-urbanization (Webster & Muller, 2002). Among all socio-economic variables, population data is the most readily available and accessible in most countries and is historically archived. Since 1979, Vietnam has conducted decennial censuses that are detailed at the commune level. This is considered the best and most reliable demographic information for the country (Banens, 1999). We calculated the exponential population growth rate (k) from the 1999 and 2009 population census for each commune within Hanoi city using following equation (Equation [1]):
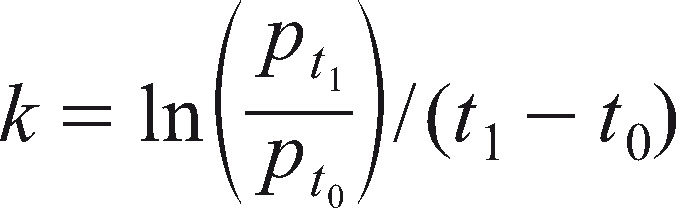
where k is the exponential population growth rate of the period 1999–2009, Pt1 is the population in 2009, Pt0 is the population in 1999, t0 is year 1999 and t1 is year 2009.
Cluster Analysis
Cluster analysis identifies and classifies objects, individuals or variables on the basis of the similarity of the characteristics they possess and seeks to minimize within-group variance while maximizing between-group variance. The result of cluster analysis is a number of heterogeneous groups with homogeneous contents. We used a form of hierarchical clustering with the squared Euclidean distance measure and the average linkage between groups. All the variables were standardized to a 0–1 range using a simple data transformation equation (Equation [2]):
where Zi is the ith standardized value, Xi is the ith value in the population, min(X) is the minimum value of the population and max(X) is the maximum value of the population. We labelled the three categories produced from the cluster analysis as rural, peri-urban and urban. Our choice of three clusters was based on preliminary explorations that suggested the existence of three zones with distinct spatial patterns: 0–10 km, 10–35 km and 35–60 km (Nong et al., 2018).
Since cluster analysis assumes no high correlations among variables (Sambandam, 2003), we first tested for collinearity among the variables. With the exception of a high correlation between PD and ED (r = 0.895), all other correlation coefficients among variables are considered as being a low correlation (Taylor, 1990) and acceptable for the cluster analysis (Appendix 1). Based on the correlation coefficient, we excluded ED variable in the cluster analysis.
We assumed that the three clusters would be distributed in a hierarchical/nested order, where the first cluster (urban) would be in the city centre, the second cluster (peri-urban) would be between the first and third cluster, and the third would be outermost (rural). We expected that urban patches would be clumped together at the urban centre but fragmented towards the periphery due to newly developed urban patches at the edge. To validate our classification method, we compared our results with those obtained by Saksena et al. (2014). We used the overlay tool in ArcGIS to identify the agreement and disagreement between the two methods.
Identify Urbanization Models
To identify the models of urbanization that Hanoi has followed, we relied on the classification result and major road networks in 2010 and compared these against four urbanization models: (a) concentric rings, (b) satellite cities, (c) transportation corridors and (d) dispersed sites, as described by Forman (2008).
Results and Discussion
Cluster Analysis
A cluster analysis of the 2010 landscape metrics indicated that 31.81% of the communes within the city’s administrative boundaries were classified as urban, 38.46% were classified as peri-urban, and 29.71% were classified as rural (Table 2). As we predicted, the peri-urban communes show a high degree of landscape fragmentation as indicated by the large PD, ED and ENN_AM values and the small LPI value (Table 2). The configuration of built-up features in the peri-urban category is also more complicated than in the rural and urban categories, as indicated by greater values of LSI.
Characteristics of Rural, Urban, and Peri-urban Communes in Hanoi for 2010
Comparison of Two Urban Transition Classification Methods
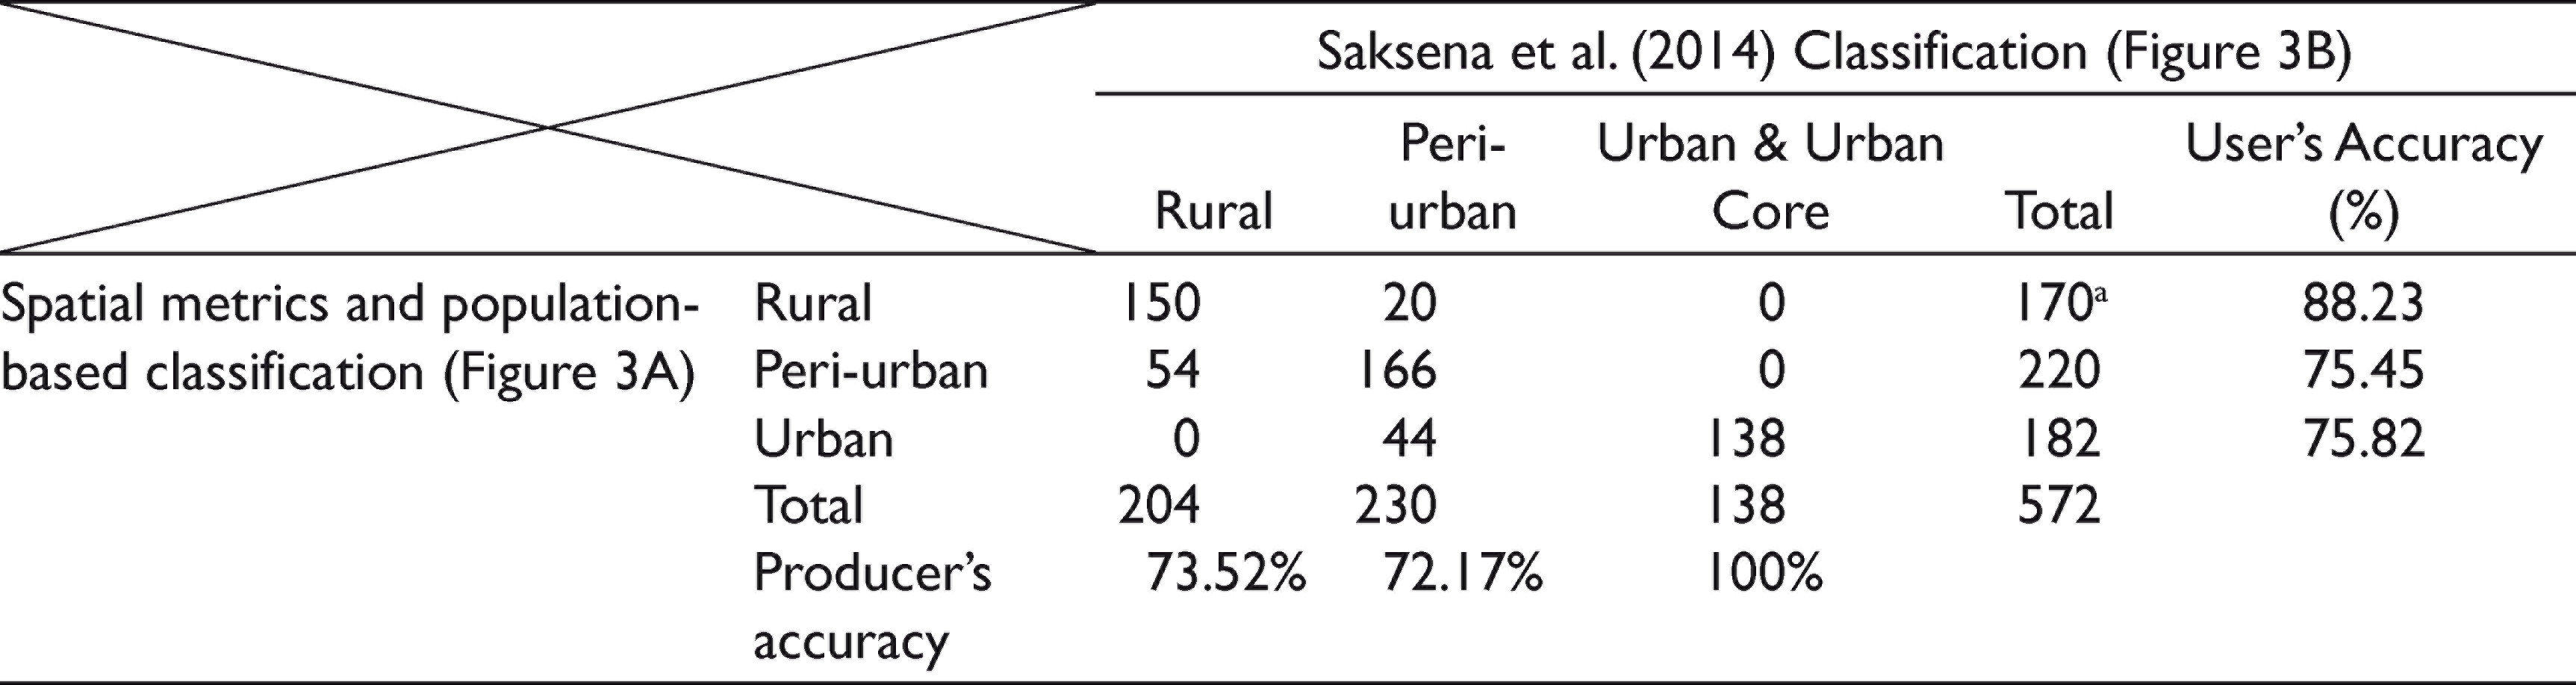
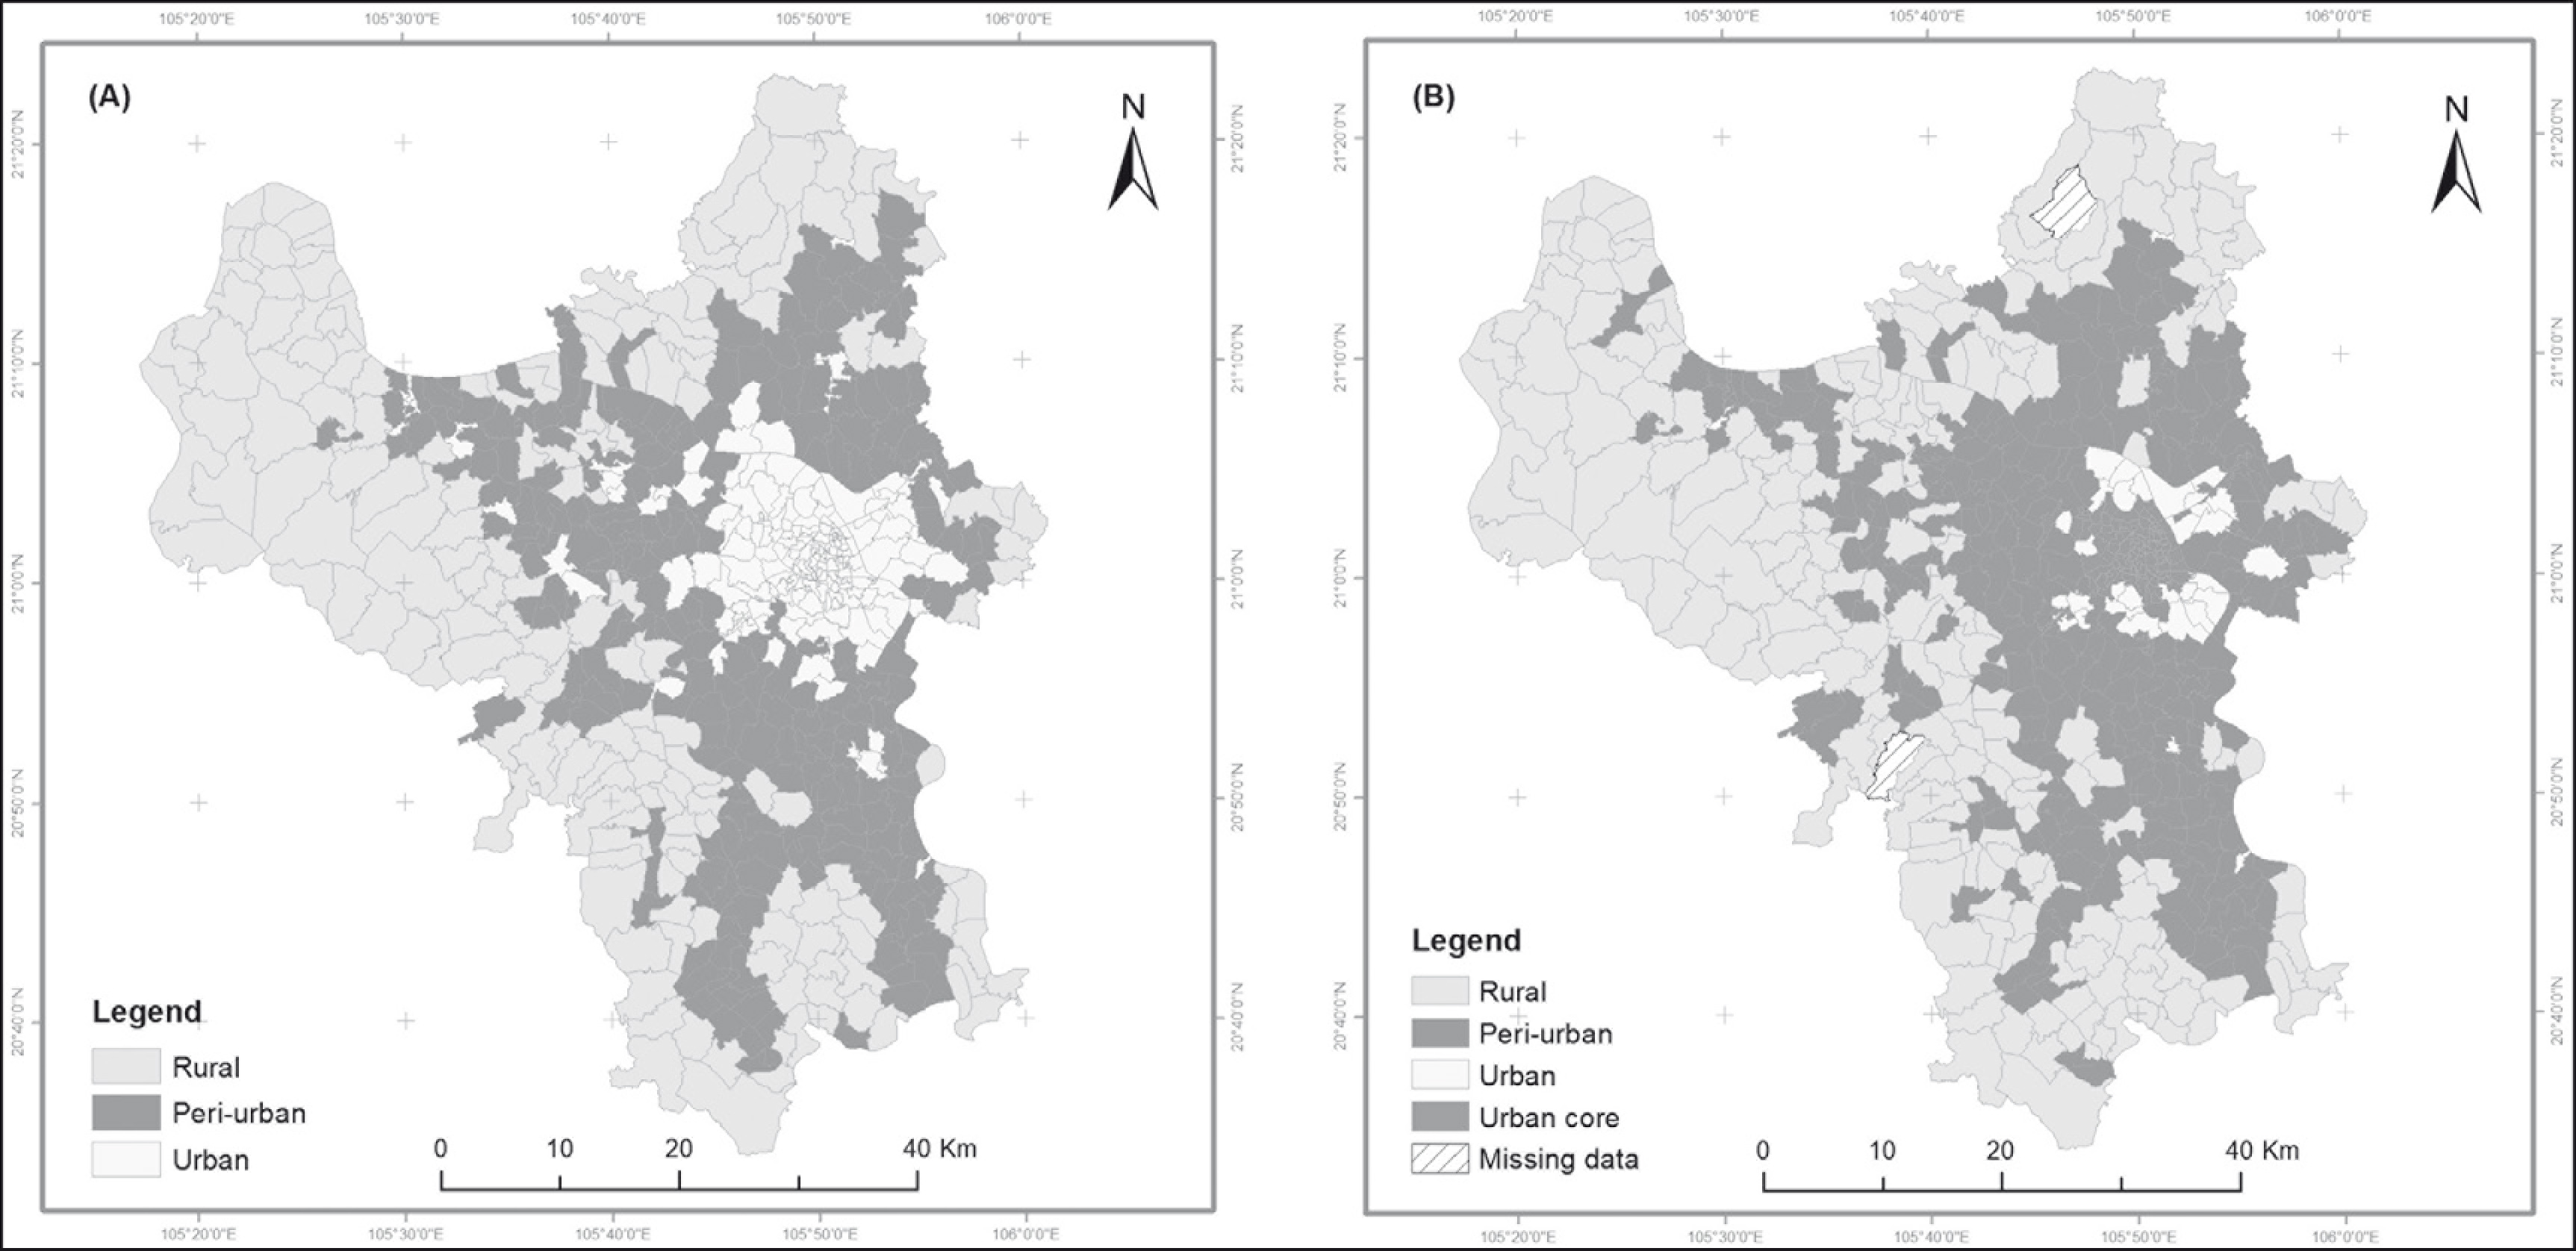
Saksena et al. (2014) performed a cluster analysis on data from Vietnam’s national population and agricultural census to classify communes according to their degree of urbanicity. Within Hanoi city boundaries, Saksena et al. (2014) classified 106 administrative units as urban core communes, 32 as urban communes, 230 as peri-urban communes and 204 as rural communes (Figure 3B). Two communes with missing data were excluded from the analysis. We combined Saksena et al.’s (2014) urban and urban core categories into a single urban category. In general, there was a 72.17–100% agreement between our resultant map and that of Saksena et al. (2014) (Table 3). The resulting comparison is relative to the different time frames of the two classifications, as we based our classification on 2010 landscape metrics and 1999–2009 exponential population growth rates (Figure 3A), whereas Saksena et al. (2014) used the 2006 agricultural census data and NDVI (Figure 3B). Nonetheless, the comparison reveals that disagreements occurred only between adjacent categories, that is, between urban and peri-urban or rural and peri-urban areas. There was no disagreement between urban and rural categories. The comparison further suggests that over the 4-year gap between the two classifications, some of the peri-urban communes became urban and some rural communes became peri-urban.
The Spatial Metrics and Population-based Classification Versus the Agricultural Census and Remote Sensing-based Classification Developed by Saksena et al. (2014)
Determinants of Spatial Patterns and Population Structure in Peri-urban Area
Previous studies have found that the spatial patterns of peri-urban landscapes are known to be closely associated with their socio-economic characteristics (Greene, 2004; Hillier, 2007; Karimi & Parham, 2012; Omer & Goldblatt, 2012; Penn et al., 1998; Rodriguez et al., 2012; Vaughan, 1999). Lower land price and more flexible environmental legislation in the peri-urban areas attract foreign investments in industrial parks and housing projects (Fanchette, 2012). Winarso and Firman (2002) showed that new housing projects search for locations with abundant and inexpensive vacant land. Developers often do not consider the lack of infrastructure to be a constraint because they are financially able to build new infrastructure (Winarso & Firman, 2002). However, infrastructure that is independently built by private developers is often not integrated into existing regional infrastructure networks provided by the government. For example, new road sections often end up being disconnected from broader transportation networks (Hudalah et al., 2007).
In addition, the governance and management of peri-urban areas is often neglected by both rural and urban administrators (Saksena et al., 2014), eventually causing uncontrolled peri-urbanization and infrastructure deficiency, particularly at the regional level. Lack of transport infrastructure, especially integrated public transportation, is a classic example of a deficiency that can isolate peri-urban areas from their surrounding regions (Hudalah et al., 2007). It can also be more expensive to provide adequate environmental infrastructure (e.g., solid waste and waste-water systems and watershed management) to industrial estates at long distances from cities (Webster, 2002). Furthermore, the construction of environmental infrastructure is often not a priority, since public investment is largely allocated to other infrastructure systems that can directly support the industrial activities. For example, 88% of public investment for the development of Thailand’s eastern seaboard was allocated to industrial-support infrastructure, including two world-class seaports and an express way (Webster, 2002).
Rapid population growth around city centres is a common characteristic of peri-urbanization in Southeast Asian countries (Webster & Muller, 2002). The peri-urban population is expected to increase by about 119 million over the next 15 years in the Asia (Gross et al., 2014). In this study, we found that the average population growth of peri-urban communes was as twice as fast as the rural communes (Table 2). A study by Kontgis et al. (2014) using the same 1999–2009 population censuses, as used in this study, also revealed that nearly 50% of the population growth in Ho Chi Minh City occurred in communes defined as peri-urban. Most of the population increase in these communes is due to migration from rural areas with natural growth only playing a minor role (Labbé, 2010).
In this regard, Dang (2005) highlighted three major factors driving migrants to peri-urban areas in Vietnam. First, the increasing commercialization of agriculture and the replacement of labour with capital investment has encouraged farmers to leave rural areas. Second, Vietnam’s incorporation in the global economy has resulted in an increase of foreign direct investment into the country. As the result, migrant workers are attracted to areas where foreign investment has created industrial hubs. Third, the development of transport systems, telecommunications and mass media across regions have facilitated spatial mobility and enhanced social contacts between rural and urban areas. According to the 1999 and 2009 national population censuses, the population of Hanoi grew by more than a million people during this decade; over 50% of this growth occurred in communes classified as peri-urban (Nong et al., 2015). Migrants from rural areas or neighbouring provinces to Hanoi often chose to reside in sub-urban areas due to cheaper housing and living cost, and a higher concentration of small to medium manufacturing enterprises. This, in turn, led to high population growth in these areas.
Urbanization Models of Hanoi
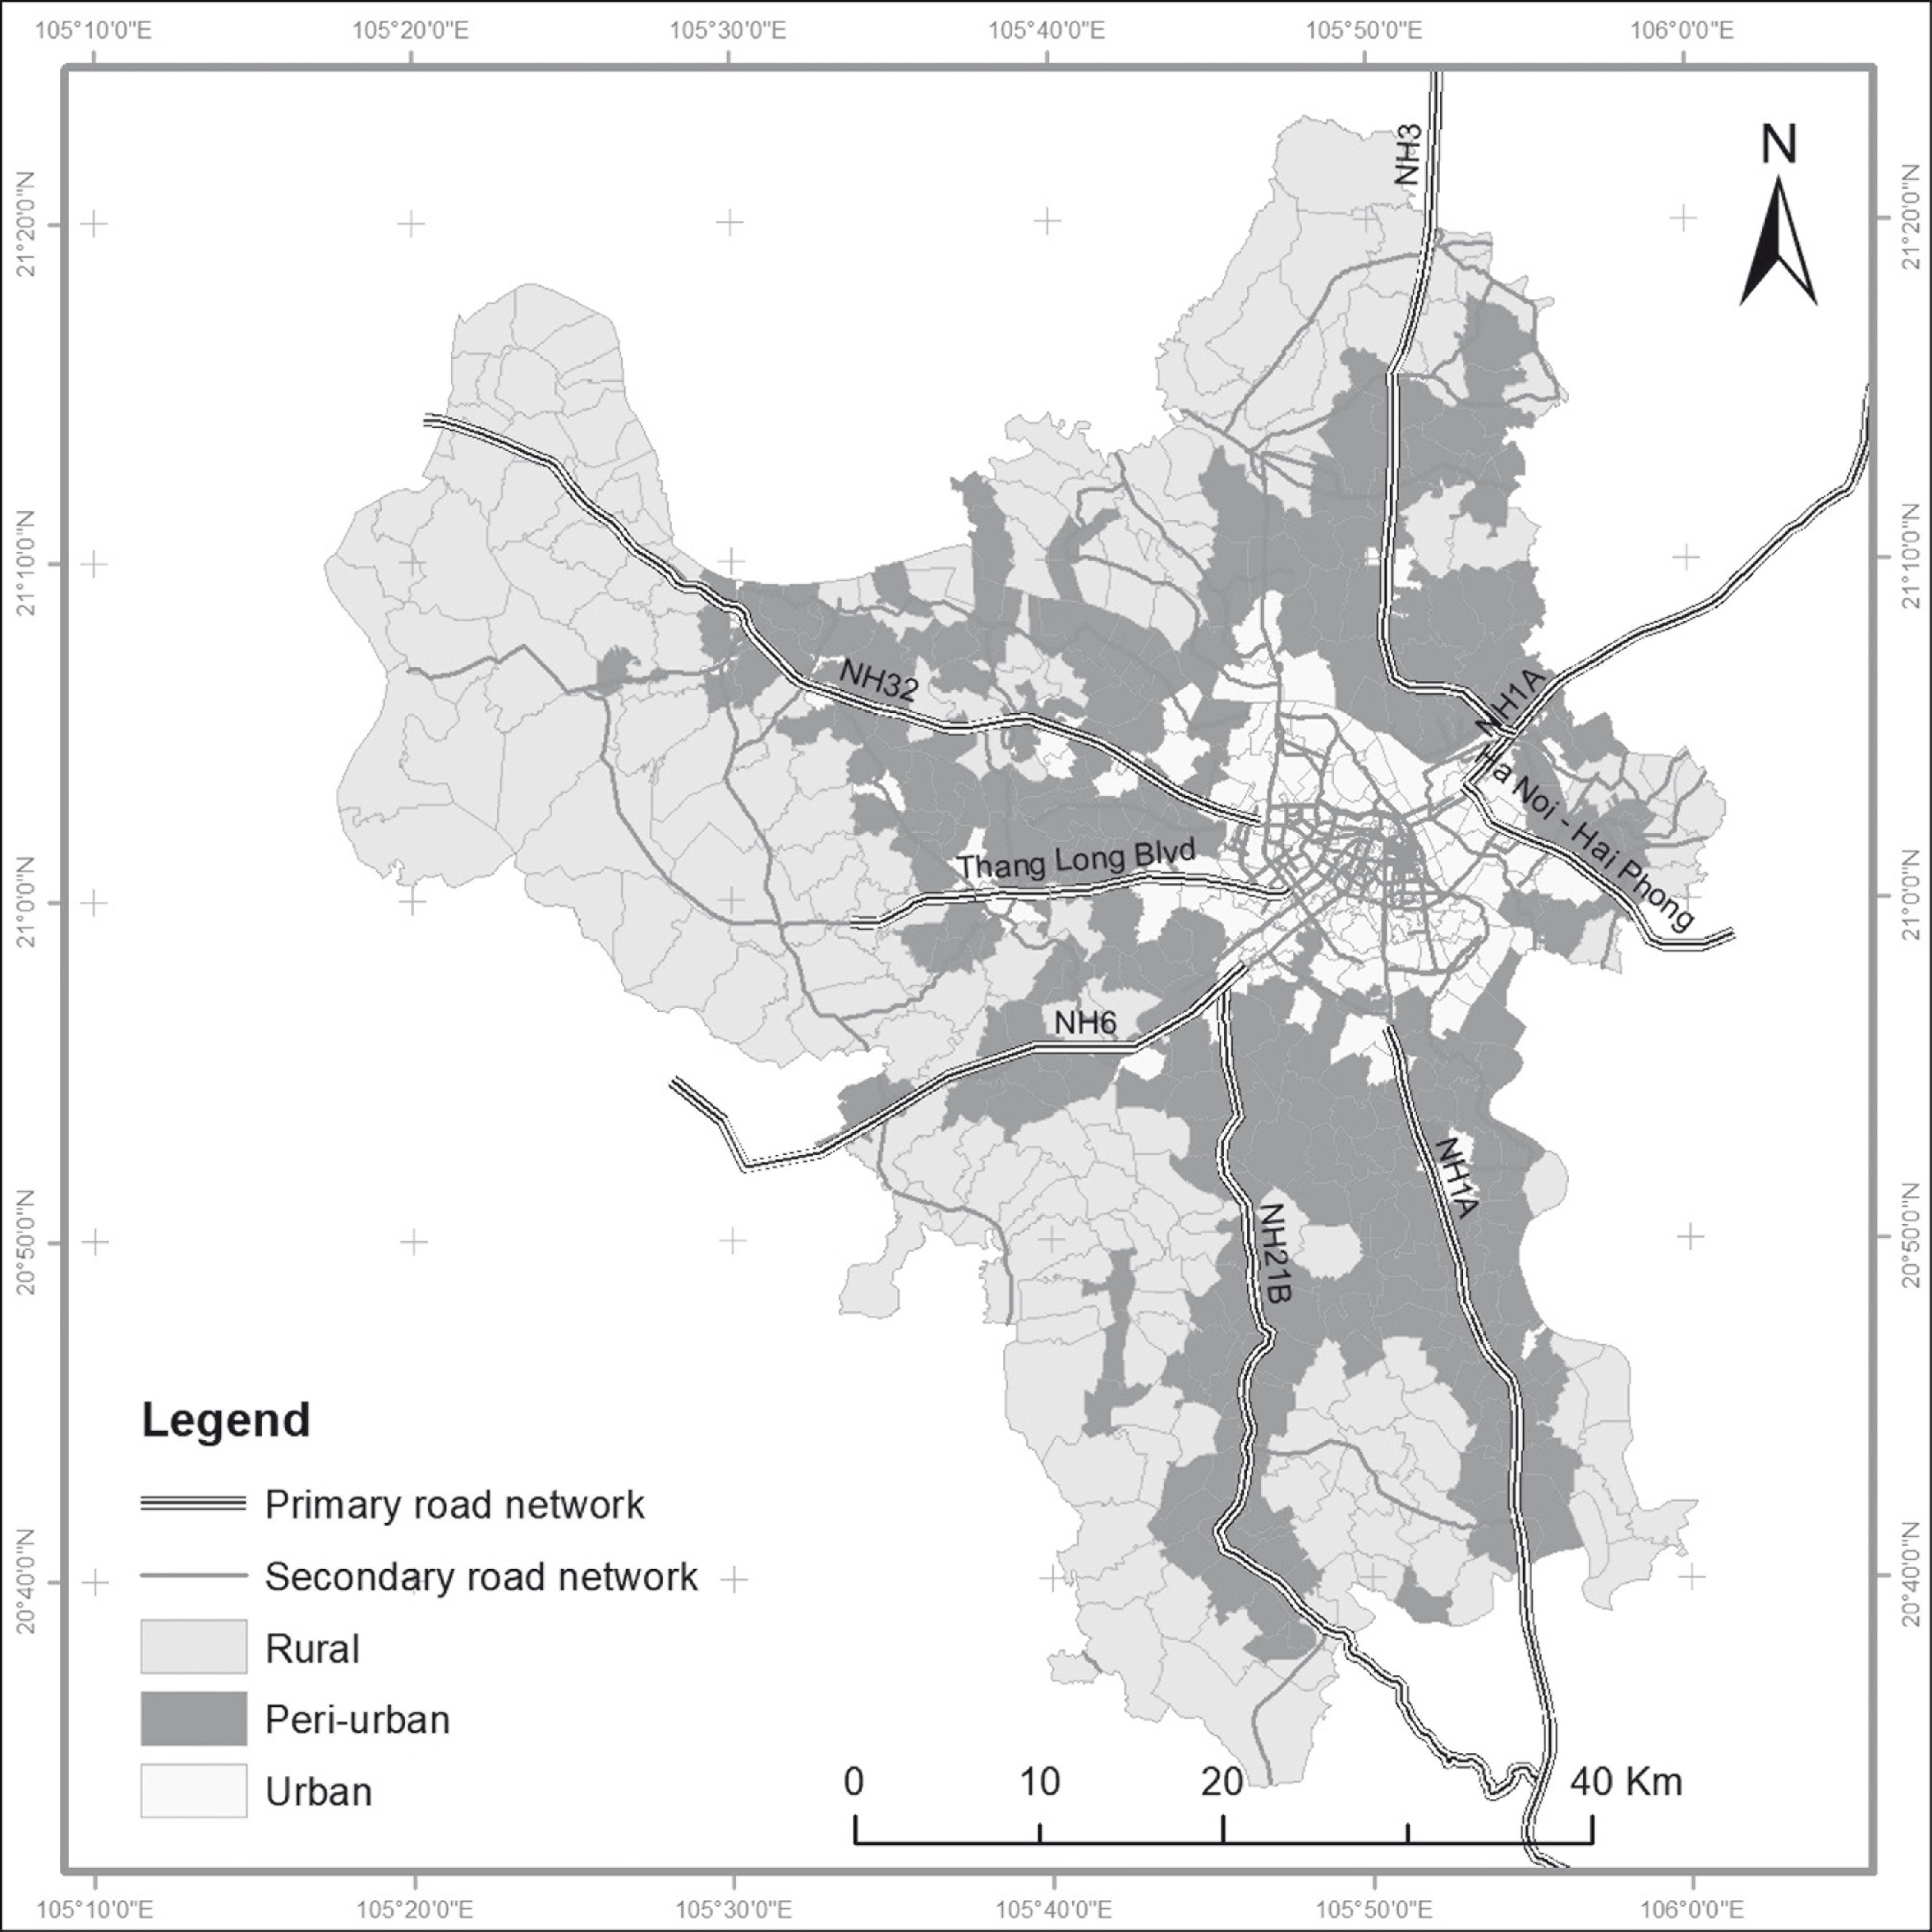
Comparing the urban form of Hanoi with those described in Forman (2008), we found that urbanization in Hanoi represented both transportation corridors and dispersed site models. For the dispersed site model, we saw a number of communes in predominantly rural areas of Hanoi classified as peri-urban communes. In the beginning of 2000s, Hanoi developed an urban model referred to as ‘new urban areas’ (hereafter NUAs) to meet the housing demand of rapid population flow into the city (Waibel, 2004). The city started to encourage investors to build NUAs in the periphery of Hanoi, in the form of high-rise apartments and houses for sale. However, to maximize profits, NUA investors commonly ignored many technical and management regulations, resulting in a big gap between the planned project and its actual implementation at this time. Investors only focused on building houses for sale, regardless of the comprehensive planning approved. Many NUAs were poorly connected with the city centre because of incomplete connecting roads, which investors had promised to build. This isolated NUAs from the city centre (Luan, 2014). These NUAs, initiated by Hanoi authorities in the early 2000, also sped up the peri-urbanization process and created many dispersed settlements around the city. These findings also support Saksena et al. (2014)’s argument that proximity to the city itself does not necessarily define a commune as being peri-urban. Rather, this definition rests on the co-existence of both rural and urban characteristics, rural-urban linkages and the flows of goods and services between rural and urban areas.
For the transportation corridor model, Martine and Marshall (2007) found that peri-urbanization in Asia tends to incorporate small towns along urban corridors spreading out from metropolitan regions. Examples of this phenomenon include China’s coastal regions, Bangkok’s metropolitan region, the Lahore-Islamabad highway and the craft and industry villages in the Red River Delta. In this study, we found that the distribution of peri-urban communes in Hanoi was also driven by road networks. Saksena et al. (2014) found a statistically significant association between peri-urban settlements and highway density in Vietnam. In Figure 4, we observed that peri-urbanization to the south of the city was influenced by two major national highways: NH1A and NH21B. The NH1A and NH21B run north-south connecting Hanoi to a number of cities in the south such as Hung Yen, Phu Ly, Thai Binh and Thanh Hoa. To the west and northwest of Hanoi, peri-urbanization clings to national highway NH6, Thang Long Boulevard and NH32. These are important routes connecting Hanoi to provinces in the west and northwest such as Hoa Binh, Son La, Dien Bien, Phu Tho, Yen Bai, Lai Chau, and more. To the north, peri-urbanization follows national highway NH3 which connects Hanoi to provinces in the north, such as Thai Nguyen, Bac Kan and Cao Bang.
The development of Hanoi exhibits urbanization patterns extending from an urban core to dispersed sites and discontinuously along major transportation corridors. These forms of urban development (dispersed sites and transportation corridors) are considered to be the least eco-friendly (Forman, 2008) because they often result in leapfrogging and strip patterns of development characteristics of urban sprawl. However, in recognizing these models of urbanization and accounting for their environmental risks, certain immediate solutions can emerge. For example, developing a ring road system could gradually direct urban growth to the development of concentric rings or multi-polar urban regions consisting of satellite cities dispersed around the existing agglomeration. This could help to reduce pressure on the existing urban infrastructure and environment.
The rural-urban dichotomy is, in most cases, becoming increasingly blurred (Webster & Muller, 2002). People, goods and services across urban and rural areas are becoming increasingly interlinked. This is not always immediately visible but may take place in the social and economic activities that local inhabitants engage in. Therefore, one of the limitations of this study is that we can only capture the spatial characteristics of peri-urban areas through landscape metrics and population change, without considering other socio-economic factors such as economic structure (a shift from an agriculture to a manufacturing dominated economy) and employment structure (a shift from farmer to factory worker). At the same time, this limitation also opens new questions and avenues for research. While our study draws on landscape metrics that provide useful variables for describing and mapping the rural-urban transition in Vietnam, we also suggest that, where possible, the combination of physical, socio-economic and even biological data would provide a better understanding of the intrinsic nature of these different categories.
Conclusion
This study suggests that spatial metrics and population census are a good source of data to map the rural-urban transition. The findings showed that in 2010 about 29.71% of communes could be classified as rural, 38.46% could be classified as peri-urban and 31.81% could be classified as urban. The peri-urban communes show a higher level of landscape fragmentation as indicated by the greater values of PD, ED and ENN_AM and the smallest LPI value. The configuration of built-up features in peri-urban areas is also more complicated than in rural and urban areas, as indicated by the greater values of LSI. Population growth was faster in peri-urban communes than in rural communes during the study period. We found a good agreement (72.17–100%) between our resultant map and that of Saksena et al. (2014), which indicates an alternative approach to mapping rural-urban transition. The exploration of urbanization models revealed that the city has experienced two of the least eco-friendly models of urbanization. Since peri-urban areas of Hanoi will be sites of significant population growth, land use and land cover changes in the near future; these findings have important implications for policymakers. Finally, urban landscape planning often requires strengthening the structures and ecological functions of urban landscapes. This study showed that spatial metrics and variables of urban land use forms can serve as alternative representations of ecological factors in urban models. Such information will help planning authorities and policymakers in developing the landscape through a more sustainable use of resources.
Footnotes
Declaration of Conflicting Interests
The authors declared no potential conflicts of interest with respect to the research, authorship and/or publication of this article.
Funding
This work was supported by the National Science Foundation [grant number: 0909410] to JMF.
Appendix
Pearson Correlation (r) Between Variables Used in Cluster Analysis
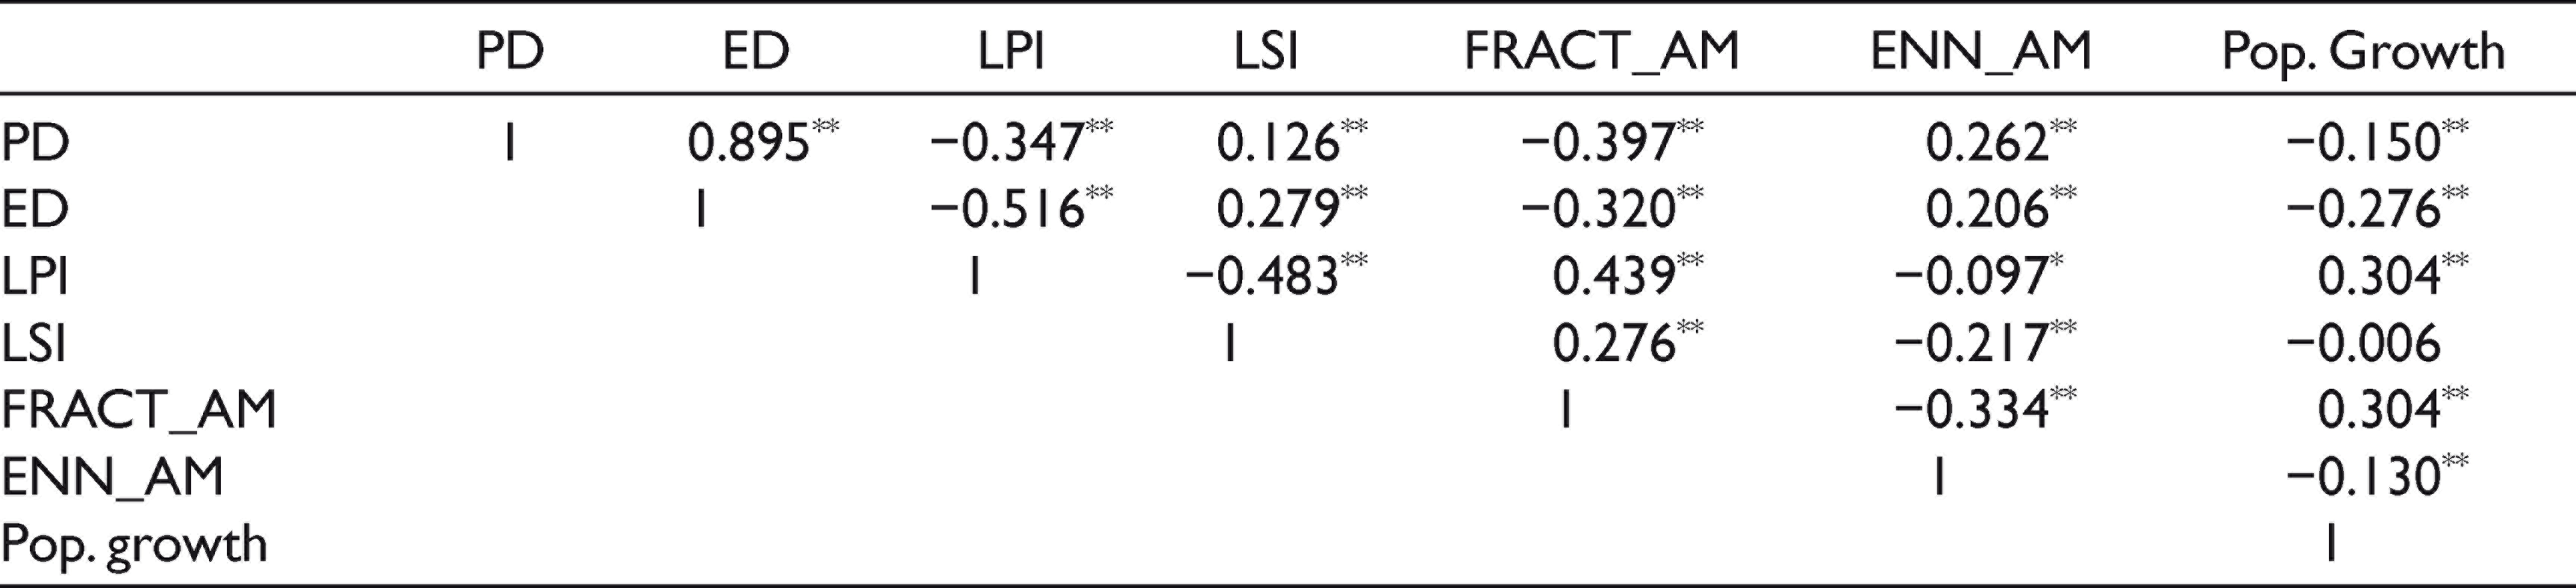
| PD | ED | LPI | LSI | FRACT_AM | ENN_AM | Pop. Growth | |
| PD | 1 | 0.895** | −0.347** | 0.126** | −0.397** | 0.262** | −0.150** |
| ED | 1 | −0.516** | 0.279** | −0.320** | 0.206** | −0.276** | |
| LPI | 1 | −0.483** | 0.439** | −0.097* | 0.304** | ||
| LSI | 1 | 0.276** | −0.217** | −0.006 | |||
| FRACT_AM | 1 | −0.334** | 0.304** | ||||
| ENN_AM | 1 | −0.130** | |||||
| Pop. growth | 1 |