
Abstract
The Southern African Customs Union (SACU) is a prominent economic association of the African continent. SACU comprises five southern African countries: South Africa, Botswana, Namibia, Lesotho, and Eswatini. The overall value of India’s trade with SACU increased from $1,477.52 million in 2001 to $1,0941.24 million in 2020, an almost sixfold increase. The export increased almost tenfold between 2001 and 2020, from US$ 343.49 million to US$ 3,760.94 million. In order to increase India’s trade with SACU, the Indian-SACU PTA negotiations are now ongoing. This article examines India’s export potential to SACU nations using the revealed comparative advantage index, the revealed import dependency index, and the Potential bilateral trade equation. The study shows India has trade potential with all SACU member states. Still, it has only utilised this potential with South Africa. India has not taken advantage of the vast potential of exporting its goods to SACU countries except South Africa. The trade intensity index indicates that India’s export and import intensities with SACU have increased over time.
Keywords
Introduction
India’s foreign trade has grown in almost every sector in the last two decades. India’s exports have diversified both in terms of market and products. The share of developed countries in India’s exports has declined while that of emerging economies has increased. India currently exports more than 50% of its goods to emerging and developing economies (Saraswat et al., 2018). Looking at India’s trade relations with the countries of the African continent in developing economies, it is found that India has seen an unprecedented increase in trade with Africa in the last twenty years. India’s trade with Africa grew from US$ 5247.50 million in 2001 to US$ 53531.36 million in 2020, almost tenfold, with a 12.31% CAGR. The upward trend in trade shows that Africa can play an important role in the future of developing India’s world trade. As African countries and India develop, their share in the trade partnership with India will increase, which will benefit both countries. Researchers have not paid attention to India-Africa trade relations. India’s trade relations with African countries have grown significantly in the last 20 years. India has a significant trade relationship with the Southern AfricanCustoms Union (SACU). The SACU is a customs union of five countries, including South Africa, Botswana, Namibia, Lesotho, and Eswatini. Over the years, as the forces of globalisation have grown, so has Southern Africa been trying to become more active and competitive in the world (Mpinganjira, 2012). In India, economic reforms in the early 1990s opened India’s formerly semi-closed economy to international trade and capital flows. This momentous reform allowed cross-border trade and capital flows to reshape national economies into global markets (Ghose, 2016). Globalisation influenced other developing economies, and as a result, their international trade started to increase. Over the past two decades, India’s exports have diversified in markets, products, and services (Saraswat et al., 2018). The share of developed nations in India’s exports has decreased, while the share of emerging economies has grown. India now exports more than 50% of its goods to emerging and developing economies, surpassing its exports to developed nations. India is projected to have the world’s fastest economic growth over the next several decades (Edoun & Kgaphola, 2019). After China, India is currently the second-largest trading hub in the BRICS nations. In this process of globalisation, African countries have become important export and import markets for India. According to Dye (2022), High-level symbolic events and increased the country’s ambassadorial presence have boosted diplomatic ties in statistical terms during the Modi administration. India’s exports to Africa have reached US$ 26045.23 million. Imports of US$ 53531.36 million in 2020, where India’s 9% of exports and 16% of imports have shared with SACU, indicates that SASU is an important trading region for India on the African continent. Multiple negotiations on the India-SACU PTA have been held to strengthen trade ties between India and SACU, with the most recent discussion held in July 2020. However, it has not yet reached a decisive point. Due to concerns about India’s huge non-tariff barriers and the demands of access to our sensitive industries such as textiles and clothing, the discussion is not reaching any significant results (Carim, 2020). The objective of this article is to analyse the trade relationship and tries to find the commodities feasible to export SACU and its member countries. This study focuses on India’s export potential to SACU and its member countries. The article has six sections; the first section introduces research area on the brief. The second section reviews the literature and research gap. The third section is data source and methodology. The fourth section has results and analysis, the fifth section covers effective tariff applied on India’s export by SACU and six section is conclusion. This research article is an early study focused on the trade relationship analysis between India and SACU, as there is a lack of comprehensive research literature on India’s trade relationship with SACU.
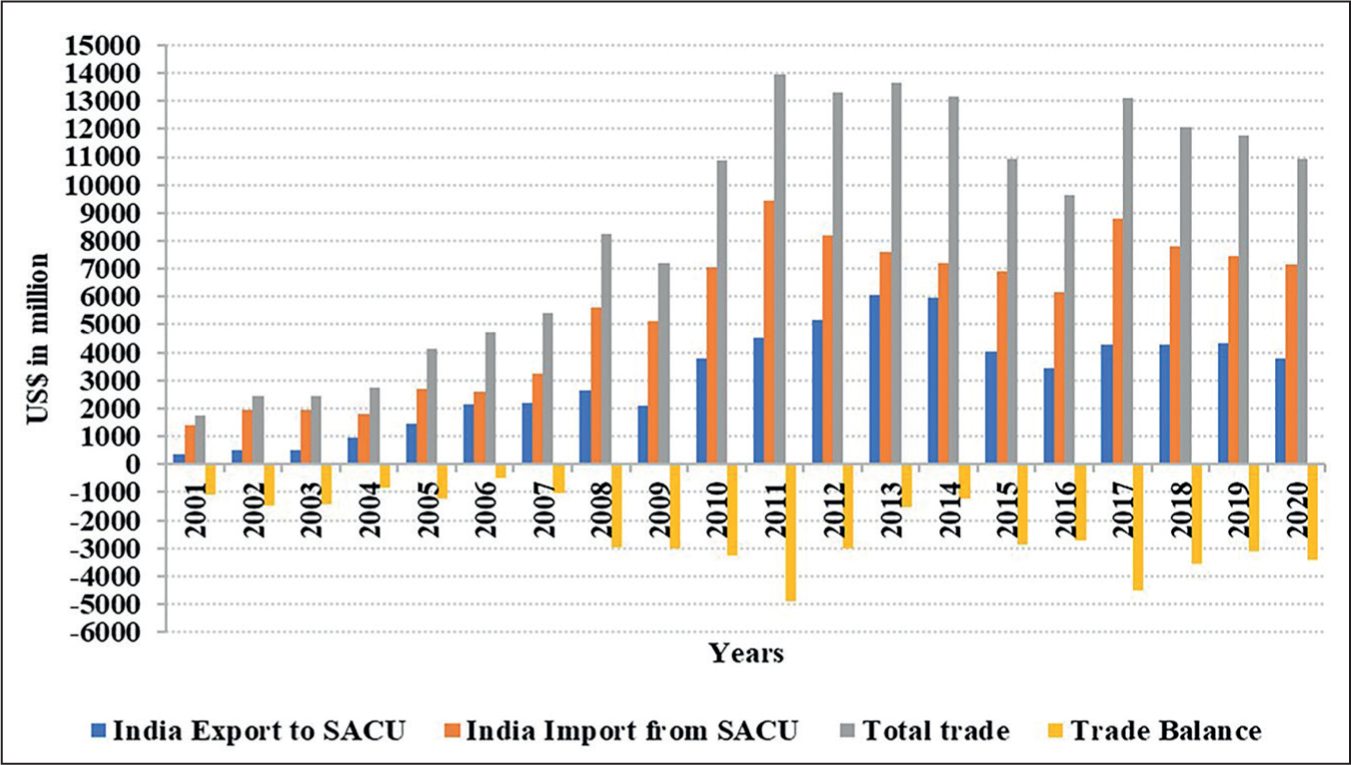
Figure 1 depicts a snapshot of India’s trade relations with SACU from 2001 to 2020. India’s exports to SACU increased from US$ 343.49 million in 2001 to US$ 3760.94 million in 2020, while imports rose from US$ 1,404.03 million in 2001 to US$ 7,180.30 million in 2020. India’s Import and Export Trends with SACU reveal that the country’s foreign trade exposure has expanded exponentially since 2001, with exports increasing around tenfold and imports increasing fivefold. The trade balance between India and SACU has always been in favour of SACU. Figure 1 shows clearly that the increase in commerce between India and SASU from 2001 to 2011 has declined. As the total trade between India and SACU in 2001 was US$1747.52 million, it climbed to US$13976.55 million in 2011 and then decreased to US$10941.24 million in 2020. India’s primary exports to SACU in 2017 were petroleum, petroleum products and related materials (21.7%), road vehicles (20.5%), and pharmaceutical products (15%). India’s leading imports from SACU in 2017 were coal, coke, and briquettes, mostly from South Africa. Non-metallic mineral manufacturers (23.9%) from Botswana and South Africa, gold (16.5%) (An Analysis of Africa and India’s Trade and Investment, 2018). SACU exports primary commodities to India, and India exports manufactured goods to the SACU.
Review of Literature
Kojima (1964) analysed the trade patterns of industrialised nations using the trade intensity index, which is divided into export intensity and import intensity. This trade intensity index is prevalent in trade analysis from the Kojima has developed index use (Alam, 2017; Marukawa, 2021; Raghurampatruni et al., 2021; Sawhney & Kiran, 2019). In Ricardo’s theory of comparative advantage, measurements are attainable if product-wise cost data is available for testing. Balassa (1965) developed a revealed comparative advantage index (RCA) that evaluates export performance as a proxy for comparative advantage. Since then, RCA has become a widely known tool for studying trade and trade policy (Webster, 1991). According to Dalum et al. (1998), most empirical studies use the RCA Index, which was initially developed to examine global trade in-depth but has since been applied to studies of science and technology (S&T) specialisation based on R&D and other bibliometric data. In a working article examining the RCA of India and China, Batra and Khan (2005) concluded that India and China enjoy the greatest advantage in manufacturing, regardless of classification level, with agricultural and related products in the lead. Beyene (2014) examines the trade between sub-Saharan Africa and South Asia. From 1995 to 2010, the RCA of countries in sub-Saharan Africa and Asia went up slightly, but in sub-Saharan Africa, the RCA and growth trends of exports of ores and metals are more robust than in Southern Asia. Wani and Dhami (2014) investigated India’s trade prospects with Brazil using the fifteen-year average of the RCA Index and RID Index from 1995 to 2011. They discovered that India has a comparative advantage in exporting labour-intensive items such as textiles and scale-intensive items such as chemicals, iron and steel. In contrast, Brazil excels in manufacturing instruments, sanitary fittings, and capital-intensive products. Raghurampatruni (2017) applied the RCA Index and RID Index to determine the possibilities for trade between India and certain South African nations. Soko (2006) discusses the India-SACU PTA. They pointed out key problems in promoting trade and investment between the two countries, including tariff and non-tariff barriers, perception gaps, and developing countries’ inconsistent multilevel negotiations. According to Desai (2009), Africa would become an important source of oil, minerals, and other raw materials for India’s growing economy and a potential capital and consumer goods market in developing African countries. Kareem (2016) examines how Africa’s trade agreements with India affect exports. Their findings suggest that Africa’s exports to India have potential and that the Afro-India trade agreements contribute marginally to trade growth, adding that Indian high tariffs have not blocked African exports, but non-tariff barriers are responsible. Raghurampatruni et al. (2021) RCA Index and RID Index examine commerce among SAARC countries. Mukherji (2005) used the PBT equation to assess the potential trade of Bangkok agreement participating states for potential trade analysis. Helmers and Pasteels (2006) apply the PBT equation the subsequent year, although he refers to it as an indicative trade potential equation. Later on, Bano et al. (2013) and Li and Li (2020) used the EBT equation to analyse trade between New Zealand and Asian nations and the trade potential of China and Kenya, respectively.
Research Gape
The SACU is an important region in the African continent. As of now, no detailed research has been found on the trade relations between India and SACU. Most studies focus on the African continent or South Africa, and some selected African countries. This study tries to fill this gap in research and encourage more studies in future on trade between India and SACU.
Data, Data Sources and Methodology
Trade data has been obtained from the International Trade Centre (ITC trade map) database using the HS-2 Digit classification to conduct this study. Tariff data has been collected from the World Integrated Trade Solution (WITS) website. The reason for using ITC trade map data is that The International Trade Centre (ITC) is a multilateral organisation with a mandate shared by the World Trade Organisation (WTO) and the United Nations (UN) through the United Nations Conference on Trade and Development (UNCTAD). It offers annual and monthly export-import data and an interactive data dashboard. It also offers HS-code classification data and is user-friendly. Tariff data is available on the WITS website because it provides tariff data. The study uses a variety of Indexes such as export intensity index (EII), import intensity index (III), RCA Index, Revealed import dependency (RID) Index and Potential bilateral trade (PBT) equation. The EII and III show the intensity of trade between countries, which gives a straightforward understanding of export-import intensity between countries. These goods were matched with the RCA>1 of India and the RID>1 of SACU and member countries to identify the exportable commodities from India to SACU. India has a comparative advantage in exporting these commodities, and partner countries have import dependency on the same commodities, indicating that commodities are suitable for export. In this methodology, only know that a specific commodity is exportable. Nevertheless, the question is, as much as India has export potential and import demand from SACU and member countries, is India taking full advantage of its export potential? A PBT equation has been used to estimate trade potential in terms of value. The PBT assists in determining the entire supply-demand capacities of supplying countries under the most optimistic scenario in which their bilateral supply is attainable. This equation is based on the assumption that the exporting country can fully meet the demand of the target country.
Trade Intensity Index (TII)
The TII gives a direct understanding of the intensity of trade between countries. The trade intensity index is further divided into export and import intensity indices. Kojima (1964) used TII to analyze the trade patterns of advanced countries. Further, Drysdale (1967) used the TII to examine the trade integration of Japan, Australia and New Zealand. In this article, using this TII, the India-SACUbusiness relationship has been analyzed. TII technical details are given:
EII of India with SACU and its member countries

Where EII is the export intensity index of country i to country j, Xij is country i export to country j, Xti total export of country i, Mtj is total imports of country j, Mtw is total world imports and Mti is total import of country i.
Import intensity index (III) of India with SACU and its member countries

Where, III is import intensity index of country i from country j, Mij is country i import from country j, Mti is total import of country i, Xtj is total export of country j, Xtw is Total world Export and Xti is total export of country i.
The TII (EII or III) value is always zero to infinity. If the TII (EII or III) value is zero, no bilateral trade (export or import) occurs. If the value is more than zero but less than one, it indicates that the home country’s trade (export or import) with the partner country is less intense than the rest of the world. Similarly, if the value is more than one, it indicates that the home country’s trade (export or import) with partner countries is more intense than the rest of the world.
RCA Index
Balassa (1965) developed the RCA index, which measures a country’s competitive advantage. It is based on the presumption that a country’s export volume to the world is a key to determining its comparative advantage. A country’s comparative advantage in exports is indicated by the composition of its commodity exports to the world.

Where Xik is the export of the commodity k from country i, Xi is the total exports from the countries i, Xwk is the total exports of the commodity k from the world and Xw is the total exports from the world. RCA’s index, Takes a value between 0 and ∞. A country has a RCA if the value is greater than one. It reflects a country’s comparative export capacity on particular commodities during the reference period.
RID Index
In contrast to RCA, the revealed import dependence (RID) index calculatesthe import dependency of the ith product of nations j. The RID measures acountry’s product import preference, whereas the RCA index focuses on export performance (Getti & Wani, 2019; Raghurampatruni, 2012, 2017; Raghurampatruni et al., 2021; Raghurampatruni & D, 2020; Wani & Dhami, 2014). The Directorate General of Commercial Intelligence and Statistics (DGCI&S) government of India also used the RID index as the Revealed Import inclination index (RIID) in their commercial intelligence report (VIETNAM Country Profile and Trade Aspects, 2019). The RID calculates a country’s share of global product imports by its total global import. Like the RCA index, the RID index >1 reflects a country’s high reliance on importing certain products during the reference period.

RID i k is revealed import dependency of country i on commodity k, Mij is country i’s imports of commodity k, Mit Country i’s total imports, Mwk is total world imports of commodity k and Mtw is total world imports.
RCA ik > 1 and RID jk > = country i (India) has export potential on commodity k and country j (South Africa) has import dependence on commodity k, meaning country i (India) can export commodity k to country j (South Africa).
PBT Estimation
The PBT equation is a method of estimating trade potential. The PBT estimation equation used by Mukherji (2005) was named Indicative Trading Potential by Helmers & Pasteels (2006). In addition, Bano et al. (2013), Alam (2017), Taneja et al. (2020) and Li and & Li (2020) used PBT for international trade potential analysis. The idea of PBT is to evaluate the supply-demand capabilities of the supplying countries under optimal conditions. PBT estimates that exporting countries can target countries in a particular commodity. The PBT of a specific commodity can estimate the export potential to the exporter’s countries in the target country. The PBT equation is as follows-

Where PBT ijk is Potential Bilateral trade of country i to country j of commodity k, Xip is total export of commodity k from country i, Mjk is total import of country j of commodity k and BE = BE ijk is bilateral exports of commodity k from country i to country j.
Empirical Results and Analysis
In this section, the first discussion has been based on the trade intensity index (export intensity and import intensity). Second, the products have been obtained by calculating and matching the RCA and RID index for SACU and its member countries separately. Third, the product obtained for each country’s trade value-wise export potential is calculated using the PBT equation.
EII of India with the SACU and Its Member Countries
The EII shows bilateral trade fluctuations of countries’ exports. India’s EII with the SACU and member countries are calculated for 2001–2020 to observethe trends in the export intensity of India to SACU and its member countries(Figure 2). The trade intensity index of India to SACU is more than one throughout the study period. India’s export intensity to SACU is more intense than the rest of the world. However, the EII fluctuation shows over the period, but it is not much. The EII had the lowest point of 1.56 in 2002, which increased to the highest point of 2.79 in 2020. India’s EII with South Africa is almost parallel with SACU. However, it is more than SACU throughout the study period. The EII with South Africa stood at a low of 1.93 in 2003, rose to a high endpoint of 3.47 in 2014, and is at 3.45 in 2020. The trend line of India’s EII to SACU and South Africa is climbing, indicating a growth in exports. The export intensity to Botswana was less than one from 2001 to 2017, which indicates that export intensity had been less intense than in the rest of the world. First-time trade intensity showed at 1.06 points in 2017; further, it increased to 1.72 points in 2019 and 1.45 points in 2020, which indicates that India’s export intensity to Botswana was less intense until 2017; after that, the intensity increased. Only in 2008 and 2013 were India’s EII to Namibia more than one. Indicating that Namibia has trade potential to increase exports for India, although Namibia is a small economy and India cannot raise their export until demand rises sufficiently. It is noteworthy that India will become Namibia’s 6th number import partner in 2020.
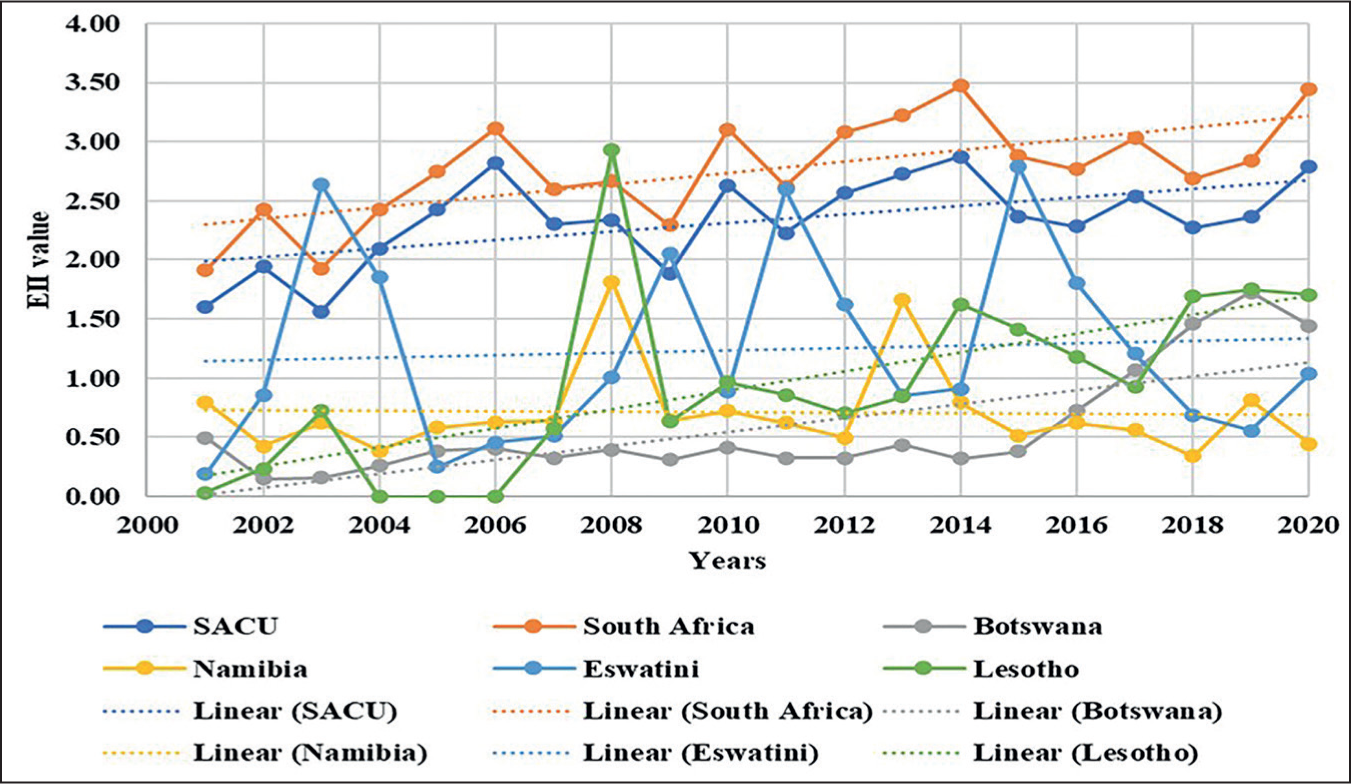
India’s EII to Lesotho and Eswatini fluctuated throughout the study period. Although the EII for Lesotho was greater than one only once between 2001 and 2014, it has been below one since 2014. Also, the EII is a trendline moving in an uptrend. This situation suggests that Lesotho is important in India’s exports to the SACU region. Eswatini, like Lesotho, has several swings, and the EII is frequently greater than one. However, it has usually been less than one. Thus, India’s EII, South Africa, and SACU have been more than once throughout the study period. Also, India’s EII with Botswana and Lesotho has been more than one recently, which shows the increasing export potential in these two countries.
Import Intensity Index of India with the SACU andIts Member Countries
India’s import intensity index for SACU is almost along with South Africa throughout the study period, at least until 2014 (see Figure 3). After that, we see a slight divergence. Because of India, most of the import commodities come from South Africa, and South Africa is dominant in SACU, so it is evident that South Africa and SACU trade intensity will go along with each other. India’s III was the highest, with SACU and South Africa at 7.5 points in 2002. Those declined and remained at 3.19 for SACU and 3.45 for South Africa in 2020. The trend line of III shows a negative direction, indicating that the import dependency from South Africa and the SACU has gone downward. India’s imports are less intense than the rest of the world.
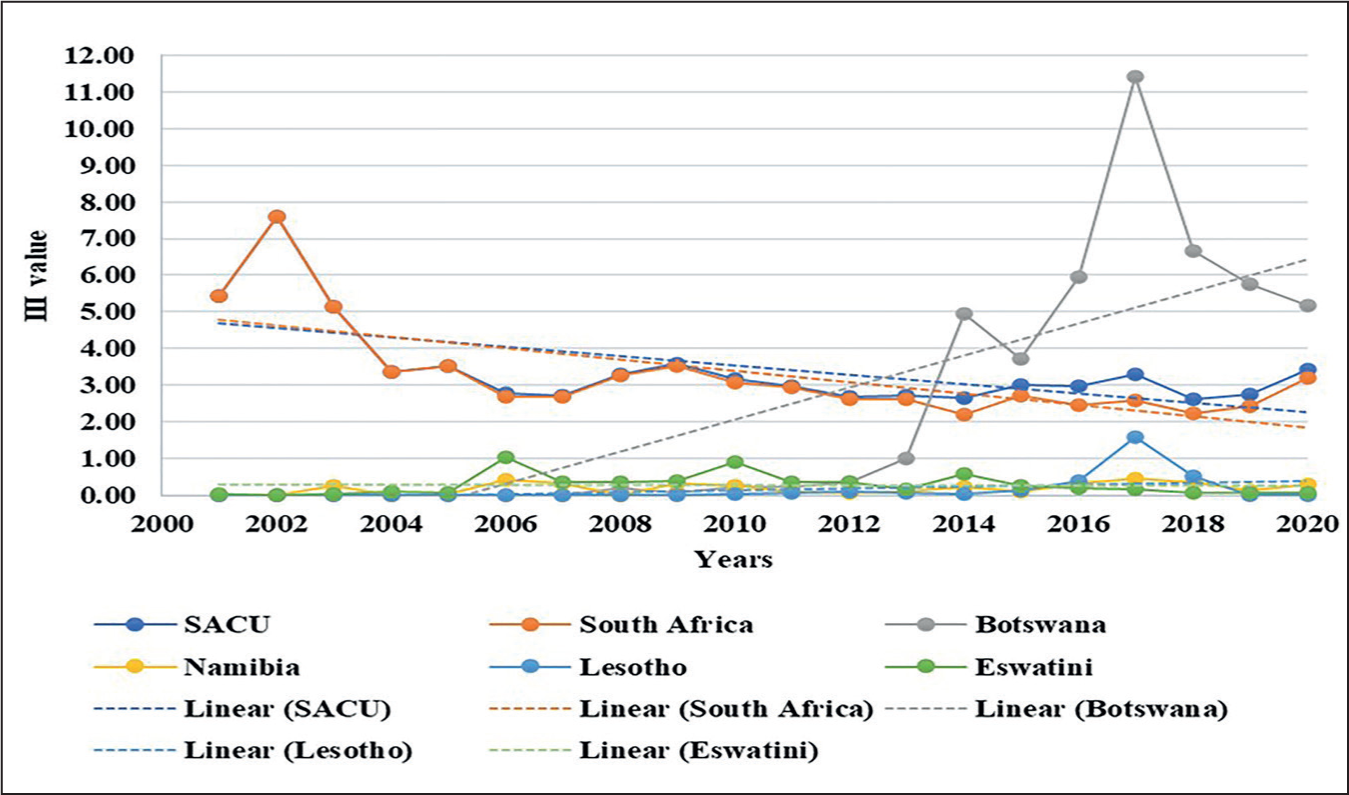
Whereas India’s III to Botswana was less than one until 2013, India started importing natural minerals resources (HS-71) from Botswana. The import intensity index to Botswana increased from 1.00 in 2013 to 11.40 in 2017; however, it declined to 5.15 in 2020. These indicate the increasing importance of India’s imports from Botswana in SACU. India’s import intensity index in Botswana, Namibia and Eswatini has been less than one throughout the study period; that is, the intensity of India’s imports from these countries is less than that of the world. There is every possibility in India that exports can be increased in these countries. India’s III with Lesotho also remained more minuscule than once during the entire study period except in 2017. India’s Import Intensity Index is higher than South Africa’s and has more than one value. However, there had been a significant decline in 2020 compared to 2003. Since South Africa is the largest country in SACU, the Import Intensity Index remained roughly the same until 3013. After, there was a slight deviation, as Botswana is emerging as a new import partner of India in this region. India imports relatively less from countries other than South Africa and Botswana in the entire SACU. The effect of which is visible in the Import Intensity Index
Analysis of India’s Export Potential to SACU and Its MemberCountries by RCA Index and RID Index
The RCA and RID have been calculated for the 11 years from 2010 to 2020. The average value is presented to examine the commodities trade between India, SACU and its member countries. The average value is to smooth yearly fluctuation in exports and imports. Different scholars have used the averaging of RCA and RID for different periods in their studies (Ahuja, 2020; Bender & Li, 2002; Bhattacharya & Singh, 2021; Raghurampatruni, 2012; Wani & Dhami, 2014). Table 1 depicts the matching product-wise (HS-2 digit) India’s RCA>1 and SACU and its member countries’ RID>1. As RCA theory states, India has a comparative advantage on those products. In the same way, RID states that this product has import dependency by respective countries, which means that products are perfectlysuitable for export. For these matched products, we calculated PBT to estimate the export potential value. The India export potential to SCU using the PBT equation has been calculated using 2019 trade data, although 2020 data is also available. However, due to COVID-19, there was a significant irregularity in international trade in 2020; it would not be appropriate to analyse based on 2020 data.
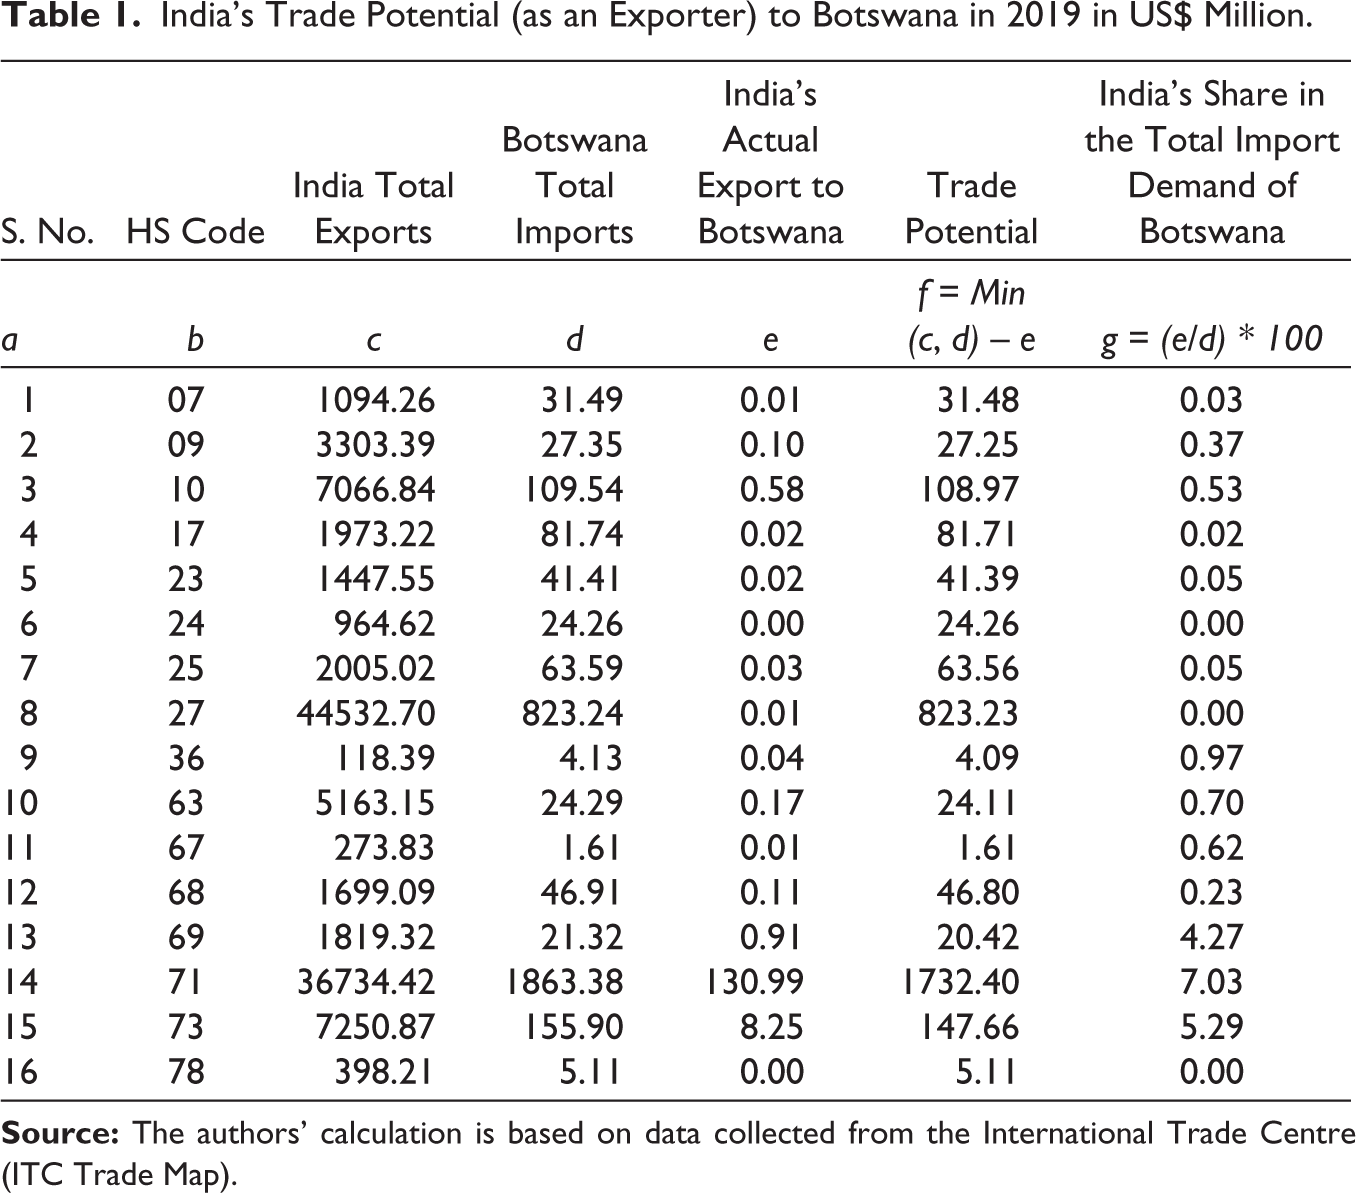
India’s Trade Potential (as an Exporter) to Botswana in 2019 in US$ Million.
The Export Potential of India to SACU
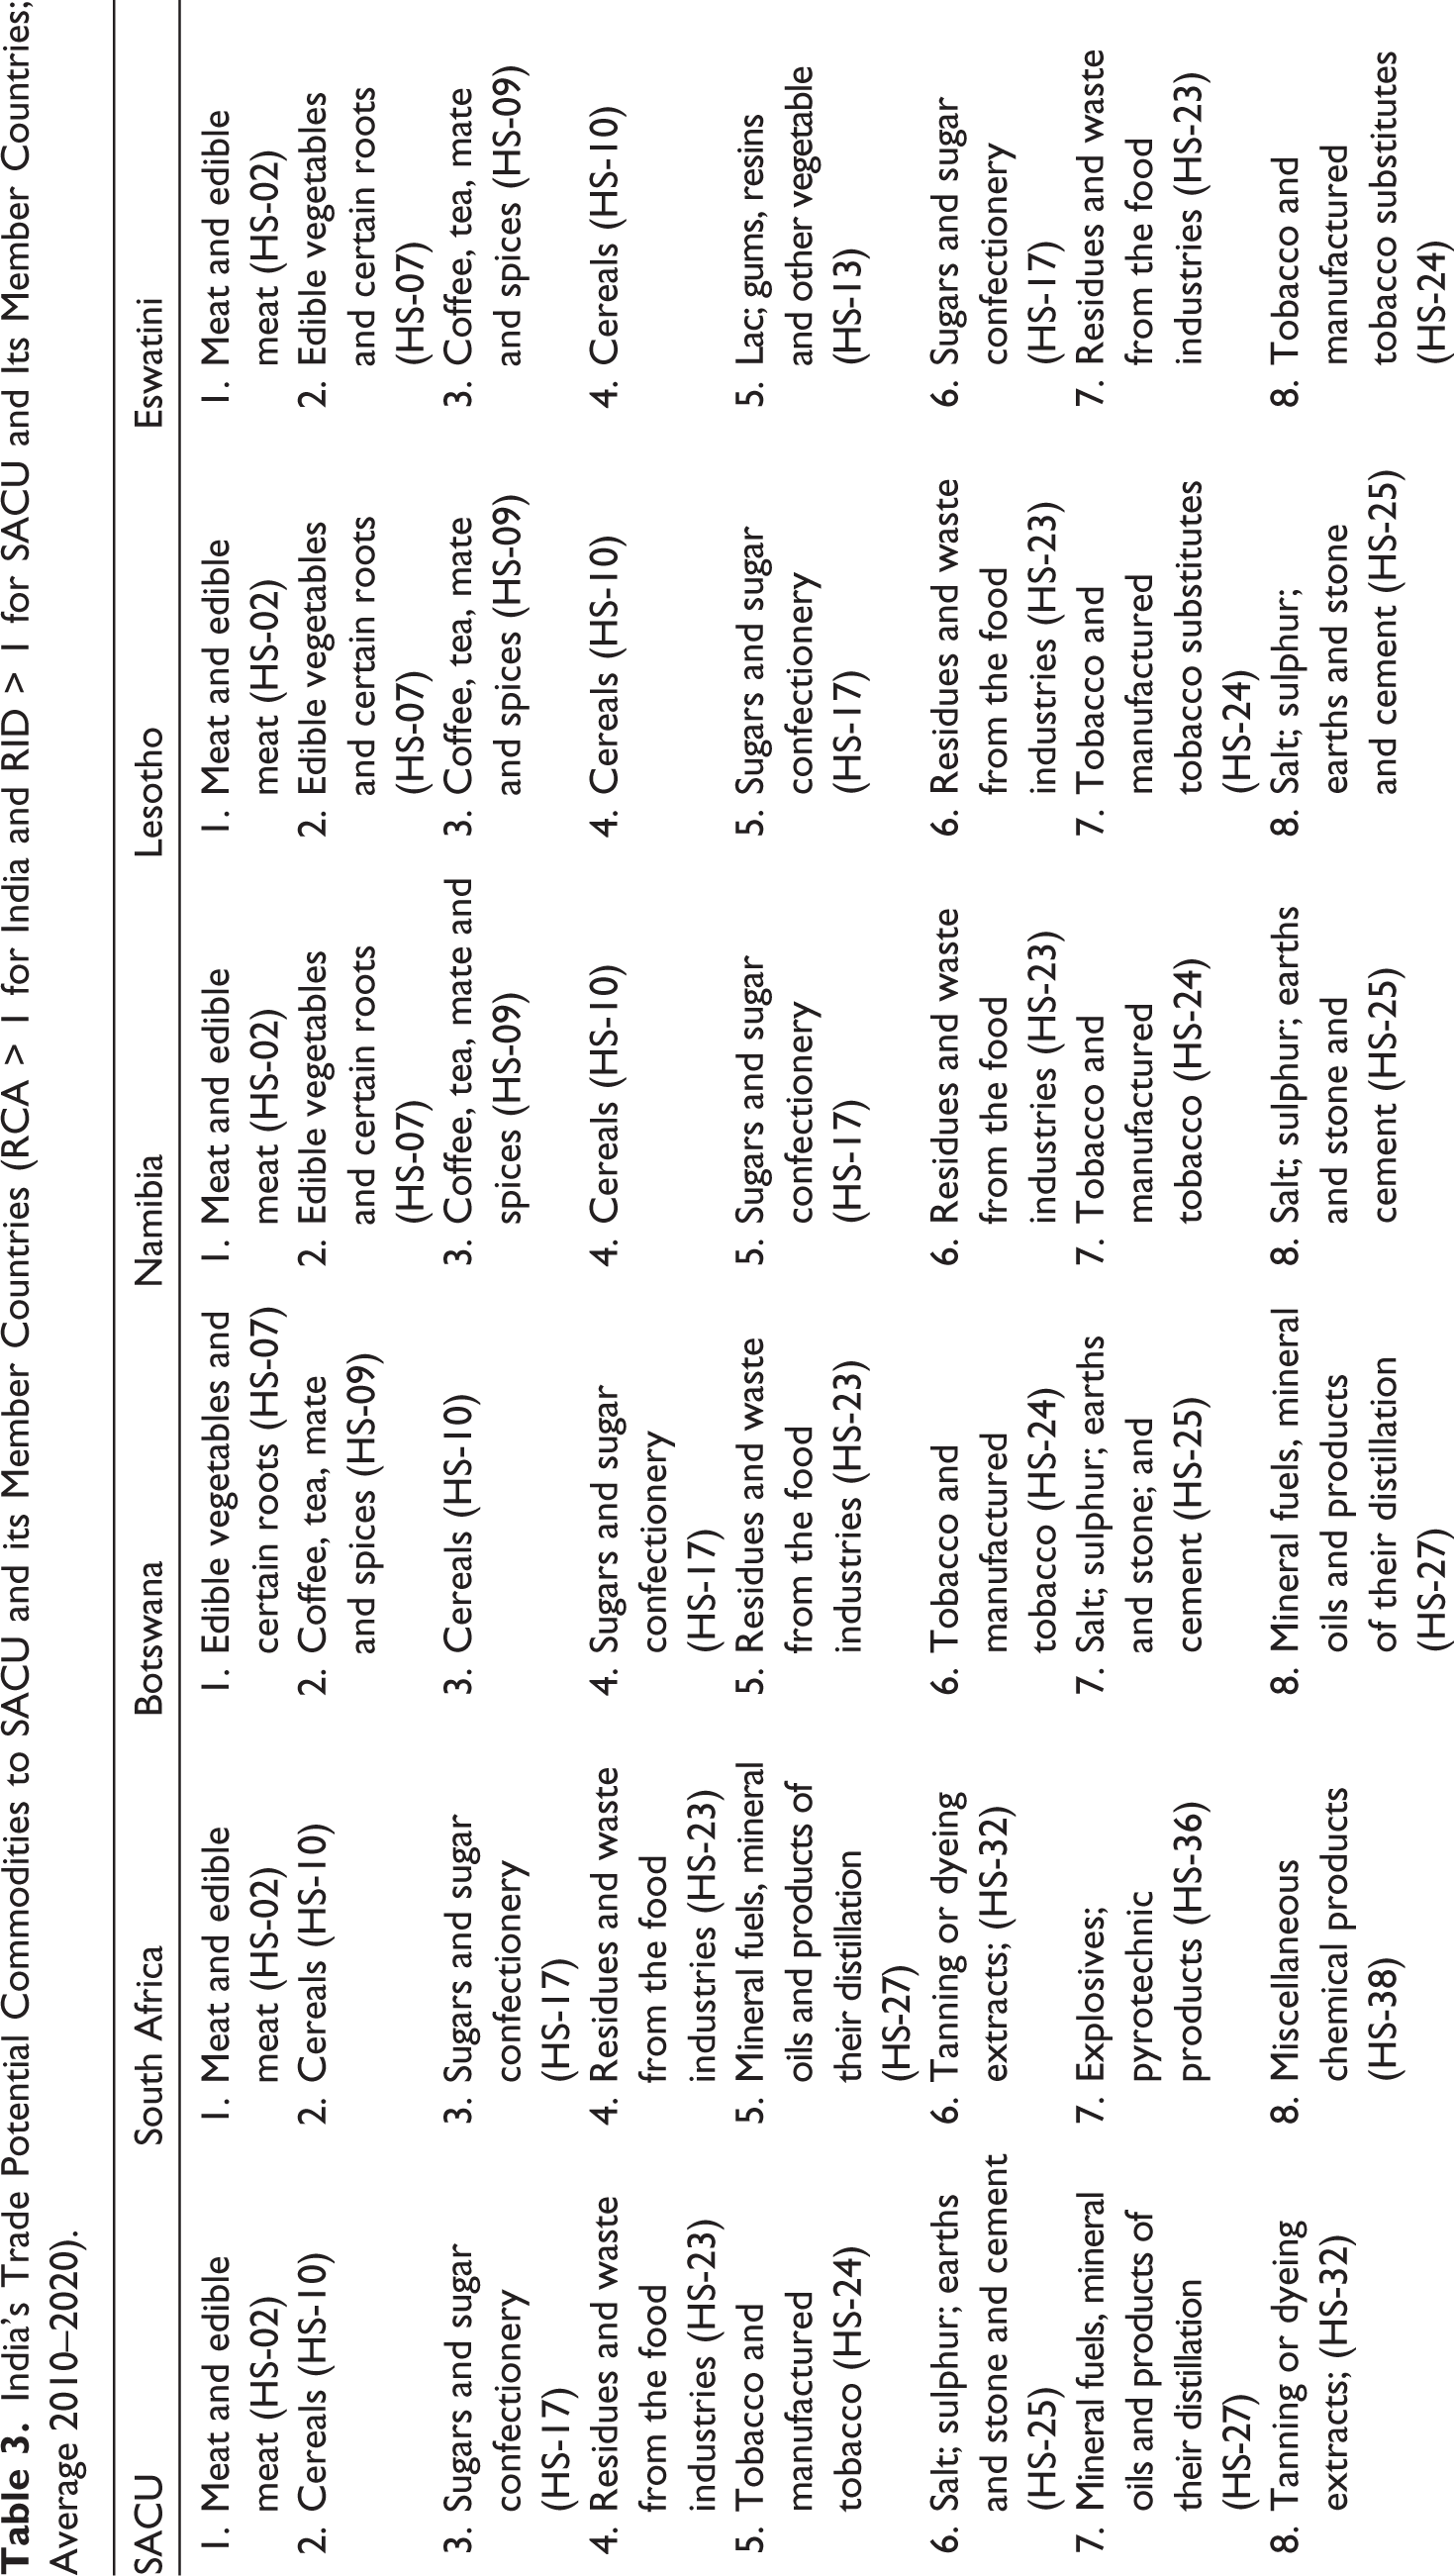
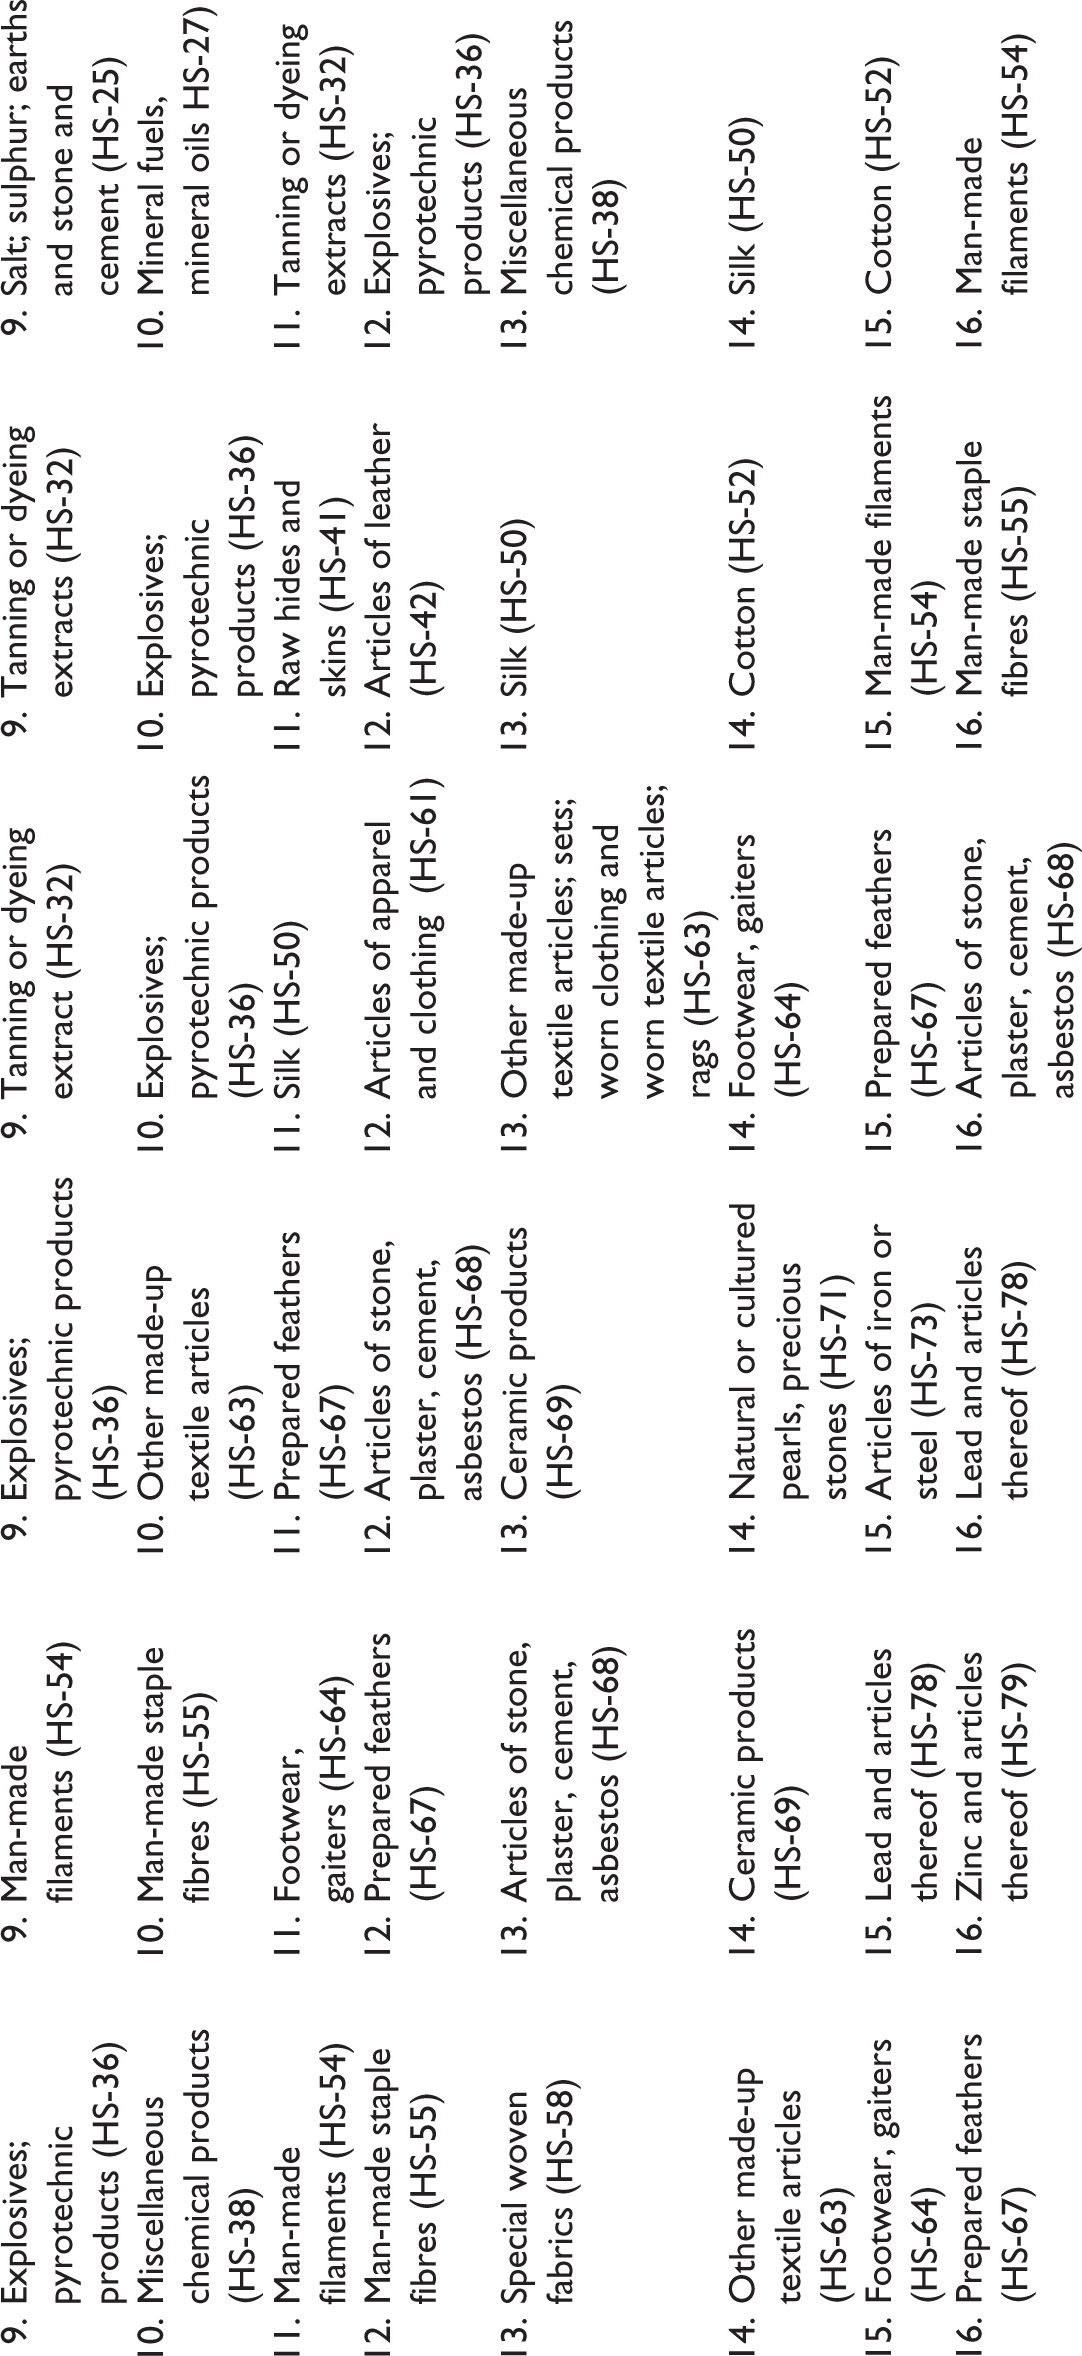
When the RCA of India is matched with the RID of SACU, it is revealed that a total of 20 commodities are feasible for India to export the SACU (see Table 2). The 20 commodities are Meat and edible meat (HS-2), Cereals (HS-10), Sugars and sugar confectionery (HS-17), Residues and waste from the food industries (HS-23), Tobacco and manufactured tobacco (HS-24), Salt; sulphur; earths and stone and cement (HS-25), Mineral fuels, mineral oils and products of their distillation (HS-27), Tanning or dyeing extracts; (HS-32), Explosives; pyrotechnic products (HS-36), Miscellaneous chemical products (HS-38), Man-made filaments (HS-54), Man-made filaments (HS-54), Man-made staple fibres(HS-55), special woven fabrics (HS-58), Other made-up textile articles (HS-63), Footwear, gaiters (HS-64), Prepared feathers (HS-67), Articles of stone, plaster, cement, asbestos (HS-68), Ceramic products (HS-69), Copper and articles thereof (HS-74) and Zinc and articles thereof (HS-79). All these twenty commodities have India’s comparative advantage in export or production, and at the same time, SACU has import dependency. For these twenty products, we estimate PBT. The PBT estimation estimates trade potential as exporter countries, which means products for which India has RCA>1 and SACU RID>, India has export potential to SACU. Since the exports of the goods estimated by RCA and RID are taking place now, further calculated India’s share in the total Import demand of SACU. The PBT has been calculated in Table 2. The export potential of sixteen commodities has been estimated through RCA and RID analysis. Its potential export value has been estimated with the help of the PBT equation. Table 3 shows that Mineral fuels, mineral oils and products of their distillation (HS-27) have a value of export potential of 16528.38 million USD, the highest among them. The second commodity is Miscellaneous chemical products (HS-38), with an export potential of US$ 1683.53 million. For these two products, India’s share in the total Import demand of SACU is 2.95% (HS-27) and 4.76% (HS-38) in 2019, which can increase further if India pays attention to this product’s export promotion. Apart from this, the potential export value of other products has also been given, in some of which India currently holds a more than 10% share in total imports of SACU. Since the PBT assumes that the exporting country’s export supply can completely fulfil the total import demand of the target country, it would not be right to make such an assumption. Therefore, it would be logical to assume that, among other products, India’s exports can contribute at least 10% of SACU’s total imports.
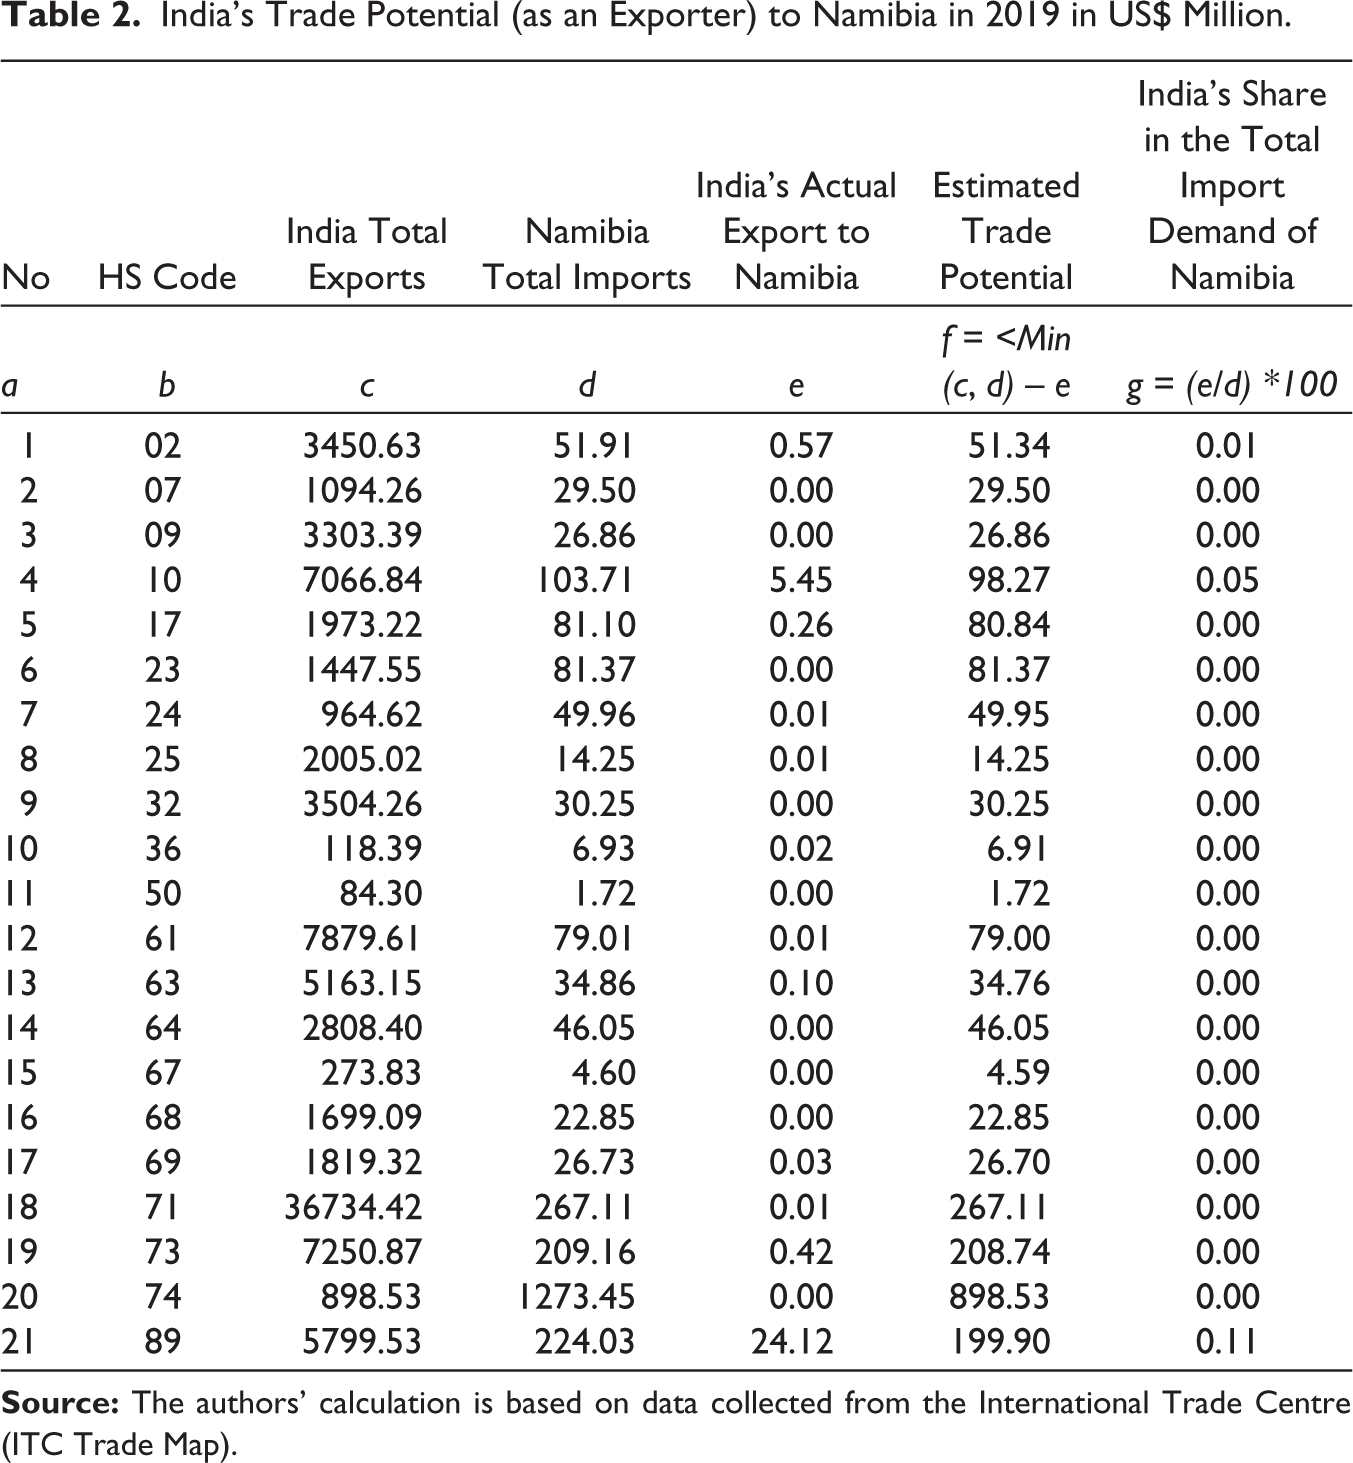
India’s Trade Potential (as an Exporter) to Namibia in 2019 in US$ Million.
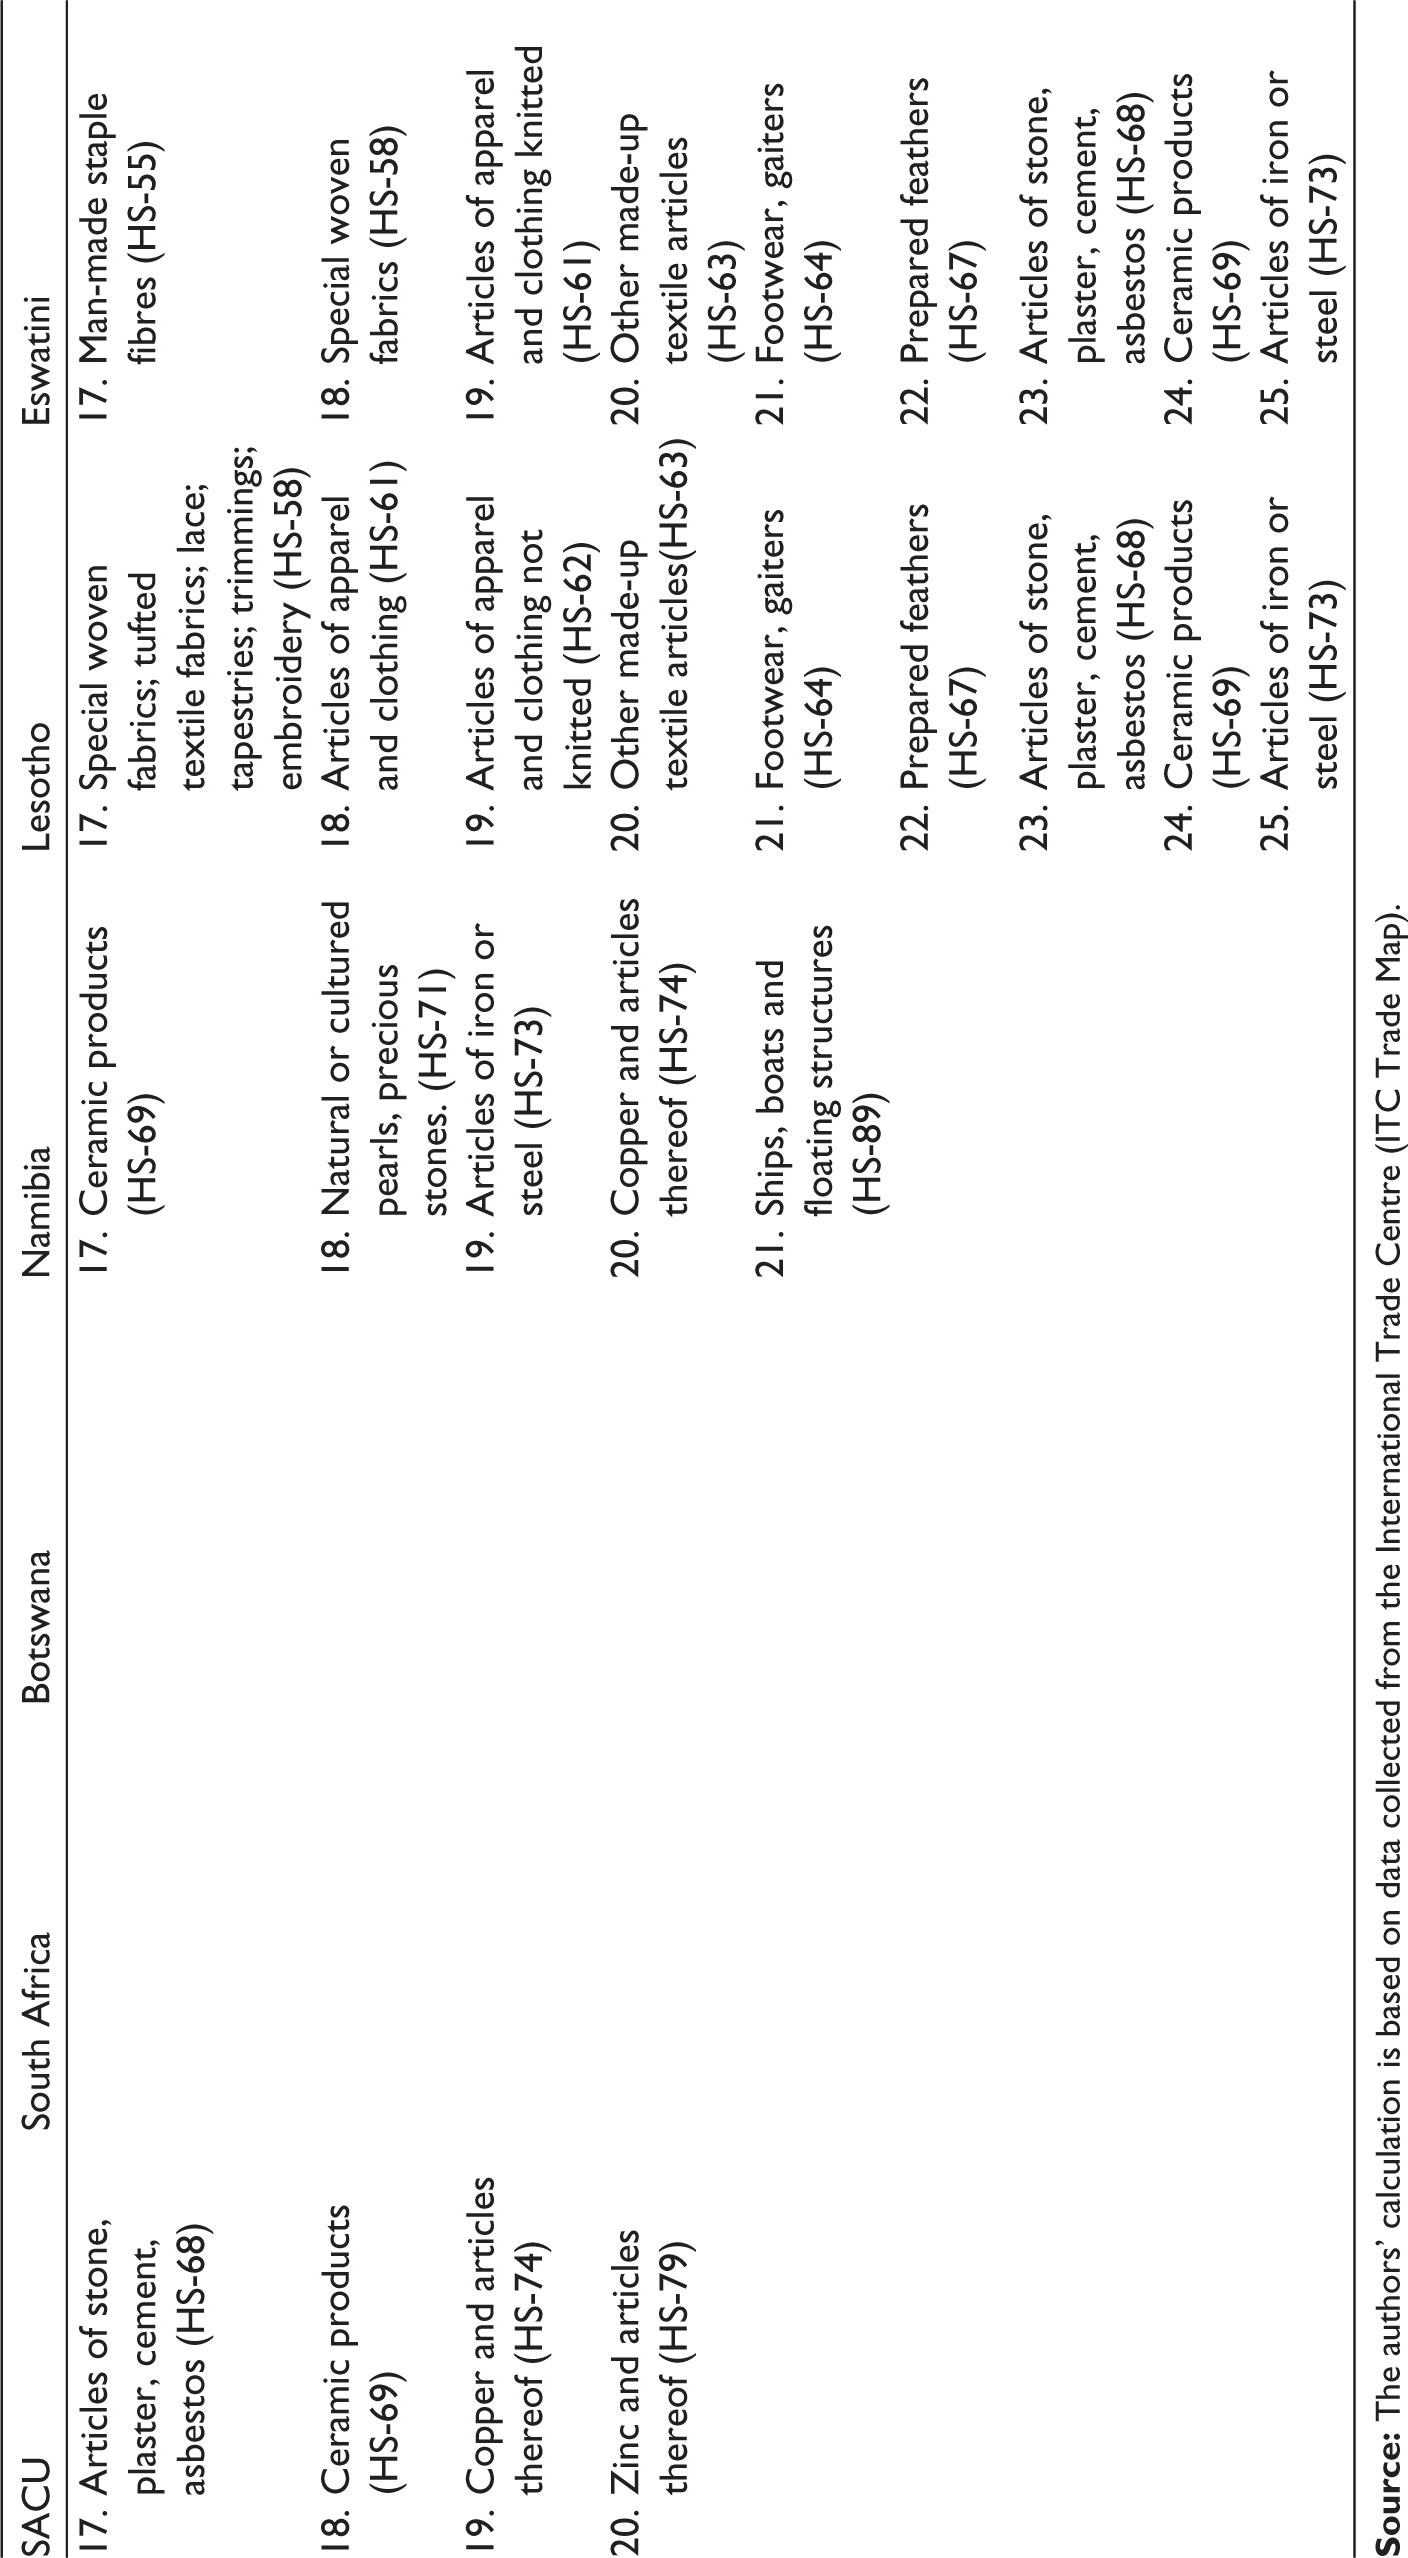
India’s Trade Potential Commodities to SACU and its Member Countries (RCA > 1 for India and RID > 1 for SACU and Its Member Countries; Average 2010–2020).
Next, we evaluated India’s RCA>1 with RID>1 SACU member country and calculated PBT.
The Export Potential of India to South Africa
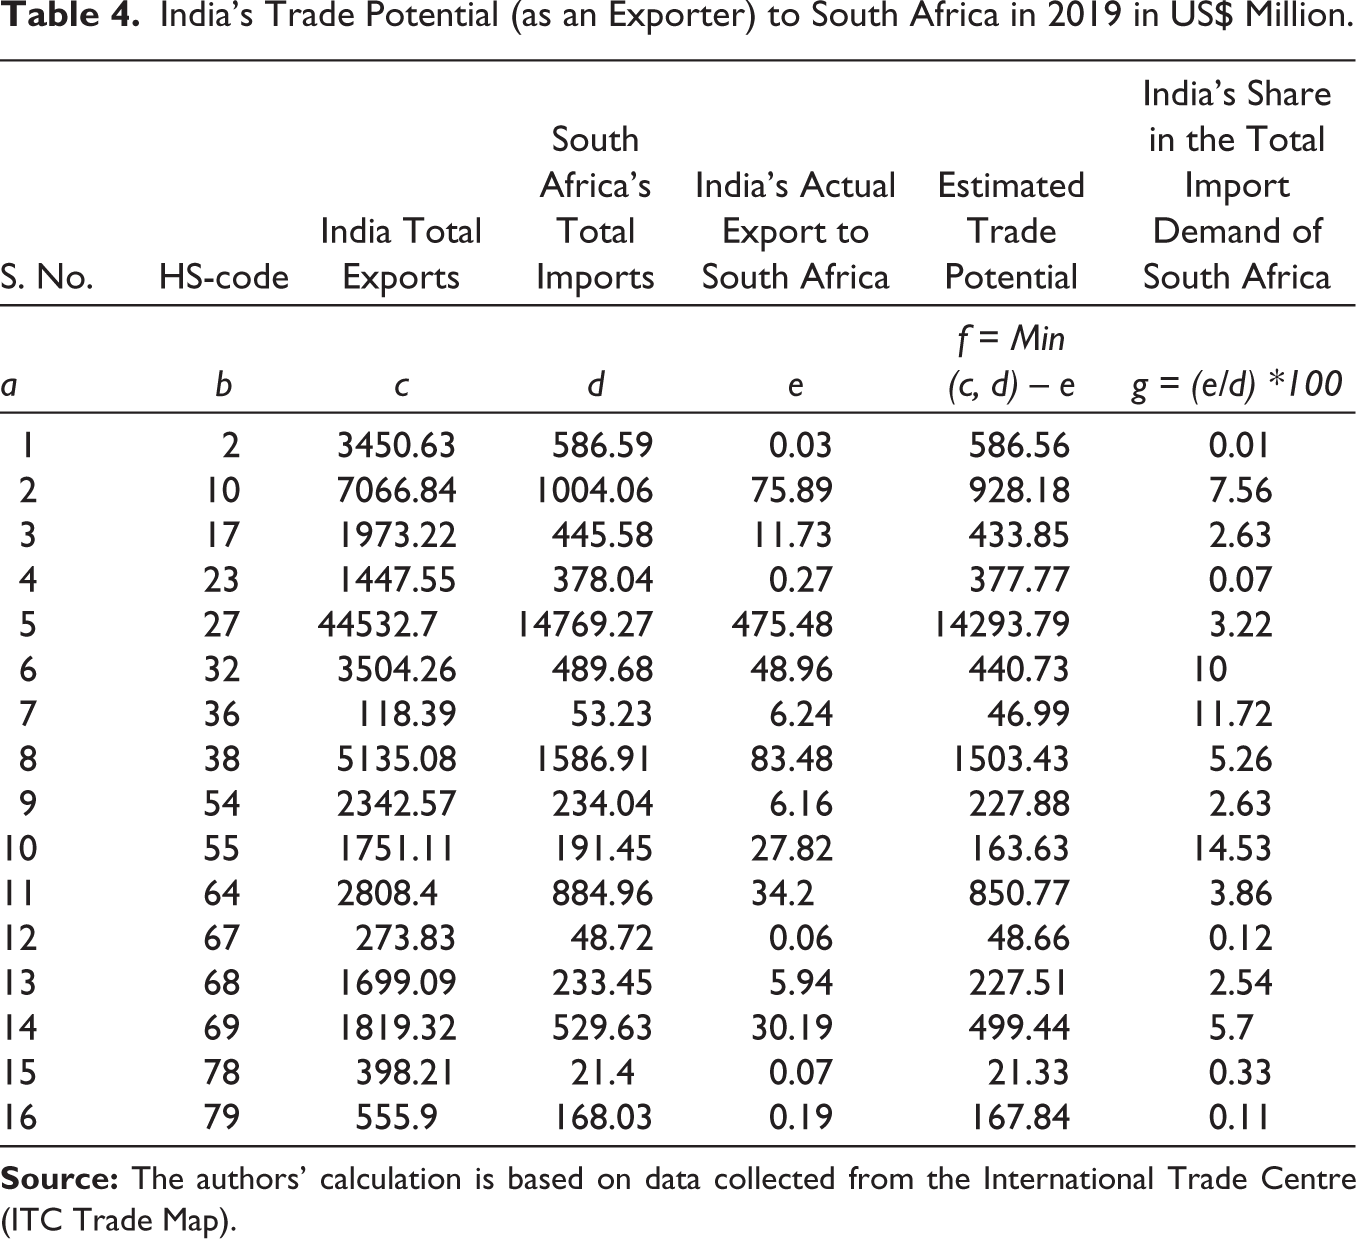
The RCA of India matched with the RID of South Africa; it is found that 16 commodities are feasible for export to South Africa (see Table 1, Column b). Furthermore, the PBT estimation was calculated (Table 4). Reveals that in all these 16 commodities, Mineral fuels, mineral oils, and products of their distillation(HS-27) have an export potential of US$ 14293.79 million, which is the highest value among them. India has an export share of 3.22% of South Africa’s total imports in these commodities in 2019. in commodities Man-made staple fibres (HS-55), Explosives; pyrotechnic products (HS-36) and Tanning or dyeing extracts (HS-32). India holds more than a 10% export share of South Africa’s total imports. Table 2 shows many commodities have export potential, but at the current time, India’s export covers less than 1% of import demand. India needs to focus on those commodities for export promotion.
India’s Trade Potential (as an Exporter) to South Africa in 2019 in US$ Million.
The Export Potential of India to Botswana
There are estimated to be six exportable commodities to Botswana. Its estimated PBT is presented in Table 1. Table 1 depicts clearly that Natural or cultured pearls, precious stones, mineral fuels, mineral oils, and products of their distillation (HS-71), and Mineral fuels, mineral oils, and products of their distillation (HS-27), respectively, have an export potential of US$ 1732.40 million and US$ 823.23 million. Even though India has a 7.3% share of the export market for natural or cultured pearls and precious stones (HS-71), it has an almost negligible share of the market for mineral fuels, mineral oils, and products made from them (HS-27). India’s export market for other commodities is almost non-existent, which shows the size of the potential export market.
The Export Potential of India to Namibia
Twenty commodities have been estimated to be exportable to Namibia. Its PBT estimate is given in Table 2. Copper and articles thereof (HS-74), Natural or cultured pearls and precious stones (HS-71) have a maximum export potential of US$ 898.53 million and US$ 267.11 million, respectively. In contrast, India has an almost negligible export market share of these commodities of Namibia’s total imports.
The Export Potential of India to Lesotho and Eswatini
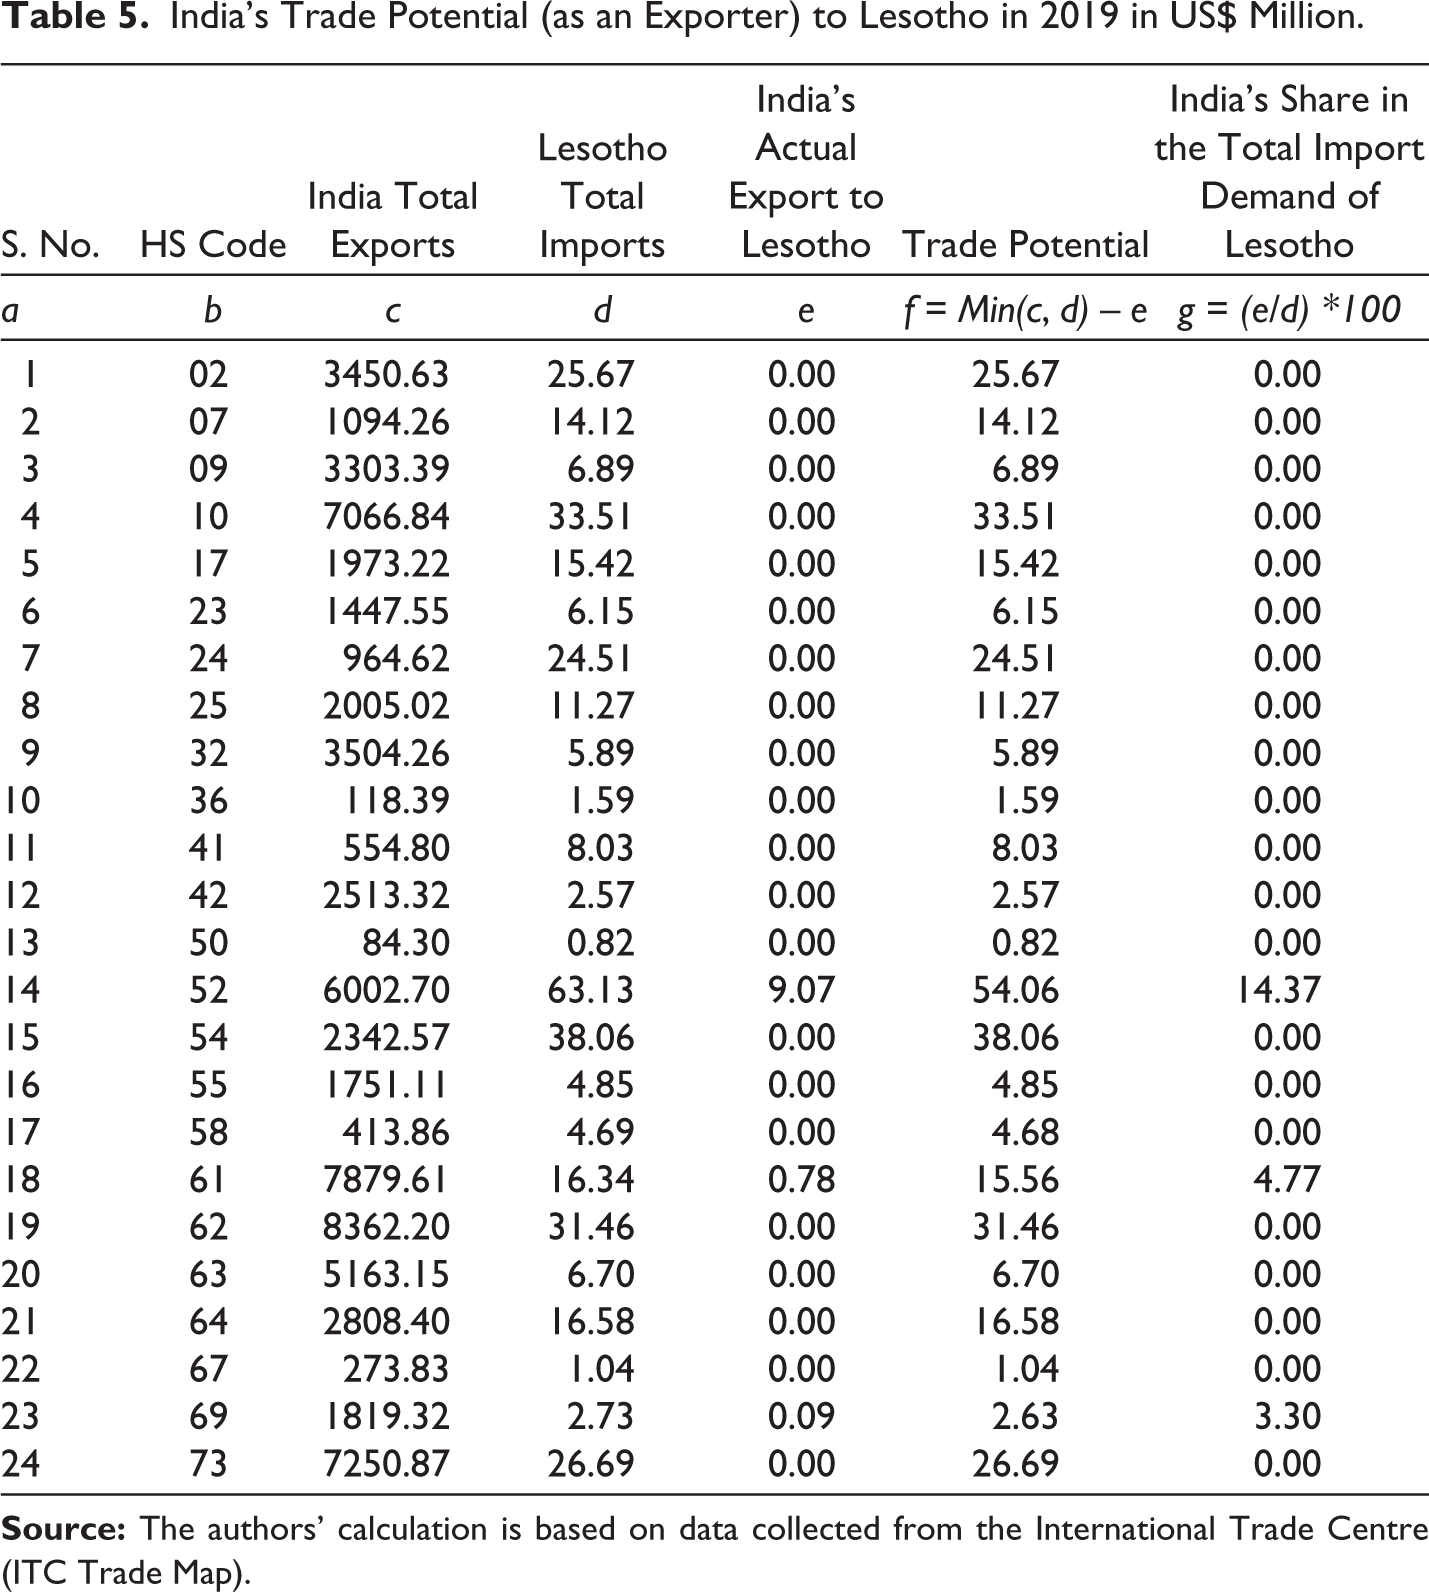
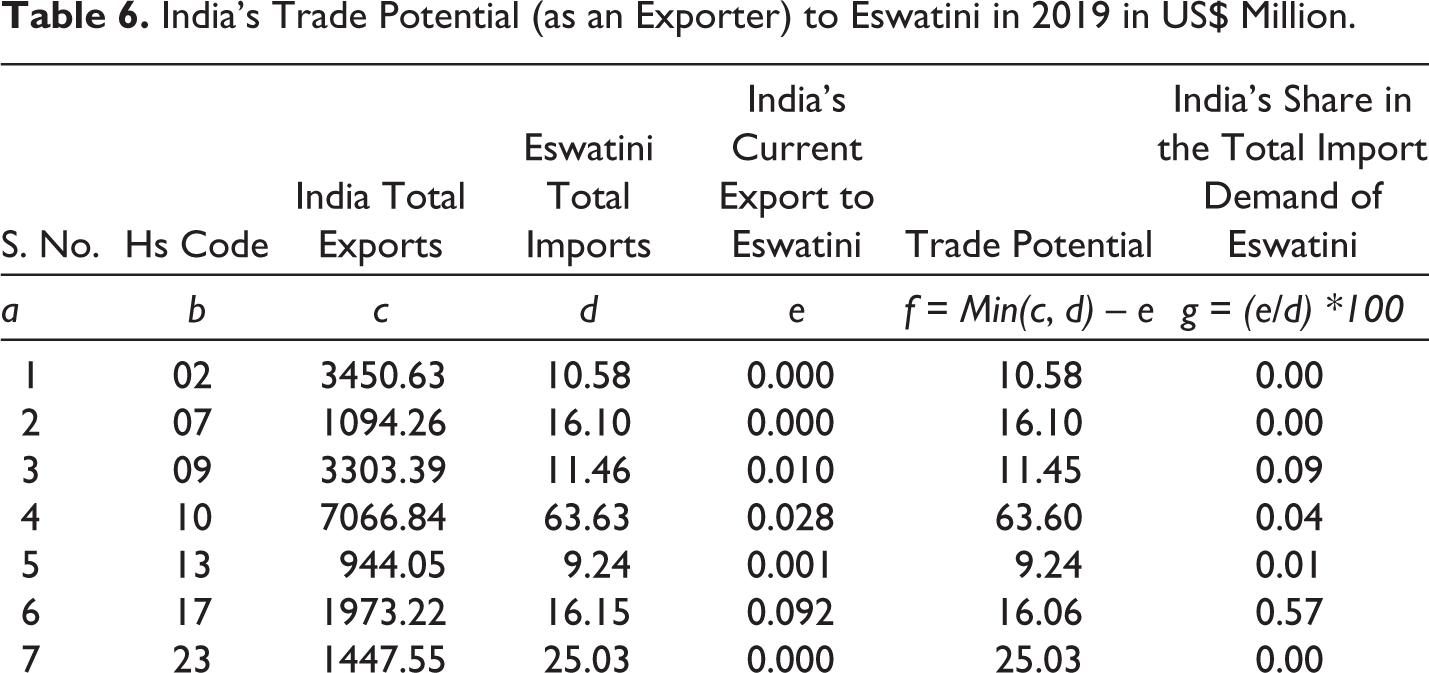
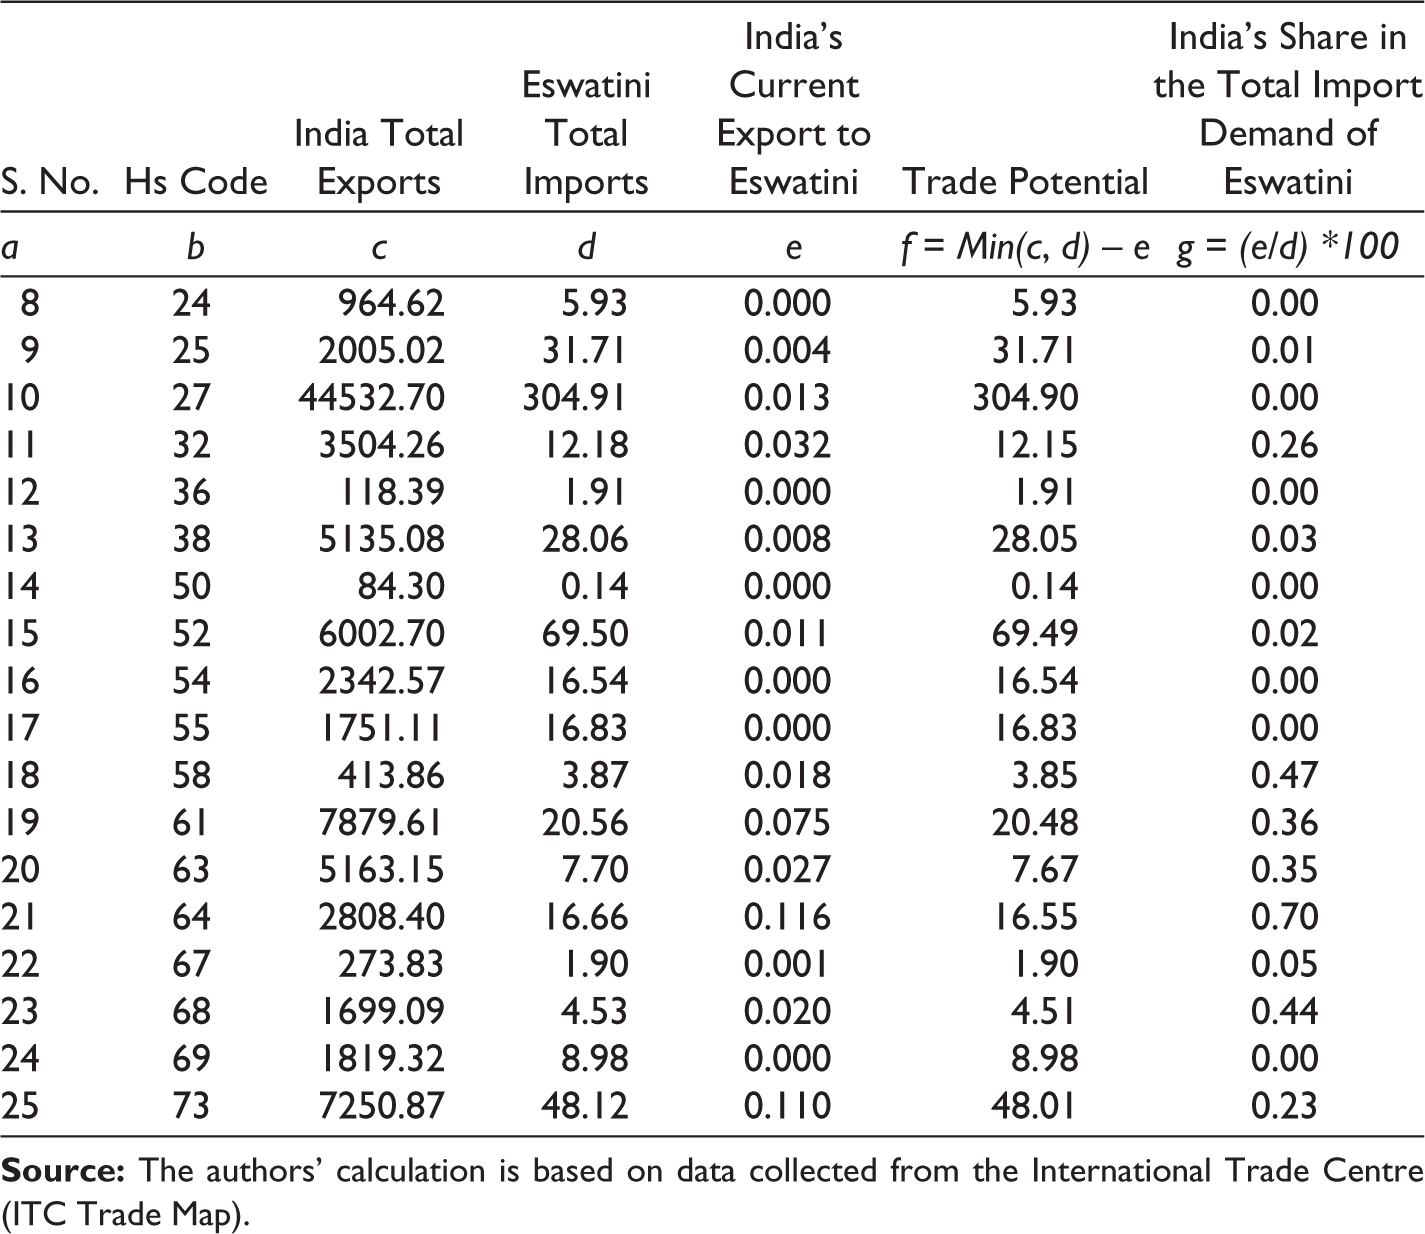
The potential export of India to Eswatini and Lesotho has 25–25 commodities (see Table 5). Exports to Lesotho had the highest value estimated by the PBT equation at US$ 54.06 million in cotton (HS-52). India exported 14% of the total cotton demand of Lesotho in 2019. In addition to Articles of apparel and clothing (HS-61), the export potential is US$ 15.56 million, of which India’s export has a 4.77% share of the total import demand of Lesotho (see Table 6). Mineral Fuels and Mineral Oils (HS-27) have the most considerable estimated export potential of US$ 304.90 million for India to Eswatini, which has a negligible export share. Table 7 shows the estimated export potential of other commodities to Eswatini. In most instances, India does not represent even 1% of Eswatini’s total imports by exports.
India’s Trade Potential (as an Exporter) to Lesotho in 2019 in US$ Million.
India’s Trade Potential (as an Exporter) to Eswatini in 2019 in US$ Million.
Effectively Applied Tariff (%) on SACU’s Imports from India in 2019.
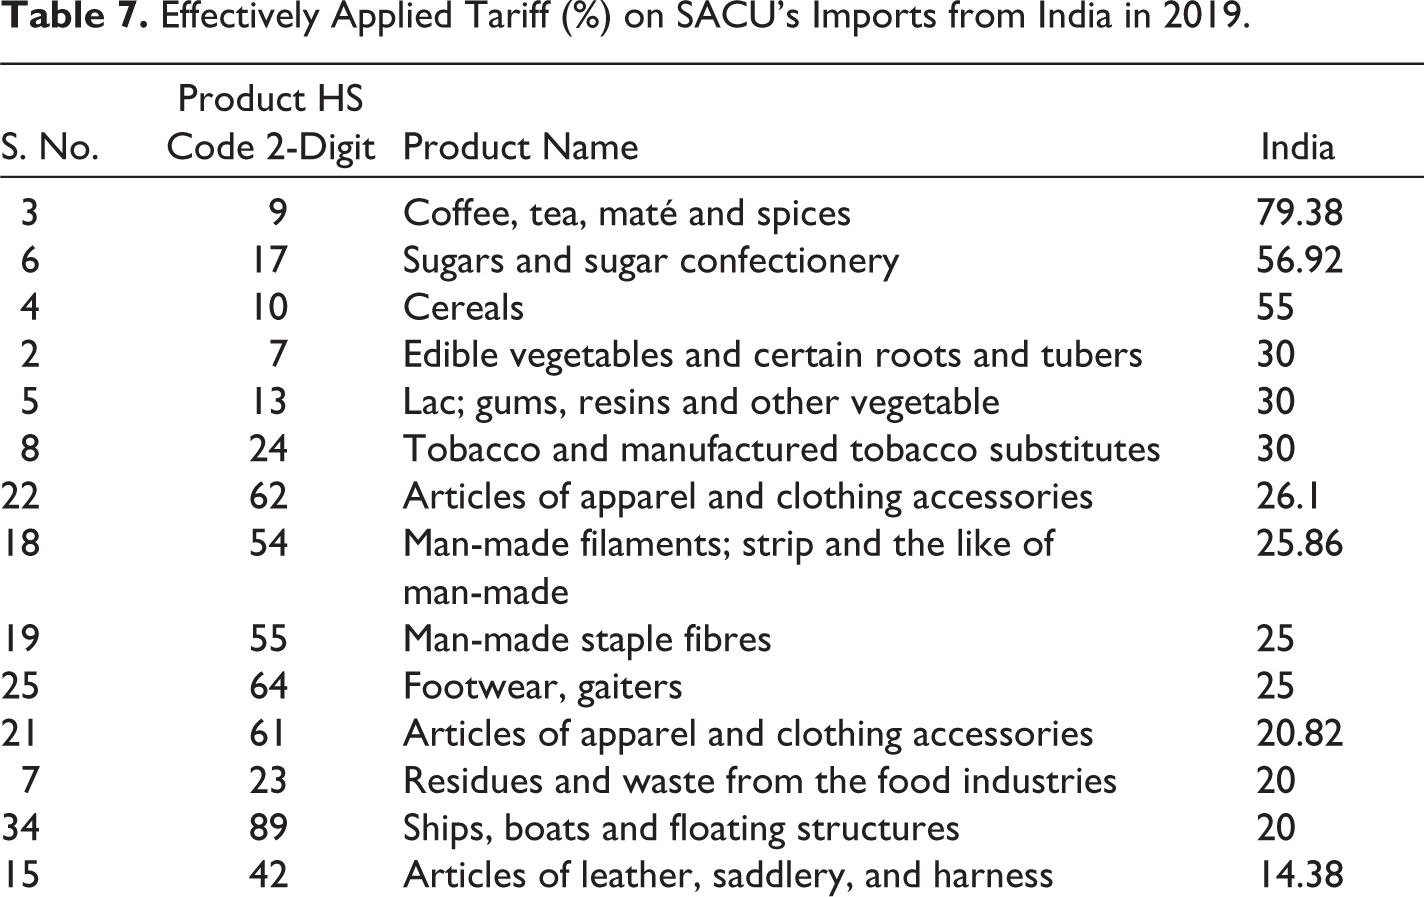
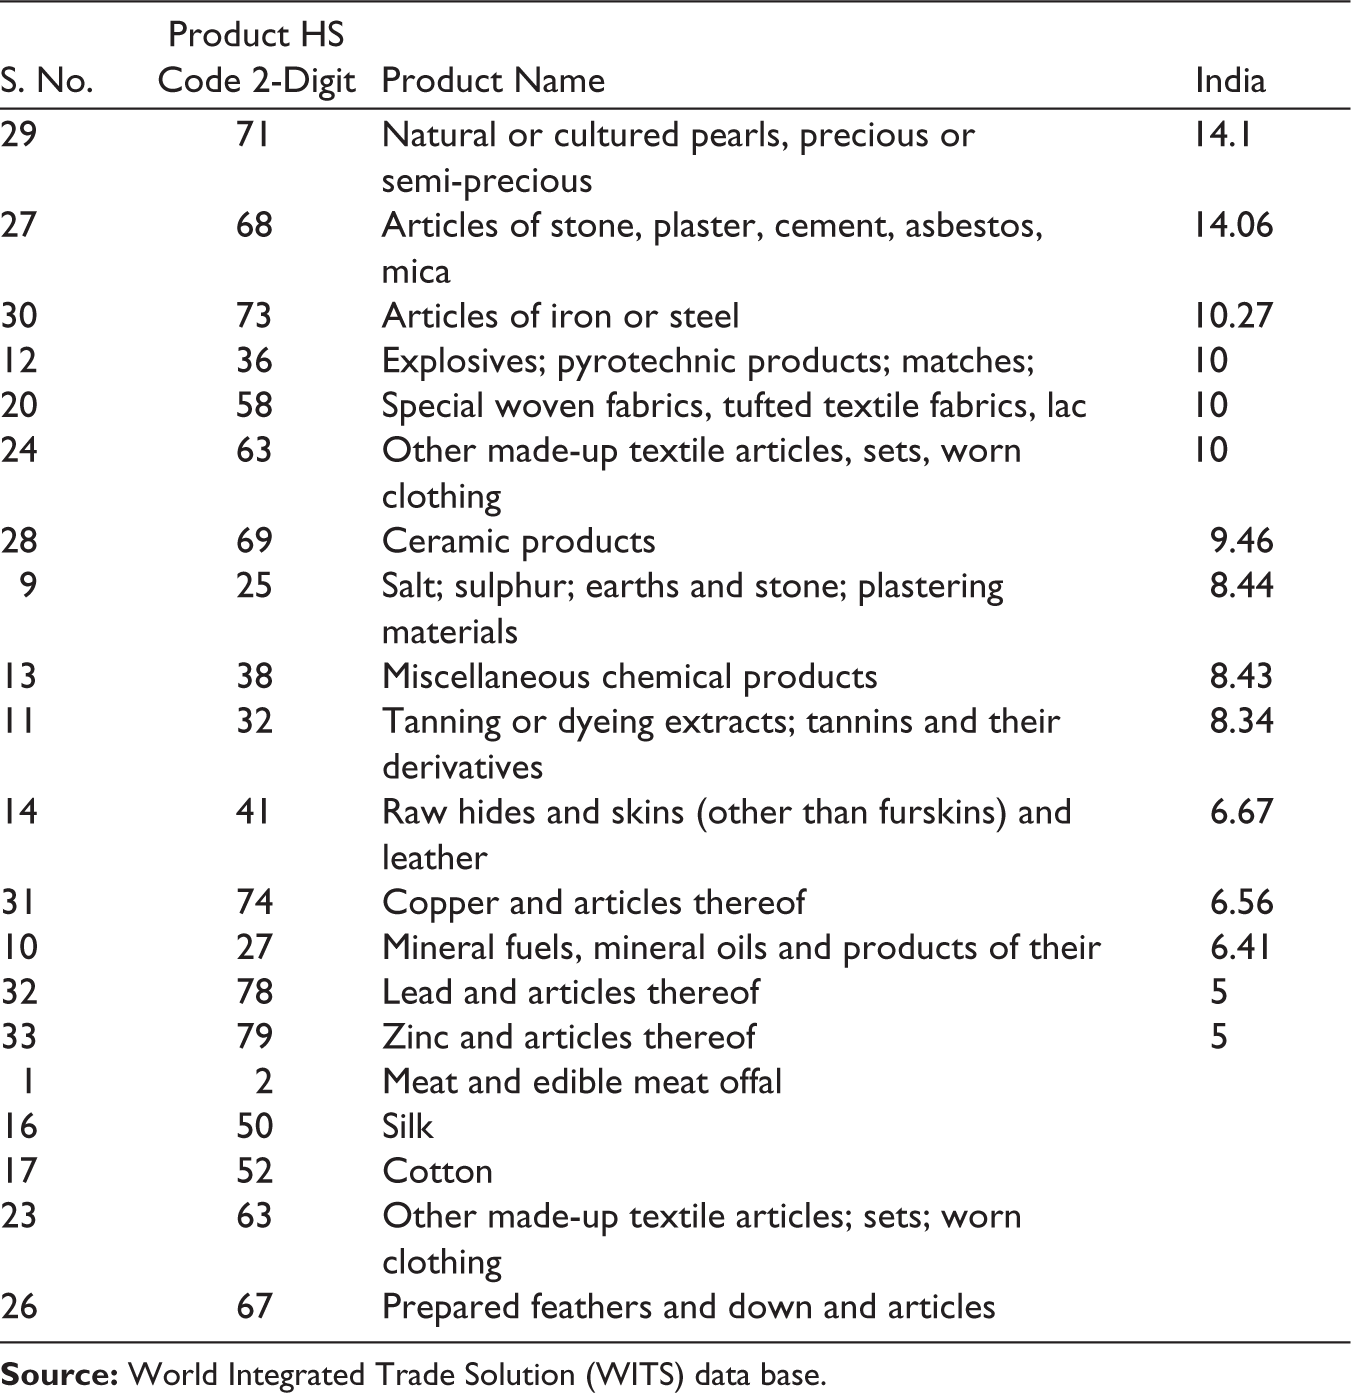
SACU’s Effectively Applied Tariff on Imports from India
This section elucidates upon the effectively applied tariff imposed by SACU on India’s exports. If the rate of tariff partner country is high, then it adversely affects imports. The assessment incorporates tariff data on 2-digit HS codes using wits data on the WITS website. Tariff is an essential element in a country’s export to a region. Since there is no preferential agreement currently between India and SACU, the effectively applied tariff on SACU is the same as the MFN tariffs. The member countries of the SACU possess a unified customs territory wherein the imposition of customs duties between them is absent. The member countries of the SACU implement a common external tariff (CET) to regulate and impose uniform tariffs on imports from countries outside the SACU. Table 4 shows the effective tariff applied to India’s imports and the effective tariff applied on estimated potential exported commodities. It is clear from the Table 7 that the effective tariff ranges from 80% to zero, although the tariff applied is less than 30% for maximum commodities. If the tariff rate is lower, India’s exports to the SACU region will be encouraged. Apart from the tariff, non-tariff barriers such as a quota, embargo or sanction—that countries use to further their political and economic goals affect international trade. Those aspects need separate analysis.
Conclusion
Trade between India and SACU has grown significantly in the last 20 years. However, India’s export intensity to SACU and its member countries is more robust than its import intensity. In the trade intensity index, the export intensity indicates that India’s export to SACU has a higher intensity of export than the rest of the world. The estimated exportable commodities for SACU and export potential (PBT estimation) indicate that India can increase its export value in the future. Although there are many commodities, India already has a significant export share of their total imports. After this analysis method, we found some untapped export commodities that have the potential for export to SACU. Commodities like Sugars and sugar confectionery (HS-17), Residues and waste from the food industries (HS-23), and Salt-sulphur-earth-stone -cement (HS-25) have a meagre export share of India, which may increase in the future. After looking into each SACU member country, we found that South Africa has parallel trade intensity and almost the same goods that could be exported to SACU. South Africa accounts for 80% of India’s exports to SACU. This means that over 80% of SACU trade is carried out by just one member state, South Africa. The critical finding of our analysis is that Botswana is increasing the representation of India’s exports as the EII shows that after 2013, India’s export intensity to Botswana was more than one, indicating that India’s export to Botswana became more intense than the world. Although only a few commodities have a substantial export share, many remain untapped. India has the potential to export untapped commodities to Namibia, Lesotho, and Eswatini. However, India does not export those exportable commodities because these countries depend on South Africa for most of their imports, and India exports these items to South Africa. The same is valid with Botswana, but India has been exporting directly to Botswana recently. South Africa is one of the largest economies among SACU, and their dominance is high, but Botswana and Namibia are emerging as new players in the region. India’s export supplies are currently meeting up to 10% of SACU import demand. India is maximising its export opportunities in South Africa. The PBT table shows that India can enhance its exports to SACU and its countries like Botswana and Namibia. As export potential to SACU tariff plays a significant role. If the PTA between India and SACU is signed in the future and the tariff rate is reduced, it will encourage India’s export to SACU. In the future, successful PTA negotiations between India and SACU could benefit exports and can be boosted by reducing trade barriers such as tariff and non-tariff barriers. The government should frame a policy accordingly so India can take full advantage of its export potential to SACU.
Footnotes
Acknowledgements
The authors are grateful to the Department of Economics and Prof. Ram Dayal Munda Central Library, Indira Gandhi National Tribal University, and deserve special thanks for its resources.
Declaration of Conflicting Interests
The authors declared no potential conflicts of interest with respect to the research, authorship and/or publication of this article.
Funding
The authors received no financial support for the research, authorship and/or publication of this article.