
Abstract
This article describes the use of the Consensual Approach to poverty measurement in a pilot survey conducted in Telangana state in 2020/21. Respondents were asked about whether a series of items and activities, ranging from two pairs of all-weather shoes to attending important social functions were essential for adults and children and whether they had them or could take part. Households that answered negatively were then asked why. Following the approach pioneered by Mack and Lansley, households whose lack was enforced were identified as deprived. We found high levels of endorsement for a wide range of items such as three meals a day, school uniforms and equipment, health facilities and transport access as well as the ability to afford clothing, social activities and savings. We also found similar levels of consensus over a wide range of necessities across religion, location, caste and education. The results underscore the importance of dimensions and specific deprivations that are not entirely captured by existing monetary and multidimensional poverty approaches used in India. This reinforces the call for child-centric methodologies such as United Nations International Children’s Emergency Fund (UNICEF’s) Multiple Overlapping Deprivation Analysis (MODA), which distinguish between age groups and their evolving needs. Our results also suggest that simply relying on existing Demographic and Health Survey (DHS) and Multiple Indicator Cluster Surveys (MICS) surveys leads to underestimation of the extent to which widely endorsed needs are satisfied. Furthermore, our findings challenge policymakers to consider expanding the measurement of poverty to include the public’s perception of necessities, which will enrich the index with culturally specific and socially validated indicators.
Keywords
Introduction
India, since 2000, has sustained impressive economic growth (averaging 6% per annum), with concurrent success in reducing the rate of extreme monetary poverty—from ~40% in 2004 to ~13% in 2019 (World Bank, 2023) and multidimensional poverty (using the Indian Multidimensional Poverty Index, MPI)—from 25 to 15% (NITI Aayog, 2021). Progress, however, has not been achieved equally across all states or socio-economic groups, and economic inequality remains a challenge. Oxfam recently noted that 10% of the Indian population holds just over three-quarters of the nation’s total wealth, and that in 2017 73% of the wealth generated in India went to the richest 1%; at the same time, around 670 million Indians (nearly half the population) saw a 1% increase in their wealth (Oxfam, 2022). Such data hint at the scale and nature of the challenge facing the country, but they also understate the reality on the ground, given the indicators available to policy makers. Consensus has been clear for several decades now that meaningful poverty estimates need to reflect the lived experiences of the population, and this has driven a plethora of new approaches and measures of multidimensional poverty, such as the United Nations Development Programme (UNDP’s) Human Development Index and, more recently, the World Bank, UNDP and Oxford University’s International Multidimensional Poverty Measure (MPM). Each seeks to reflect familial deprivation in three dimensions—monetary poverty, education and basic services, with estimates developed for international and inter-temporal comparison (World Bank, 2023). These indices provide important complementary data to monetary measures, and the UN are using them to report on the progress of international development targets like the Sustainable Development Goals (SDGs).
SDG 1, regarding poverty ‘in all its dimensions’, requires data for two key targets: first, to assess change in the proportion of the population living below the national poverty line (target 1.2.1), and second to assess change in the proportion of men, women and children of all ages living in poverty in all its dimensions according to national definitions (target 1.2.2). The first of these is not contentious, using nationally-set monetary poverty lines—although for India, the lack of data from the 2017/18 Household Consumer Expenditure Survey, leaves a gap in the national, regional and global estimates of monetary poverty (World Bank, 2020). For the second however, and this is the focus of this article, the issue of data and indicators that reflect poverty in all its dimensions according to national definitions for men, women and children is more contentious. Which dimensions of poverty need reflecting? Are these comparable across place and time? How do they distinguish the particular needs and rights of children distinct from those of adults? What constitutes a national definition of multidimensional poverty? Who decides? This article outlines a tried and tested research method that answers most of these questions. Its intent is to add to well-developed poverty debates in India, by setting out the merits of the Consensual Approach to poverty—a method that has been used successfully in low-, middle- and high-income countries, for nearly 50 years. This article explains its use in a pilot survey of over 4000 households, conducted in Telangana state by the Council for Social Development (CSD), in 2021.
The Measurement of Poverty
Poverty in All Its Dimensions, According to National Definitions
All accepted theories and definitions of poverty highlight people’s lack of access to sufficient resources—be they material, social, customary—as well as having assets and capabilities to secure minimum standards of living and well-being. These include a growing set of multidimensional poverty measures which are being used by the UN and countries to inform progress towards meeting the first SDG. The Global indicator framework for the SDGs and targets of the 2030 Agenda for Sustainable Development
1
which explicitly concerns multidimensional poverty requires reporting on two indicators:
1.2.1 Proportion of population living below the national poverty line, by sex and age
1.2.2 Proportion of men, women and children of all ages living in poverty in all its dimensions according to national definitions
Responsibility for the data regarding indicator 1.2.1 rests with the World Bank, and for 1.2.2 with nation states. As such, consistent reporting on progress for SDG indicator 1.2 requires measurement to do three things: (a) account for the needs of children and adults separately; (b) reflect poverty in all its dimensions; and (c) be based on national definitions. These are non-trivial requirements, but this article presents how it might be done.
Using an internationally validated methodology, the Consensual Approach can be used to define and measure multidimensional poverty among adults and children, aligning closely with the requirements of indicator 1.2.2. We present here initial findings from the first ever use of the Consensual Approach in India, in the state of Telangana.
Expanding Definitions and Measures of Poverty
Since 1962, households in India have been identified as ‘poor’ based on their ability to meet certain standards, known as per capita consumption expenditure (Joshi, 1998). Households with consumption expenditures on goods and services below this standard are said to be ‘Below the Poverty Line (BPL)’ and thus deemed poor. This methodology has been revised several times over the last 30 years through recommendations of different expert groups, including the latest one, the Rangarajan Committee, in 2014. In line with previous versions, the 2014 consumption expenditure standard is firstly composed of minimum calorific requirement, based on the latest recommendation of a balanced diet made by the Nutrition Advisory Group of the Indian Council of Medical Research. Other types of consumption expenditure on goods and services are included in the latest standard. Specifically, as described in Rangarajan and Mahendra (2022), the latest iteration of which stipulates that households need a minimum level of consumption expenditure which cover (a) calories, fat and protein intake based on expert recommendations; and (b) non-food consumption, based on the clothing, housing, mobility and education consumption of households in the 45–50th consumption percentile; and finally (c) non-food consumption of goods and services such as consumer durables, footwear and health based on consumption of households meeting the food-based component. While the inclusion of the last two components in recent Poverty Line Baskets (PLB) revisions signalled a clear shift from poverty lines based solely on minimum nutritional requirements, the Rangarajan Committee BPL has been criticised on several fronts, not least because of doubts about its ability to provide meaningful comparison of poverty rates across different regions and family types (Subramanian, 2011).
In this article, we focus specifically on criticisms of the limited range of needs accounted for by the method, or its inability to detect when important needs are not met among adults and children. Ray and Sinha (2014) argued that the Commission failed to include ‘a wider multi-dimensional view of deprivation’, which could have included aspects such as access to drinking water, and clean and sufficient cooking fuel (Mishra & Ray, 2013). The critique of the failure to embrace a multidimensional view of poverty can be decomposed into two points; first, that confirming surveyed households have access to services like education and sanitation is simpler and more reliable than including them in a costed-basket of goods and services for a monetary/consumption-based measure of poverty. Second, that monetary/consumption measures of poverty regularly overlook and fail to measure need satisfaction across different ‘dimensions’, reflected by valid and reliable indicators. We focus here on this latter issue, and argue that despite being of considerable importance as the first, it has received conspicuously less attention. As a result, multidimensional poverty measures tend to have real blind spots.
Multidimensional Poverty Approaches
Studies of the measurement of multidimensional poverty rely on information about people’s unmet basic human needs. Recognising that these are important complements to monetary/consumption measures of poverty (World Bank et al., 2021), such analyses highlight the value of combining information from monetary and non-monetary approaches, which show families can be exposed to both/either low-income and/or basic needs deprivation. Such approaches improve our understanding of poverty trends and patterns, by revealing aspects of poverty often missed by narrow, expenditure-based measures.
The Multidimensional Poverty Index (MPI), developed by UNDP and the Oxford Poverty and Human Development Initiative (OPHI), is widely used to detail trends in household-level MD poverty, and progress towards the SDGs. Similarly, to report on multidimensional child poverty, UNICEF developed its own methodology and suite of indicators, the Multiple Overlapping Deprivation Analysis (MODA), to report on child MD poverty (Chzhen et al., 2016; Milliano & Plavgo, 2018). Both build on earlier work done to estimate the extent and nature of absolute child poverty in developing countries using readily available household survey data (Gordon et al., 2003). This earlier work used fulfilment of key human rights set out in the United Nations Convention on the Rights of the Child and other international agreements to develop a measure of absolute poverty agreed at the 1995 World Social Summit in Copenhagen to be ‘…a condition characterised by severe deprivation of basic human needs, including food, safe drinking water, sanitation facilities, health, shelter, education and information. It depends not only on income but also on access to social services’ (United Nations, 1995, p. 57).
The MPI and MODA methodologies drew on the initial work by Gordon et al. and added further indicators. The MPI examines household deprivation using ten (or sometimes more) indicators across three equally weighted dimensions: health, education and standard of living. It counts households as multidimensional poor if they are deprived in one-third or more of the indicators (Oxford Poverty and Human Development Initiative [OPHI], 2020). Different (increasingly nationally specific) versions of the MPI may include extra indicators such as child mortality and school attendance and the MPI for India also includes adolescent and maternal mortality (NITI Aayog, 2021). UNICEF’s MODA focuses more specifically on child outcomes, although it also includes several household level outcomes which overlap with the MPI.
While both the MPI and MODA are well-established in the poverty literature, and their reach and influence considerable, both originated in pragmatic (and laudable) efforts to assess some version of absolute poverty with existing data. India’s MPI, for example, is based primarily on existing National Family Health Survey questions on nutrition, health care and living conditions, using variables usually available across other surveys platforms like the Demographic and Health Survey (DHS) and Multiple Indicator Cluster Surveys (MICS) programmes. A focused justification of why certain indicators are included in multidimensional indices is generally restricted by data availability. This limits the alignment of theoretical concepts (from basic needs to capabilities) and operationalisation of measures of deprivation as well as their timeliness, age and geographical specificity. With SDG target 1.2.2, and the requirement to reflect poverty in all its dimensions, for children and adults, according to national definitions, what is needed is a clear framework and way to validate the strong normative criteria that underpin the choice of indicators to reflect poverty for adults and children.
Understanding Needs
A long history of poverty research, from the work of Dadabhoy Naoroji (Naoroji, 1901) and Rowntree (Rowntree, 1901) to the seminal work of Sen (Sen, 1987, 1999) and Townsend (Townsend, 1954, 1970, 1979) has demonstrated that the condition of poverty encompasses more than just an inability to satisfy one’s nutritional needs. People everywhere place a high value on the capacity to engage in traditional social customs and fulfil expected social norms, like the exchange of gifts or participation in major religious festivities (Townsend & Gordon, 2002). Acknowledging how critical exclusion from these societal standards and traditional practices has been well documented (Chase & Walker, 2013), and this has prompted a broadening of how poverty is defined, to include aspects of social engagement which earlier examinations overlooked. These more relative characterisations of poverty recognise a need to assess it with respect to the societal and temporal contexts in which it exists, as opposed to applying a universally low income threshold to gauge a person’s capability to meet their fundamental needs (Anand et al., 2010).
The 1995 World Summit on Social Development also defined ‘overall poverty’ as: ‘a lack of income and productive resources to ensure sustainable livelihoods; hunger and malnutrition; ill health; limited or lack of access to education and other basic services; increased morbidity and mortality from illness; homelessness and inadequate housing; unsafe environments and social discrimination and exclusion. It is also characterised by a lack of participation in decision-making and in civil, social and cultural life’ (United Nations, 1995; emphasis added). In contrast to absolute poverty, this definition is applicable across low-, middle- and high- income contexts (whether within or across countries), and it provides the theoretical and methodological basis for comparable, relative measures of poverty. It makes clear the key elements of any serious measure (i.e., reflecting access to basic services for education and health), thus expanding the idea of resources to include ones additional to those owned by households, and then further expanding it to include the inability to participate in society due to a lack of resources. Within this enlarged set of needs, measuring poverty in ‘all its dimensions’ (as SDG 1.2.2 requires) presents several challenges, including how to establish a list of ‘all’ dimensions of poverty—a question which paradoxically remains unexplored (Grusky & Kanbur, 2006), particularly in middle- and low-income countries. Achieving consensus about what is important and what is less so is critical for any assessment or approximation of poverty. With the push by scholars, and national and international organisations to broaden the understanding of poverty, it is imperative to craft a precise investigative approach that can facilitate the orderly gathering of valid, reliable and comparable data. These data should mirror people’s perceptions to establish genuinely national definitions of adult and child poverty across nations.
Measures like the MPI and MODA do not include in their development a sense of which indicators to include to reflect their dimensions of poverty, relying on national expertise and the availability of existing data in national surveys. Conversely, some investigators have employed focus groups to form a grassroots-level comprehension of poverty’s facets (Baffoe & Matsuda, 2017a, 2017b; Bessell, 2015). However, for various reasons, these researchers often fail to validate their findings through nationally representative surveys, or they cast a wider net by focusing on general living standards and the means of livelihood rather than narrowly defining poverty.
The pursuit of consensus is, without doubt, a complex task. Building on the work of Townsend and criticisms about an ‘expert-led approach’, Mack and Lansley (1985) developed and applied what is now known as the Consensual Approach. Their objectives were to first identify whether there was public consensus (in the UK) about what constituted a minimum acceptable way of life in Britain in the 1980s, and second, to determine if anyone there was living below this publicly/nationally defined benchmark. Their pivotal contribution and methodological breakthrough involved incorporating the public’s perspective into shaping the definition of poverty, thereby influencing potential measurement methods.
Mack and Lansley (Lansley & Mack, 2015; Mack & Lansley, 1985) showed that there was unanimous public opinion that measures of poverty and minimum living standards needed to encompass more than simply a lack of access to food and shelter; they had to also consider factors such as social engagement and cultural/civic participation. By convening focus groups from diverse segments of the public and compiling a roster of necessities and activities deemed essential for everyone in the UK, Mack and Lansley developed a set of survey questions designed for use in national studies. These questions asked respondents (a) what items and activities they deemed essential and believed should be affordable or available to all, and (b) which ones no one should lack due to insufficient resources (i.e., an ‘enforced lack’). Items endorsed by a majority of the population (>50%) were classed as ‘socially perceived necessities’ (SPNs), which could then be used to assess national poverty simply by enumerating what proportion of a country or group either do not possess or engage in these SPNs due either to an enforced lack, or for other reasons, for example, because they did not want or not need them.
Lists of such items and activities have been developed over many years, using focus groups and surveys across countries as diverse as Sweden, South Africa, Uganda, Japan, South Korea, Mexico and Brazil. This has resulted in an internationally validated list of items and activities about which respondents are asked (Pomati & Nandy, 2020). The Consensual Approach has been applied successfully across high-income countries including the UK (1983, 1990,1999, 2002/3 and 2012) all 28 European Union countries (EUROSTAT 2012), as well as in national studies in Belgium (Bosch, 2001), Finland (Halleröd, 2006), Sweden (Hallerod, 1995), Japan (Abe & Pantazis, 2013), South Korea (Kim & Nandy, 2018; Weon et al. 2024) and Australia (Saunders, 2011). Researchers have also applied it in Bangladesh (Mahbub 2007), Benin (Authors 2014), Vietnam (Davies & Smith, 1998), Mali (Nteziyaremye & Mknelly, 2001), Tanzania (Kaijage & Tibaijuka, 1996), South Africa (Barnes & Wright, 2012; Wright & Noble, 2013; Wright, 2008) and Zimbabwe (Mtapuri, 2011). Most recently (2016/2017) countries as diverse as the Solomon Islands and the Kingdom of Tonga in the South Pacific (Fifita et al., 2017) and Uganda (Government of Uganda et al., 2019) have used it in national household surveys for national estimates of child and adult multidimensional poverty. This article outlines the first test of the applicability of this methodology in the Indian context.
Would the Consensual Approach be Suitable for Use in India?
Given its successful use around the world, it is only natural to consider whether the Consensual Approach could be used in India. An often raised concern about the Consensual Approach relates to the concept of ‘adaptive preferences’ or ‘bounded realities’ (Halleröd, 2006; Mckay, 2004; Wright & Noble, 2013). The concept suggests that those who have grown up poor or who are currently poor will have different perspectives about what constitute acceptable living standards to which everyone should have. For example, such groups may be less likely to think that having a complete secondary education, or having well-remunerated stable employment, or being able to obtain medical care when sick, or receiving support during times of hardship should be a universal entitlement, accessible for/by all citizens (Nussbaum, 1999). As such, their views would lower any socially defined thresholds about what should constitute a ‘decent’ living standard for all. There is, however remarkably little evidence that adaptive preferences are consistent or widespread, even in contexts of extreme poverty (Nandy & Pomati, 2015; Pomati & Nandy, 2020) and displaced communities (Depio et al., 2018) or that they prevent the development of valid and reliable poverty indicators (Burchardt, 2004; Halleröd, 2006; Noble et al., 2006; Wright & Noble, 2013).
This literature prompted the question as to whether adaptive preferences would hold in India, given the particularities and ongoing influences of the caste system which has, over generations, entrenched disadvantage among certain communities, and limited wider social mobility? (Dreze & Sen, 2002; Kijima, 2006) Deeply ingrained hierarchies could influence people’s expectations of what constitutes a necessity or entitlement, resulting in the manifestation of adaptive preferences particularly among disadvantaged caste groups who, due to historical marginalisation, might accept lower norms for a standard of living. The historically greater access and control over societal decision-making for privileged caste groups might also skew understanding of social necessities, undervaluing the needs and voices of lower castes groups and thus perpetuating poverty and social exclusion. The Consensual Approach as a democratic method requires the involvement of all voices, including the marginalised, and so their exclusion might well undermine the approach.
Our study is the first ever application of the Consensual Approach in India. Although focus groups were not run for this pilot, colleagues at the CSD in Telangana decided on a items list and activities from a list of items used in previous Consensual Approach studies (see above), which were then piloted in a survey of the population about their perceptions of the necessities. Telangana is a particularly interesting place to test the approach, given Scheduled Castes, Scheduled Tribe and OBCs make up nearly 90% of its population (IIPS, 2023). The state, like many others in India, hosts a range of socio-economic disparities and a marked urban–rural divide, and the interplay of these factors presented a fascinating opportunity to test the utility of the Consensual Approach.
Data and Methods
The Telangana 2020 Poverty Survey
The data presented here are based on a sub-sample of households who participated in the 2018 Telangana Social Development Report Survey (Haque & Narasimha, 2018), run by the CSD. Participating households were originally selected by taking a stratified cluster sample of villages from an administrative list of villages in the state. A list of household addresses in the selected villages was then used to select a random sample of households, which trained interviewers visited personally in September–October 2018. After consent was secured, and the questions for the 2018 Social Development Report Survey Telangana asked, respondents were asked if they would be willing to take part in follow-up surveys. Of the households who agreed to be contacted again, 7,182 were reselected by taking random samples in eight strata (four social groups: Scheduled Tribe, Scheduled Caste, Other Backward Caste and Others in urban and rural areas) and 4,284 households were selected to answer face-to-face Computer-Assisted Personal Interviews (CAPI) administered by trained interviewers between February and April 2020. Respondents were reminded that they had no obligation to take part in this survey. Following this second round of interviews, data for the two surveys were not collated to further protect anonymity. No information on consumption expenditure was collected. Post-stratification population weights were created to correct for non-response by adjusting the eight strata to match Telangana’s National Family Health Survey (NFHS) 5 distribution of the population by caste, religion, place of residence and education of head of household. Due to the small proportion of non-Hindu and non-Muslim households in Telangana (<4%), and the relatively small sample size, it is not possible to report with confidence results for Christian, Sikh or Buddhist households, and so they are excluded from the analysis of the pilot data. Table 1 compares the distribution of key socio-demographic characteristics including place of residence, and religion, education and average age of head household in the NFHS 5 data for Telangana state and our post-stratified sample for the poverty survey (Smith, 1991). 2 While there are some small differences, the two datasets align quite well.
Post-stratification Sample Demographics and Comparison with Telangana State NFHS5 Demographics.
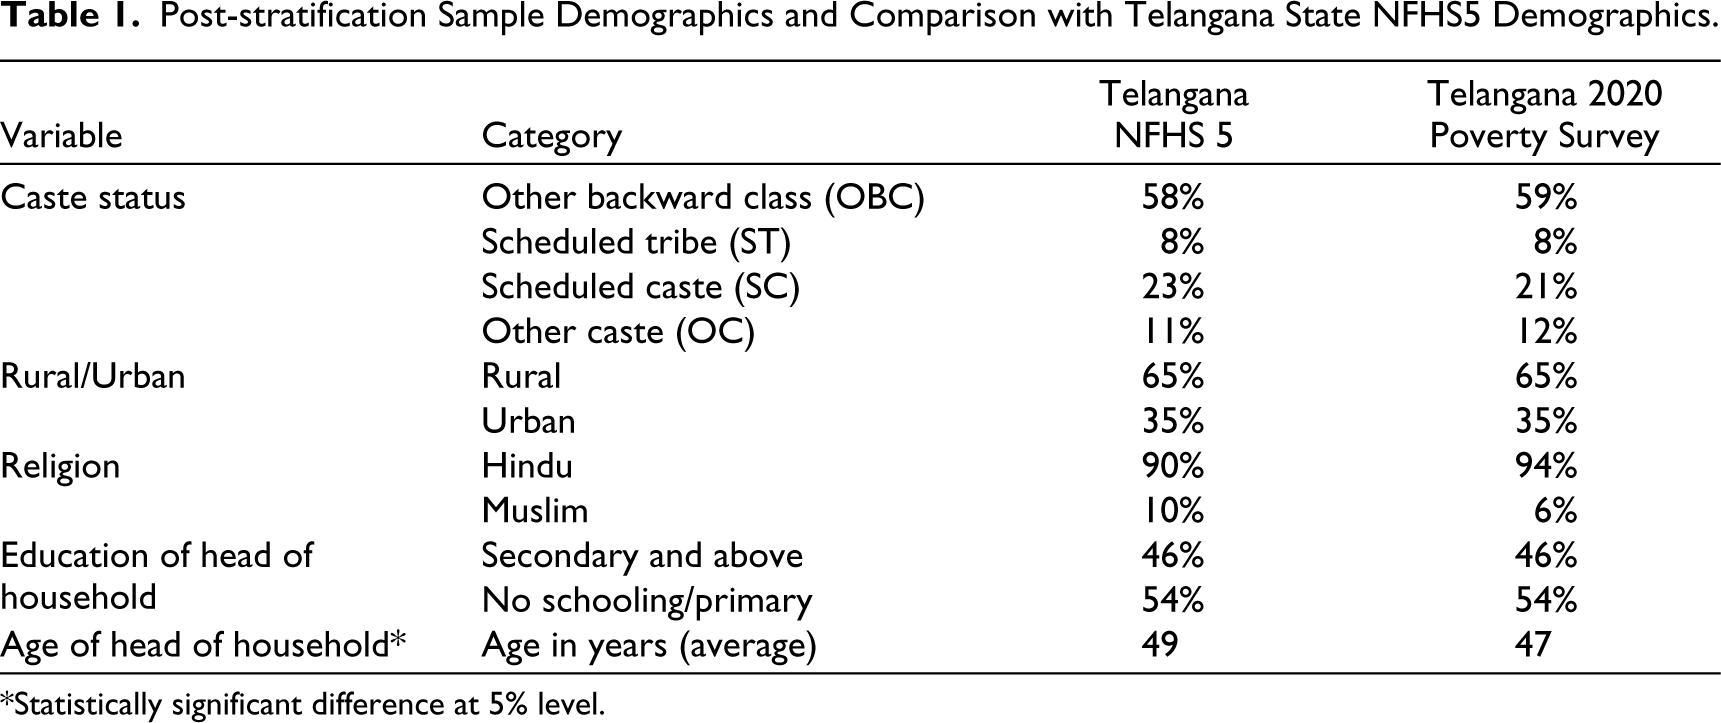
*Statistically significant difference at 5% level.
Since reporting for SDG target 1.2.2 requires data on adult and child poverty, respondents were presented with separate lists of items and activities for adults and children (see Appendix 1) and asked if they thought items/activities were essential for adults and/or children. They were then asked if they had them, and if they lacked them, why so? A lack due to households not being able to afford them was considered an enforced lack, and thus indicative of deprivation.
Results
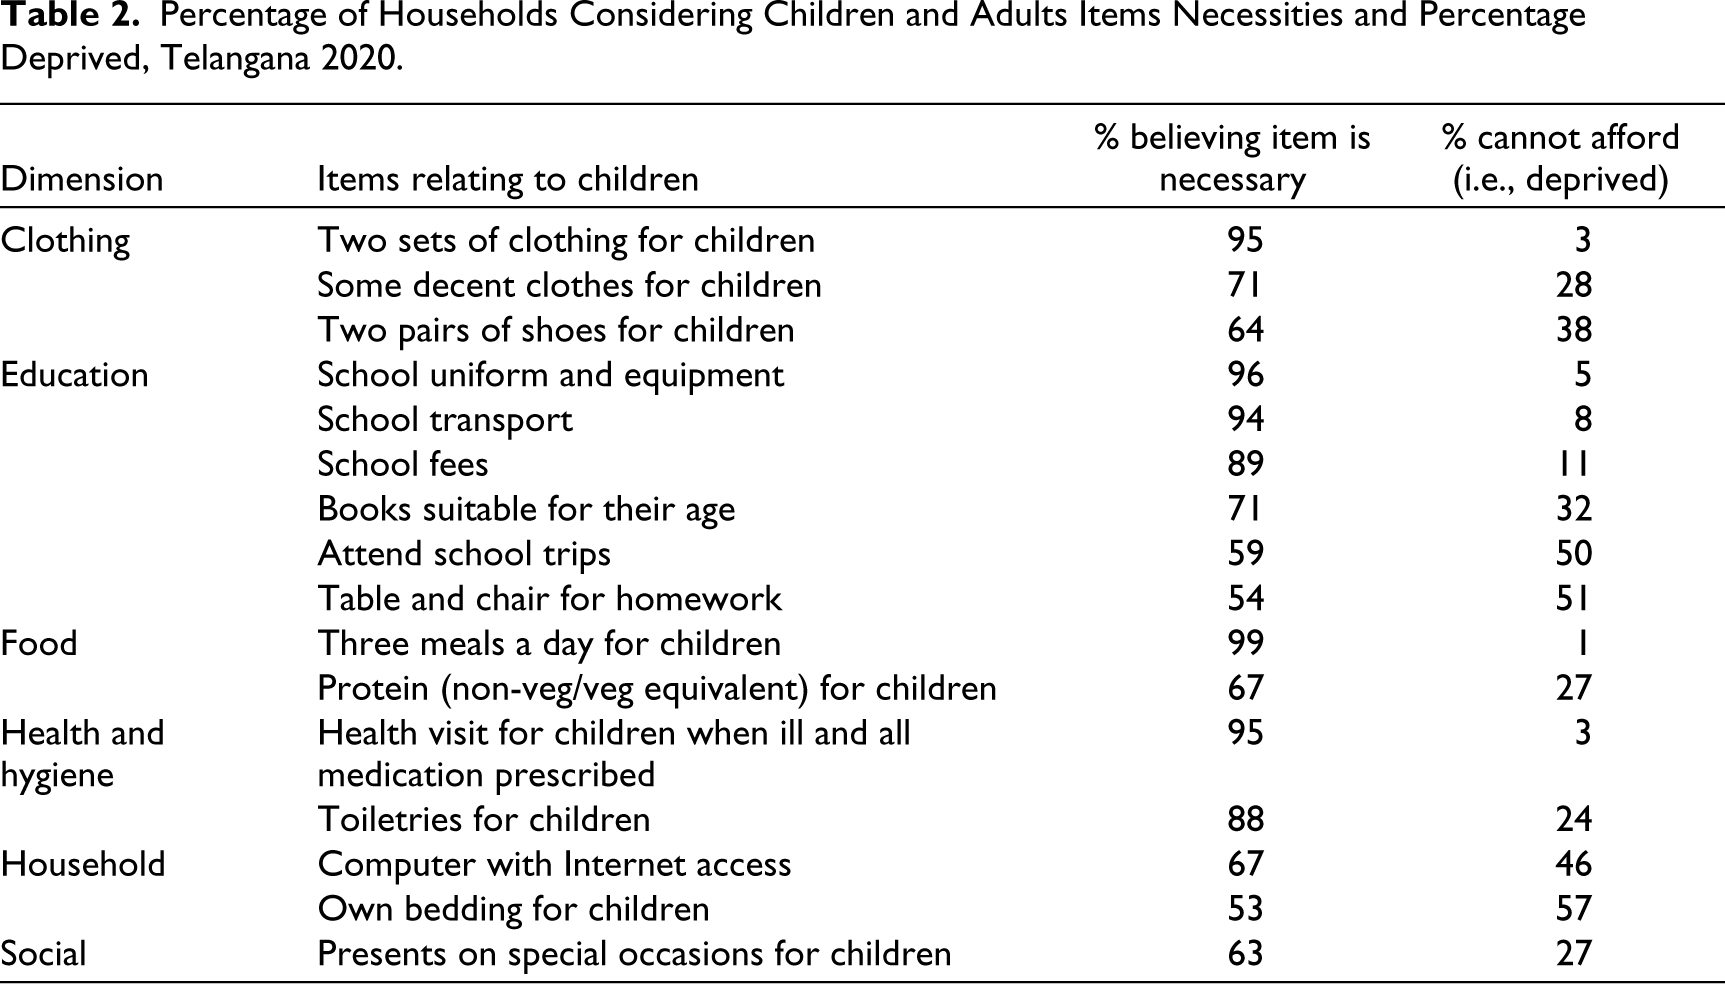
All results presented use households as the unit of analysis. When asked about what constitutes the necessities of life for adults and children, the population of Telangana was on the whole supportive of all the items mentioned. Majority support was lacking for three child-related items; these were ‘educational toys and games’ (48%), ‘own room for over 12s of different sexes’ (47%) and ‘own bed/mattress’ (46%). There was almost universal agreement about the necessity of ‘three meals a day’ for adults (100%) and children (99%), with two-thirds of respondents (67%) everyone being able to have some animal or plant-based protein in their diet. The ability to access healthcare was endorsed by 95%, showing that this is a foundational aspect of well-being in Telangana (as it is elsewhere). Educational resources listed as necessities extend beyond simple attendance/enrolment, with nearly all (96%) respondents thinking all children should have essential school uniforms and equipment. There is also consensus about children having access to school transport (94%) and being able to cover school fees (89%); two-thirds of respondents (67%) believe a computer with Internet access is essential for children. The latter would have been very apparent as coronavirus disease 2019 (COVID-19) stopped children attending school later in 2020, an example of how the perceived needs for children can be expected to change over time and contexts.
Respondents were also asked about housing conditions. Nearly three-quarters of respondents (71%) agreed that having the resources to repair a leaking roof was essential, and respondents were clear about the necessity of indoor (94%) and/or outdoor (55%) sanitary facilities, reflecting the importance of dignity and health in personal hygiene practices. While assets such as personal cars, motorcycles and bicycles are regularly included in asset-based wealth indices, it is notable that everyone (99%) saw the necessity of access to public transport, acknowledging its importance for communities (Lanau et al., 2020; Pomati & Nandy, 2020).
Social engagement was also valued by respondents, with 73% thinking people should be able to celebrate special occasions like Diwali, Christmas, Eid, Dussehra and Jataras, and 69% considering it essential that people be able to attend important social functions like weddings and funerals; these items demonstrate that the ability to participate (and to afford to participate) in social customs is integral to the social fabric of people in Telangana, and so exclusion from these must be reflected in socially realistic measures of multidimensional poverty.
While almost all (97%) households in Telangana have bank accounts (IIPS, 2023), our survey confirms that people see the ability to save as important (86%). The results highlight the need for poverty indices to encapsulate facets of life deemed essential by the majority, which go far beyond basic needs and range from decent clothing and nutritious food to public services and the ability to have some savings.
Comparing the last two columns on Table 2 shows that the more universally an item is considered a necessity, the lower the associated rate of deprivation tends to be; this indicates an effective prioritisation of resources towards these widely acknowledged needs (Pearson’s and Spearman’s rank correlation coefficients are –0.9). This is the case when looking at all items and generally also within each dimension. The figures not only reiterate India’s MPI publication findings of high levels of deprivation regarding household sanitation deprivation (NITI Aayog, 2021) but also show that current multidimensional indices give only a partial view of the extent of child deprivation. For example, while school enrolment deprivation is low in Telangana (<3%), our survey shows that around half of all households report not being able to afford to pay for school trips (50%), or education-related resources within the home, such as a table and chair for homework (51%) or a computer with Internet access (46%). Moreover, over a third of respondents (38%) report not being able to afford a social get together, and 30% cannot afford to give children presents on special occasions. Over one-third (38%) report not being able to afford two pairs of all-weather shoes and over one-quarter (28%) said they could not afford decent clothes for their children. Although the results emerge from an incomplete implementation of the Consensual Approach, specifically without focus groups, the results show the Consensual Approach’s ability to identify and measure a wide range of widely endorsed norm satisfiers, compared to approaches like the MPI and MODA, which have instead relied on national experts and the availability of indicators in nationally representative surveys like DHS and MICS to guide the selection of their indicators (Pomati & Nandy, 2020).
Percentage of Households Considering Children and Adults Items Necessities and Percentage Deprived, Telangana 2020.
Sub-state Differences in Perceptions and Deprivation
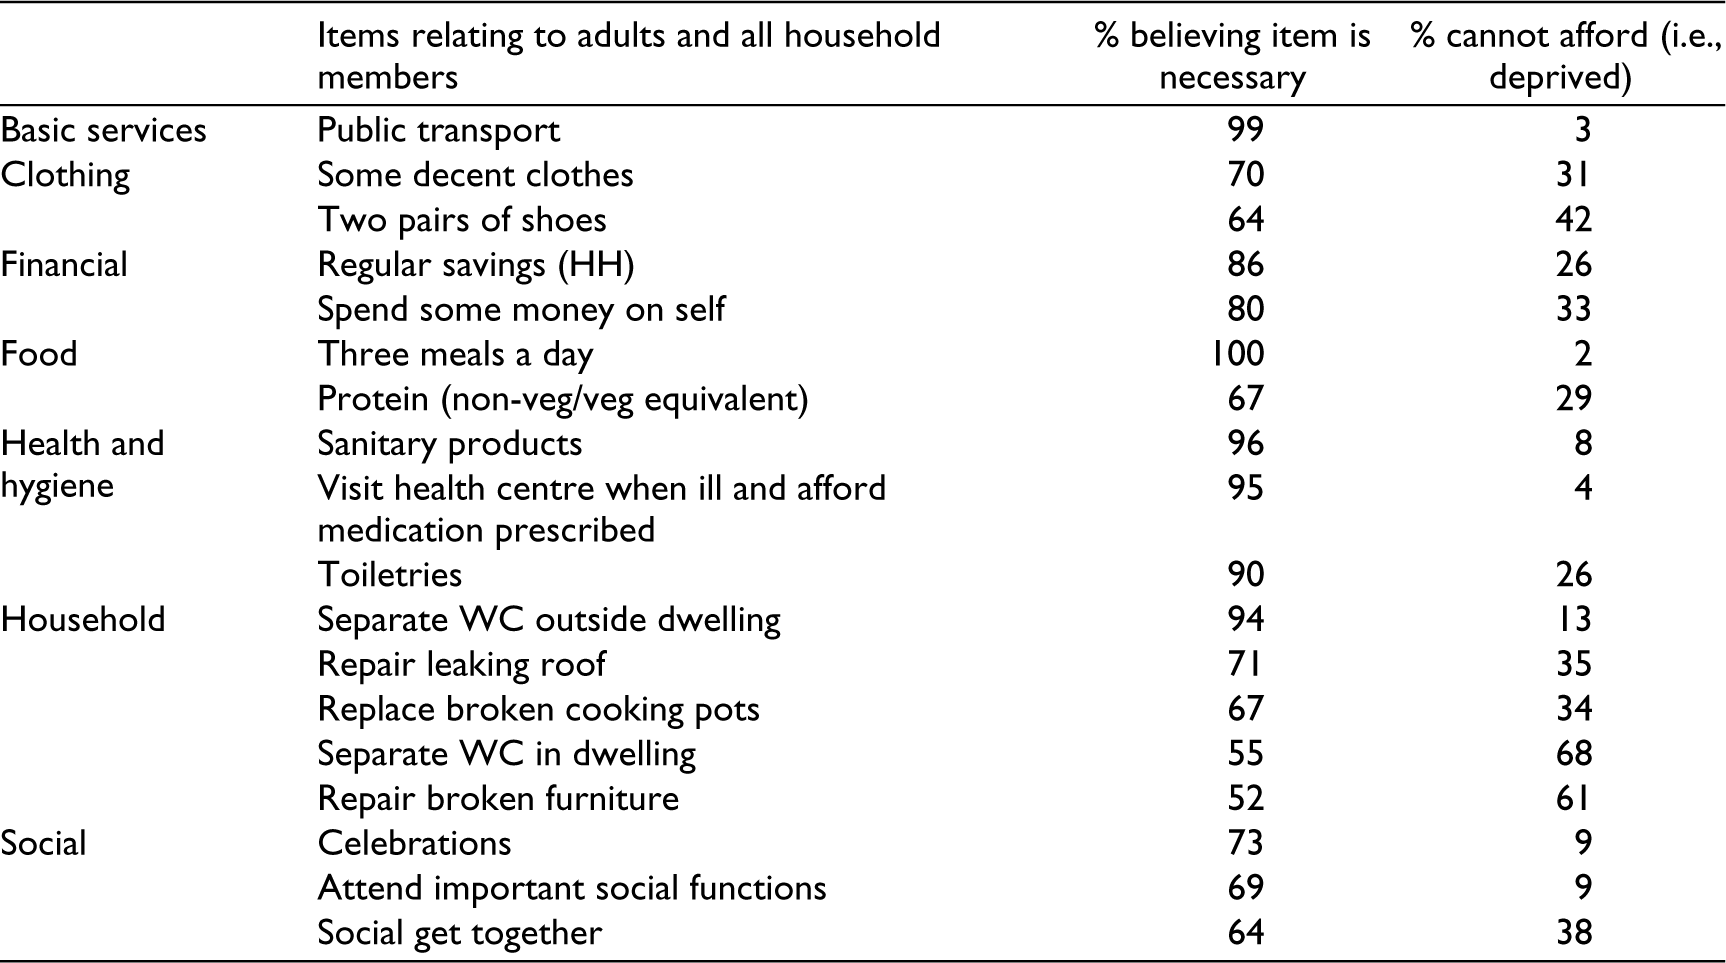
We examined differences in perceptions about necessities across well validated markers of difference—educational attainment of the head of household, place of residence (urban/rural area), and household religion and caste membership (Figure 1). What is immediately apparent is that for almost all items there is majority support (>50%) from all social sub-groups, regardless of religion, caste, level of education or place of residence. There were differences, with lower proportions of Hindu and rural respondents thinking items were necessary compared to Muslim and urban respondent; less educated respondents were also less likely to consider items to be necessities, compared to graduates. These differences, however, were not large and for almost all items the was a majority endorsement (Figure 1).
Sub-Group Perceptions of Necessities, Telangana 2020.
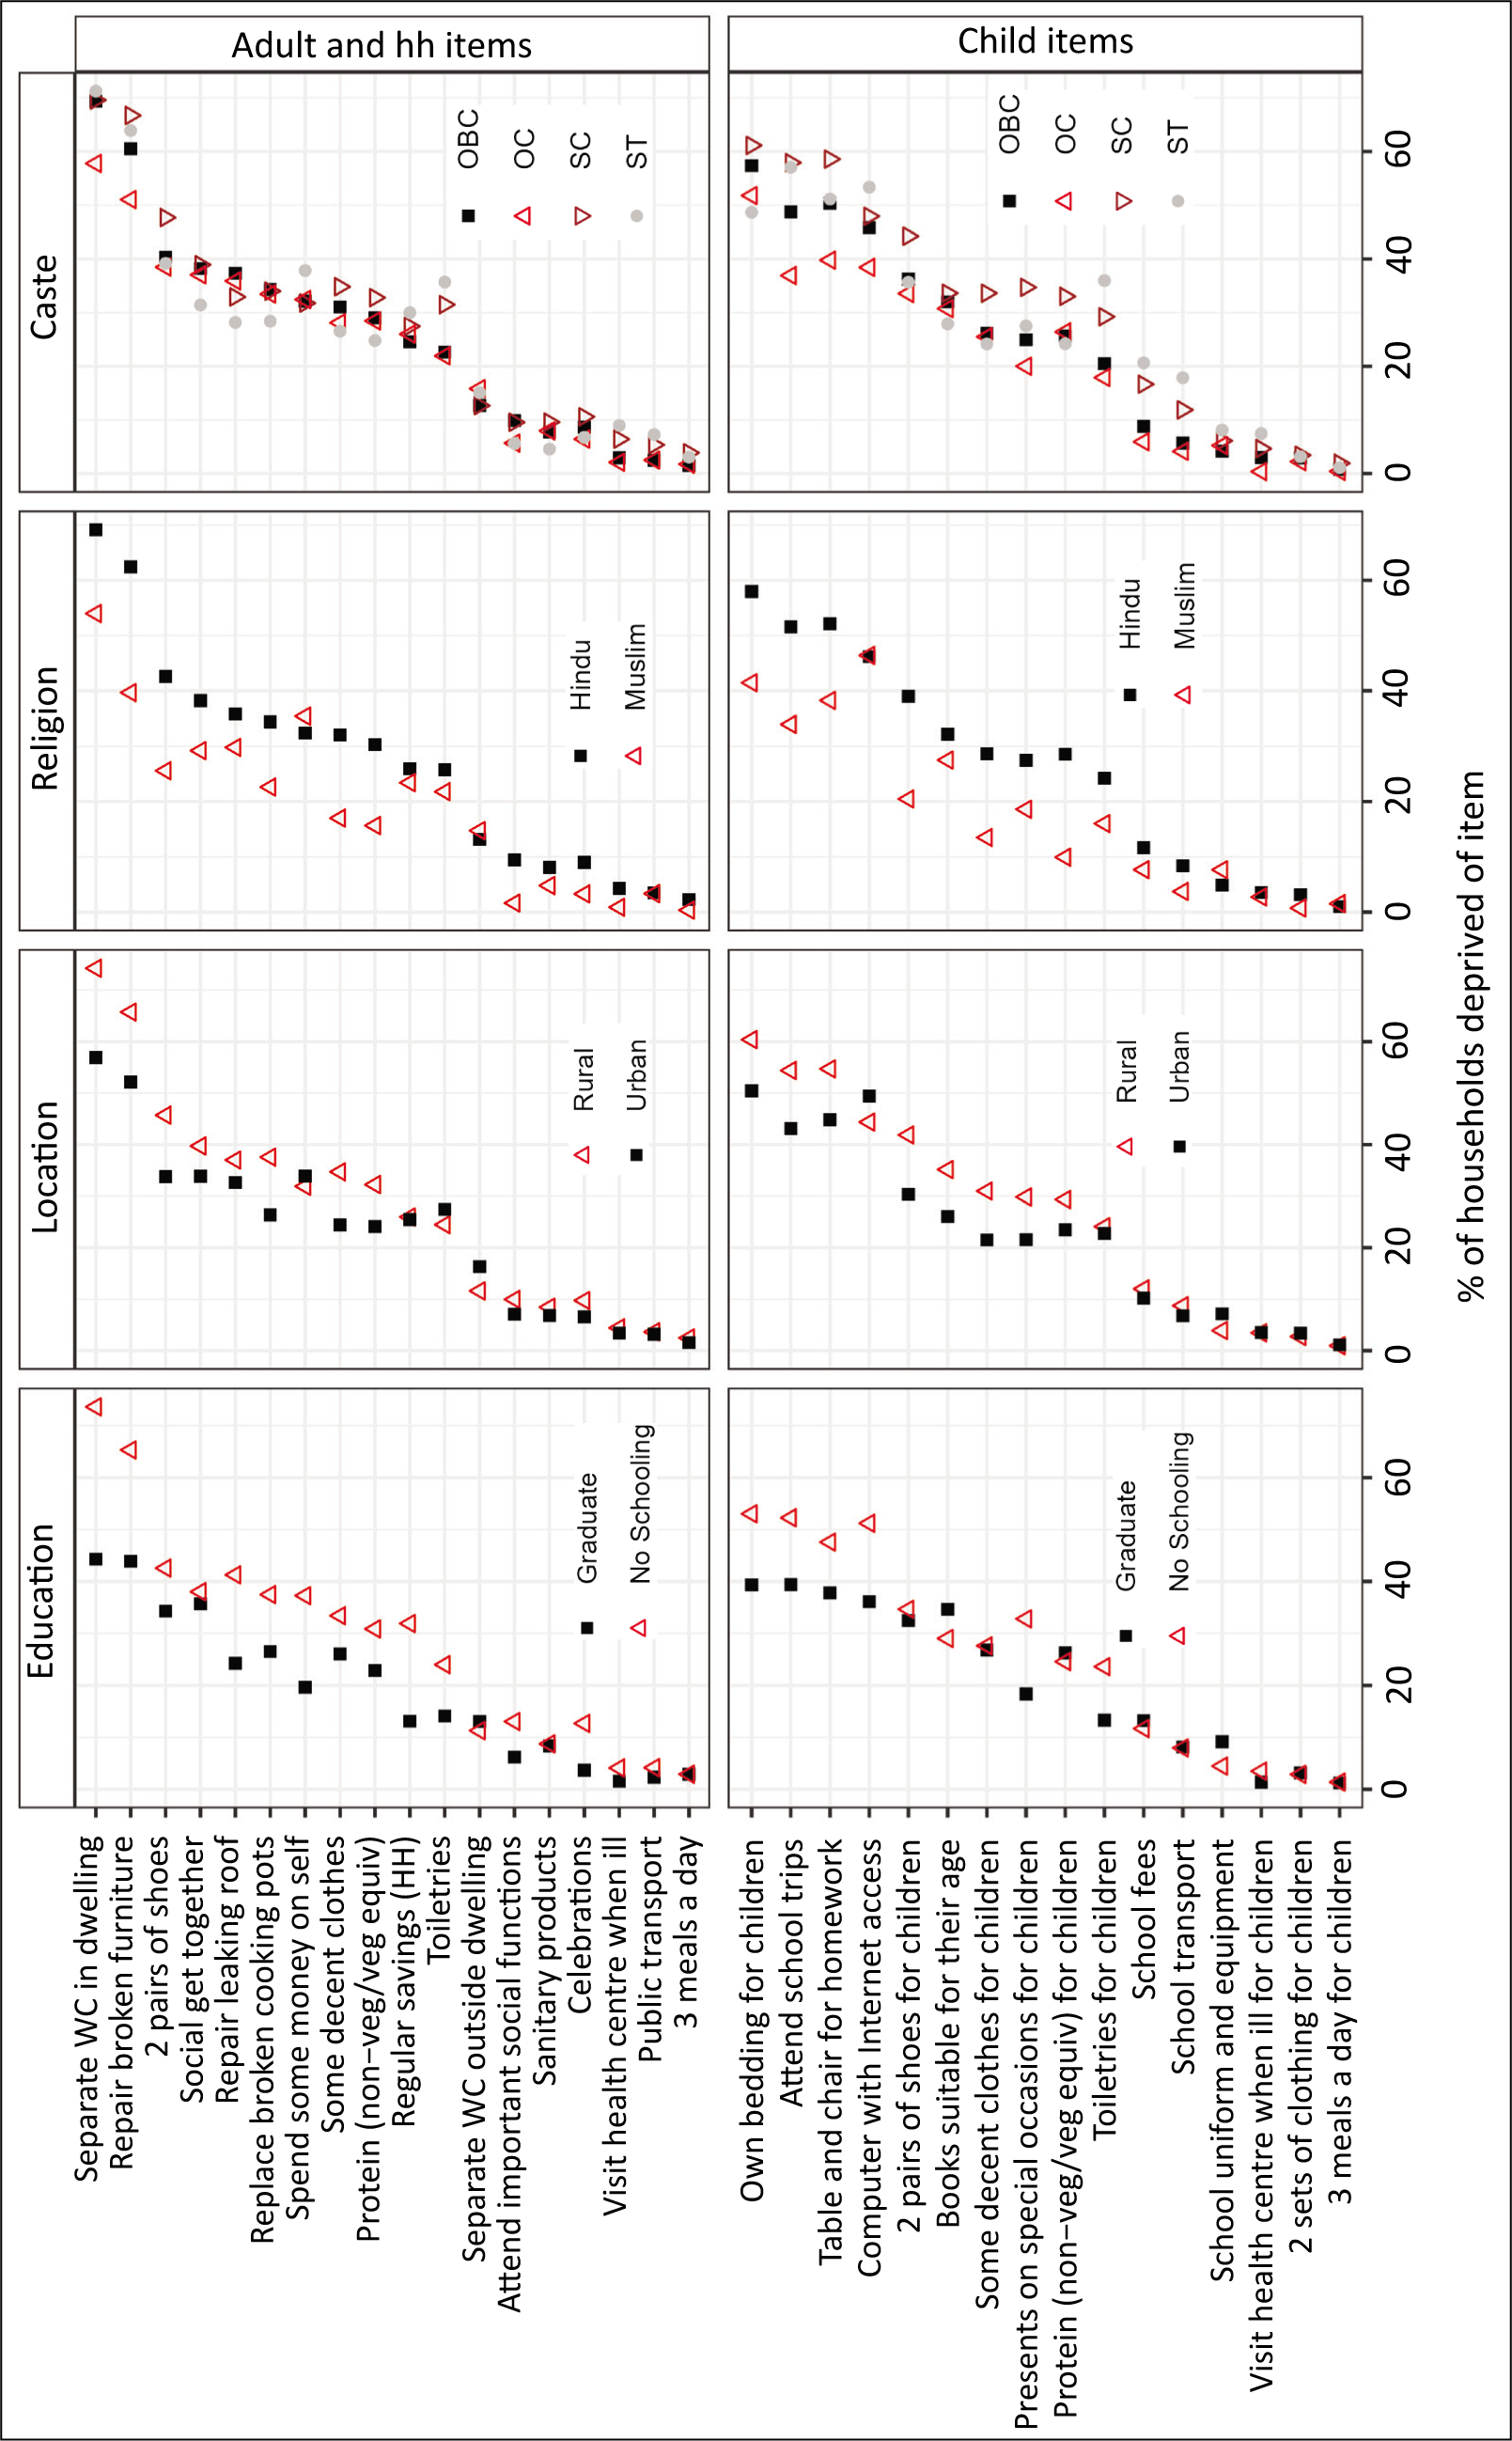
Respondents were also asked if they had these items or were able to take part in these activities and (following the approach by Mack and Lansley outlined above) they were identified as deprived if they reported lacking them because they could not afford them (i.e., an enforced lack). Those with no schooling, from urban areas and Hindu households were also more likely to be deprived. Interestingly, differences along caste lines were less apparent (see Figure 2).
Sub-Group Deprivations of Necessities, Telangana 2020.
Research from around the world has consistently demonstrated that the poor people are more likely than the non-poor to experience multiple deprivations of basic needs and other resources (Government of Uganda et al., 2019; Guio et al., 2017; Noble & Wright, 2013; Townsend, 1979). We compared the distribution of the sum of all deprivations to see whether this pattern held in Telangana. Selecting just those households with children—to enable use of all the items collected in the survey—we show in Figure 3 the relationship between multiple deprivation and socio-economic status. The vertical axis represents the sum of deprivations experienced, while the horizontal axis is segmented into four categories, corresponding to the number of risk factors.
Boxplot Showing the Number of Deprivations by Number of Risk Factors.
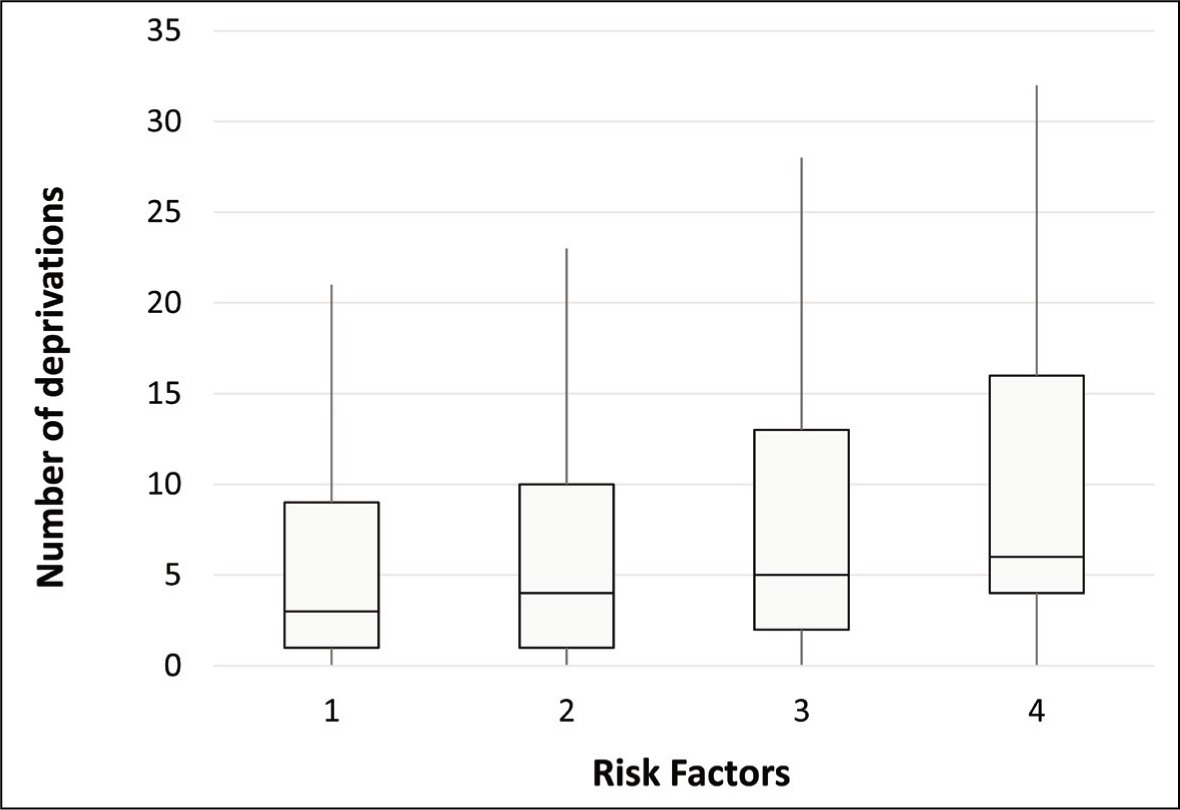
The initial boxplot (labelled ‘0’) represents urban households, where the household head’s highest level of education is a degree, and the home is a structurally improved dwelling. As one might expect, such households experience the fewest deprivations. As we move to the right on the x-axis, each group represents households with incrementally more risk factors—one and two, respectively. The final boxplot (‘3’) depicts rural households with all risk factors, that is, a non-degreed household head, residing in kaccha houses (unimproved building materials as evidenced by the condition of the roof, walls and floor). In each instance, the median value of deprivation escalates with each increase in risk factors, and the range of the boxplots also expands indicating a wider distribution of deprivation scores. This visual progression shows a clear upward trend, with households with a higher count of risk factors experiencing an increased number of deprivations.
Conclusion
The Consensual Approach presents an opportunity to collect data to create socially realistic measures of multidimensional poverty for adults and children in India to aid reporting for international targets like the SDGs. It applies an internationally accepted definition of overall poverty which is appropriate to place and time, and one which reflects the views of Indians and what they consider to be important for everyone to have an acceptable standard of living.
The data from Telangana discussed above provided an opportunity to explore (and refute) several potential challenges to the suitability and use of the Consensual Approach in India. Other limitations may affect wider generalisability, but these could be tested in future work. Despite the significant presence of religious minorities, Telangana has a larger relative Hindu population compared to states like Punjab (with a Sikh majority) or the northeastern states (some of which have a Christian majority). Such religious homogeneity might not fully expose social complexities and differences in consensus, which a more religiously diverse state would encounter. Moreover, Telangana, and especially its capital city Hyderabad, has experienced rapid economic growth and urbanisation and a higher per capita income relative to many other states. This development may be masking deeper caste-based inequalities, which may present in less developed regions. The political landscape of Telangana may also be seen as more progressive through its policies targeting disadvantaged groups, which may in turn affect perceptions of poverty and inequality. This proactive governance might also result in a less pronounced experience of caste and religious discrimination, unlike in states where such policies are not as vigorously implemented or where caste conflicts are more overt. Further research needs to investigate these important aspects and existing research frameworks and data collection rounds could easily integrate the approach proposed in this article. Focus group would also enable further exploration of necessities which could then be integrated in future surveys and, if suitable, reliable and valid (Guio et al., 2017; Pomati & Nandy, 2020), future deprivation indices.
Despite these potential limitations, the results presented here suggest that the Consensual Approach can contribute to the measurement of poverty in India, reflecting evolving conceptualisations and definitions, as well as bringing research into line with work being done elsewhere in the world. Reliance on existing variables from surveys like the NFHS, particularly in a country changing so quickly, will lead to consistent underestimates of poverty; as societies change, so to do the methods needed to identify how new needs are expressed, endorsed and satisfied. Our Telangana survey shows almost universal levels of endorsement for items like three meals a day, school uniforms and equipment for children and access to health facilities and public transport, as well as for more conventional items, like clothing, social activities and financial savings.
Our results underscore the importance of deprivations that are not entirely captured by the MPI or MODA for India. Deprivation of important aspects such as celebrations and social functions, clothes and shoes, sanitary products and ability to save as detailed in this study are not measured in these indices. Given their importance in everyday life participation and evidence of widespread endorsement in a wide range of low-, middle- and high-income countries, further efforts should be made to widen these indices while using clear frameworks and methodologies for inclusion and validation. This study also highlights the potential limitations of survey programmes which are not used to capture a range of deprivations experienced at either individual or household level, particularly deprivations important for children. As such, we support the call for age-centric frameworks (like UNICEF’s MODA), which distinguish between age groups and their differing and evolving needs. Our article suggests that these can also be further improved, as information on educational and social aspects such as school transport, uniforms and equipment, school trips and fees, as well as information on aspects ranging from social participation to clothes explored above are still not included in many national surveys and therefore cannot be incorporated in these indices. Overall, our findings challenge policymakers to consider the expansion of current monetary and multidimensional poverty measures, to include the idea of socially perceived necessities for both adults and children, thereby enriching measurement indices with culturally specific and socially validated indicators.
Footnotes
Declaration of Conflicting Interests
The authors declared no potential conflicts of interest with respect to the research, authorship and/or publication of this article.
Funding
The authors disclosed receipt of the following financial support for the research, authorship and/or publication of this article: UK Economic and Social Research Council—Global Challenges Research Fund.
Appendix 1. Questionnaire.
Please say whether you think each of the following is essential for every adult (18+ years) to be able to afford in order for them to enjoy an acceptable standard of living in India today. if you think it is essential, please say ‘essential’. if you think it is desirable but not essential, please say ‘desirable’. if you think it is not essential and not desirable, please say ‘neither’. So, the three possible answers are ‘essential’, ‘desirable’ or ‘neither’. ownership or access section: ask respondent if they have or can access to the item/activity.
Toiletries available for everyday use (e.g., soap, toothbrush/hairbrush/comb)
Two pairs of properly fitting footwear including a pair of footwear suitable for function/special occasion?
Two meals a day
Eat non-vegetarian food/vegetarian equivalent like green gram, red gram, paneer, soya bean once in a week
A small amount of money to spend each week on yourself
Decent clothes to wear for important family, social, religious or any other special occasions/functions
To get together with friends/family (relatives) for a meal (at least once a month) on a regular basis
Celebrations on special occasions, such as Diwali, Christmas, Eid, Dussehra, Jataras
Attend weddings, funerals and other such occasions
Able to access to safe, reliable public transport, such as buses and share-autos
A visit to a health facility when ill and all the medication prescribed to treat the illness
Availability of Sanitary napkins/clean cloth for women
Toiletries available for everyday use (e.g., soap, toothbrush/hairbrush/comb)
Enough money to repair or replace any worn out furniture
To be able to make regular savings for emergencies
To be able to replace broken pots and pans for cooking
Enough money to repair a leaking roof for the main living quarters
A functional, separate toilet with running water within the household
Enough money to repair or replace any worn out furniture
Notes
Please say whether you think each of the following is essential for every adult (18+ years) to be able to afford in order for them to enjoy an acceptable standard of living in India today. if you think it is essential, please say ‘essential’. if you think it is desirable but not essential, please say ‘desirable’. if you think it is not essential and not desirable, please say ‘neither’. So, the three possible answers are ‘essential’, ‘desirable’ or ‘neither’. ownership or access section: ask respondent if they have or can access to the item/activity.
Toiletries available for everyday use (e.g., soap, toothbrush/hairbrush/comb)
Two pairs of properly fitting footwear including a pair of footwear suitable for function/special occasion?
Two meals a day
Eat non-vegetarian food/vegetarian equivalent like green gram, red gram, paneer, soya bean once in a week
A small amount of money to spend each week on yourself
Decent clothes to wear for important family, social, religious or any other special occasions/functions
To get together with friends/family (relatives) for a meal (at least once a month) on a regular basis
Celebrations on special occasions, such as Diwali, Christmas, Eid, Dussehra, Jataras
Attend weddings, funerals and other such occasions
Able to access to safe, reliable public transport, such as buses and share-autos
A visit to a health facility when ill and all the medication prescribed to treat the illness
Availability of Sanitary napkins/clean cloth for women
Toiletries available for everyday use (e.g., soap, toothbrush/hairbrush/comb)
Enough money to repair or replace any worn out furniture
To be able to make regular savings for emergencies
To be able to replace broken pots and pans for cooking
Enough money to repair a leaking roof for the main living quarters
A functional, separate toilet with running water within the household
Enough money to repair or replace any worn out furniture