
Abstract
The purpose of this study is to contribute to understanding website usage and loyalty and specifically whether the navigation experience varies with the presence of a virtual customer service agent (VCSA) on the website. Two online surveys were carried out with a random sample of 1,000 frequent flyers before and after the inclusion of the VCSA in an airline company website. Results are tested using partial least squares (PLS) structural equation modelling and importance–performance map analysis. Results show that perceived ease of use (PEU), perceived usefulness (PU), perceived visual attractiveness, perceived enjoyment and social presence impact website loyalty. In the website without the VCSA, usability variables (PU and PEU) and perceived visual attractiveness are the strongest antecedents of loyalty, while perceived visual attractiveness and social presence are the strongest predictors in the VCSA setting.
Introduction
Technological advancements such as artificial intelligence (AI) have the potential to dramatically transform services, including in online settings. In particular, AI virtual agents and chatbots, that is, applications that interact with users through natural language (Panda et al., 2019; Pantano & Pizzi, 2020), can be powerful tools to change the way consumers purchase goods and services. In fact, the quality of online navigation and consumers’ experience can be greatly improved by direct and real-time interaction online through communication interfaces similar to a person-to-person conversation (Mimoun et al., 2017; Tan & Liew, 2020). Interactive features in websites such as conversational agents and chatbots (Araujo, 2018; Tan & Liew, 2020) can be used to enrich consumer interactions in e-commerce, social media and messaging platforms. These developments are in line with the computer as social actors paradigm (CASA) (Nass et al., 1994) and subsequent research suggesting that humanisation factors can improve users’ online experience, both from a hedonic and from a utilitarian perspective (Etemad-Sajadi, 2016; Moon et al., 2013; Xiao & Benbasat, 2014). CASA argues that the use of human characteristics in computers, such as language, voice, interactivity and social role, can improve users’ social responses even though they are aware that machines are not human beings. Moreover, the use of anthropomorphic social cues such as voice, text and face in computer interfaces enhance this effect (Tan & Liew, 2020). Hence, the use of virtual agents with high levels of interactivity and multiple graphic options, capable of interacting with consumers and making recommendations intuitively and enjoyably, has the potential to overcome some of the limitations of e-commerce (Mimoun et al., 2017; Tan & Liew, 2020; Xiao & Benbasat, 2014).
Several studies look at the impact of virtual agents on online usage (Etemad-Sajadi & Ghachem, 2015; Etemad-Sajadi, 2016; Holzwarth et al., 2006; Mimoun et al., 2017; Moon et al., 2013; Tan & Liew, 2020; Xiao & Benbasat, 2014). However, so far, virtual agents’ performance and adoption fall short of early expectations (Mimoun et al., 2017). In addition, there is still consumer scepticism and resistance against chatbot technology and lack of knowledge about its performance (Araujo, 2018). Research in this area also has produced mixed results and found unexpected effects of the use of more sophisticated virtual agents. For example, Ciechanowski et al. (2019) found better responses to a simpler text chatbot than to a more complex, animated avatar chatbot. Hence, we still do not fully understand consumers’ responses to virtual agents and there is a need for further research investigating how to use these features to improve navigation experiences (Pantano & Pizzi, 2020). In particular, there is a lack of research on their impact on website loyalty, especially in real-life contexts. We draw on extant research to develop a model of website experience, which is tested with users of an airline website before and after the introduction of a virtual customer service agent (VCSA). Central to the proposed model is the role of perceived enjoyment and social presence. We argue that website loyalty is a function not only of usability variables, specifically perceived usefulness (PU) and perceived ease of use (PEU), but also of the perception that using the website is pleasurable (Dickinger et al., 2008; Mimoun et al., 2017; Teo & Noyes, 2011). Studies show that perceived enjoyment is an important motivation for internet use (Hassanein & Head, 2007; Krasonikolakis et al., 2018) which is impacted by the aesthetics and social features of the website (Hassanein & Head, 2007; Lavie & Tractinsky, 2004; Mimoun et al., 2017; Tractinsky et al., 2006). Thus, we focus on social presence and perceived visual attractiveness as antecedents of the hedonic facet of website usage.
As such, the purpose of this study is to contribute to understanding website usage and loyalty and specifically whether the navigation experience varies with the presence of a VCSA on the website. A study in which real consumers evaluate their online experience before and after the introduction of a VCSA in the website is reported. In doing so, we test the proposition from previous studies that VCSAs can improve users’ experience both from a hedonic and a utilitarian perspective.
Literature Review
Virtual Customer Service Agents and Website Loyalty
Despite the growth of e-commerce, online shopping environments fail to fully replicate the richness of personal interaction with salespersons who can act as frontline brand employees, offer assistance and ultimately develop a consumer-retailer relationship (Mull et al., 2015; Tan & Liew, 2020). Extant literature encompasses a multifaceted body of research looking at the impact of various computer processes with different graphic designs and conversational abilities to enrich website usability, using various terms: conversational embodied agents; animated conversational agents; embodied virtual agents; virtual shopping agents; recommendation agents; online virtual agents; VCSAs and avatars, to name the most common, while chatbots and chatterboxes are mainly used to refer to disembodied conversational agents (Holzwarth et al., 2006; Lunardo et al., 2016; Mimoun & Poncin, 2015; Mimoun et al., 2017; Tan & Liew, 2020). In this study, the term VCSA is used to refer to ‘interfaces represented graphically with a physical body and thus have the potential to convey cues derived from facial expression and body gestures’ (Tan & Liew, 2020, p. 2).
VCSAs can play several roles in websites: (1) the helper that solves problems; (2) the friendly, sociable receptionist who welcomes users and (3) the personal shop assistant or recommendation agent (Liew et al., 2017; Lunardo et al., 2016; McGoldrick et al., 2008; Mimoun et al., 2017; Pantano & Pizzi, 2020; Tan & Liew, 2020; Wang et al., 2016; Xiao & Benbasat, 2007). Hence, VCSAs can increase the persuasiveness of online sales channels by allowing for social stimuli and human warmth in online store interactions (Mimoun & Poncin, 2015; Mull et al., 2015; Tan & Liew, 2020), thus contributing to improving online experience and website loyalty. The role and characteristics of VCSAs have been investigated in both commercial and non-commercial websites and have been found to enhance the navigation experience of specific segments (Chattaraman et al., 2014).
Achieving a broad base of loyal customers may be said to be the ultimate goal of businesses. Loyalty is ‘a deeply held commitment to re-buy or re-patronise a preferred product/service consistently in the future, thereby causing repetitive same brand or same brand-set purchasing, despite situational influences and marketing efforts having the potential to cause switching behaviour’ (Oliver, 1999, p. 34). In online transactions, loyalty, also referred to as e-loyalty, has been defined as the intention to visit and make purchases in the future (Forgas et al., 2012).
Several factors are related to website loyalty (Flavián et al., 2006). Below, a number of antecedents of website loyalty are discussed.
Perceived Usefulness, Perceived Ease of Use and Website Loyalty
According to the technology acceptance model (TAM) (Davis, 1989; Davis et al., 1992; Pinho & Soares, 2011), two beliefs are relevant for determining the attitude towards technology adoption: PU and PEU. PU refers to the expected increase in performance derived from adopting a given technology while PEU denotes the user’s expectation that adopting the technology will not involve significant effort (Davis, 1989). In online shopping studies, both PU and PEU have been positively related to the intention to purchase online (Ashraf et al., 2014). In the present study, we expect these factors to also have a similar impact on website loyalty. Thus, the following hypotheses are proposed (Figure 1):
H1: Perceived ease of use of the website has a positive impact on website loyalty. H2: Perceived usefulness of the website has a positive impact on website loyalty.
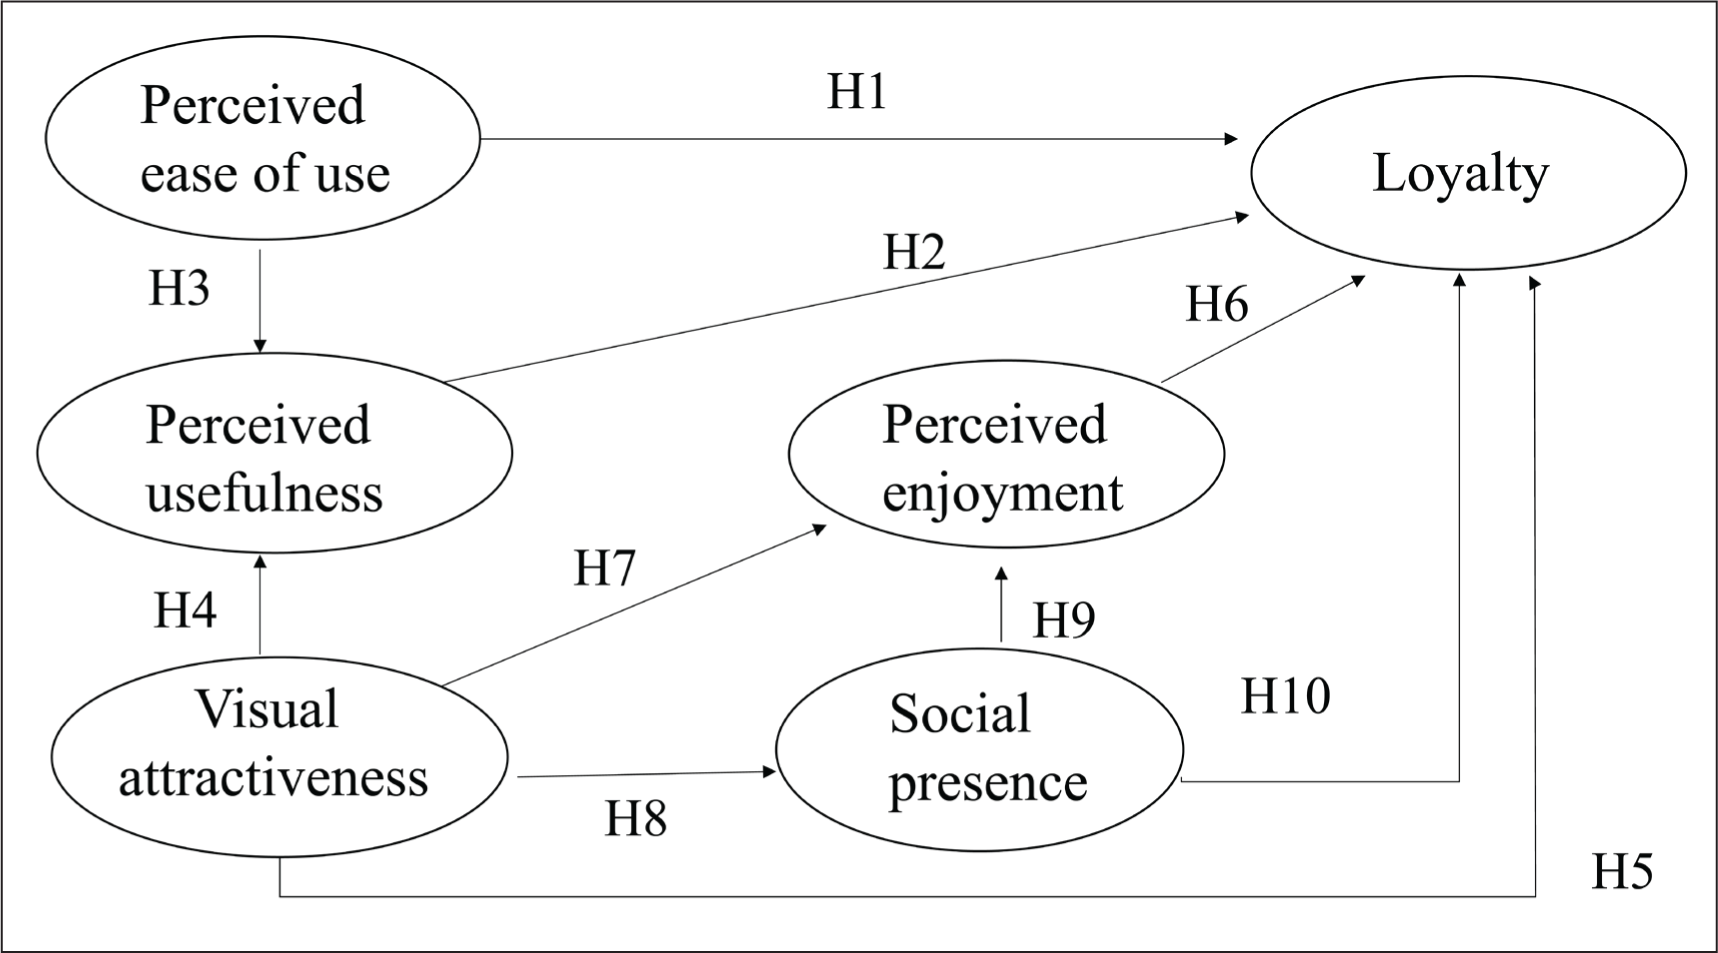
Moreover, TAM postulates a positive direct impact of PEU on PU (Davis, 1989; Davis et al., 1992). This is because the effort saved due to usage simplicity may improve performance. We expect this impact to hold in the context of website use. Hence, the following is proposed:
H3: Perceived ease of use (PEU) of the website has a positive impact on website perceived usefulness (PU).
Perceived Visual Attractiveness
Research in information technologies has acknowledged that, in addition to efficiency dimensions, visual aesthetics of interfaces contributes to users’ satisfaction and enjoyment (Lavie & Tractinsky, 2004; Lunardo et al., 2016; Tractinsky et al., 2006). The concept of perceived visual attractiveness has been proposed by Van der Heijden (2003) as an important factor in the decision to use a website. This concept refers to ‘the degree to which a person believes that the website is aesthetically pleasing to the eye’ (Van der Heijden, 2003, p. 544). Page aesthetics is one of the factors that may affect users’ decision to stay or go is Robins and Holmes (2008). Similarly, Cyr et al. (2006) found that design aesthetics positively influence the PU in mobile commerce while Lin and Chuan (2013) argued that an appealing shopping online environment had a positive impact in the length of stay and might enhance the probability of making a purchase on the website. Thus, this study proposes that:
H4: Perceived visual attractiveness of the website has a positive impact on perceived usefulness.
Studies have shown that user acceptance and attitude towards information technology products is impacted by visual attributes (Cyr et al., 2006; Yang et al., 2016). Similarly, this study proposes that:
H5: Perceived visual attractiveness of the website has a positive impact on website loyalty.
Perceived Enjoyment
In an early contribution, Davis et al. (1992) found that enjoyment has a significant effect on computer usage intentions. These authors define enjoyment as ‘the extent to which the activity of using the computer is perceived to be enjoyable in its own right, apart from any performance consequences that may be anticipated’ (Davis et al., 1992, p. 1113). Mimoun and Poncin (2015, p. 72) addressed enjoyment as ‘the extent to which the user finds the interaction intrinsically interesting or fun’. Van der Heijden (2003) acknowledges the importance of this dimension and includes this construct in an extended version of TAM which was tested in a study of website usage and showed that users’ perceived enjoyment positively impacts both the attitude towards use and intention to use. The concept has been subsequently included in studies in technology adoption that confirm the advantages of users’ perception that the system is enjoyable (Dickinger et al., 2008; Teo & Noyes, 2011). In a similar vein, Mimoun and Poncin (2015) found that playfulness had an indirect impact on purchase intentions and satisfaction with the website. Krasonikolakis et al. (2018) further highlight the importance of the visual interest of the online store environment as positively impacting consumer behaviour. Research has shown that virtual agents can impact perceived enjoyment (Liew et al., 2017; Tan & Liew, 2020). Hence:
H6: Perceived enjoyment has a positive impact on website loyalty.
In addition, Van der Heidjen (2003) found that the perceived visual attractiveness of the website has an impact on perceived enjoyment. Similarly, Cyr et al. (2006) found that design aesthetics has a positive influence on perceived enjoyment. Thus, the following hypothesis will be tested:
H7: Perceived visual attractiveness of the website has a positive impact on perceived enjoyment.
Social Presence
Social presence, also termed sociability or socialness, refers to the perception of sensitive human contact through the medium (Mimoun & Poncin, 2015; Wang et al., 2007; Wang & Fodness, 2010). This perception of social stimuli as courtesy, kindness, empathy and sympathy has been deemed important to overcome the consequences of the lack of face-to-face interactions between the consumer and the seller in online settings (Lunardo et al., 2016; Mimoun & Poncin, 2015; Tan & Liew, 2020). Robins and Holmes (2008, p. 390) contend that the overall aesthetics of the website, including mix of colours, layout, and so on, impact the ‘highly subjective reactions to stimuli presented when a user views a web site’ which occur unconsciously and that these authors term as ‘viscerally-based credibility judgments [that] occur without conscious analytical cognitive processes’. In what concerns VCSAs, research has noted that they can convey higher levels of social presence associated to display facial expressions and gestures (Etemad-Sajadi & Ghachem, 2015; Liew et al., 2017; Lunardo et al., 2016; Tan & Liew, 2020). A study by Wang and Fodness (2010) reveals that consumers’ perceptions of social presence, emotional answers and trust towards the online seller are more positive when an avatar with the capacity to be likeable and to create empathy with the consumer is present in the online store. These findings point to the importance of perceived visual attractiveness of websites as well as of avatars. For example, in a study of virtual worlds, Banakou (2010, p. 3) found that avatar appearance had an effect on social behaviour, that is, ‘users with the more elaborate avatar had a higher success rate in their social encounters than those users with the default avatar’. If avatars are absent, or the avatar is not able to generate empathy, those perceptions are less positive. Hence, the following is proposed:
H8: Perceived visual attractiveness has a positive impact on social presence.
According to Hassanein and Head (2007), despite the gap of research linking social elements to enjoyment, the most prominent psychological impact of website social presence may in fact be enjoyment. These authors find that social presence positively impacts the enjoyment of shopping websites, improving consumers’ attitude towards online shopping websites. Thus, the following hypotheses are proposed:
H9: Social presence has a positive impact on perceived enjoyment. H10: Social presence has a positive impact on loyalty.
In addition, this study aims to assess both the performance and importance (importance–performance map analysis [IPMA]) of different constructs (hedonic and utilitarian) when the website does not include a VCSA and when it does. Thus, the following hypothesis is proposed:
H11: VCSAs improve both the performance and importance of different hedonic and utilitarian dimensions.
Methodology
Data was collected using an airline company website which can be used for making ticket reservations and buying flights. This company redesigned its website to include a VCSA. There were no other changes on the website at that time. An anthropomorphic photo-realistic avatar was designed as a VCSA to answer questions concerning the use of the airline website. This situation provided a quasi-experimental design with two conditions: the without-VCSA setting corresponding to the survey applied before the website change, and the with VCSA condition, referring to the survey applied after the avatar had been introduced in the website. As such, the website change constituted an excellent opportunity to study the impact of VCSAs on a corporate website, with the advantage of referring to a major company, with high brand awareness and thousands of website users.
Data Collection Procedure
Two surveys were applied to the airline website users, before and after the introduction of the VCSA. For both waves of surveys, a random sample of 1,000 frequent flyers (out of a total of 73,825) was drawn. A list of frequent flyers rather than simply website users were chosen as these were deemed more likely to answer a questionnaire sent by the company. Using a sampling frame allowed us to exclude first wave respondents from the second survey. The following conditions were considered in the sampling process for both surveys: respondents were residents in Portugal, aged 18–65, had visited the airline site (for anonymity reasons, we will henceforth refer to this site as
Profile of the Sample
The vast majority of respondents in both samples are male (74%). Most respondents were born before 1980, which means that on average when considering the full sample, they are 37 years old or over. The great majority of the respondents (90%) have a high school diploma and around 60% belong to top management. It is also interesting to notice that around 60% in both samples use sporadically the airline website. On a scale of 1 (totally disagree) to 7 (totally agree), both the non-VCSA and VCSA samples recommend the site
Measurement Scales
Validated scales for the constructs of interest were sourced from the literature (Alves & Soares, 2013; Forgas et al., 2012; van der Heijden, 2003, 2004; Wang & Fodness, 2010). A parallel translation approach was used to ensure translation equivalence (Buil et al., 2012) (see Table 2 for the items used).
In what concerns PU, PEU and perceived visual attractiveness, three items per construct were adapted from Van der Heijden (2003). All items were measured using a 7-point Likert scale. For social presence, we used six items adapted from Wang and Fodness (2010) and Alves and Soares (2013). A 7-point rating scale (1 = Describes poorly/7 = Describes perfectly) was used to measure these items. Regarding perceived enjoyment, we resorted to prior work from van der Heijden (2003). Four 7-point semantic differential scaled items were used to classify the website navigation. Finally, the items that tap into loyalty were adapted from Forgas et al. (2012).
Data Analysis
To test our research hypotheses, data were analysed using both the Software Package for Social Sciences (IBM SPSS v.22) and the PLS with smartPLS 3.2.1 (Ringle et al., 2015). The major reasons why we chose PLS are the following: First, our model focuses on the prediction of dependent variables; second, the model employs both formative and reflective constructs; third, PLS is not very demanding concerning multivariate normal data (Hair et al., 2017; Roldán & Sanchez-Franco, 2012).
A feature that is commonly attributed to PLS is based on the fact that the measurement and structural model are estimated together but in both stages: (1) the assessment of the measurement model and (2) the assessment of the structural model.
The Measurement Model
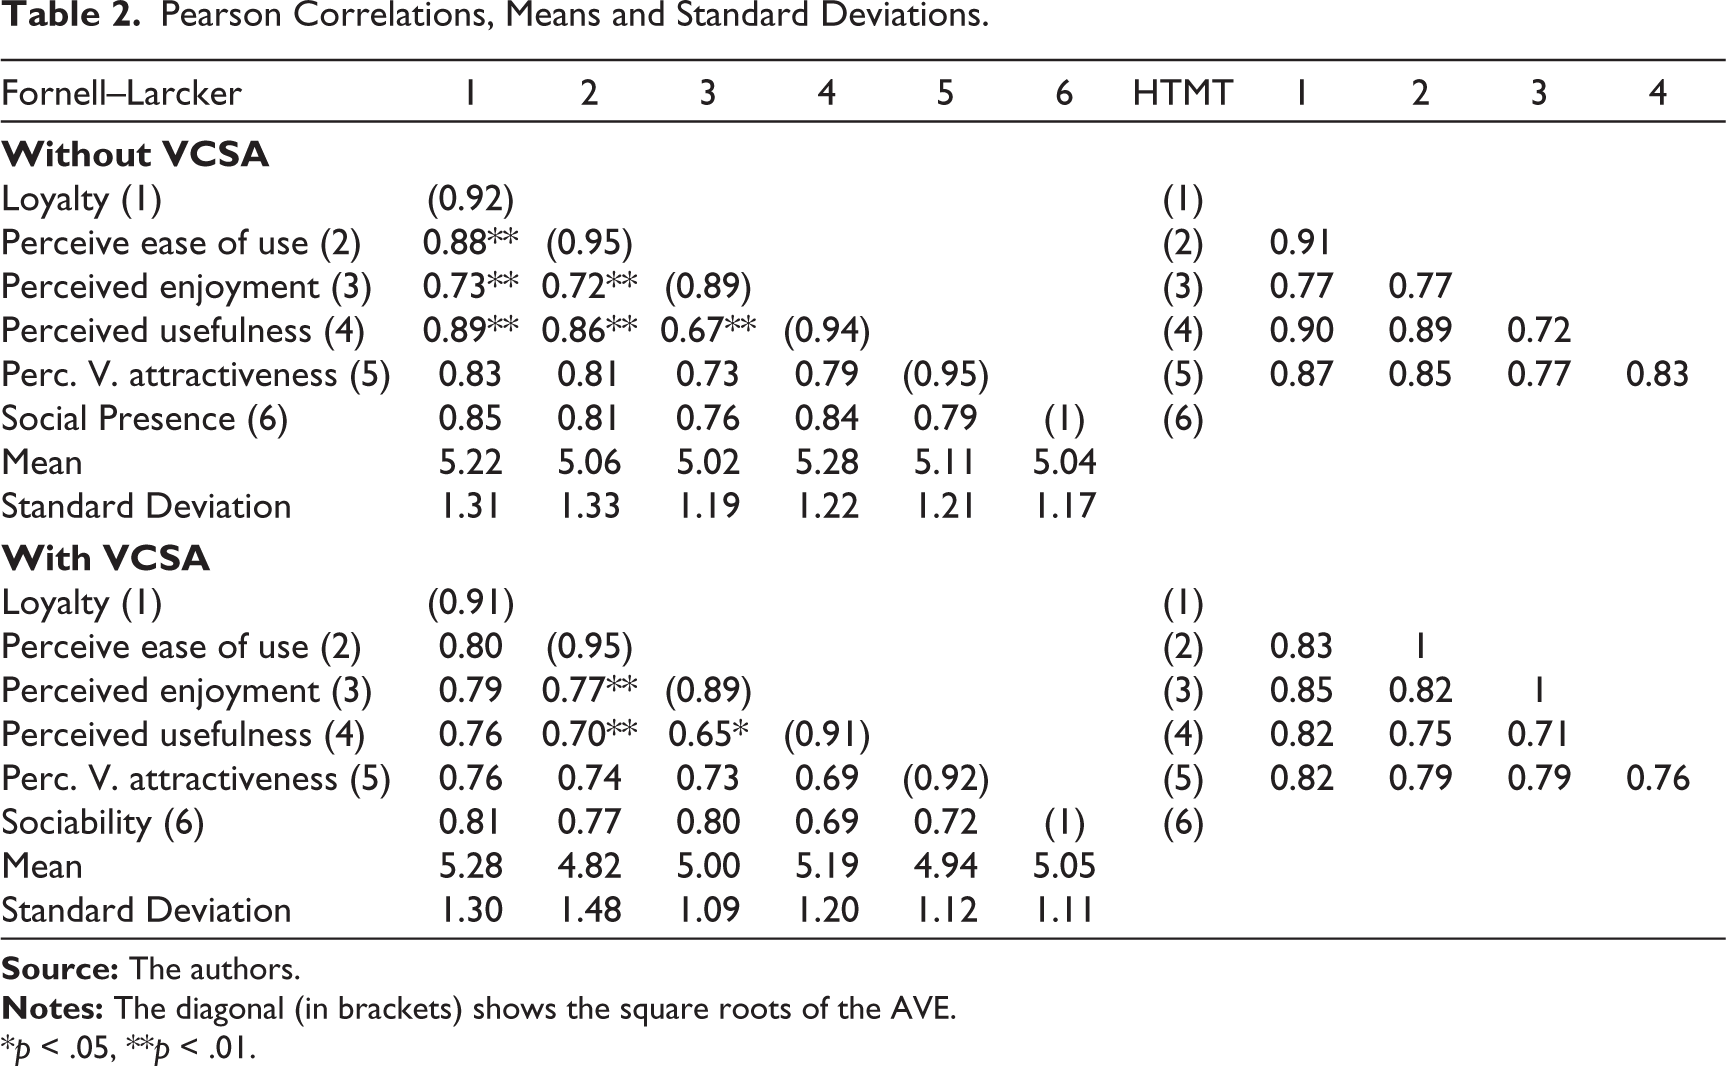
Consistent with Mackenzie et al. (2005), the construct of social presence was conceptualised as formative whereas the remaining constructs were considered as reflective. The rationale for operationalising social presence as a formative construct is twofold. First, social presence is formed by its indicators, which are considered as defining characteristics of the construct. Second, the latent variable is viewed as an effect rather than a cause and the indicators are not expected to be correlated with each other (Edwards & Bagozzi, 2000). Therefore, the potential multicollinearity among items as well as the analysis of their weights (Hair et al., 2017) should be computed. High collinearity between items may cause unstable estimates and make it difficult to isolate the distinct effect of an individual item on its purposed construct. Frequently, the maximum variance inflation factor (VIF) value for each variable suggests the presence of multicollinearity, that is, several authors define 5.0 as a cut-off point (Hair et al., 2017). In the present study, no item is above 5.0, so we may conclude that there is no reason to believe that we are in the presence of multicollinearity.
The following step requires the assessment of the weights, which measure the contribution of each formative item to the variance of the construct. To test the significance of the weights, a bootstrapping resampling procedure was computed. Of the set of items considered in the social presence construct, there are a few that are not significant; however, we decided to keep these items to maintain the integrity of this construct (Roberts & Thatcher, 2009) (see Table 1).
Measurement Scales (Factor Loadings and Reliabilities)
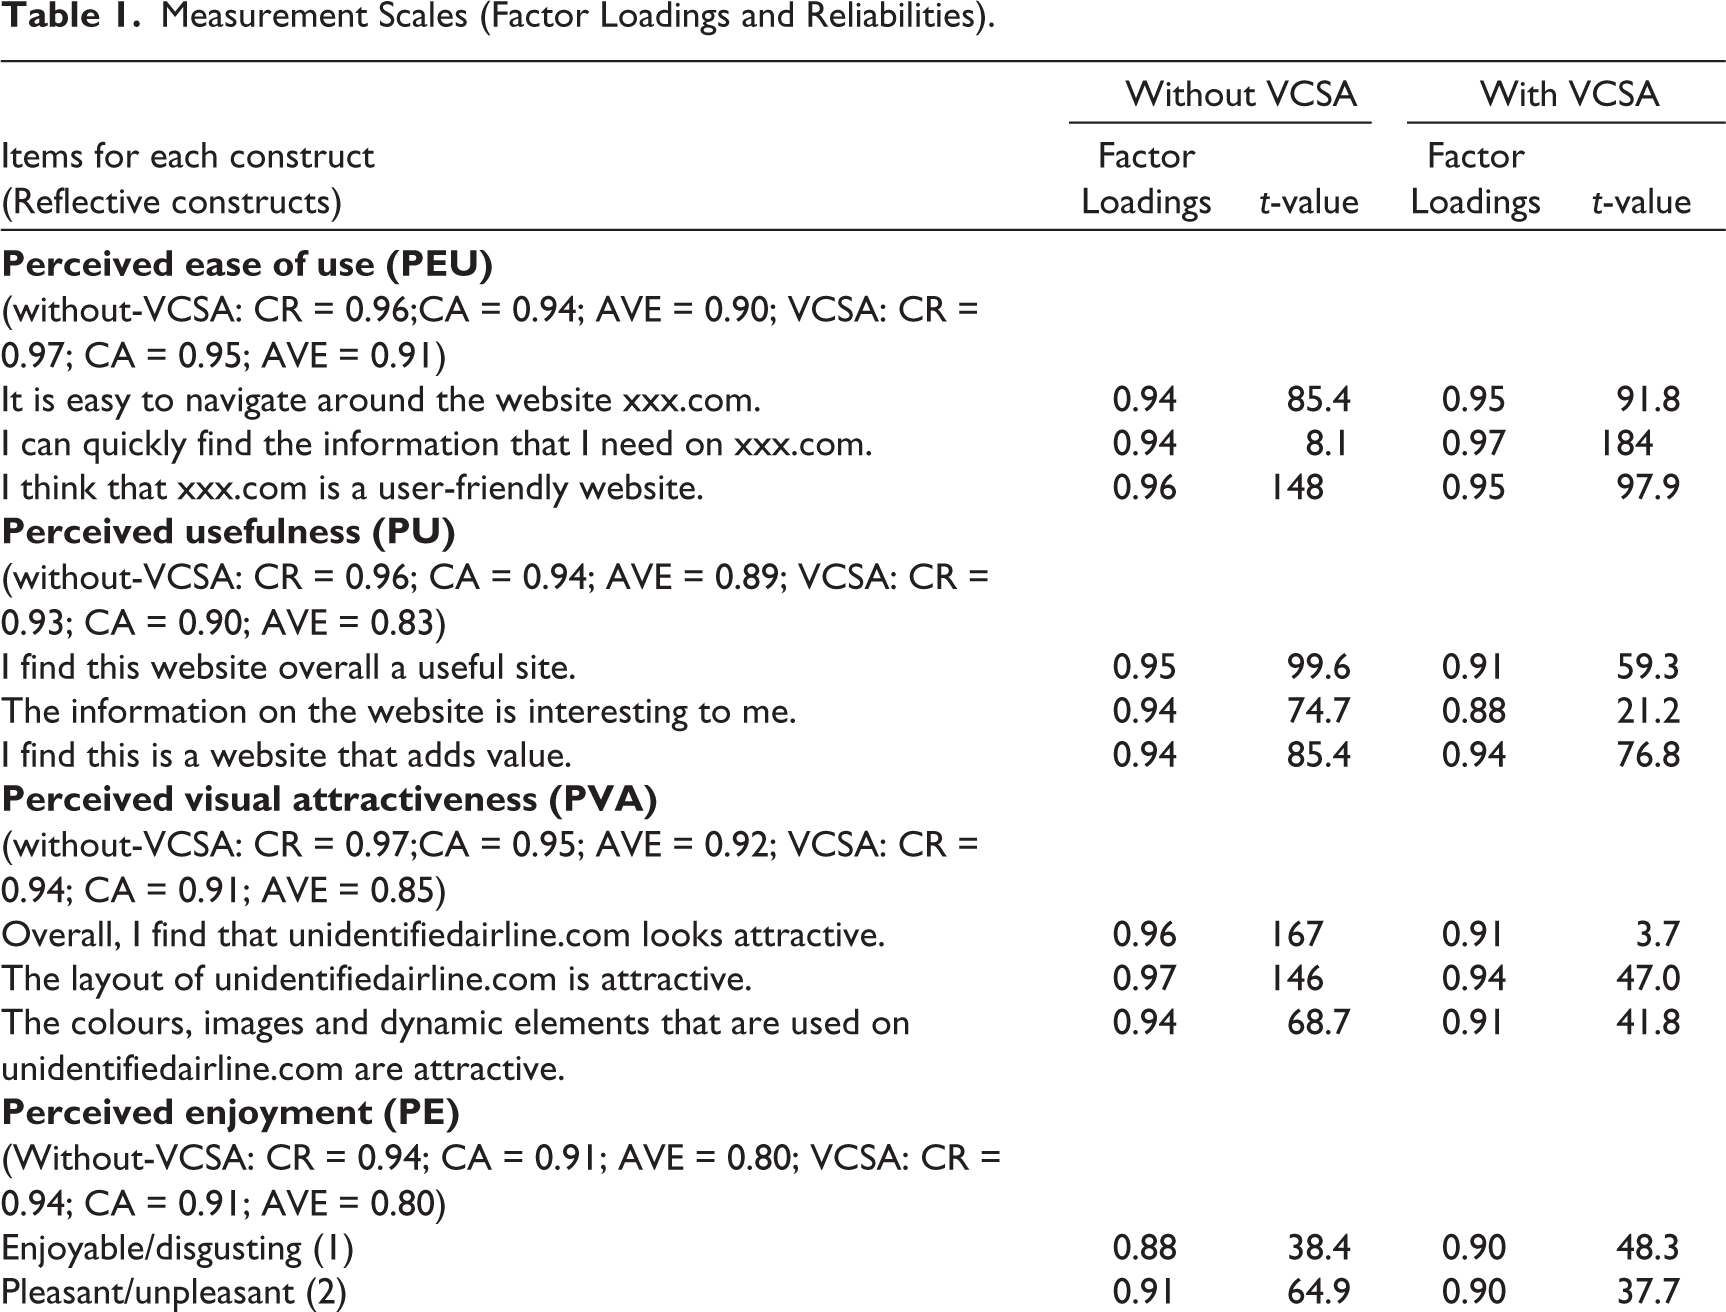
In turn, the measurement model for the reflective constructs is assessed in terms of individual item reliability, construct reliability, convergent and discriminant validity. In other words, we have examined the composite reliability and Cronbach’s alpha, all of which present values above 0.70 (Henseler et al., 2016). Convergent validity is shown by the significant standardised loading factors and the average variance extracted (AVE), which in the present study present acceptable values (see Table 1). As Table 1 illustrates, all reflective constructs satisfy the required psychometric characteristics.
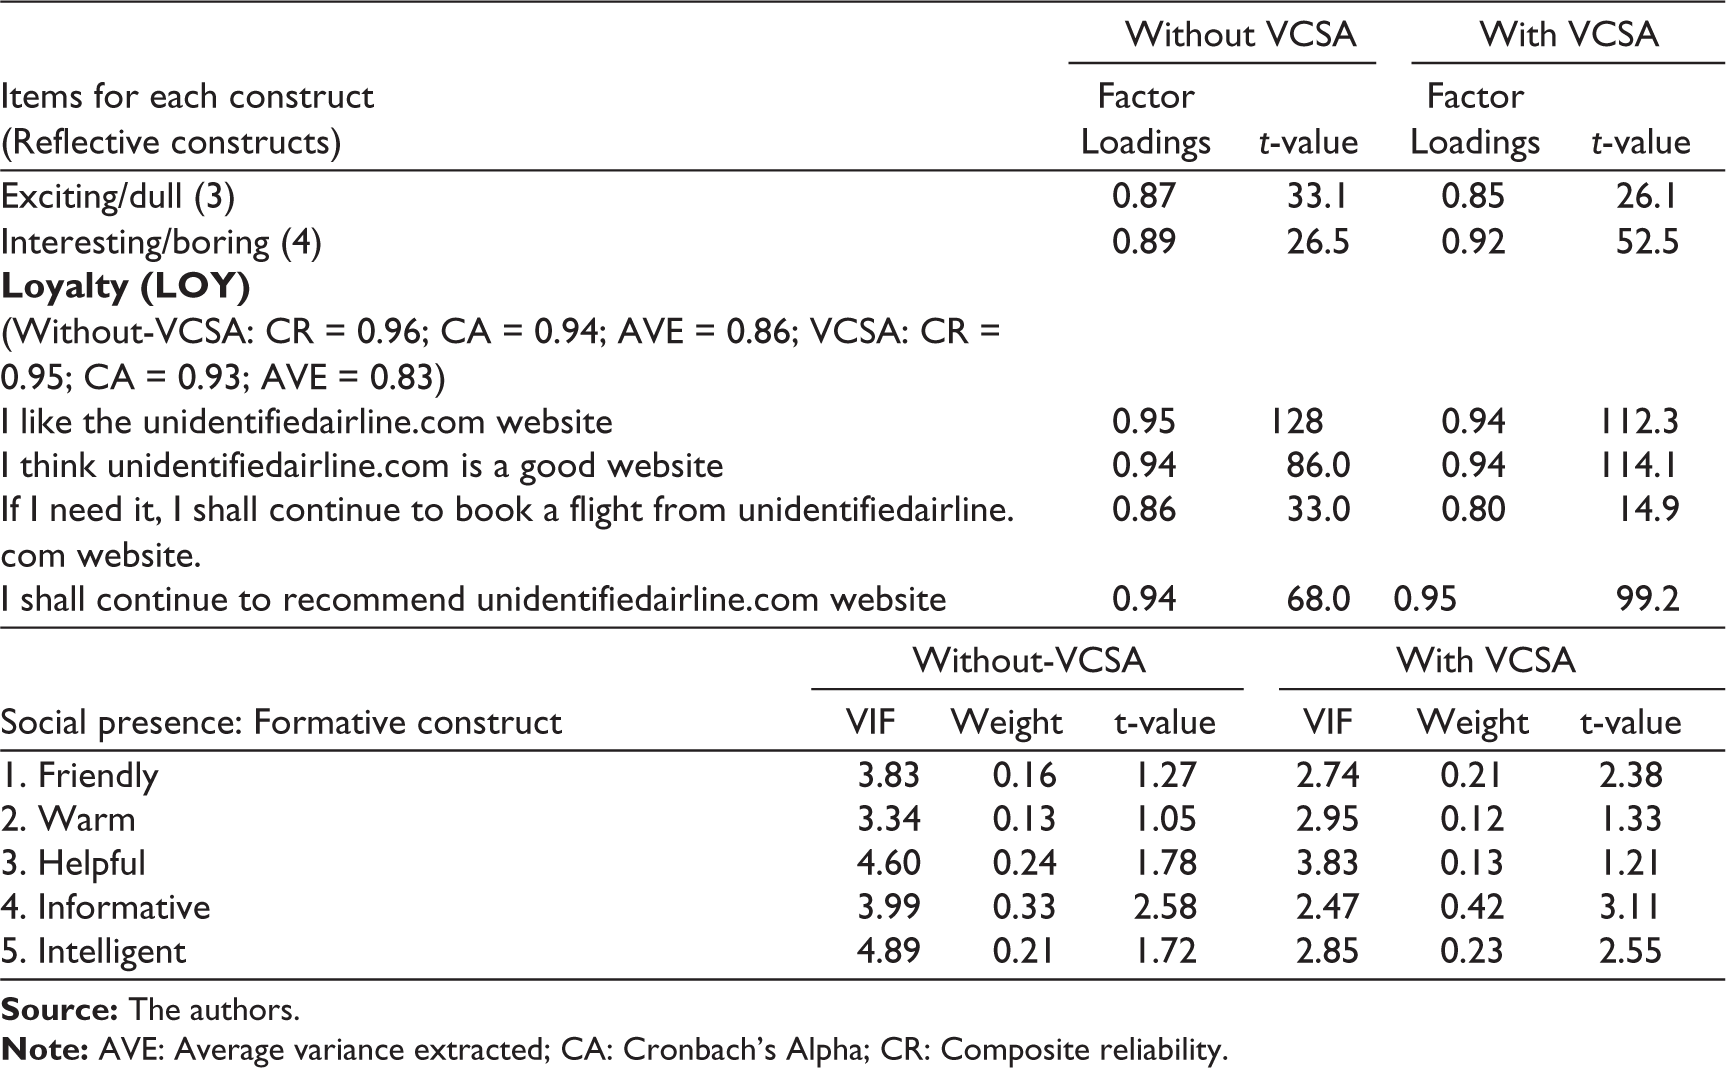
Concerning the discriminant validity, this study adopts two criteria. The first is based on the Fornell–Larcker criteria while the second is based on Heterotrait–Monotrait Ratio (HTMT) (Henseler et al., 2015). Concerning the former, we compared the square root of the AVE for each construct with the correlations between the focal construct and other constructs. For adequate discriminant validity, the diagonal elements of the correlation matrix should be greater than the off-diagonal elements. As can be seen in Table 2, the data meets this requirement. The second criterium is based on the HTMT whose values should be compared against a predefined threshold (Henseler et al., 2015). As the flexible criteria is defined to be at the 0.90 cut-off point, most values are within this range. Based on the aforementioned analyses, we may conclude that the proposed measurement scales show unidimensionality and internal consistency, allowing us to proceed with the analysis.
Pearson Correlations, Means and Standard Deviations
*p < .05, **p < .01.
The Structural Model
After achieving a satisfactory measurement model, the next phase relates to the assessment of the structural model. The structural model can be estimated throughout the statistical significance of path coefficients by using a bootstrapping procedure, the R2 values and the Q2 (redundancy) test for predictive relevance (Roldán & Sanchez-Franco, 2012). The bootstrapping procedure is used to generate t-statistics and standard errors, enabling one to test the proposed research hypotheses (see Table 3).
Results of Hypotheses Testing
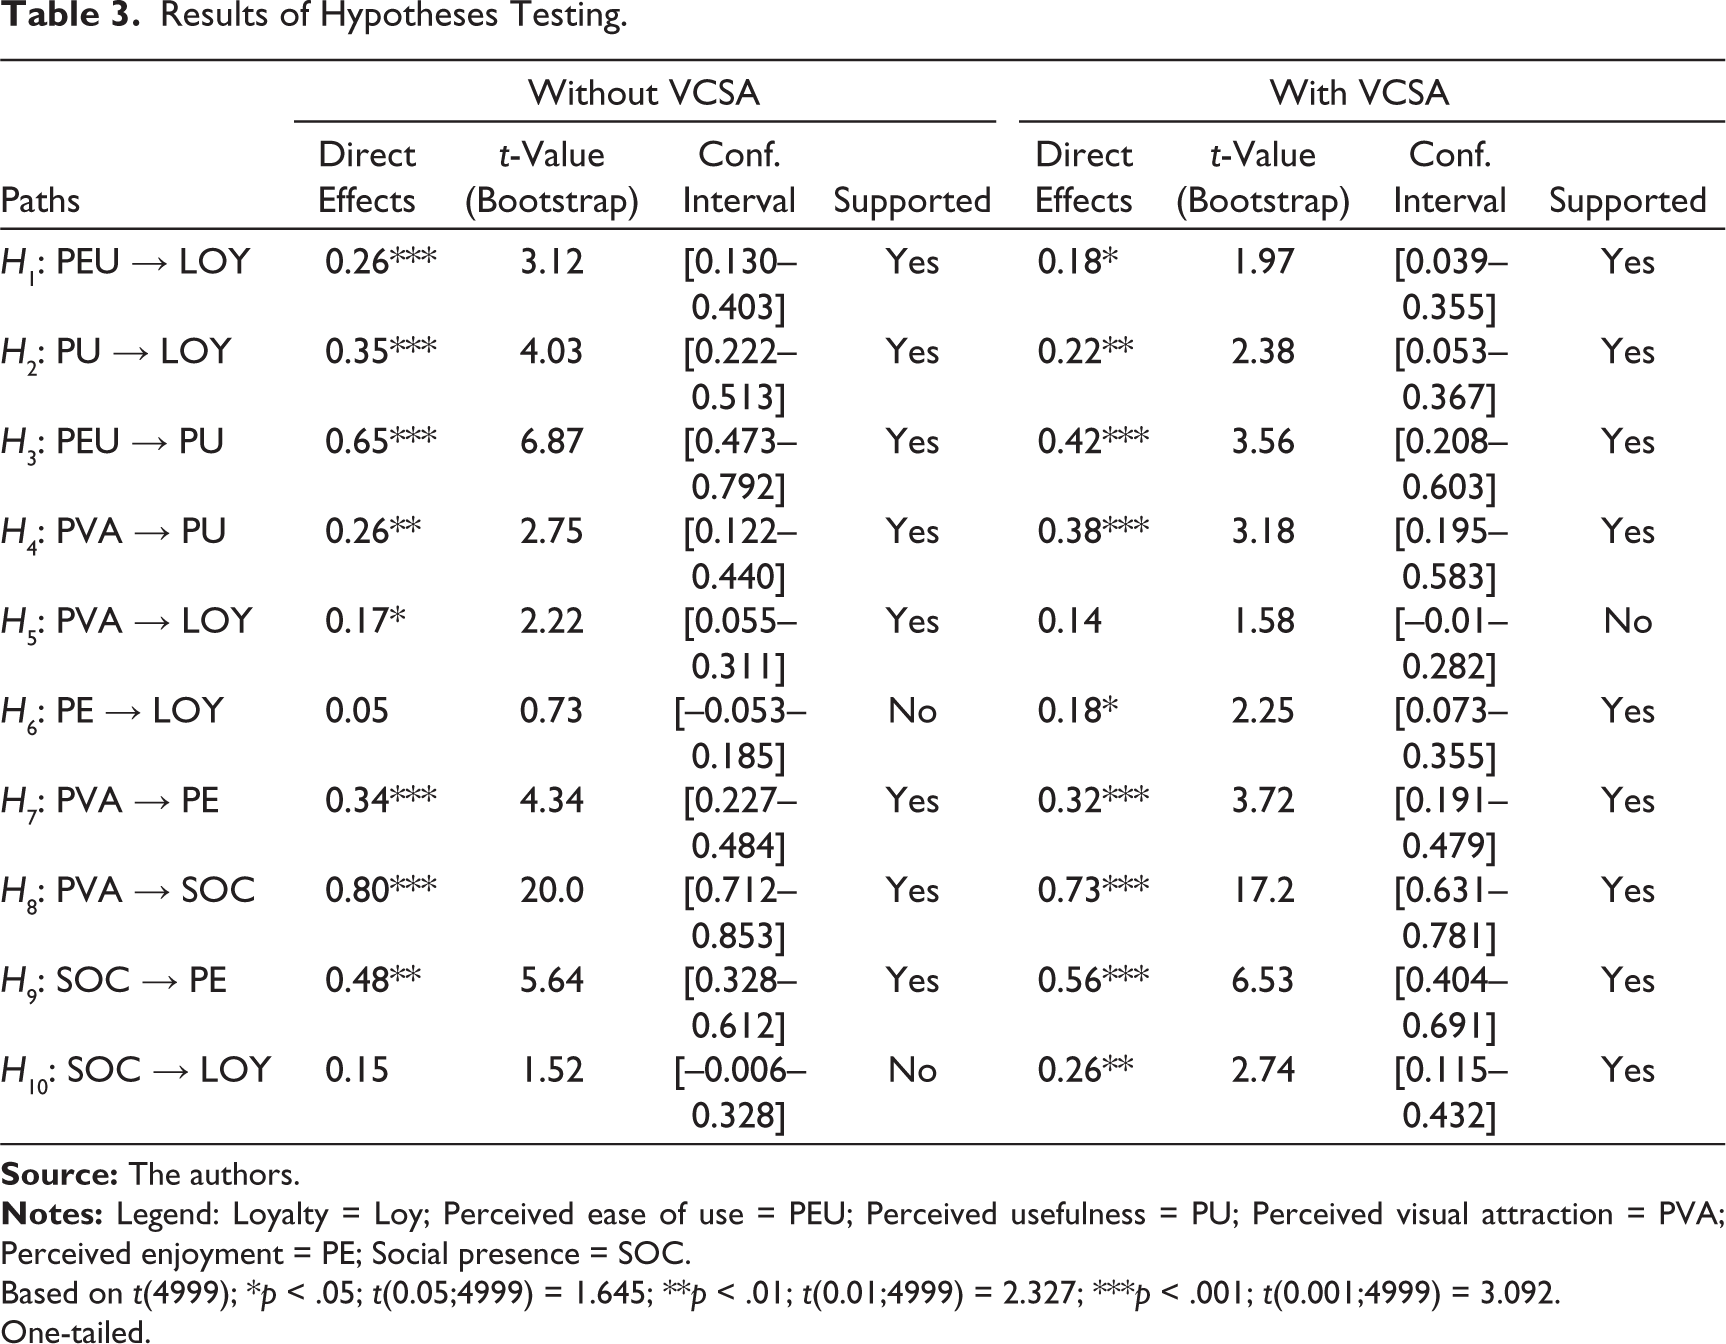
Based on t(4999); *p < .05; t(0.05;4999) = 1.645; **p < .01; t(0.01;4999) = 2.327; ***p < .001; t(0.001;4999) = 3.092.
One-tailed.
To assess the quality of the model, the coefficient of determination (R2), which represents the amount of explained variance of each endogenous latent variable, was computed (Hair et al., 2017). Thus, the proportion of the total variance of each endogenous construct explained by the model for the without-VCSA sample is 0.86 for loyalty, 0.77 for PU, 0.64 for social presence and 0.62 for perceived enjoyment. In turn, with regards to the VCSA sample, the proportion of the total variance is 0.80 for loyalty, 0.52 for social presence, 0.69 for perceived enjoyment and 0.56 for PU. The predictive power of the model was also examined by assessing the cross-validated communality and cross-validated redundancy index (Q2). A Q2 greater than zero is usually associated with high predictive relevance such as the case of the current model both for the without-VCSA and with VCSA samples.
Finally, the standardised root mean square residual (SRMR), a model fit measure well known in covariance-based methods and also implemented in the context of PLS, was computed. This measure of fit assumes a 0.08 cut-off point following Hu and Bentler (1999). The data reveals that both models show a good fit both for the without-VCSA sub-sample (SRMR = 0.05) and the VCSA sub-sample (SRMR = 0.06). Hence, it can be concluded that the structural model displays a good fit, so the following analyses are presented.
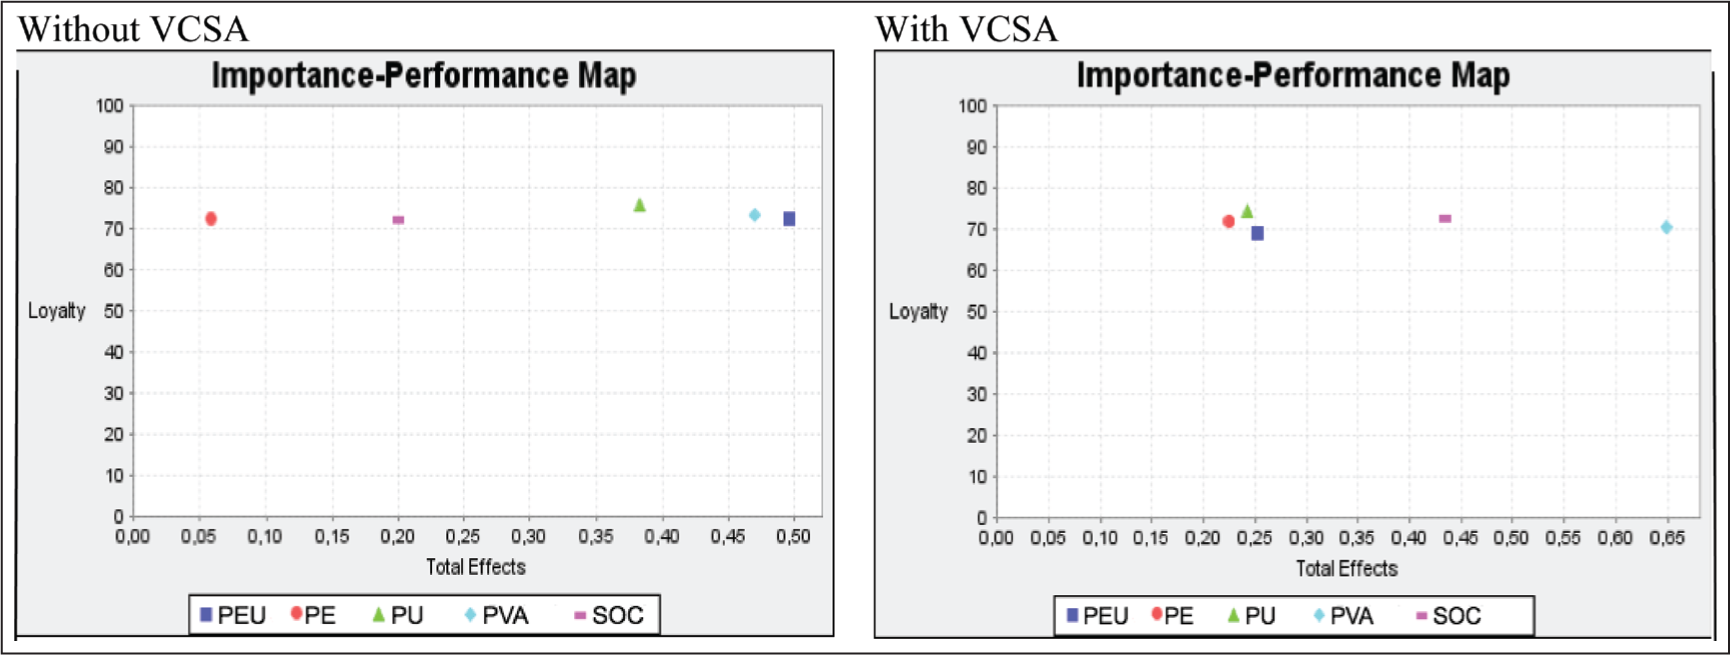
Importance–Performance of Hedonic and Utilitarian Dimensions on Loyalty
In order to validate H11, an IPMA was performed. This procedure contrasts the structural model total effects (importance) and the average values of the latent variable scores (performance) to underline significant areas of improvement (Schloderer et al., 2014). In Figure 2, we can see the importance–performance maps for both cases of the predecessor constructs shaping the target construct loyalty. All constructs in both groups show high latent index values (above 60%) for the performance dimension but no significant differences are depicted before and after the introduction of the VCSA. However, we can detect some rearrangements in the importance (total effects) of the antecedents in the results of the VCSA sample. As shown in Figure 2, before the introduction of the VCSA, the most important construct shaping loyalty is PEU; yet, in the VCSA setting, the most important construct is perceived visual attractiveness, although its performance index values are almost identical in both groups. It is also relevant to notice that social presence and perceived enjoyment also improve their importance in the VCSA group. We can conclude that there is an improved importance of different hedonic and utilitarian dimensions on loyalty; however, the way how these dimensions perform is somewhat identical in both groups. Hence, we can only partially support H11.
Discussion and Conclusions
This study aims to understand website usage and loyalty and specifically whether the navigation experience varies with the presence of a VCSA on the website. Our results support most of the proposed relationships for both conditions. Three major groups of findings are worth highlighting.
Starting with the findings relative to usability factors, the initial three hypotheses derived from the well-known TAM (Davis, 1989). The support for the impacts derived from this model was expected as it has been validated in different information technology settings. However, prior studies typically use behaviour intention as the dependent variable (Ashraf et al., 2014). Our study builds on and extends previous research in TAM by examining loyalty as an important determinant of a number of utilitarian and hedonic variables. Irrespective of the presence of a VCSA, both PEU and PU of the website have a positive impact on website loyalty, supporting H1 (β1 = 0.26/β2 = 0.18) and H2 (β1 = 0.35/β2 = 0.22) (β1 refers to the sample without VCSA and β2 to the sample with VCSA). PEU also has a positive impact on the PU of the website, thus supporting H3 (β1 = 0.65/β2 = 0.42) for both datasets. Regarding the impact of VCSA, it is noteworthy that these results are in line with the finding that the use of virtual assistants might improve users’ perceptions of utilitarian shopping value (Mimoun & Poncin, 2015).
The second group of findings concerns perceived visual attractiveness and social presence, and their impact on perceived enjoyment. These constructs have been far less studied. Concerning H4, the impact of perceived visual attractiveness on PU is supported in both datasets (respectively, β1 = 0.26 and β = 0.38). With regards to H5 (β1 = 0.17/β2 = 0.14), referring to the impact of perceived visual attractiveness on loyalty, the data supports this relationship only in the without-VCSA setting. In what concerns the relationship perceived enjoyment-loyalty H6 (β1 = 0.05/β2 = 0.18), there is a significant relationship only in the VCSA condition. The study also supports H7 (β1 = 0.34/β2 = 0.32), which maintains that perceived visual attractiveness has a positive impact on perceived enjoyment. These are relevant findings which lend strong support to the importance of the visual attributes of websites and virtual assistants (Cyr et al., 2006; Lavie & Tractinsky, 2004; Lunardo et al., 2016; Mimoun & Poncin, 2015; Tractinsky et al., 2006; Van der Heidjen, 2003). Although several researchers have studied this connection using different devices, for example, mobile phones, far fewer studies have looked at websites. H8 (β1 = 0.80 and β2 = 0.73), which maintains that perceived visual attractiveness has a positive impact on social presence, is also supported. These findings are in line with research about the importance of perceived visual attractiveness of online interfaces (Banakou, 2010; Wang & Fodness, 2010) and add to the literature showing that perceived attractiveness of virtual assistants prompts perceived social presence (Hassanein & Head, 2007; Lunardo et al., 2016; Mimoun & Poncin, 2015). The same result was obtained for H9 (β1 = 0.48 and β2 = 0.56), which maintains that social presence has a positive impact on perceived enjoyment. Finally, this study also examines whether social presence has a positive impact on loyalty (H10). This relationship is only supported for group 2 (β2 = 0.26), it is not supported for group 1 (β1 = 0.15). These results support the hedonic shopping value of VCSA (Mimoun & Poncin, 2015).
Finally, there are a few differences in the direct relationships between the without-VCSA and VCSA settings that are worth emphasising, specifically in what refers to H5, H6 and H10. Concerning H5 (perceived visual attractiveness—loyalty), the relationship is only supported in the without-VCSA condition. Although this result may seem slightly surprising, a possible explanation relates to the fact that there are potential mediating variables or indirect relationships that may intervene in this link. The opposite situation is found in the perceived enjoyment—loyalty (H6) and social presence—loyalty (H10) relationships, which are only supported in the VCSA dataset. In addition to the previous explanations, and because we are in the presence of two social-driven or hedonic variables (perceived enjoyment and social presence), these two findings may be explained by the fact that the inclusion of the VCSA fosters the pleasure and the human warmth experienced in the website navigation. These findings partly lend support to the notion that the perception of social presence, even if it is virtual-based, can contribute to improving the user experience and potentially mimic the human contact of face-to-face interactions (Mimoun & Poncin, 2015).
Regarding H11, and considering the IPMA procedure, the presence of a VCSA does not seem to exercise a major effect on performance index values, concerning the navigation experience and loyalty. Concerning the utilitarian dimensions (PEU and PU), these show a very close positioning in the VSCA setting. One possible explanation has to do with the e-literacy of our sample. It is interesting to notice that the most important dimension in the formation of website loyalty is perceived visual attractiveness rather than PEU. Interestingly, the social presence and perceived enjoyment constructs also gain importance in building loyalty in the VCSA setting. Results also suggest that the perceived visual attractiveness has a particular importance on loyalty in both conditions. Hence, we may conclude that although their importance is recognised in the VCSA setting, however, looking at the Y-axis (performance) both the hedonic and the utilitarian dimensions have still some room to improve.
Managerial Implications
From a practitioner’s point of view, these findings provide useful guidelines for designers of online shopping websites. Usability factors are important, of course. However, aesthetics and social cues contribute to a pleasurable, stimulating navigation and purchase experience. As pointed out by Hassanein and Head (2007, p. 689), ‘Shopping experiences that involve positive emotions have been linked to several important outcomes, such as increased time spent in the store, increased spending and increased unplanned purchasing’. Thus, changes that improve the online experience through enhanced enjoyment and social presence will likely have an impact on website use.
Contributions and Limitations of the Study
The results of the present study have relevance for both interactive marketing theory and practice. Our study adds to the understanding of the determinants of website usage and loyalty. Our contribution is twofold: First, we develop and test an overall model of website loyalty antecedents, specifically utilitarian, social, aesthetics and hedonic factors; Second, this model is tested using a survey of frequent flyers of an airline before and after the introduction of a VCSA as a feature of the website. Our study is especially relevant since not much research about website usage has been carried out with ‘real internet users’.
As with any study, this research has some limitations which provide opportunities for future studies. A possible limitation of our study is the fact that the second survey was carried out shortly after the introduction of the VCSA. In fact, the majority of the respondents had not used the VCSA. When asked about the reason for that, some respondent mentioned that they did not need it or that they did not find the VCSA useful or particularly relevant. This fact may partly explain why we did not find strong differences between the two samples (without and with the VCSA).
In addition, our respondents were frequent flyers who may be very familiar with the site and not feel the need for assistance. As such, they may not have seen the inclusion of an VCSA as making a substantial difference in their overall website experience thus limiting the assessment of the navigation experience in the VCSA setting. Future research could be carried out with different consumer segments, for example, less-educated and less-experienced users, who may value more a VCSA (Chattaraman et al., 2014). Finally, it would be interesting to study the impact of a VCSA for those consumers who are more reluctant to resort to the website.
Footnotes
Declaration of Conflicting Interests
The authors declared no potential conflicts of interest with respect to the research, authorship and/or publication of this article.
Funding
The authors received no financial support for the research, authorship and/or publication of this article.