
Abstract
Social networks influence technology diffusion but targeting formal leaders (institutional central nodes) may lead to distributional consequences. This paper analyzes the role of informal social networks in technology diffusion in a socially hierarchical caste-based society. Often, information flow and technology diffusion are constrained by social and economic boundaries where informal nodes such as caste play a very decisive role in everyday life. Proper targeting and dissemination of technology to the marginalized sections of society are very important for their development. We observed that only one-fourth of farmers cultivate newer varieties which include hybrids and recently released high yielding varieties. The results showed that individuals belonging to marginal groups are influential and act as informal leaders when they are the dominant caste in the village. Progressive farmers are found to fail in disseminating new varieties, and targeting influential informal leaders who belong to the dominant caste of the village appears to be a better strategy. Among non-dominant caste members, influential leaders belonging to Other Backward Classes (OBCs) or Scheduled Tribes (STs) are more desirable targets than other caste groups. The more concentrated a network is in terms of its caste composition, the faster will be the spread of any technology.
Introduction
Improved agricultural technologies increase agricultural productivity or farm income and help improve the livelihoods of the poor. However, the challenge lies in the effective targeting and dissemination of these technologies. In this paper, the adoption of improved rice varieties is taken as an example to study the effect of caste-based networks on technology diffusion. Seeds are one of the most critical inputs in agricultural production; the response of all other inputs depends on the quality and genetic makeup of the seeds. A sustained increase in agricultural production and productivity requires the continuous development of new seeds suited to various agro-climatic regions and the efficient production and supply of those improved varieties to users so as to achieve faster seed replacement and varietal turnover. However, the Indian seed system is inherently very complex and unique, having responsibilities and roles intertwined between different (formal and informal) institutions at national, state, and regional levels and involving public and private partners. Several institutions and organizations such as research institutes (variety development and nucleus/breeder seed generation), certification agencies and national and state seed policies play a vital role in this system.
Several legislations and policy initiatives have been implemented by the Government of India to govern the seed sector. The Seed Act 1966 is the main act regulating the seed industry in India. This act lays down guidelines for the minimum levels of physical and genetic seed purity, germination, labelling and certification. It also provides a system for seed quality control through independent Seed Certification Agencies (SCAs), which fall under the purview of state agricultural departments (Gadwal, 2003). The National Seeds Policy 2002 seeks to provide an appropriate climate for the seed industry to utilize available and prospective opportunities, safeguarding the interests of Indian farmers and the conservation of agro-biodiversity. It recognizes the 10 thrust areas for strengthening this purpose—variety development and plant variety protection, seed production, quality assurance, seed distribution and marketing, infrastructure facilities, transgenic plant varieties, import of seeds and panting materials, export of seeds, and promotion of domestic private seed sector industry and strengthening of the monitoring system. There is also a Seed Bill (2019) pending in the Indian Parliament, which seeks to replace the Seed Act, 1966 and has been revised several times, in 2004, 2008, 2010 and 2011 (Singh & Chand, 2011) to overcome the drawbacks of the original bill. The primary objective of this bill is to regulate the quality of seed for sale, import and export and to facilitate the production and supply of quality seeds. A healthy seed industry will lead to the availability of enhanced quality seeds to the farmers at competitive prices.
However, these legislations and policies mostly focus only on the organized or formal channels of seed dissemination. In India, farmers rely on the informal system for more than 80 per cent of their seed supply (Scholey & Padmanabhan, 2017). As per the Economic Survey of 2010–2011, more than four-fifths of farmers rely on farm-saved seeds. The State of Indian Agriculture Report, 2015–16 mentions that the organized sector which includes both public and private companies accounted for 30–35 per cent of the total seeds distributed in the country. The rest was comprised mainly of farm-saved seeds. Hodgkin et al. (2007) note that unlike market-based systems, informal seed exchanges are determined by cultural and social norms, and the operation of these systems is a key element in maintaining genetic diversity on farms. Hence it is important to note that the unorganized or informal channels are the ones that dominate the system. By unorganized channels, we refer to the informal social networks among farmers through which they exchange farm-saved seeds, technology, and information. Serrat (2010) defines social networks as nodes of individuals, groups and organizations that tie in one or more types of interdependencies. These interdependencies include shared values, visions and ideas, social contacts, kinship, conflict, financial exchanges, trade, joint membership in organizations and other aspects of human relationships.
However, informal social networks among farmers are one of the dynamics that has been relatively less explored (Maertens & Barrett, 2012). A lack of understanding about how such social informal networks function with regard to technology adoption can at times adversely affect the effective targeting and dissemination of technologies, or in this case spread of seeds of improved rice varieties. This holds true particularly in a developing country such as India where landholdings are small and fragmented. According to the Agricultural Census 2010–11 conducted by the Ministry of Agriculture (Government of India, 2014), the small and marginal landholdings (below 2 ha) constituted 85 per cent of the total farming community, cultivating nearly half of the total cultivated area. Furthermore, the average size of holdings has declined over the years and it has come down to 1.15 ha in 2010–2011 from 2.28 ha in 1970–2071. In addition to this, farmers in India are heterogeneous in terms of their socioeconomic status. India has a complex and hierarchical social system in which caste plays a decisive role in everyday life as well as in the policy fabric of the regional, state, and national system. The caste category to which an individual belongs often determines their access to goods and services, information and even their social connections (Desai & Dubey, 2012). Caste is one of the important factors based on which social connections or networks are formed in India (Munshi, 2014); hence, in this paper we look at an important characteristic of village-level informal social networks caste.
Given the complexity of informal social networks and the role caste plays in various aspects of an individual’s life, we hypothesize that 1) informal social networks are concentrated within a caste group and varietal diffusion depends on these informal networks; 2) the caste system acts as a barrier to diffusion of new technology due to the presence of stronger intra-caste networks; and 3) central (influential) leaders in these caste-based networks are better nodes than progressive farmers for diffusing new technologies. Traditionally, formal extension systems target ‘progressive farmers’ to disseminate information and technology in the village.
The rest of this paper is organized as follows: Section 2 discusses the existing economics literature on caste and social networks. Section 3 discusses the study site and the sampling procedure used. Section 4 describes the data collected. Section 5 describes the methodology used to estimate social networks and model varietal adoption. This is followed by Section 6, which summarizes the results, and Section 7 which offers some conclusions.
The Literature
Social Networks
The adoption of improved technologies by farmers is not immediate. To understand the diffusion of any technology, it is important to understand the dynamics involved in the process of technology adoption. Beaman et al. (2018) argue that lack of information is one of the constraints to technology adoption and that social relationships serve as an important medium through which individuals can learn about and eventually adopt new technologies. The authors use a threshold model of diffusion, which posits that individuals adopt a technology if they are related to at least a threshold number of adopters, to conduct an experiment on agricultural extension in Malawi. They use extension services as their example because evidence shows that social learning plays a vital role in technology diffusion. The authors identified entry points or ‘seeds’ in a village for the dissemination of information and compared adoption against traditional extension pathways. They found that targeting specific farmers based on the theory of diffusion increased adoption by 3 per cent compared to traditional extension workers. They suggest that identifying the right person in a village, based on social network theory, and then training them can increase adoption of new technologies, and that diffusion would be more extensive if these entry points are utilized.
In his paper on diffusion of innovation in heterogeneous populations, Young (2009) highlights three types of diffusion models where there is internal feedback from prior adopters to future adopters. The first model is based on a contagion effect where one assumes that people adopt as soon as they come into contact with people who have already adopted a technology. In the second model, the social influence model, people are said to adopt a technology when enough people in a group have adopted it. Finally, in the 3rd social learning model, people adopt only when there is enough evidence to convince them that the innovation is worth adopting.
As described in the social learning model, farmers usually tap their connections for information regarding the feasibility and profitability of new technologies before they decide to adopt it. New technologies are often introduced to progressive or model farmers in a village with the hope that other farmers will observe their benefits and adopt them. Extension services often rely on this assumption while targeting the dissemination of any technology to the farmers (Magnan et al., 2013). Although this approach assumes that all farmers in a village can also be influenced by one individual’s decisions and follow suit, the reality might be different. Adoption decisions do not always depend on the whole village but can also be contingent on farmers’ networks. This holds particularly true in the context of rural India, where social structures such as caste play a role in influencing village dynamics (Matuschke & Qaim, 2009).
Glendenning et al. (2010) explain that although India uses a variety of extension service approaches, farmers often do not have access to any information source. This ultimately has a detrimental effect on their income and poverty levels. The authors conclude that developing an extension system that understands farmer behaviour, and communication through social networks, are vital. An example of the importance of studying informal social networks is a study by Murendo et al. (2015) on mobile money adoption in Uganda. This study found that learning within networks helps to diffuse information about mobile money faster and also increases its adoption. The authors recommend that programs that promote the use of this technology should do so through social networks.
In their paper on capturing social networks effects in the diffusion of hybrid rice in Bangladesh, Ward and Pede (2014), find neighbour effects to be a significant determinant of hybrid rice adoption. They show that in comparison to interactions with agricultural extension officers network effects are much stronger and that a network with nearby hybrid rice adopters is more influential than a network of distant adopters. The authors point out that networks based on location, kinship, friendship and religion can help in the dissemination of technologies to farmers. According to Bandiera and Rasul (2006), based on their study on social networks and technology adoption in Mozambique, adoption decisions in the case of sunflowers by farmers are correlated with the choices of their family and friends and not correlated with those individuals of different religions. Also, Case (1992) finds strong neighbourhood effects when it comes to the adoption of a new technology in Indonesia. According to her, neighbours influence farmers’ decisions to adopt a technology. The author cautions that ignoring these interactions between farmers could lead one to overestimate the effect of household characteristics on adoption decisions. In a similar study, Conley and Udry (2010) found that in the case of pineapple cultivation in Ghana, farmers adjust their inputs in accordance with information from neighbours who were successful in earlier periods. The authors highlight the importance of social learning, and the network connections through which information flows, in farmers’ cultivations decisions. Based on a panel data set from the Indian Rural Incomes Survey, 1968–1969, Foster and Rosenzweig (1995) also find evidence of learning spill-overs. They show that farmers with experienced neighbours are significantly more profitable than those with inexperienced neighbours. Hence, understanding informal social networks is crucial for targeting technologies in a better and more effective manner. Social network analysis can thus impact policies and programs, including their design, implementation, and results (Serrat, 2010), if ways to harness its potential can be identified.
Caste
The Indian caste system is a system of closed social stratification and occupational transmission through generations, wherein a person’s status in society is largely based on the caste into which he or she is born (Debnath & Jain, 2015). Freitas (2006) mentions that a caste possesses five characteristics: occupational specialization, purity scale, hierarchy, commensality and ascription. Traditionally, members of a sub-caste, or jati, are ascribed a particular occupation which is ranked based on purity. Caste is an endogamous and rigid system that separates and ranks people right from their birth. Historically, there have been castes that by virtue of their birth have enjoyed certain privileges and positions of power, which have been denied to the marginalized castes (Deshpance, 2010).
The Indian Constitution seeks to safeguard the interests of these marginalized groups who have been discriminated against. Part III, Articles 15, 16, and 17 of the Constitution, prohibits discrimination on the grounds of religion, race, caste, sex, or place of birth. For administrative purposes, the lower or marginalized castes have been classified into three categories: Scheduled Castes (SCs), Scheduled Tribes (STs), and Other Backward Classes (OBCs). SCs are groups that were treated as ‘untouchables’ and are among the lowest-ranked jatis. STs refer to tribal communities, while OBCs comprise the low (but not untouchable) to middle-ranking caste groups considered to be socially and economically ‘backward’ (Goel & Deshpande, 2016). Conforming to affirmative action policies, the Government of India provides for reservations to these groups in state and central educational institutions, legislatures, and government jobs. The fourth category used in this study is the ‘General Category’, which includes those groups that have historically been the privileged and upper castes. In our study, we have classified the farmers into these four groups. We have also used a 5th category, ‘Minority’, 1 which consists of all those who belong to non-Hindu religious groups (Debnath & Jain, 2015).
In Indian villages, caste plays a crucial role in terms of people’s access to resources. Customarily, higher and landowning cultivating castes dominate the agricultural sector in their role as landlords while lower castes perform farming activities as tenants or wage labourers. Villages in India are often divided into hamlets that are inhabited by people belonging to a particular caste category, and exchange of resources and information across these hamlets is often restricted by their caste composition. The chances of social networks being concentrated within caste groups are high. Caste- or religion-based segregated informal gatherings are very frequent in villages, where people often share information.
Another feature which can be observed in rural Indian villages is that of the dominant caste, a concept introduced by Srinivas (1959, 1966). According to this theory, certain caste categories enjoy a dominant position in a village not necessarily because of their higher position in the caste hierarchy but due to a combination of factors—ownership of a sizable proportion of the arable land, the strength of numbers, and a high to middle position in the local caste hierarchy. In his study of caste in Rampura village in Mysore, Srinivas found that the cultivating peasant caste formed the dominant caste because they were the biggest landowners and were more populous, even though in terms of hierarchy they ranked well below the upper caste Brahmins.
Social transactions such as marriage (Bidner & Eswaran, 2015; Debnath & Jain, 2015) and economic transactions such as risk pooling and investments (Banerjee & Munshi, 2004; Ligon, 1998) also tend to be concentrated within the sub-caste. Desai and Dubey (2011) argue that a social structure based on caste has over the years translated into unequal access to land, education, business ownership and occupation. The authors also point to inequality in outcomes, as highly qualified individuals belonging to lower castes face economic and social discrimination. Lower castes have unequal access to land, low educational status, lower consumption expenditure, lower access to nutrition and healthcare. As per the Agricultural Census, 2010–2011, SCs and STs together constitute only 21 per cent of the small and marginal landholdings (below 2 ha), accounting for 20 per cent of area operated under these landholdings. In particular, for SC farmers 92 per cent of their landholdings are under 2 ha while this figure stands at 78 per cent for the ST farmers. Access to services such as credit is also restricted by caste. Kumar and Venkatachalam (2016), in their paper on caste-based differences in farmers’ access to loans, find evidence of discrimination against ST farmers’ right at the stage of loan approval. Due to this, they argue that STs and SCs are 16–20 per cent less likely to apply for loans as compared to the higher castes.
There are few studies on caste-based social networks and their impact on the adoption of agricultural technologies. However, in a different but relevant study on social networks and health insurance in the state of Andhra Pradesh, Debnath and Jain (2015) investigate the role of caste-based networks in driving first-time use of a public welfare program. In that article, the authors describe caste as a ‘naturally occurring social network’. They find that a unit increase in peer utilization of health insurance within the caste at the village level increases first-time use by 20 per cent. Munshi (2014), in his paper on community networks, highlights that caste-based labour market networks have been present in India since colonial times. The author describes how caste-based networks in India have played a role in providing insurance to its members and smoothening consumption. He further illustrates how loans within caste-based networks are one of the major sources of informal credit. Based on data from the 2005 Indian Human Development Survey, Munshi and Rosenzweig (2016) report that more than 20 per cent of loans based on caste carry no interest payments or collateral.
In their paper on identifying central individuals in a social network, Banerjee et al. (2016) argue that rational individuals can identify individuals who are central in a network by tracking gossip about people. These individuals were not traditional leaders or people with many friends, but they were central to the diffusion of information. The authors conducted a randomized field experiment and tracked the diffusion of a piece of information which was given to a small number of ‘seeds’ in each community. They subsequently found that diffusion of information was three times more when these seeds were nominated by people as opposed to randomly chosen seeds. Similarly, we argue that caste-based networks can be used to identify central individuals, as opposed to extension workers or progressive farmers in a village. Central individuals are those who can influence other people in their network, who may not be the first ones to adopt the innovation in the normal course of the dissemination process. In our case, these would be influential leaders in caste-based networks in a village as opposed to a single progressive farmer who usually adopts the innovation first in the village. Central individuals within a caste would be able to spread information faster because of the closely knit ties that connect individuals who belong to the same caste.
Methodology
Caste and Social Networks
In this paper, we calculate network centrality for each respondent. In order to estimate network centrality, each respondent was asked a series of questions about randomly chosen matches, which indicates the quality of the network. A respondent was first asked whether he/she knew any of the six matches. If they did, then they were asked if they knew whether those matches cultivated rice. If rice was cultivated by any of the matches, then the farmer was further probed to elicit his/her knowledge about the match’s farming activities. A value of 1 was given to every positive response that the respondent gave, and 0 otherwise. A higher value of the centrality estimates reflects a higher quality of interactions and more influence among individuals in the two groups.
Network centrality analysis tries to identify the most influential or central individuals in a network. In this paper, we look at two measures to indicate centrality, outdegree and indegree centrality. In general, degree centrality tells us how many direct links exist between each node in a network and measures the influence or importance of those nodes. Specifically, outdegree centrality measures the number of outbound links and indegree centrality measures the number of inbound links. A high outdegree centrality score signifies influence; these individuals can effectively disburse information to others in their network. A high indegree centrality score signifies importance; these individuals can be viewed as informal leaders towards whom others in the network seek to direct ties.
Varietal Adoption
In terms of varietal choice, farmers have broadly two options available: cultivate either a traditional or a modern variety on a given plot. We have classified modern varieties into two categories based on the age of variety: first, new modern varieties whose age is less than or equal to 15 years and established modern varieties whose age is greater than 15. Varietal age is estimated by subtracting the year of release of the varieties from the year of cultivation. Varieties whose year of release is unknown are categorized as traditional varieties. These are varieties that farmers have been cultivating for generations. Modern varieties that are 15 years or older represent established technologies, whereas those that are less than or equal to 15 years old are new technologies. Almost all hybrids found in our sample are released after 2000 and hence hybrids belonged to the new technology category. Thus, in terms of varietal choice, these are the three broad options available to farmers—traditional varieties, new modern varieties, and established modern varieties. A conceptual model on diffusion of variety through the caste-based network is presented in Appendix II, Figure S1.
In this paper, we model the varietal adoption based on a simple social learning approach proposed by Bandiera and Rasul (2006). Assume that the varietal adoption decision ai (choose to cultivate new modern or established modern or traditional variety with the characteristics VAR) of farmer i in a village v. The adoption decision of a farmer depends on social network characteristics

The actual adoption decision, aiv is observed as a discrete choice,
A farmer may cultivate different types of varieties at one point in time. For example, it might be the case that during the same cropping season a farmer cultivates a traditional variety and another variety whose age is less than 15, on different plots. Hence, the dependent variable used in the econometric model is categorical in nature, taking the value of 1 if any variety has been cultivated by the farmer and 0 otherwise. Given that one farmer can cultivate more than one type of variety, a multivariate probit regression is used to analyze social networks and other factors affecting varietal selection. Following Chib and Greenberg (1998), let Aij denote the binary response 0/1 representing whether farmer i (i = 1, 2 …, n adopted the type of variety j, and let
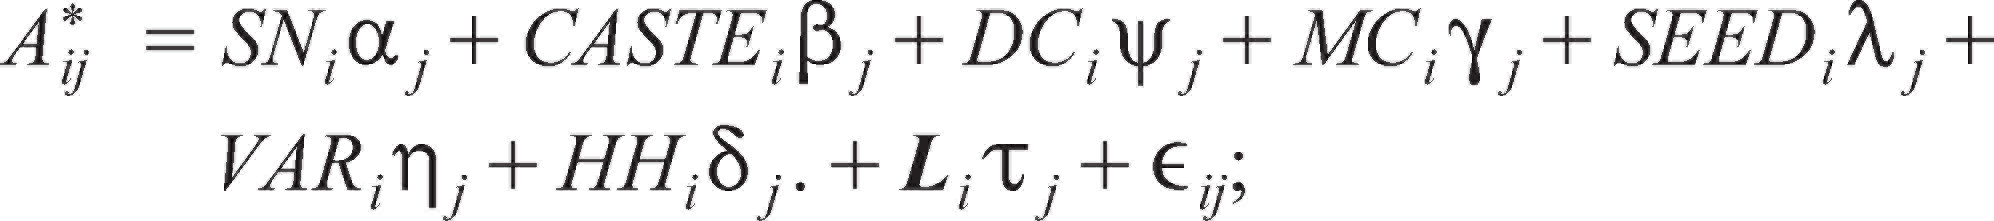

Here, SNi denotes two-dimensional social network centrality measures (indegree or outdegree), CASTEi denotes caste the farmer i belonged to, and DCi indicates if the respondent belong to dominant caste or not; MCi is the three-dimensional characteristics of network matches for farmer i such as the proportion of matches that belong to within caste, dominant caste, and that cultivated modern varieties; SEEDi denotes the source of the seed and VARi captures the varietal preferences, that is, the characteristics that the respondent consider (such as yield, vigour, cooking quality and marketability) while choosing a variety to cultivate; HHi denotes the household characteristics such as household income, primary income source, monthly expenditure and expenditure on food whereas Li captures the land and location details such as rice area, share of rice area to total cultivated area, rented in and rented out land and state dummies.
Data Collection
Data on household characteristics, varieties cultivated, and informal social networks were collected through the household survey. Maertens and Barrett (2012) in their paper on measuring social networks’ effects on agricultural technology adoption cite methods that can be used to measure social networks. One of the methods is to define social networks through memberships in village groups, caste or gender (Foster & Rozensweig, 1995; Munshi, 2004). Van der Broeck and Dercon (2011), propose taking a complete census of a village and asking farmers to list their contacts as a way of measuring their social network. However, this method is costly in terms of time and money and cumbersome if the geographical area which has to be covered is large. Santos and Barrett (2008) and Chandrasekhar and Lewis (2011) propose a method called ‘network within sample’. In this approach, each farmer is asked about their connections to every person in their network. However, this method can give biased estimates by artificially truncating the network (Maertens & Barrett, 2012). Bandiera and Rasul (2006) in their study on social network and technology adoption in northern Mozambique ask each farmer to list out a particular number of people from whom they learn. This approach can cause farmers to mention only their stronger network links, and one might miss out on other weak but important networks links, thereby biasing the estimates.
In this paper, we use the approach of ‘random matching within samples’ to measure social networks (Conley & Udry 2010; Maertens 2010; Maertens & Barrett 2012; Santos & Barrett 2010). This method can also lead to an omitted variable bias if an important node of a network is ignored by the random matching. However, this method has been proved to do better than the ‘network within sample method’ by Santos and Barett (2008). In this method, each respondent is randomly matched with another farmer from the sample and is asked questions about the farmers they are matched with. Out of the 10 farmers that were surveyed in each village, six were randomly selected and each respondent was matched with a different random selection of six farmers.
Social Network and Endogeneity
Analyzing the role of peer effects in social network analysis of varietal adoption requires proper identification of potential endogeneity problems. One of the biggest challenges in estimating social network effects is how to control for correlated effects (Manski, 1993), for example, the common behaviour of peers in the chosen network due to prior similarities owing to exposure to a common environment. In self-reported networks (e.g., the network within sample method) serious implications of endogeneity can result from an omitted variable bias unless we control for factors which simultaneously influence the individual as well as peers’ varietal adoption decision. The network within sample technique suffers from truncation bias or forgoes the weak links and is subjected to unobserved heterogeneity and might result in biased estimates of network effects on behaviour in the presence of a structured network. Although random matching within sample outperforms network within sample method (Santos & Barrett, 2008), one should carefully look at the presence of certain structural nodes in the network (i.e., sample can omit a key network node). A farmer may endogenously choose a certain group based on its features, for example, farmers who cultivate organic products may group with other organic cultivators to be able to exchange information and share experiences and feedbacks. Another potential issue in network effect identification is the simultaneity effect or reflection problem (Manski, 1993), that is, the behaviour of the group influences the individual farmer, who in turn influences the group’s behaviour. This issue could be addressed via an instrumental variable. Finding an appropriate instrument that is correlated with the farmer’s network but uncorrelated with unobservable variables that influence group membership and individual adoption is practically impossible. Endogenous selection is not a serious issue in our study as we used a random matching within sample approach, and given the fact that we have information about farmers’ group composition, we would be able to specify the network more correctly.
Data
Sampling
A survey was conducted in 2015 in three major rice-growing states in eastern India: Bihar, Odisha, and West Bengal. Five districts 2 were chosen in each state based on three criteria: (1) rice intensity of 50 per cent or more, (2) agro-ecological zone 3 , and (3) irrigation status. In each district, the top two rice-growing blocks were chosen, making a total of 30 blocks. In each block, five villages were randomly selected. In total, 150 villages were selected to implement the current research. In each village, rice farming households were identified using a complete census of the village. In the village census, details of every household in the village (including caste, religion, and rice farming status) were recorded. From each village list, 10 households were selected for the household survey, in proportion to the caste composition in the village. Thus, 1500 4 households were sampled for the survey. The households were categorized into five caste categories described above: General, Minority, Scheduled Castes, Scheduled Tribes, and Other Backward Classes.
Descriptive Analysis
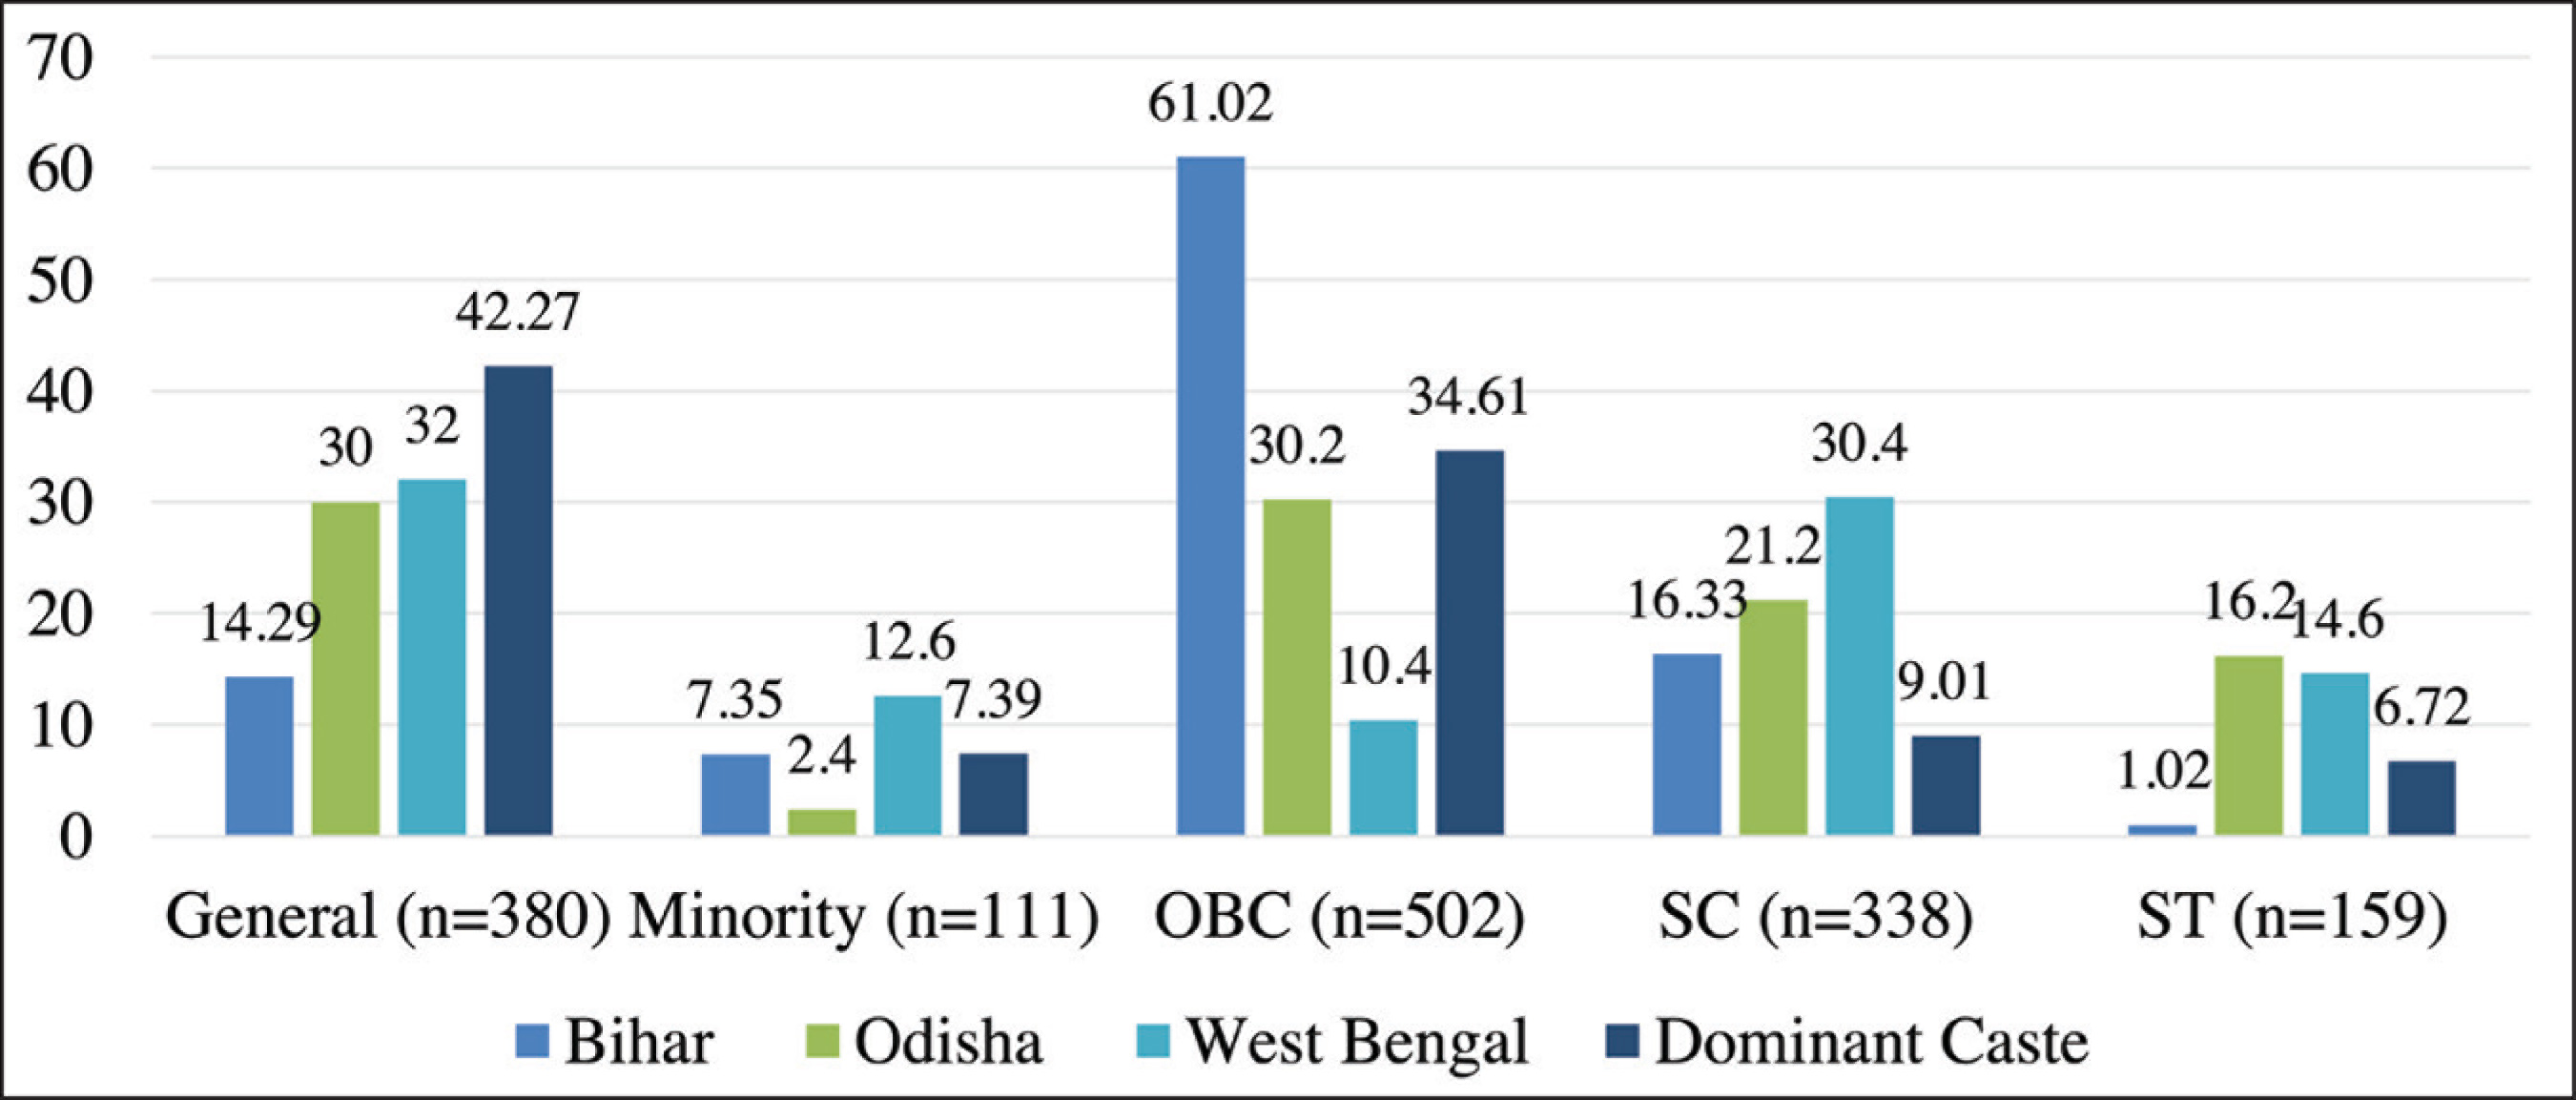
In our sample, on average, a household consisted of five members with men and women household members of an average age of 31 years, having 18 and 15 years of experience in agriculture, respectively. In terms of caste composition, the majority of the respondents belonged to the OBC category (33.7 per cent), followed by the General category (25.5 per cent). Figure 1 depicts the caste composition across the three states. Bihar is highly dominated by OBC category respondents (61 per cent) and contains a very small ST (1 per cent) population. In contrast, in Odisha and West Bengal no single caste group dominates, but at least two caste groups have a large population share (General and OBC for Odisha and General and SC for West Bengal).
Caste Composition Across States
Education levels were defined in terms of years of education completed and categorized 5 into non-literate, literate with no formal education, primary (grades 1–4), secondary (grades 5–10), senior secondary (grades 11 and 12), and graduate and above (undergraduate degree and above), as highlighted in Table 1. A total of 76 per cent of household members belonging to the General category had formal schooling, whereas the figure was 63 per cent for minorities and around 60 per cent and more for the other castes (OBC, SC and ST). Within each caste category, around 40 per cent (or more) of the household members had attained secondary education, except for those belonging to the Minority and ST categories. Members belonging to SC and ST households had the highest share of non-literates (around 32 per cent) and low levels of education in general compared with other groups.
Agriculture was the primary occupation of household heads belonging to the General, Minority, and OBC categories, with 59.7 per cent, 66.7 per cent, and 73.3 per cent being involved in agriculture, respectively. The same can be said about ST and SC household heads, however, only 53.2 per cent and 51.3 per cent of these groups were engaged in farming, respectively. In contrast, compared to other caste categories, a greater proportion of SC and ST household heads (around 30 per cent) contributed to the labour force and wage labour was also their primary income source. Agriculture was the primary source of income for households belonging to the General, Minority, and OBC categories.
Following the Government of India’s classification of landholdings, the households were categorized as marginal (less than or equal to 1 ha), small (above 1–2 ha), semi-medium (above 2–4 ha), medium (above 4–10 ha), and large farmers (greater than 10 ha) based on the area under cultivation. Data on area under rice cultivation was collected for two cropping seasons, Kharif 2015 (June/July to October/November) and Rabi 2014–15 (November/December to March/April). Irrespective of the caste, the majority of the farmers were marginal, that is, their landholdings under rice were less than of equal to 1 ha, followed by farmers with small landholdings between 1 and 2 ha. Households with large landholdings (more than 10 ha) were very few, about 1 per cent in the General and Minority category and negligible for the SC, ST, and OBC households. Table 1 summarizes the educational attainment of household members, their primary source of income, the head’s primary occupation, and landholdings under rice within each caste category.
Sample Household Characteristics
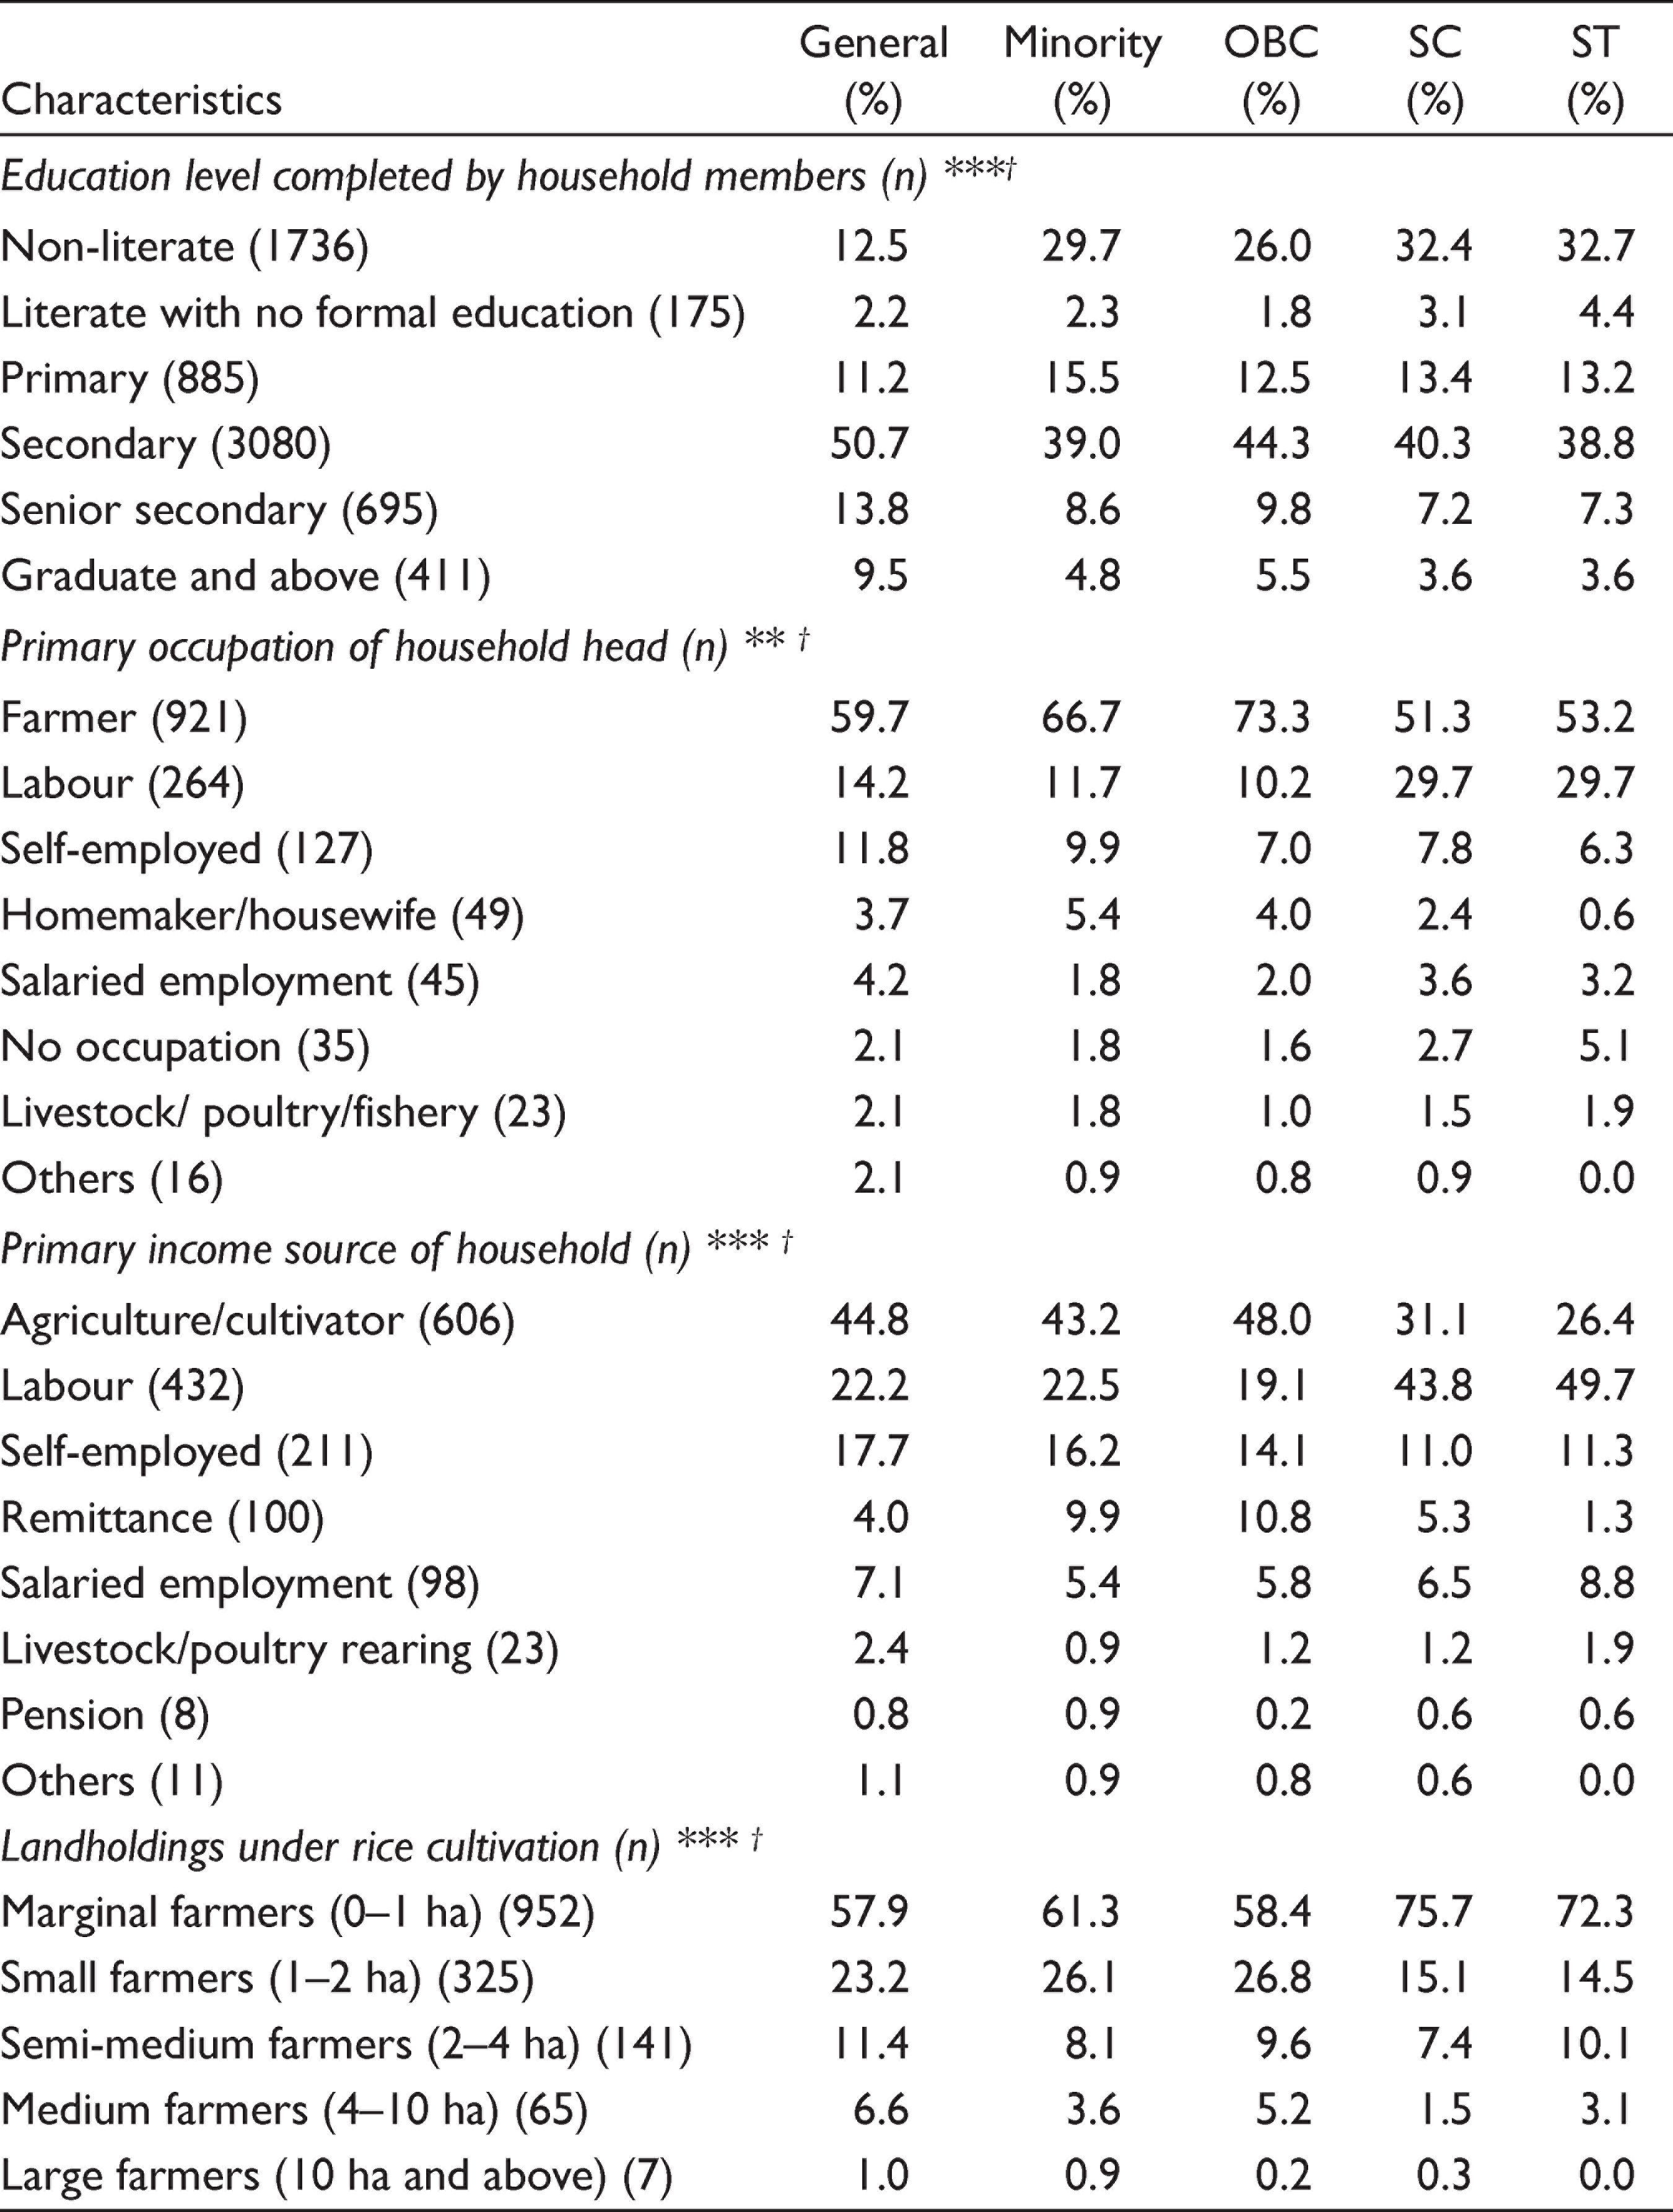
Table 2 shows the percentage of farmers belonging to different land classes in terms of the area under rice cultivation and the total agricultural land they own in both Kharif 2015 and Rabi 2014–15. As is evident from Table 2, within each state, marginal farmers made up the greatest proportion in terms of both their own agricultural land and area under rice cultivation. The proportion of marginal farmers was 63.9 per cent for area under rice cultivation and 78.2 per cent for own agricultural land, followed by small farmers (above 1–2 ha) cultivating 21.8 per cent of the area under rice and having 14 per cent of land ownership. The proportion of farmers having access to land sizes greater than 10 ha was almost negligible.
Farmers Belonging to Land Classes as per Area Under Rice Cultivation and Own Agricultural Land†
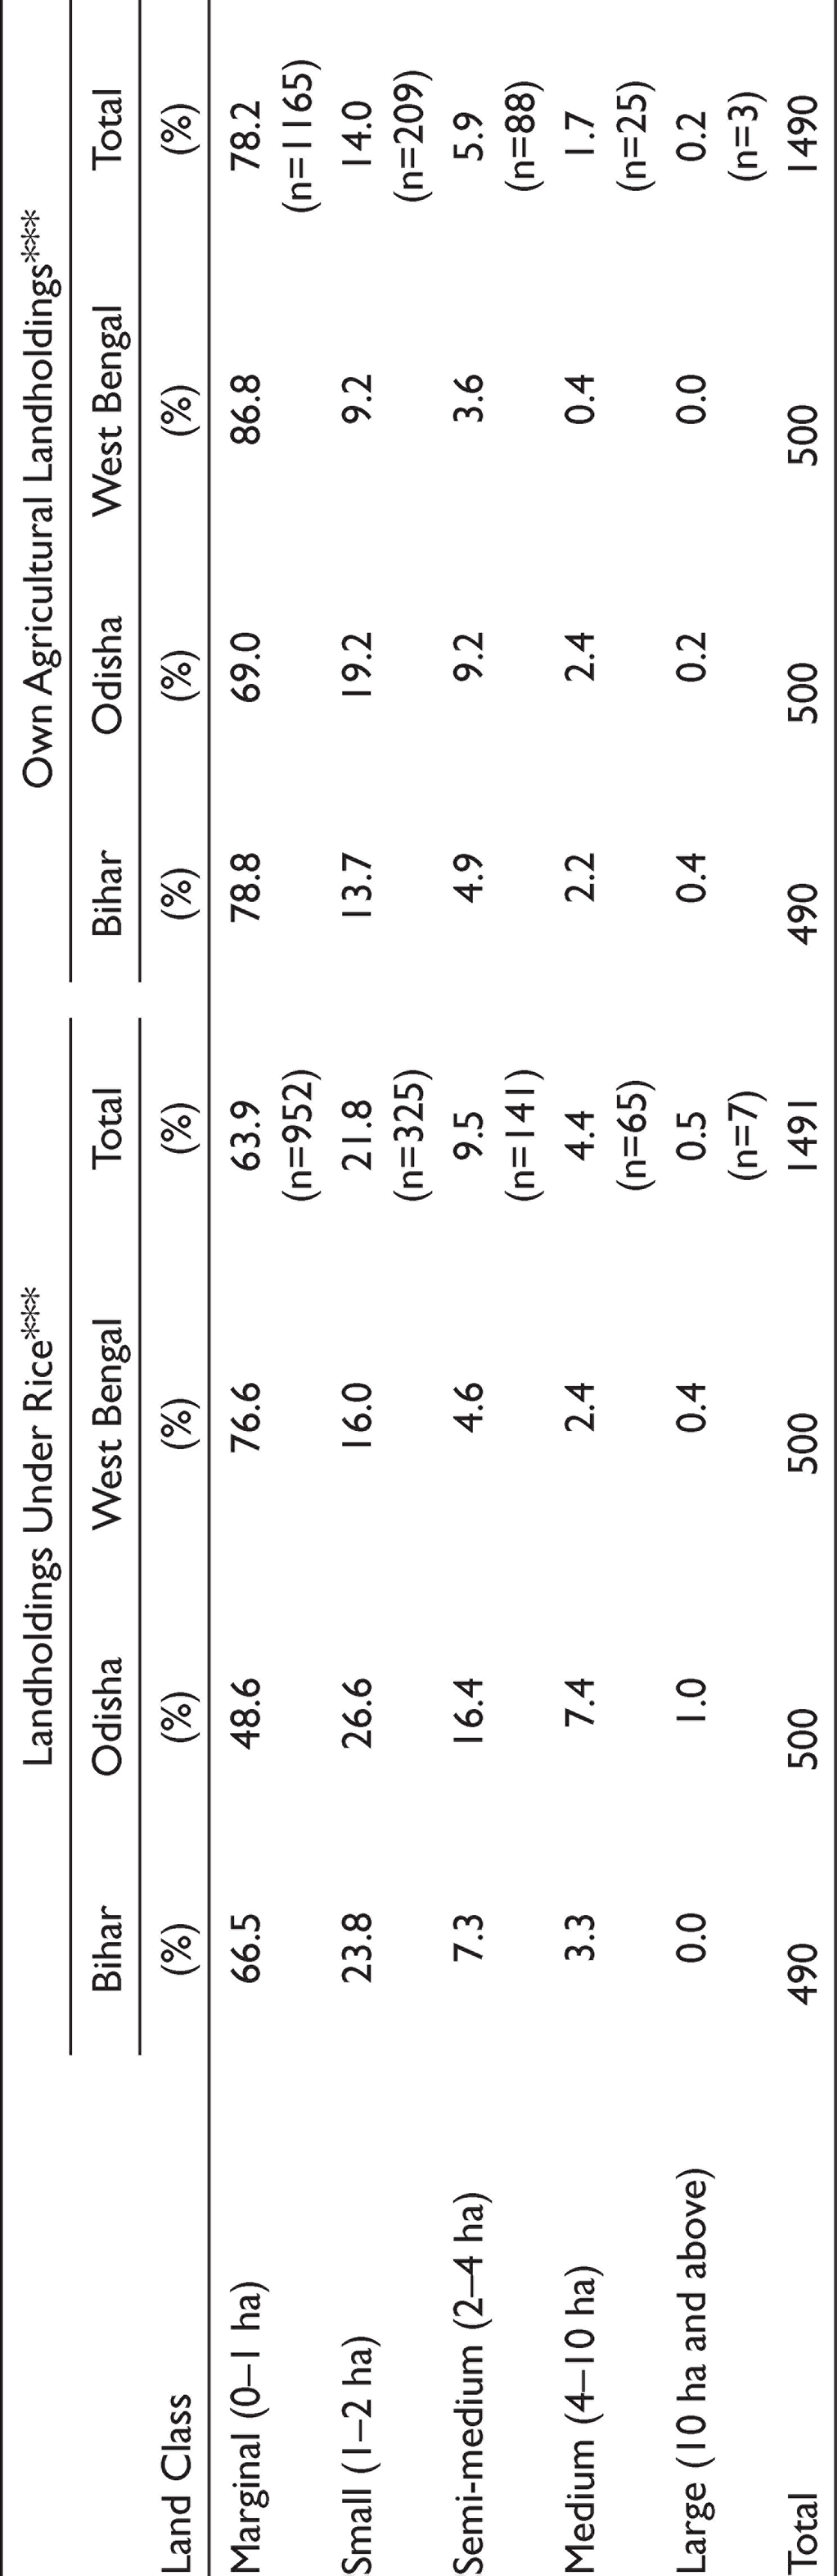
*, **, *** indicate that the corresponding differences are significant at the 10 per cent, 5 per cent, and 1 per cent levels, respectively.
Results
Caste and Varieties
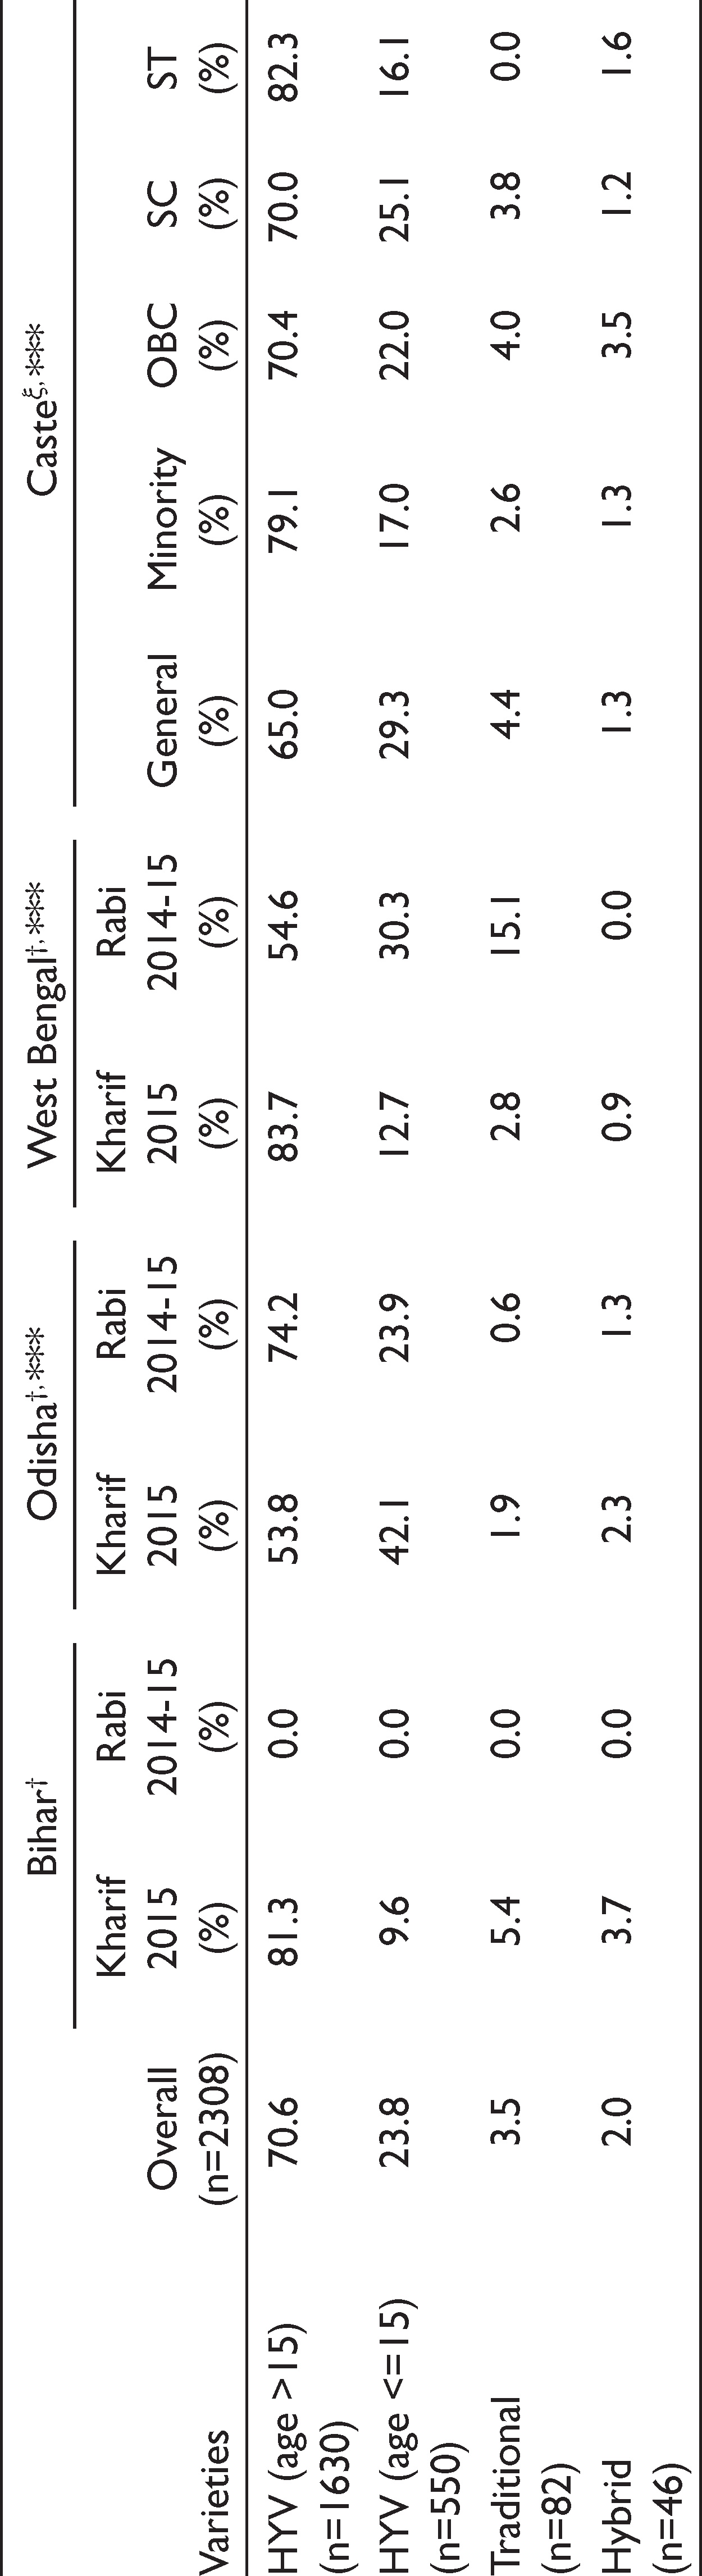
During the survey, the farmers were asked to identify the varieties they cultivated. Many varieties are referred to by their different local names by farmers across eastern India. For example, Swarna, which is an improved variety and was released in 1979, is one of the most popular varieties in eastern India. But Swarna is identified by multiple names across these regions by farmers. In several cases, categorizing those local names of varieties that have not yet been properly identified becomes very difficult. Hence, those varieties that could not be categorized or identified have been put under ‘Unidentified’ and are excluded from the econometric analysis. Around 17 per cent of the total names described by farmers and area under rice cultivation belonged to the unidentified category. In Table 3, it can be observed that 70.6 per cent farmers cultivate established modern varieties (age greater than 15 years) followed by modern high yielding varieties (HYV) (age less than or equal to 15 years) (23.8 per cent), traditional varieties (3.5 per cent) and hybrid varieties (2 per cent). As mentioned above, we combine new HYVs and hybrids for our econometric analysis and categorize them as new modern varieties.
Varieties Cultivated
*** indicate that the corresponding differences are significant at the 1 per cent level, respectively.
In India, Kharif is the main season for rice cultivation. Bihar, which belongs to the Indo Gangetic plains, is dominated by the rice–wheat system; hence it is not surprising to observe very little Rabi rice in Bihar. However, farmers in the states of Odisha and West Bengal do cultivate some rice during Rabi, which is reflected in the sample as well. Across both seasons and within each state, the majority of the varieties that were cultivated were established modern varieties. The second most popular varieties were newer modern HYV varieties, followed by traditional varieties.
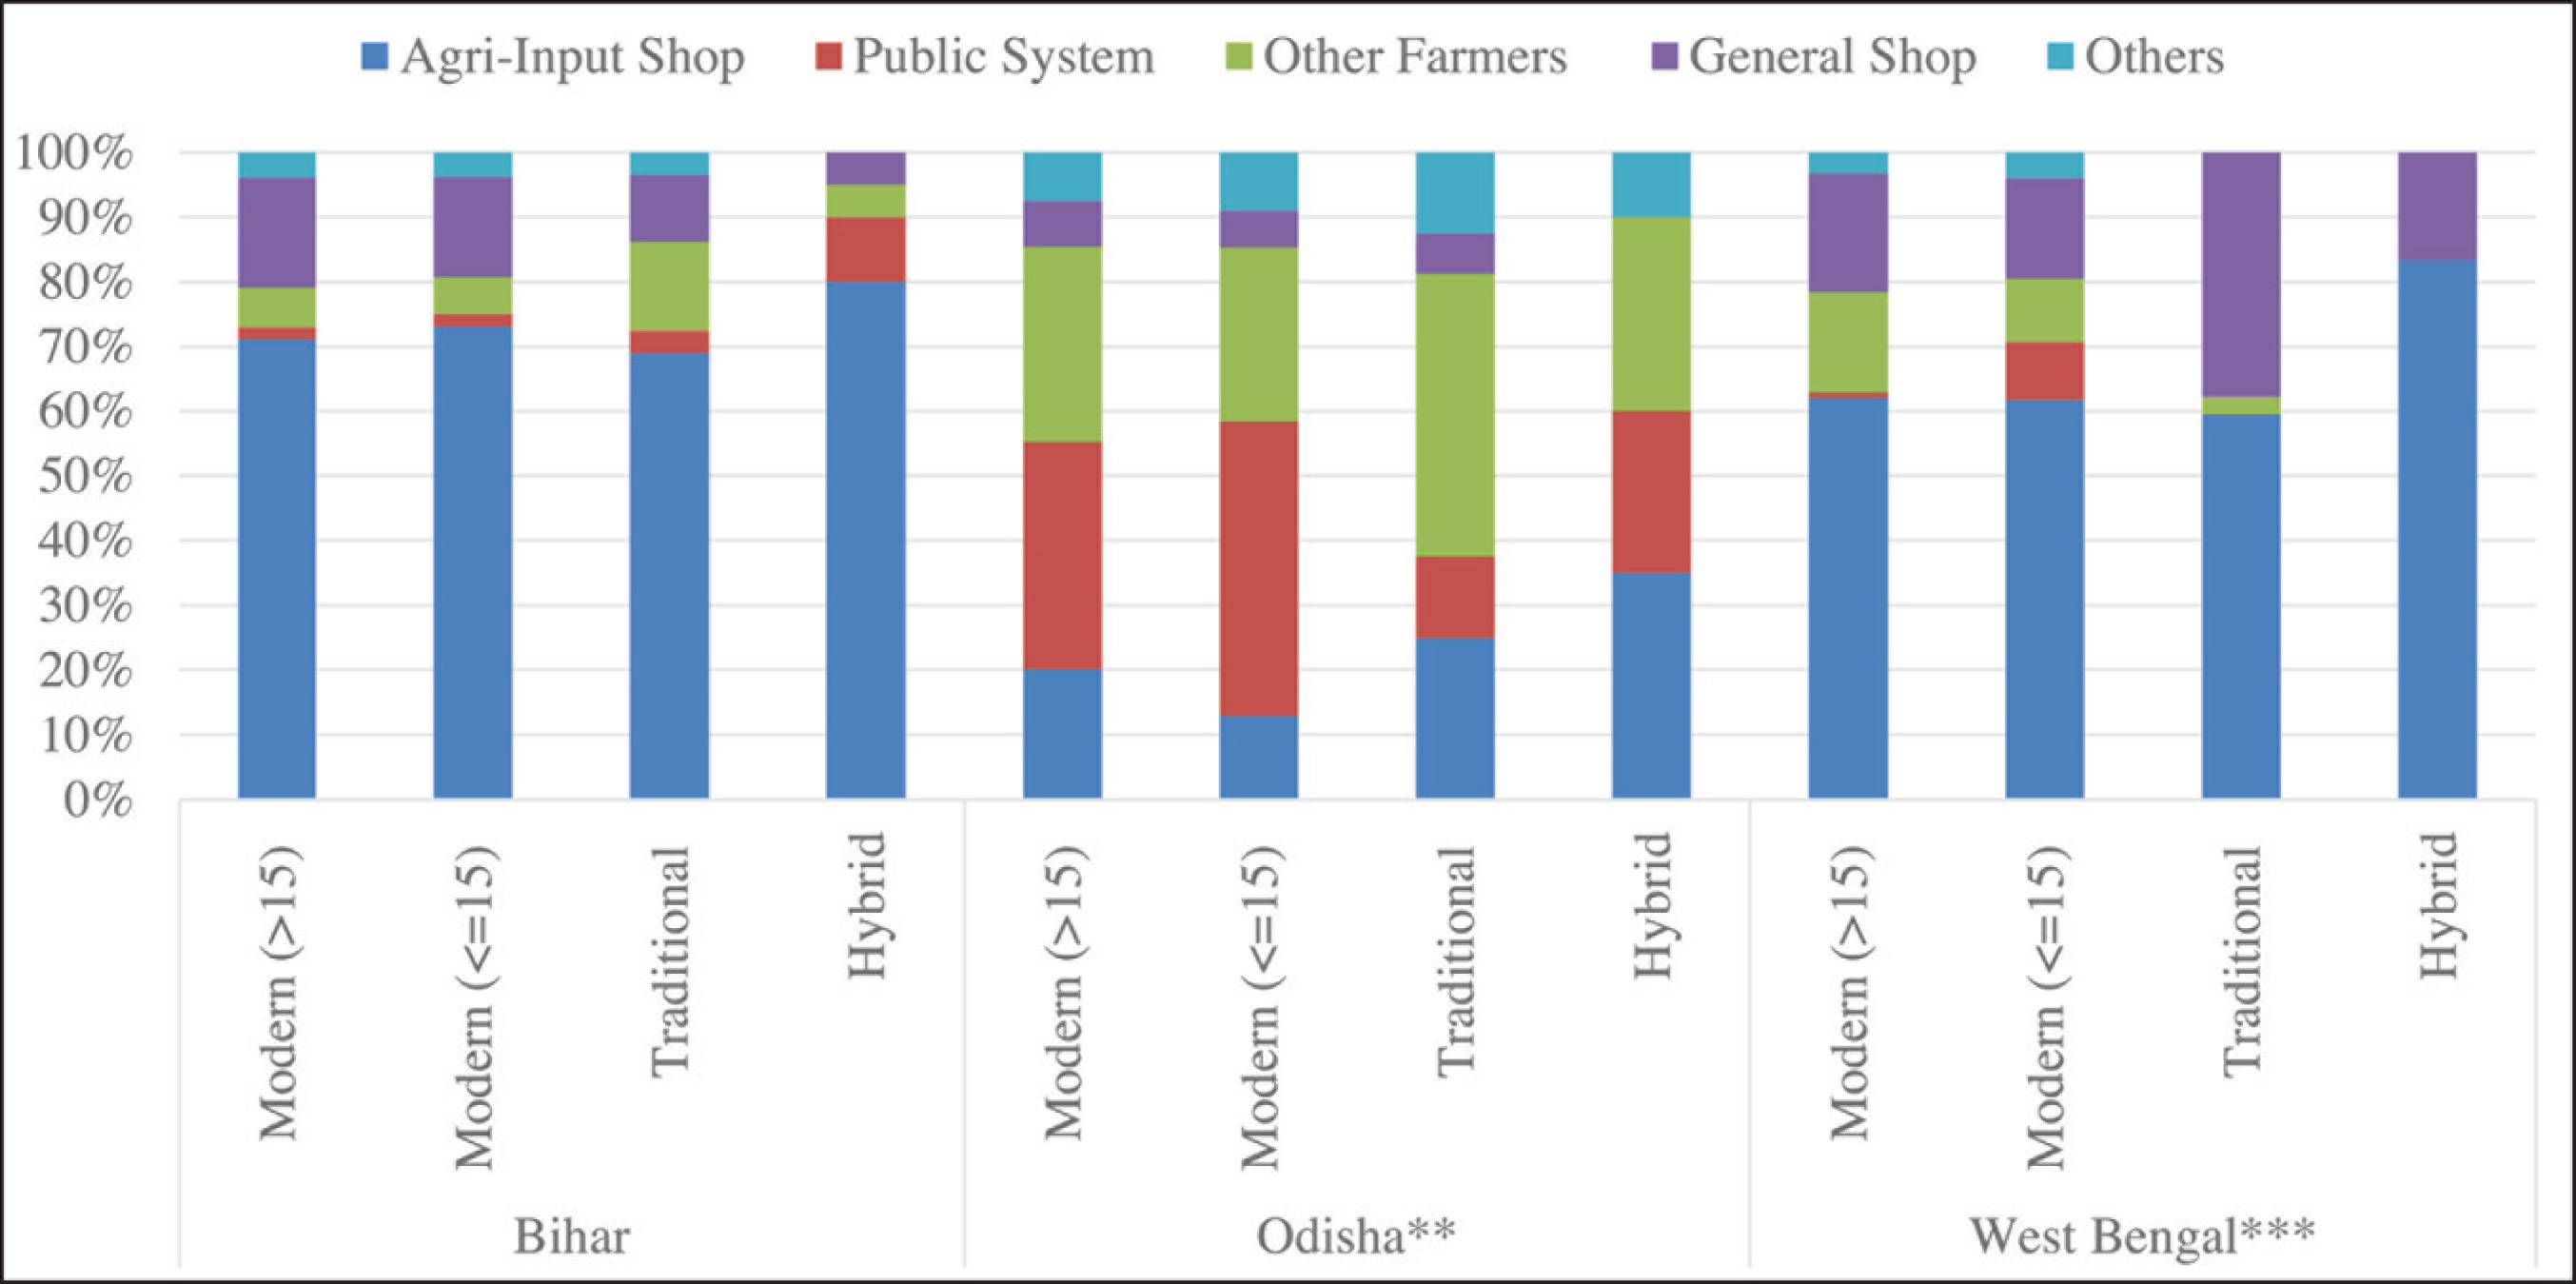
Agri-input shops were the most popular source for acquiring seeds, with around 46 per cent of the seeds being acquired from them, followed by farmer to farmer exchange (18 per cent). As illustrated in Figure 2, in Bihar and West Bengal, the most popular source was agri-input shops for all types of varieties. In Odisha, the public system was the most popular source for acquiring seeds of high yielding varieties, farmer to farmer exchanges for traditional varieties, and agri-input shops for hybrids.
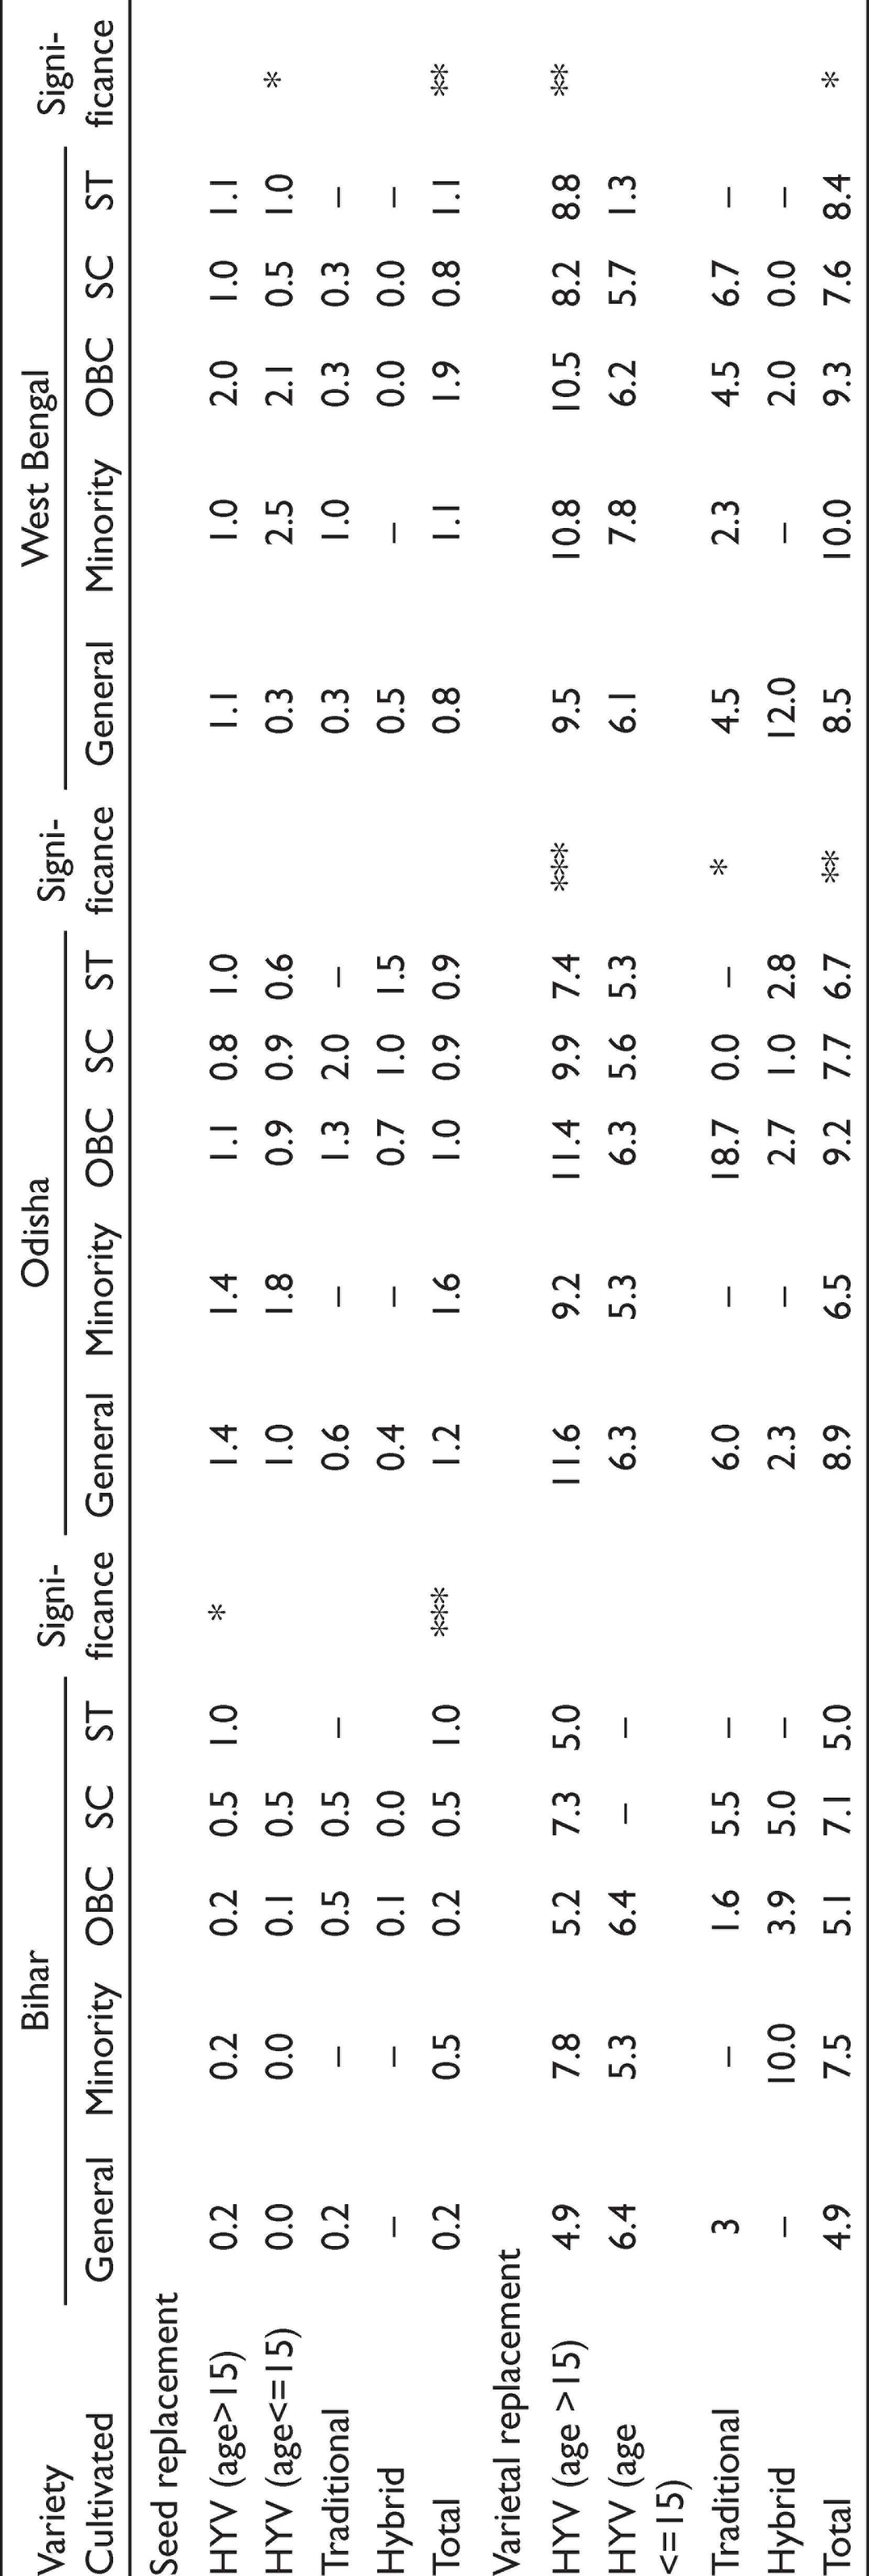
Faster seed and varietal replacement are crucial to the successful diffusion of any variety. Table 4 summarizes the seed replacement rate (average number of years since seeds were replaced by farmers) and varietal replacement rate (the number of years since varieties were replaced). In every state, across each caste category, seed replenishment rate is either less than or equal to 1, with a few exceptions. This means that farmers mostly replace seeds within a year. Farmers in Bihar belonging to the General category replace the varieties every five years, whereas in Odisha and West Bengal it is every eight to nine years. Minorities use the same variety for a longer period of time in West Bengal (10 years) and Bihar (seven years), but in Odisha they replace the variety every six years. For farmers belonging to the OBC, SC, and ST categories, the number of years since the replacement of a variety is longer in Odisha and West Bengal than in Bihar.
Seed replenishment and varietal replacement (average years)†
Caste and Social Networks
Table 5 depicts the average centrality coefficients of each caste category viz-a-viz the dominant caste in the village. Following Srinivas’ (1959, 1966) definition mentioned above, the dominant caste group in a village is identified by taking into account three characteristics: economic dominance (the amount of agricultural land owned), population (numerical strength of each caste group) and social hierarchy (rank in the caste hierarchy).
Network Centrality and Caste
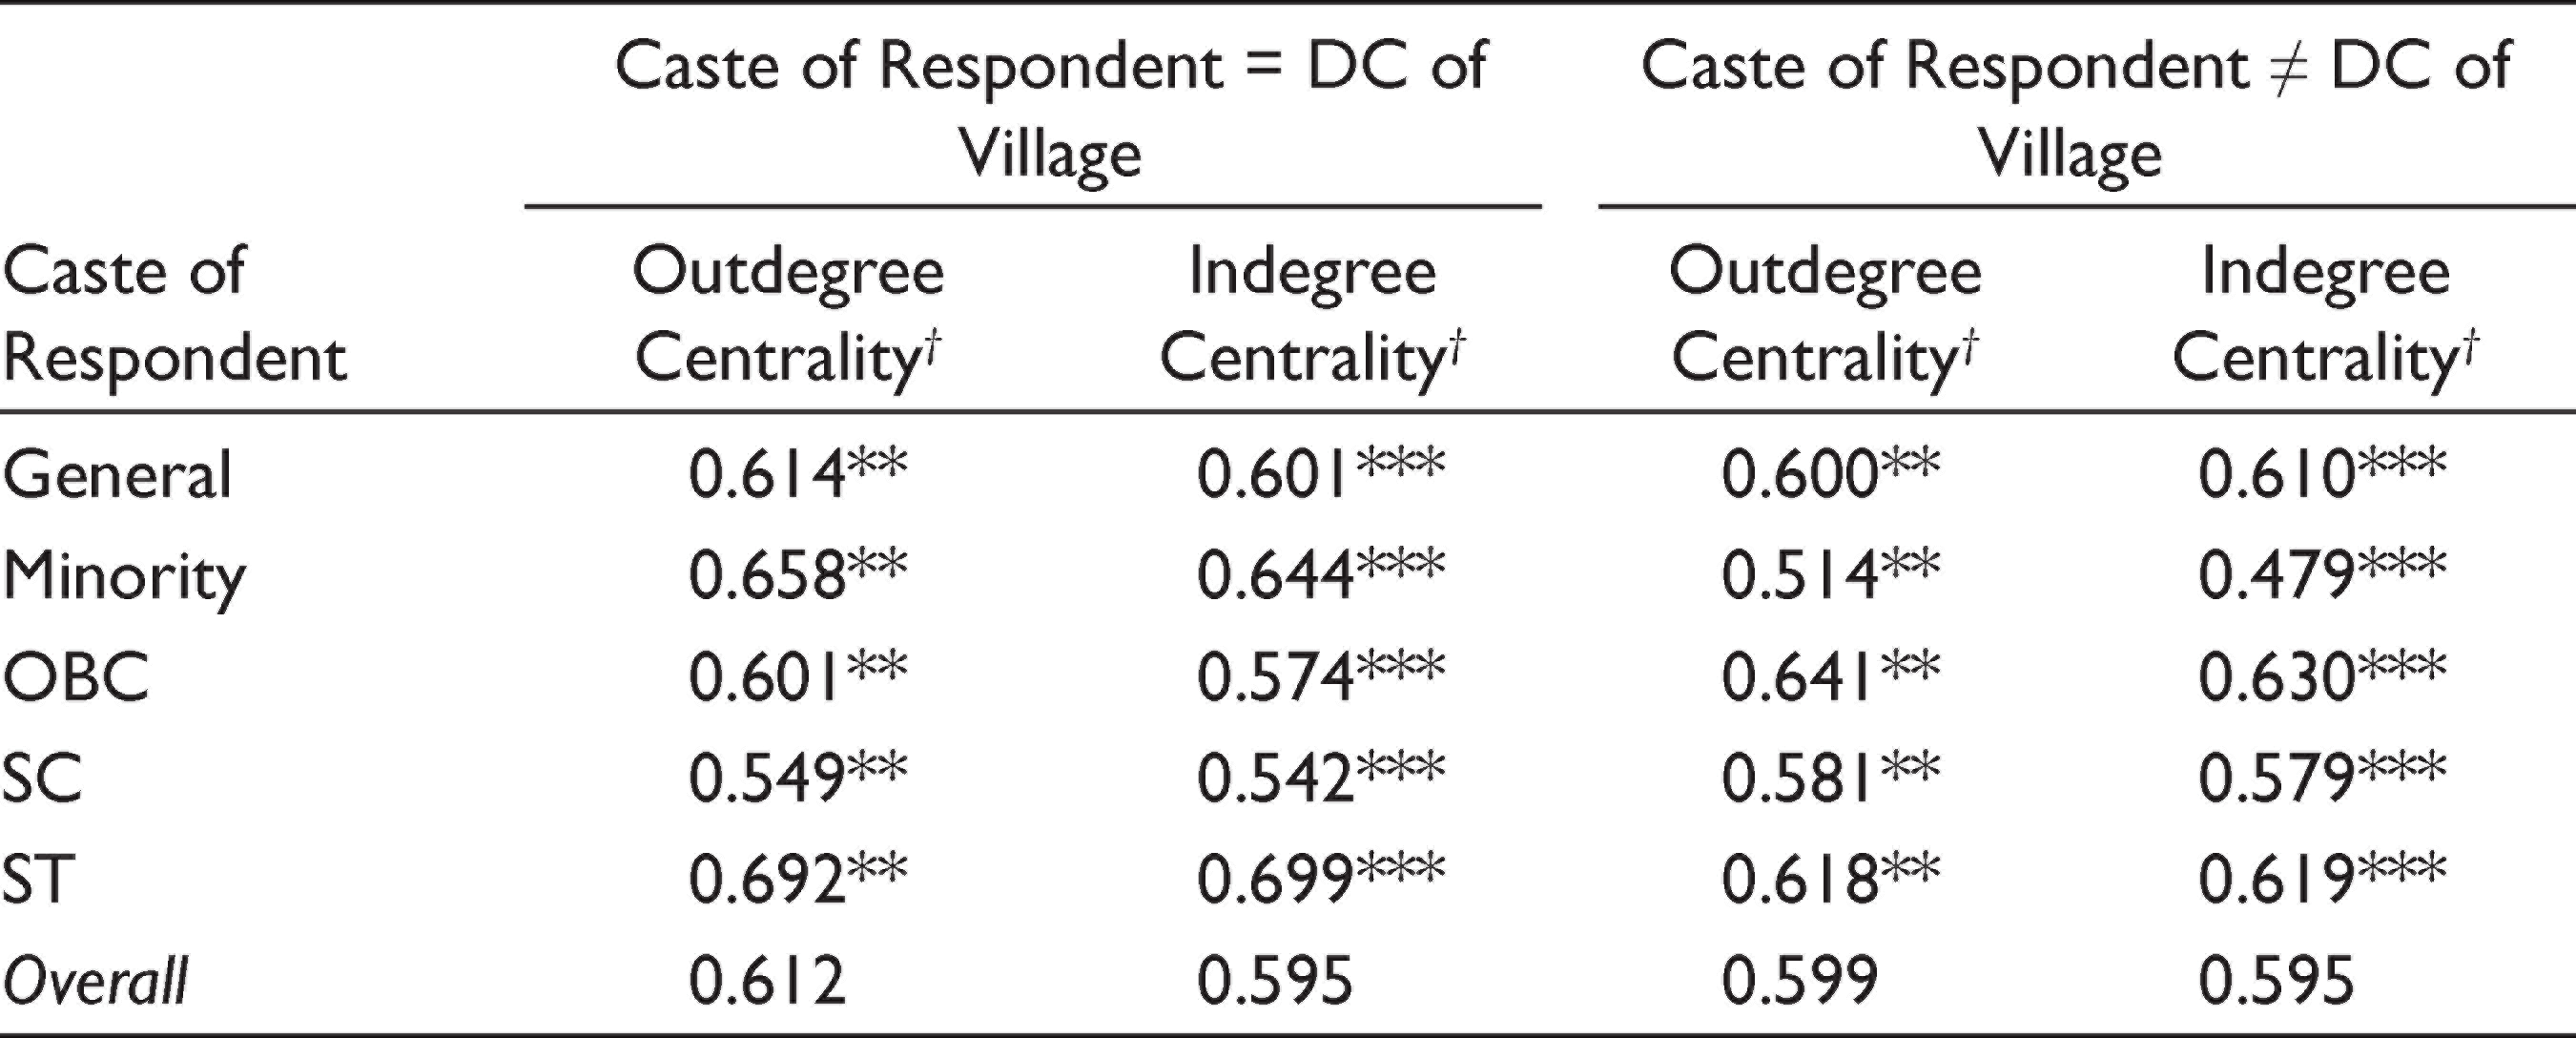
*, **, *** indicate that the corresponding differences between the social network indices are significant at the 10 per cent, 5 per cent, and 1 per cent levels, respectively.
Outdegree and indegree centrality for social networks among individuals belonging to the different castes with respect to their dominant status in the village is found to be significantly different. STs as compared to other categories have the highest outdegree and indegree centrality when dominant in the village. Individuals belonging to the marginal groups (ST, OBC and minority) are influential and act as informal leaders when they are the dominant caste in the village. OBCs and STs have a high network centrality, and minorities have a significantly lower centrality compared to the other categories when they are not the dominant caste in the village.
Varietal Adoption
A multivariate probit model is used to test whether varietal adoption depends on informal social networks and whether caste acts as a barrier. The variables used in the regression are explained in detail in Table 6. The dependent variable is traditional varieties, new modern varieties, established modern varieties adopters. Independent variables used are indegree and outdegree centrality of the respondents, proportion of matches in the network who cultivate new and established modern varieties, proportion of matches within caste, proportion of matches belonging to the dominant caste in the village, rice area as a percentage of total cultivated area, amount of land rented in and rented out, primary income earned by the household, overall household average monthly expenditure, average monthly expenditure on food, preferences about varietal characteristics taken into account by the respondents when selecting a variety, and dummies for state, caste, source of seed, area under rice, and primary source of income.
Variable Names, Definitions, and Descriptive Statistics
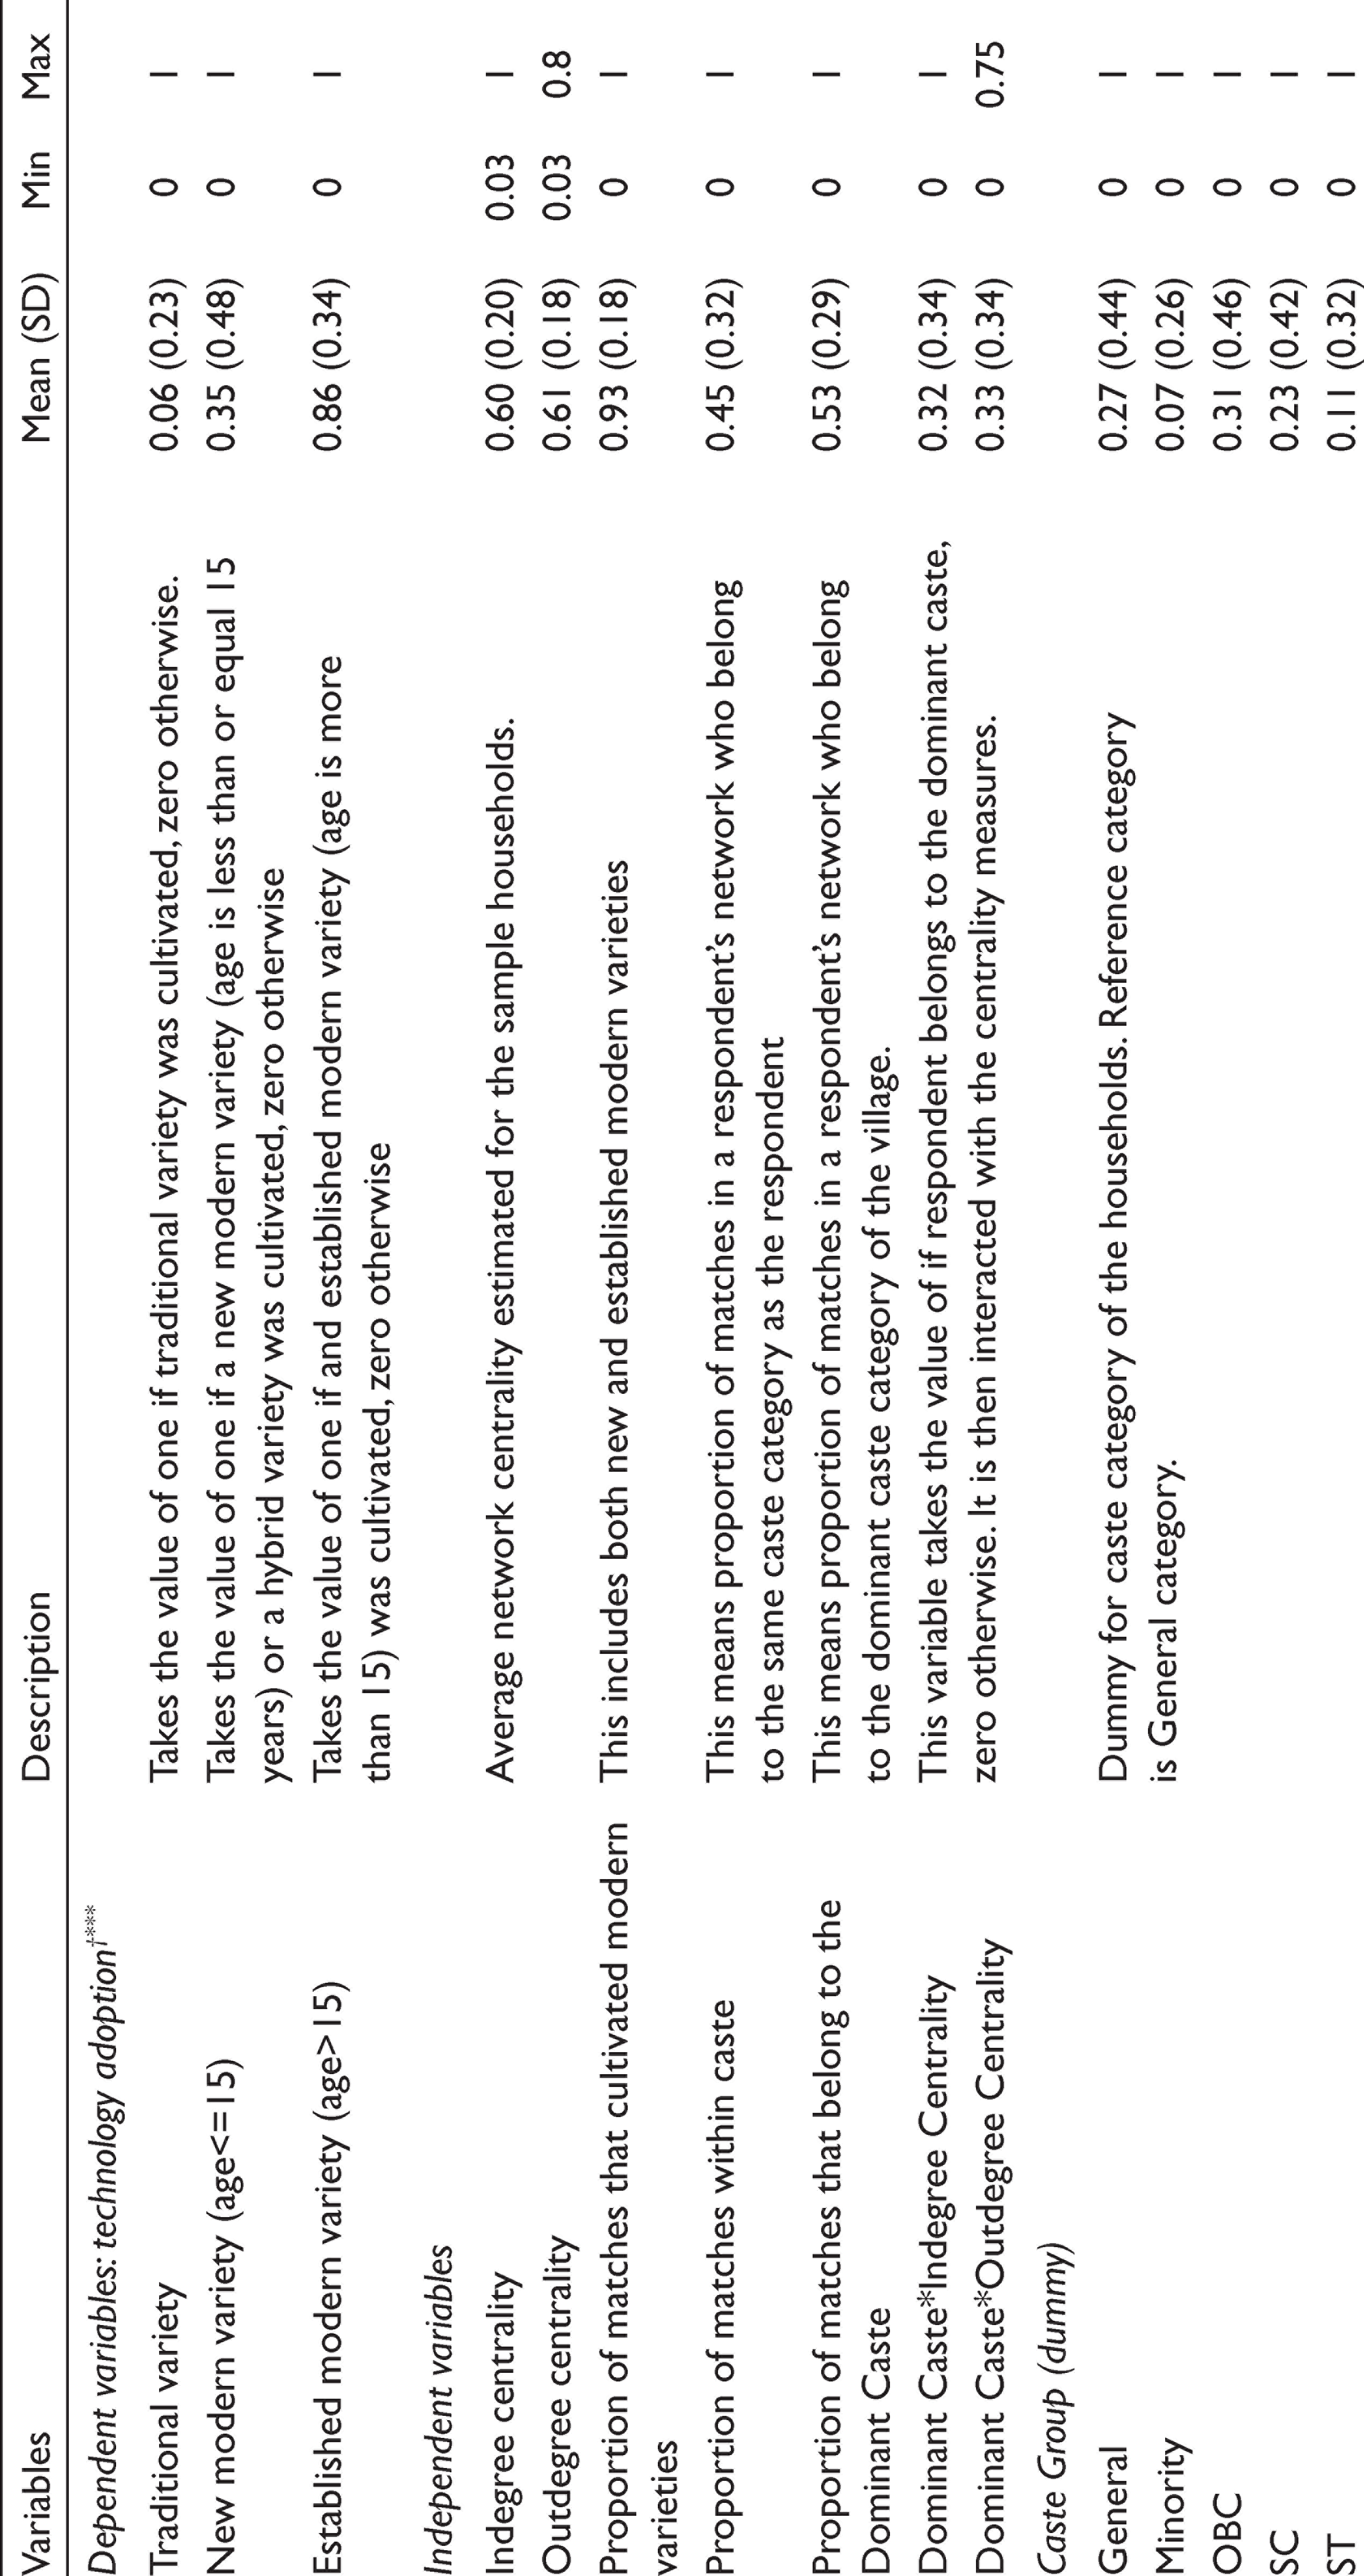
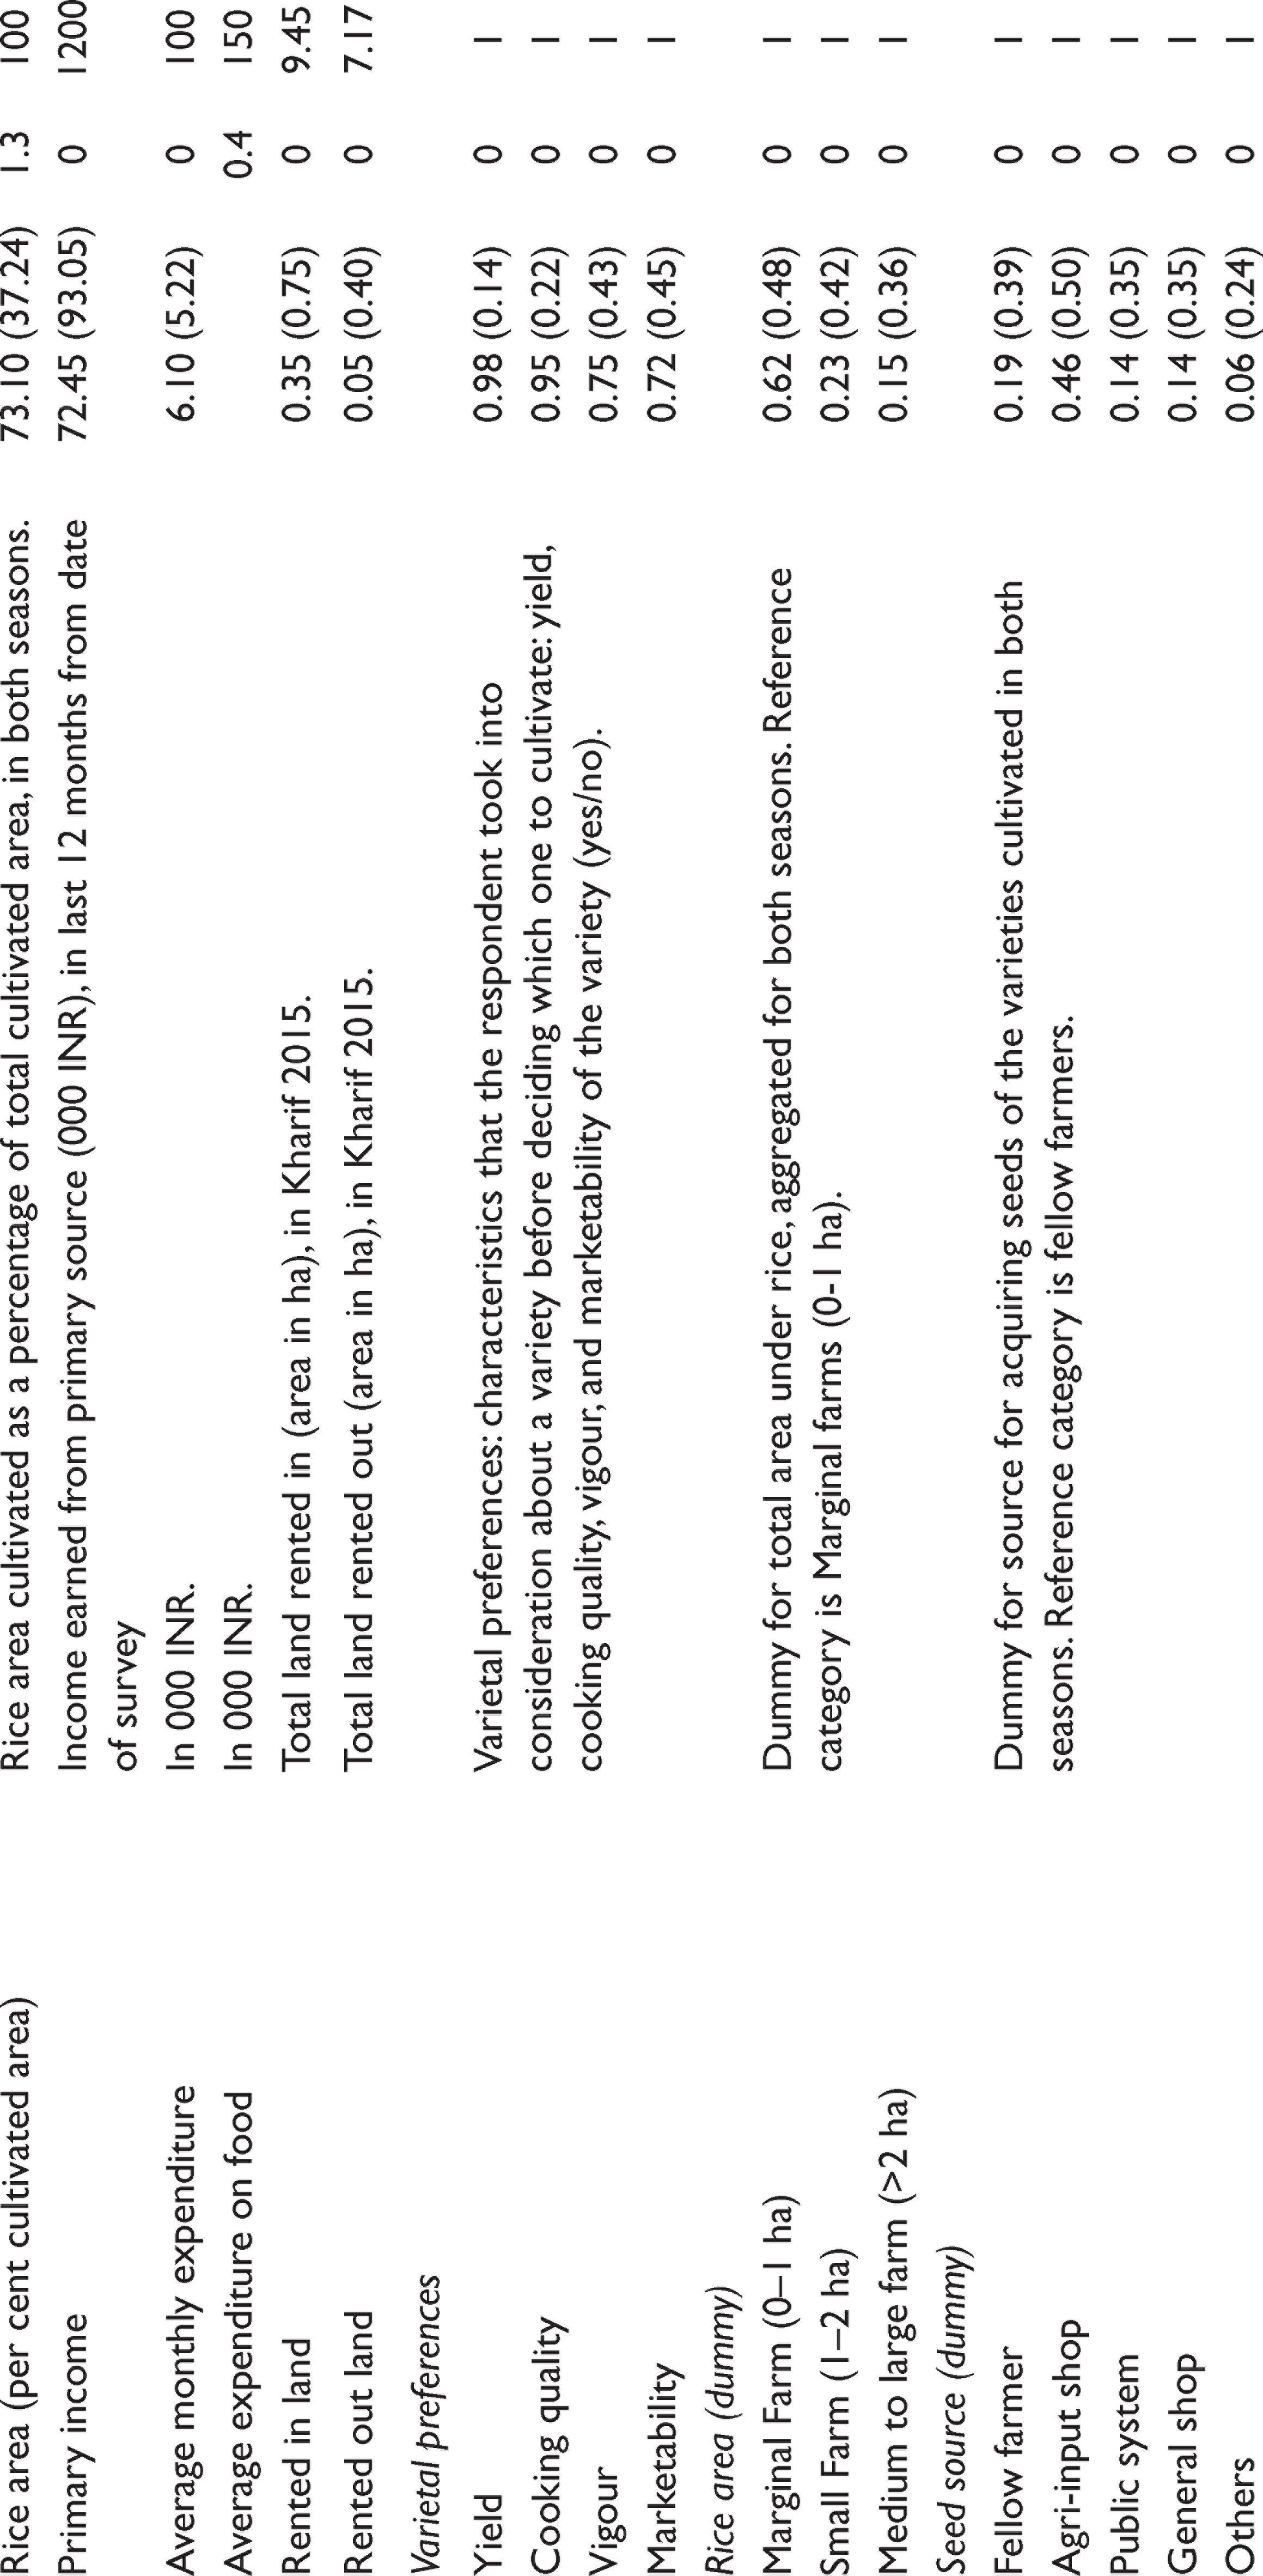
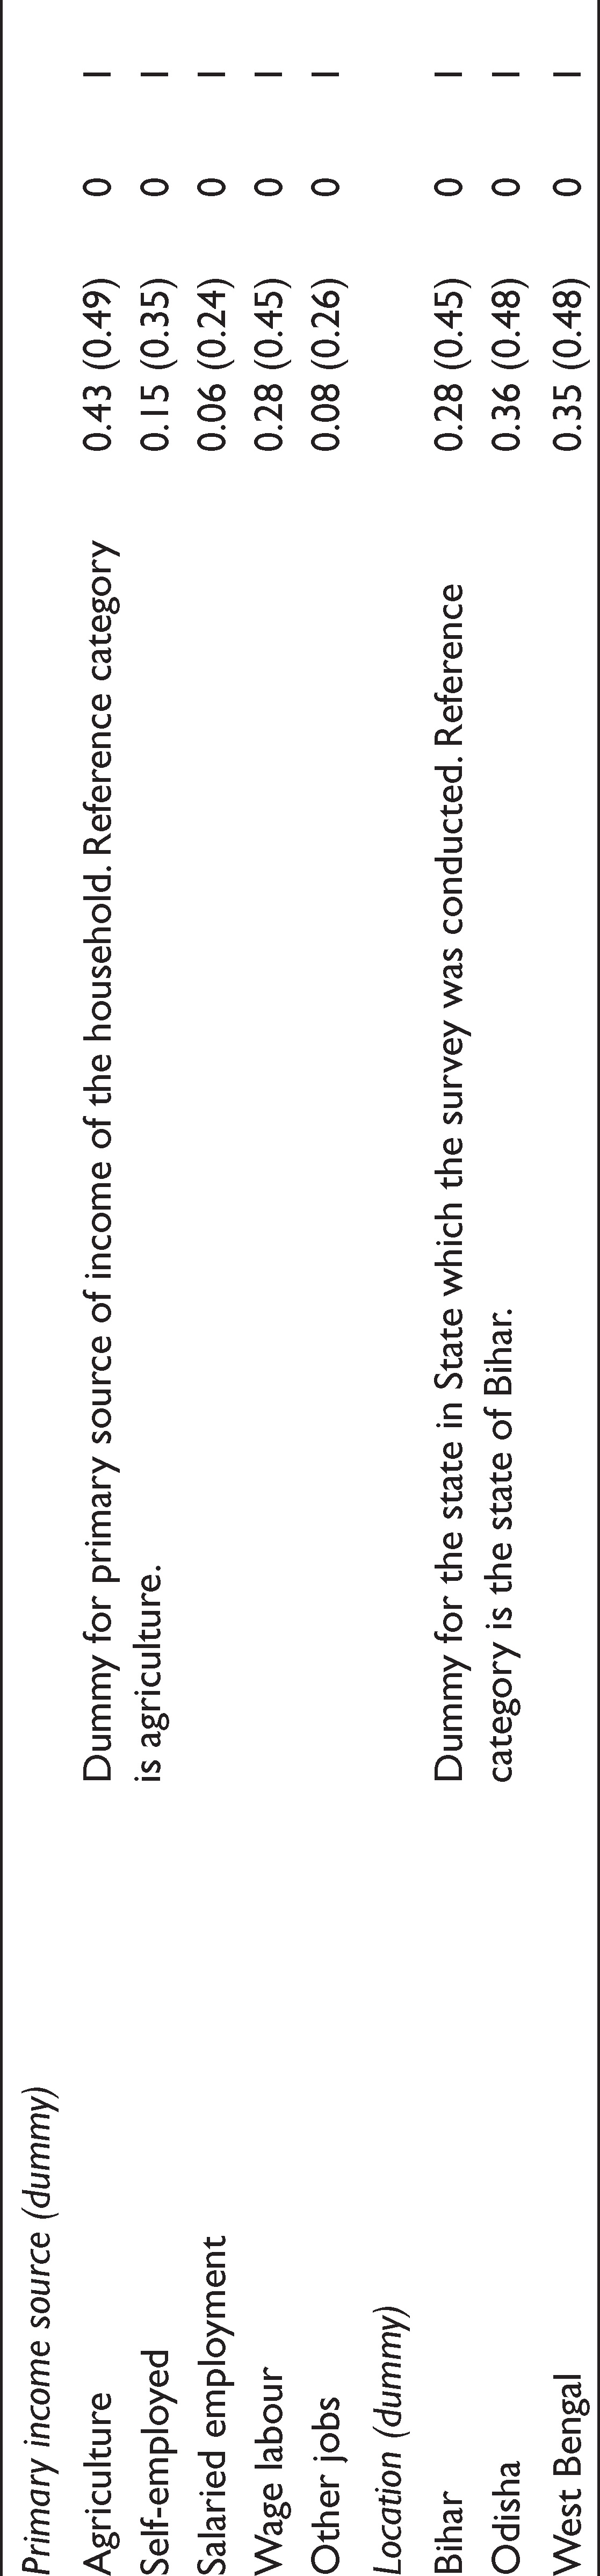
*, **, *** indicate that the corresponding differences are significant at the 10 per cent, 5 per cent, and 1 per cent levels, respectively.
Table 7 summarizes the effect of caste and informal social networks on varietal adoption. Prominent persons (high indegree centrality) in the informal social networks encourage the adoption of traditional varieties and discourage the use of new modern varieties, significantly. In contrast to this, networks that are more influential, that is, they have a high outdegree centrality, encourage adoption of modern varieties that are established and discourage the adoption of traditional varieties. Thus, in a network those persons who act as traditional leaders and towards whom others direct their ties (high indegree centrality) cultivate more traditional and less new modern varieties. On the other hand, individuals who are influential informal leaders (high outdegree centrality) cultivate more established modern varieties and less of traditional ones. When the proportion of matches in a respondent’s network who belong to the dominant caste in the village is higher, fewer of established and more of new and traditional varieties are adopted.
Multivariate Probit Model on Social Network
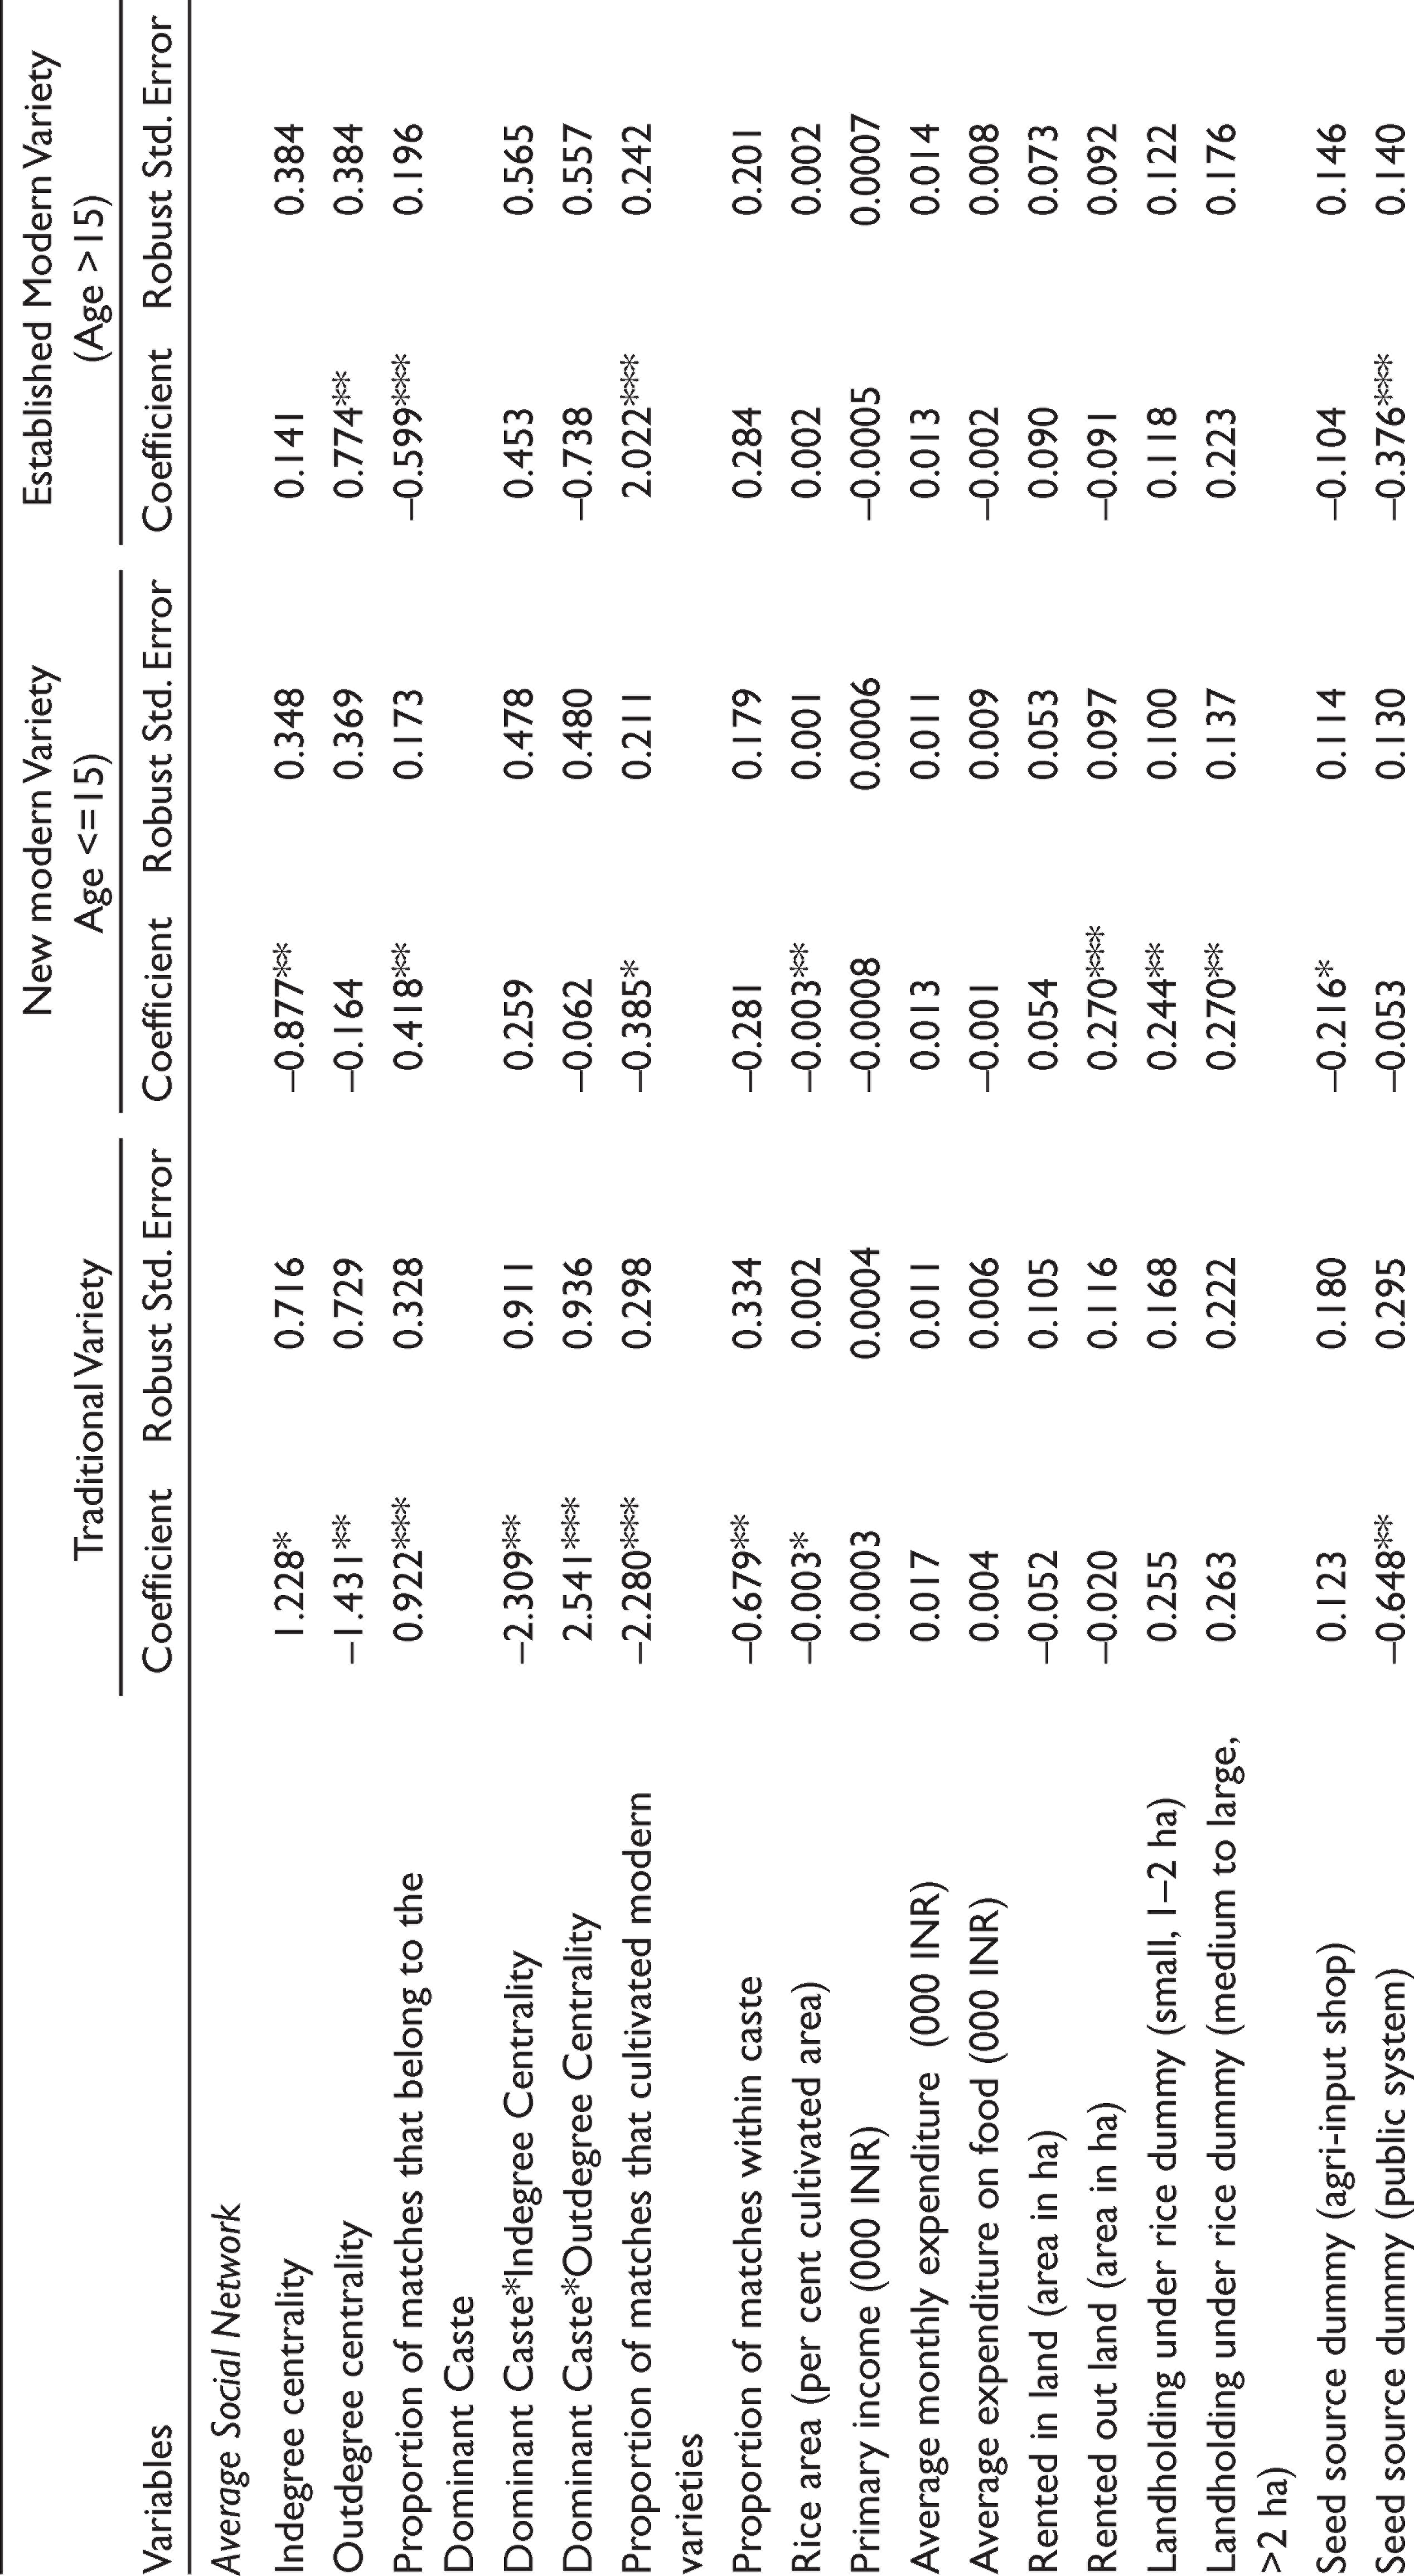
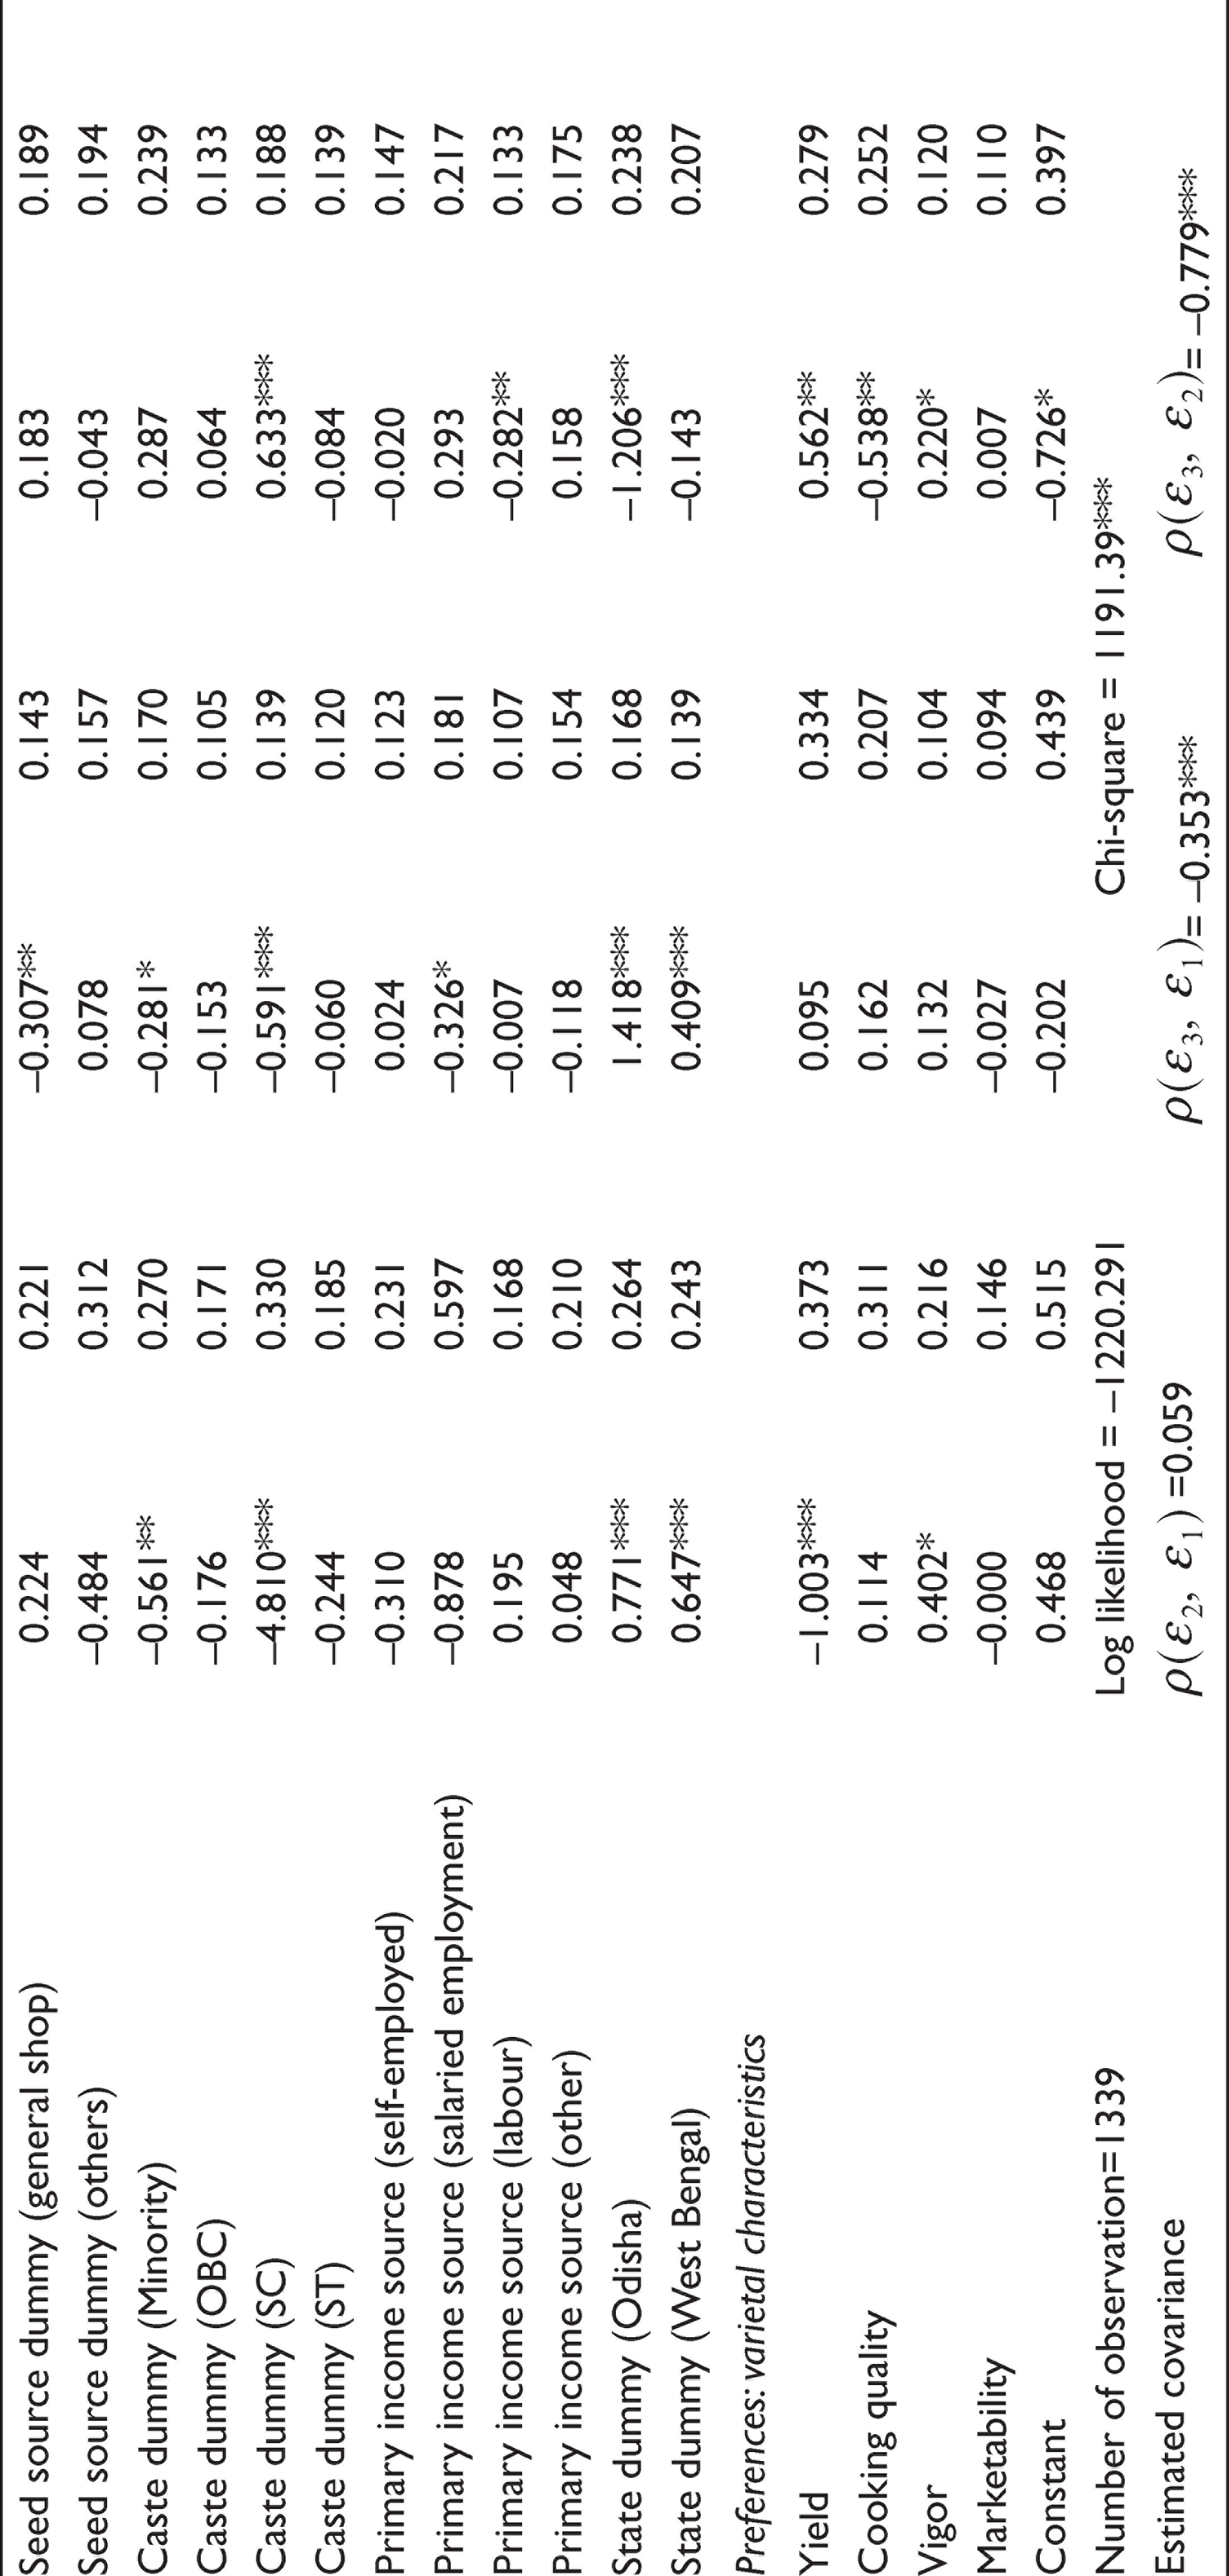
An interaction term, between network centrality and whether the respondent belongs to the dominant caste in the village or not, is used in the model to test the combined effect of caste and informal social networks on adoption. Among respondents having similar indegree centrality, those belonging to the dominant caste will cultivate less traditional varieties as compared to those who belong to the non-dominant caste in the village. However, for outdegree centrality, a respondent belonging to the dominant caste will cultivate more traditional varieties as compared to those who belong to the non-dominant caste in the village. When the proportion of matches in a network who cultivate modern varieties (both new and established) is high, the adoption of traditional and newer varieties decreases, but established varieties are adopted more. Established rice varieties, which have been released a long time back, are widely cultivated in Eastern India and this is reflected in our sample as well. If a respondent’s network has a higher proportion of individuals who belong to the same caste as the respondent, chances of cultivating traditional variety decreases. In short, network and caste-related characteristics have shown significant influence on varietal adoption. Traditional and influential network leaders behave differently. Targeting progressive farmers for the dissemination of newer varieties leads to undesirable outcomes.
While estimating the model, we controlled for other important variables influencing adoption behaviour such as income and income source, land characteristics, varietal preferences, seed source and location. Amount of land that is rented out has a positive and significant impact on the adoption of new modern varieties. Usually, income generation is the primary objective here, and individuals might, therefore, cultivate newer varieties instead of older ones with the hope of more income generation. Percentage area under rice has a negative and significant impact on adoption of traditional and new modern varieties. In a mono-cropping system, farmers depend completely on a single crop, and hence one would expect adoption of established varieties as farmers are less likely to test newer varieties. This would be more pronounced in the case of marginal and small farmers. Compared with marginal rice farmers, small and medium to large rice farmers tend to cultivate more modern varieties that are new, as is evident from the significant and positive dummy used for landholdings under rice. Marginal farmers are usually resource-poor hence one would expect them to cultivate a variety that is safe and established rather than experimenting with newer varieties, whereas larger farmers can afford to experiment with new varieties in a small part of their land. Seed source dummies for the public system, caste dummy and primary income source dummies also have a significant impact on the adoption of rice varieties. Farmers belonging to the Minority and SC categories, compared with those who belong to the General category, cultivate fewer traditional and new modern varieties. These farmers cultivate more established varieties as can be seen from the positive and significant coefficient.
Varietal characteristics such as yield, cooking quality, vigour, etc. do influence the adoption decision significantly. Yield trait increases the adoption of modern varieties, decreases the adoption of traditional varieties, and acts as a driving force for farmers to choose established modern technologies which have a proven track record of higher yield. However, when the farmers considered cooking quality, they cultivated more traditional varieties, which are famous for their special characteristics such as aroma, taste, etc. The estimated covariance between the adoption of established and traditional rice varieties has a significant and negative coefficient (−0.353, significant at 1 per cent level of significance) as shown in Table 7. This implies that farmers who adopt more established modern varieties than what the model predicts are more likely to adopt less traditional varieties than what the model predicts. Similarly, the covariance between adoption of established and new modern varieties is also negative and significant (coefficient of −0.779, significant at 1 per cent level of significance).
Conclusions and Policy Implications
Agricultural productivity depends on the effective targeting and dissemination of new and improved technologies. In most extension delivery systems, these dissemination efforts concentrate on formal channels such as public and private extension services. Those systems primarily target progressive farmers. However, informal channels of dissemination, or farmer to farmer exchange of information and technology, make up a substantial portion of how technologies spread and are adopted. These exchanges are made up of individual networks among farmers that are further characterized by social, political, and economic factors. In this paper, we look at informal social networks among farmers in the context of prevailing caste systems and find that the networks that farmers have with one another tend to be deeply concentrated within dominant caste-based groups as opposed to networks across castes. Further, we look at the adoption of rice varieties as an example of technology diffusion and find that networks with members belonging to dominant castes increased the adoption of newly released varieties.
Strong informal social networks prevail in rural India, which can potentially act as a barrier to the dissemination of technology unless appropriate methods of dissemination are used. Identifying the central leadership and influential point persons in strong social network systems should be the first and foremost dissemination strategy for new technologies. Traditionally targeted nodes such as progressive farmers or extension workers are found to fail in disseminating new varieties, and targeting influential informal leaders who belong to the dominant caste of the village appears to be a better strategy. Such leaders might not belong to the traditional upper-caste category and they often possess matches outside the caste they belong to. Among non-dominant caste members, the influential leaders belonging to OBCs or STs are more desirable targets than other caste groups.
The more concentrated a network is in terms of its caste composition, the faster will be the spread of any technology. Therefore, in order to ensure better targeting of technologies, informal networks among farmers should be identified, keeping in mind the caste composition of the members of such networks, among other things. If a technology is introduced to farmers who belong to a common social network which have similar characteristics in terms of the caste dominance, across caste matches, etc., we can expect faster uptake and diffusion of that technology. Further, as interactions across caste-based networks take place over time, technology diffusion would be accelerated.
Footnotes
Declaration of Conflicting Interests
The authors declared no potential conflicts of interest with respect to the research, authorship and/or publication of this article.
Funding
This work was supported by the Bill and Melinda Gates Foundation through Rice Monitoring System - South Asia project (Grant No: OPP1118610).