
Abstract
Background:
The effects of digital screen use on the physical and mental health of a child are a debated area of research. Studies have established few harmful effects, but the usage among children remains to be high. There is less understanding of the pattern of the digital screen and application usage and its impact on physical and mental health in our population.
Aims:
To study the pattern of digital screen use among children (5-15 years) and its impact on their physical and mental health.
Setting and design:
Cross-sectional study conducted in a tertiary care hospital.
Materials and Methods:
Sociodemographic details of parents and their children, screen time-related questions, pediatric symptom checklist (PSC) for screening of mental health issues, and questions regarding physical health issues in children due to screen use.
Statistical Analysis:
Data was analyzed using R language.
Results:
There is a significant association between parents’ education, gender, and the number of children with screen time. YouTube followed by WhatsApp are the commonly used digital applications and smartphones followed by Smart TVs are the commonly used digital gadgets. The physical issues are less than the clinical cut-off values but significantly associated with screen time. Sleep disturbance and avoiding outdoor activity are frequently reported due to screen use.
Conclusion:
The study highlights the common usage pattern of various digital gadgets and applications among children and their parents; also the demographic factors of parents relating to increased screen time in children. There are no significant clinical mental health issues reported by parents, but a significant association is found between digital screen use with physical and mental health issues.
Introduction
Digital media screens have become an integral part of our lives, from waking up by a smartphone alarm to ending the day with a favorite movie over a streaming platform, be it talking to someone or buying things. Their use through various means has been hastened especially during recent times, it may be attributed to easy access to the internet, or advances in digital technology, or can even be a precautionary measure to reduce the spread of the recent pandemic by Coronavirus disease 2019 (COVID-19). 1
Screen time can be defined as the total time spent per day viewing screens which can include a smartphone, television, computer/ laptop, tablet, or any handheld or visual device. The use of screen time is not limited to a particular age or sociodemographic group. With more routine usage, studies are pointing towards the possible negative effects related to excess screen time, but there are no established hazards identified yet due to excess screen use. Clinicians across various specializations are reporting anecdotal cases of grave consequences of excess screen time, especially in children.2, 3 At the same time, parents are in dilemma as to what type/how much of screen time is acceptable; whether the harmful consequences are worrisome or not. Recently realizing the need to create awareness on this issue various health professional associations4–6 have come up with guidelines to assist parents and clinicians in guiding screen use n children.
Studies on screen time users have found an association between different parameters of physical and mental health among children. Concerning physical health, there has been an association with sedentary habits, 7 an increase in eating junk foods, more prevalence of obesity/ malnutrition, 8 delay in developmental milestones, reduction in physical play activity, poor sleep quality, 9 etc. About mental health, there has been association with decreased interaction with other children, and deficits in attention, intelligence, and social skills which are normally attained at a particular age. 10 There has also been an increase in incidences of psychiatric illnesses like depression, anxiety, and psychopathological symptoms.11, 12
As per our knowledge, much of the research has been conducted among the western population, and the availability of literature from our Indian setting is sparse. Also with recent trends like the easy availability of the internet and accessibility to digital screens, and the COVID-19 pandemic we believe there could be changes in the usage pattern and their impact on mental and physical health. We would like to understand the patterns of use in the Indian setting and understand its impact on children.
Materials and Methods
Aims and Objective
The study aimed to explore the various digital screen use among children and its impact on their physical and mental health.
Methodology
Cross-sectional study conducted among children (5–15 years) attending the pediatric and psychiatry outpatient department accompanying their parents or siblings. The sample was selected based on a convenient sampling technique. Children with a diagnosis of autism, attention deficit hyperactivity disorder, oppositional defiant disorder, or conduct disorder were excluded. Parents of the children were handed over the printed forms after explaining to them the study purpose and asked to answer to the best of their knowledge. If the parent had more than one child in the accepted age group, then they were asked to consider the details of only one child for the study. As most of the parents knew the local language, the study forms were translated and provided to them. A pilot study of 20 parents was conducted to check the validity of the study questionnaire; and after obtaining the feedback the final draft was used, incorporating the necessary changes. The sample size was based on previous studies by Thakur et al 8 and John JJ et al. 10 A total of 350 responses were obtained, among them, 19 responses had missing data and 10 had suspicious answers (like randomly ticking the same boxes or very high/low scores for almost all questions); hence, these were eliminated and 321 responses were included in the study.
Questionnaire
Sociodemographic Details
This is a semi-structured questionnaire to collect all the details related to the study. It includes basic details related to parents and their children aged between the ages of 5 and 15 years. If a parent has more than one child between the age ranges, then he/she will be asked to fill in the details relating to one child for the study purpose.
Screen Time Related Questions13, 14
The questions for assessing screen media use are taken from the SCREENS-Q questionnaire. This questionnaire was designed based on literature, media experts, and end users. It has been found to have good validity and reliability in a Danish study. As there is a dearth of scales for measuring screen time validated for use in the Indian population, the questions from this questionnaire were used to meet the requirements of the study. The scale is available in the public domain and is free to use. Out of the 19 questions, only 6 question domains are included in the study. Most of the other question domains appeared either not relevant to our study objectives or culturally/ economically less suited to our Indian context.
Pediatric Symptom Checklist 17 (PSC)15–17
This is used as a screening tool to assess mental health disorders in the pediatric population. It has good reliability (internal consistency of 0.89 and test-retest of 0.85) which is comparable with Child Behavior Check List and Self Report Questionnaire, but fewer questions and ease of administration made us consider this. It has 3 subscales: Internalizing, Externalizing, and Attention, and is scored on a Likert scale as 0 for “never,” 1 for “some time,” and 2 for “often.” There are 5 questions each about Internalizing and Externalizing and 7 for Attention; the higher the score, the higher likelihood of a behavioral health disorder. The cut-off scores for each subscale have been provided for comparison.
Physical Problems Due to Screen Use in Children
As per our knowledge, there are no validated questionnaires available for assessing physical problems due to screen time use in children. Hence, we prepared a semi-structured questionnaire based on the available literature. Most of the literature has been made into guidelines by various professional health associations.4–6 The questions were designed to keep the parents as the responders. The questionnaire included 8 important physical health issues related to screening time use: sleep, weight gain, dryness of eyes, visual problems (refractory errors), headache, neck/back pain, and reduction or avoidance of outdoor play activities (as COVID-19 restrictions are eased we do not feel that it will confound with this question). Parents were asked to answer either “yes” or “no.”
Statistical Analysis
Filled forms obtained from parents were populated into Microsoft Excel and wrangled for inconsistencies. Forms with unanswered questions or missing critical data were excluded from the analysis. Data were analyzed using R language 18 with R Studio 19 as Integrated Development Environment. In the R language, packages used for various analyses were “summarytools,” “gmodels,” “FSA,” “dunn.test,” and “gpubr.” As the data were not normally distributed (based on the Shapiro-Wilk test), it was analyzed using nonparametric tests, and the median was used to present the data. Statistical tests used were Kruskal-Wallis, Wilcoxson sign rank test, chi-square test, and Dunn test. Some of the relevant data were represented as bar graphs based on the frequencies.
Results
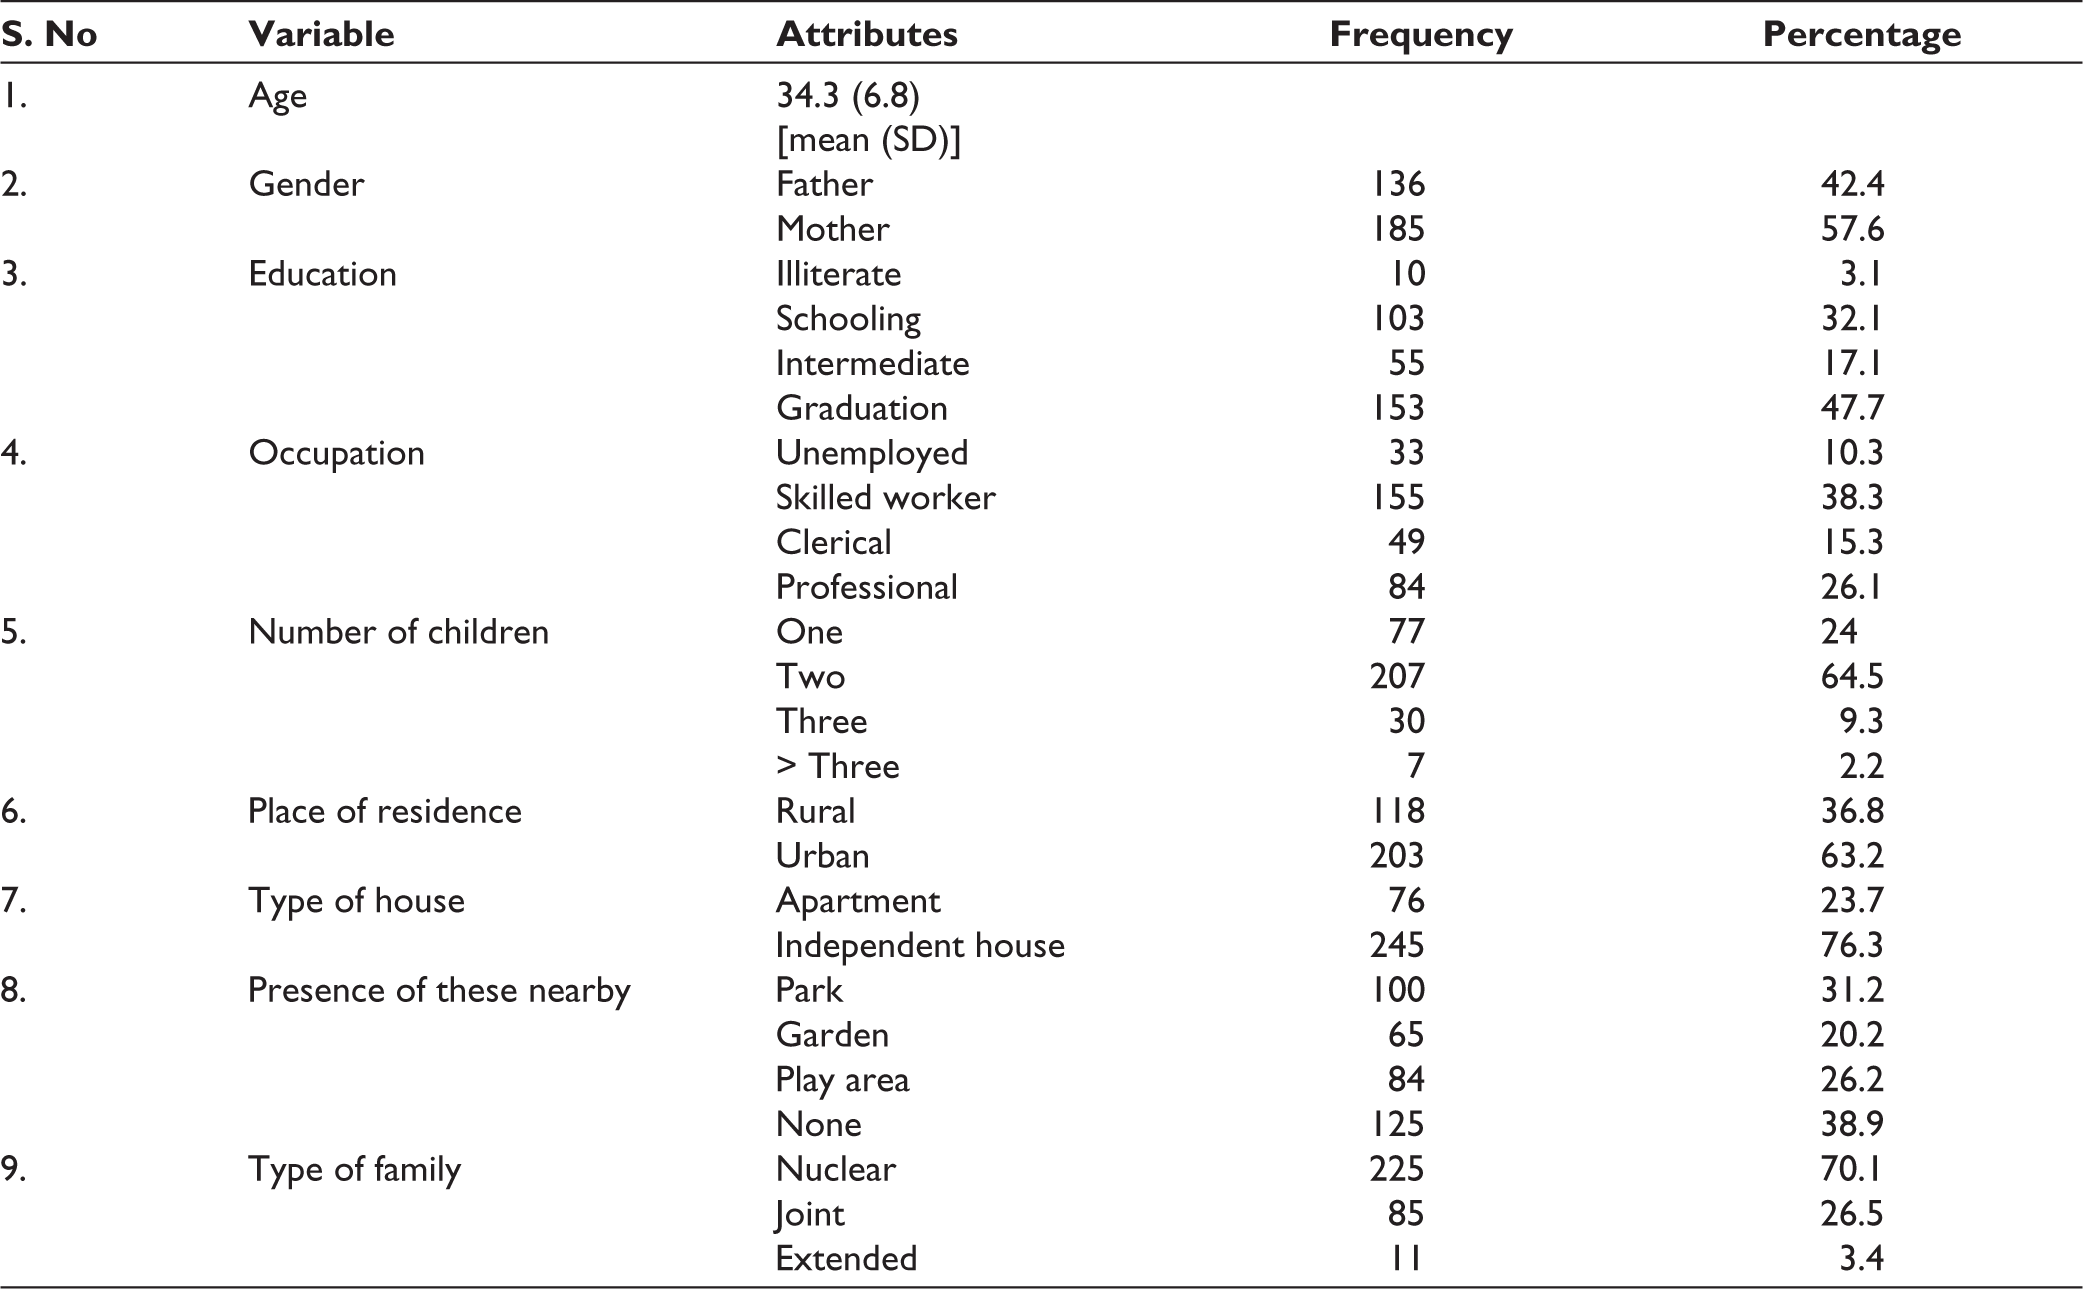
Sociodemographic Details of the Parents and Their Children (Tables 1 and 2)
Sociodemographic Features of the Participating Parents.
Sociodemographic Features of Children.
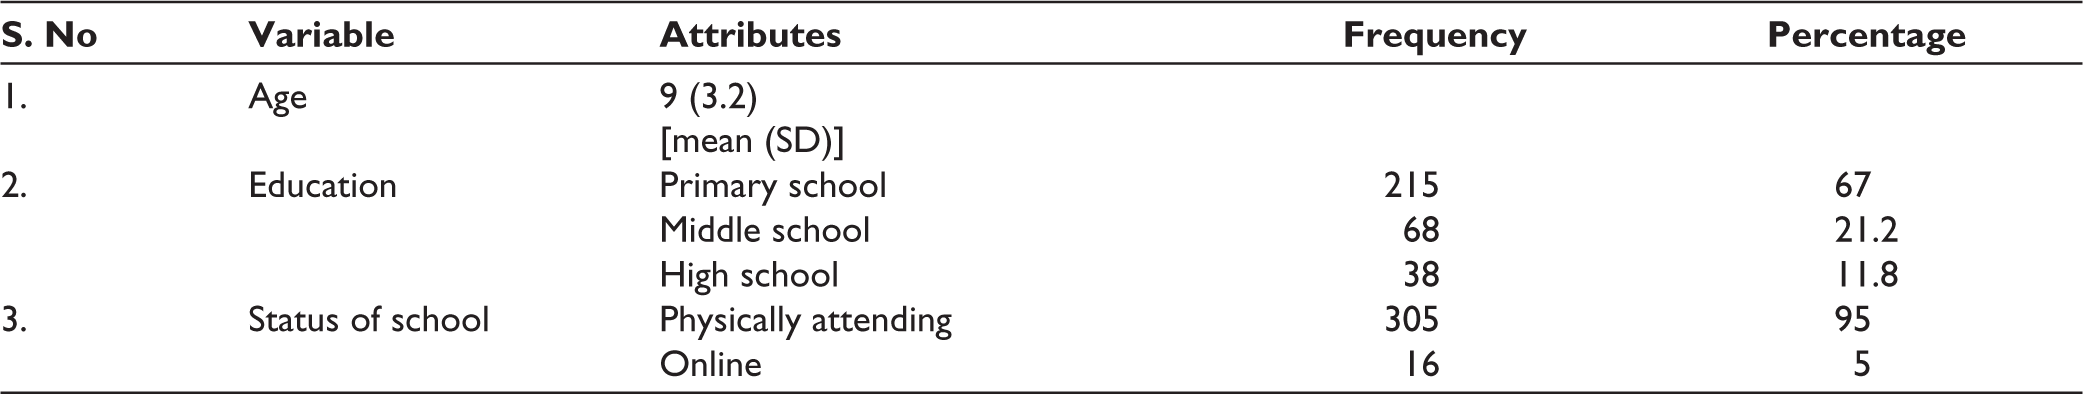
The mean age of participating parents was 34.5 years and that of children was 9 years. The majority of the respondents were mothers (57.6%); nearly half (47.7%) of the respondents were educated up to or above graduation; nearly two-thirds hail from urban settings; a majority (76.3%) are staying in an independent house; 38.9% do not have either park, play area, or garden nearby their home for their children to play. Two-thirds of the children were studying in primary school (first to fifth classes) and 95% of the children were attending school physically. Parents’ educational status has a significant association with the child’s use of screen time, both illiterate and those with graduation or above have higher screen time use across all gadgets except smartphones (no significant association is found, P = .141). There is also a significant association between the number of children and usage of screen time, across all gadgets (except computer or laptop, P = .114 and video game, P = .401) the usage is more with a single child.
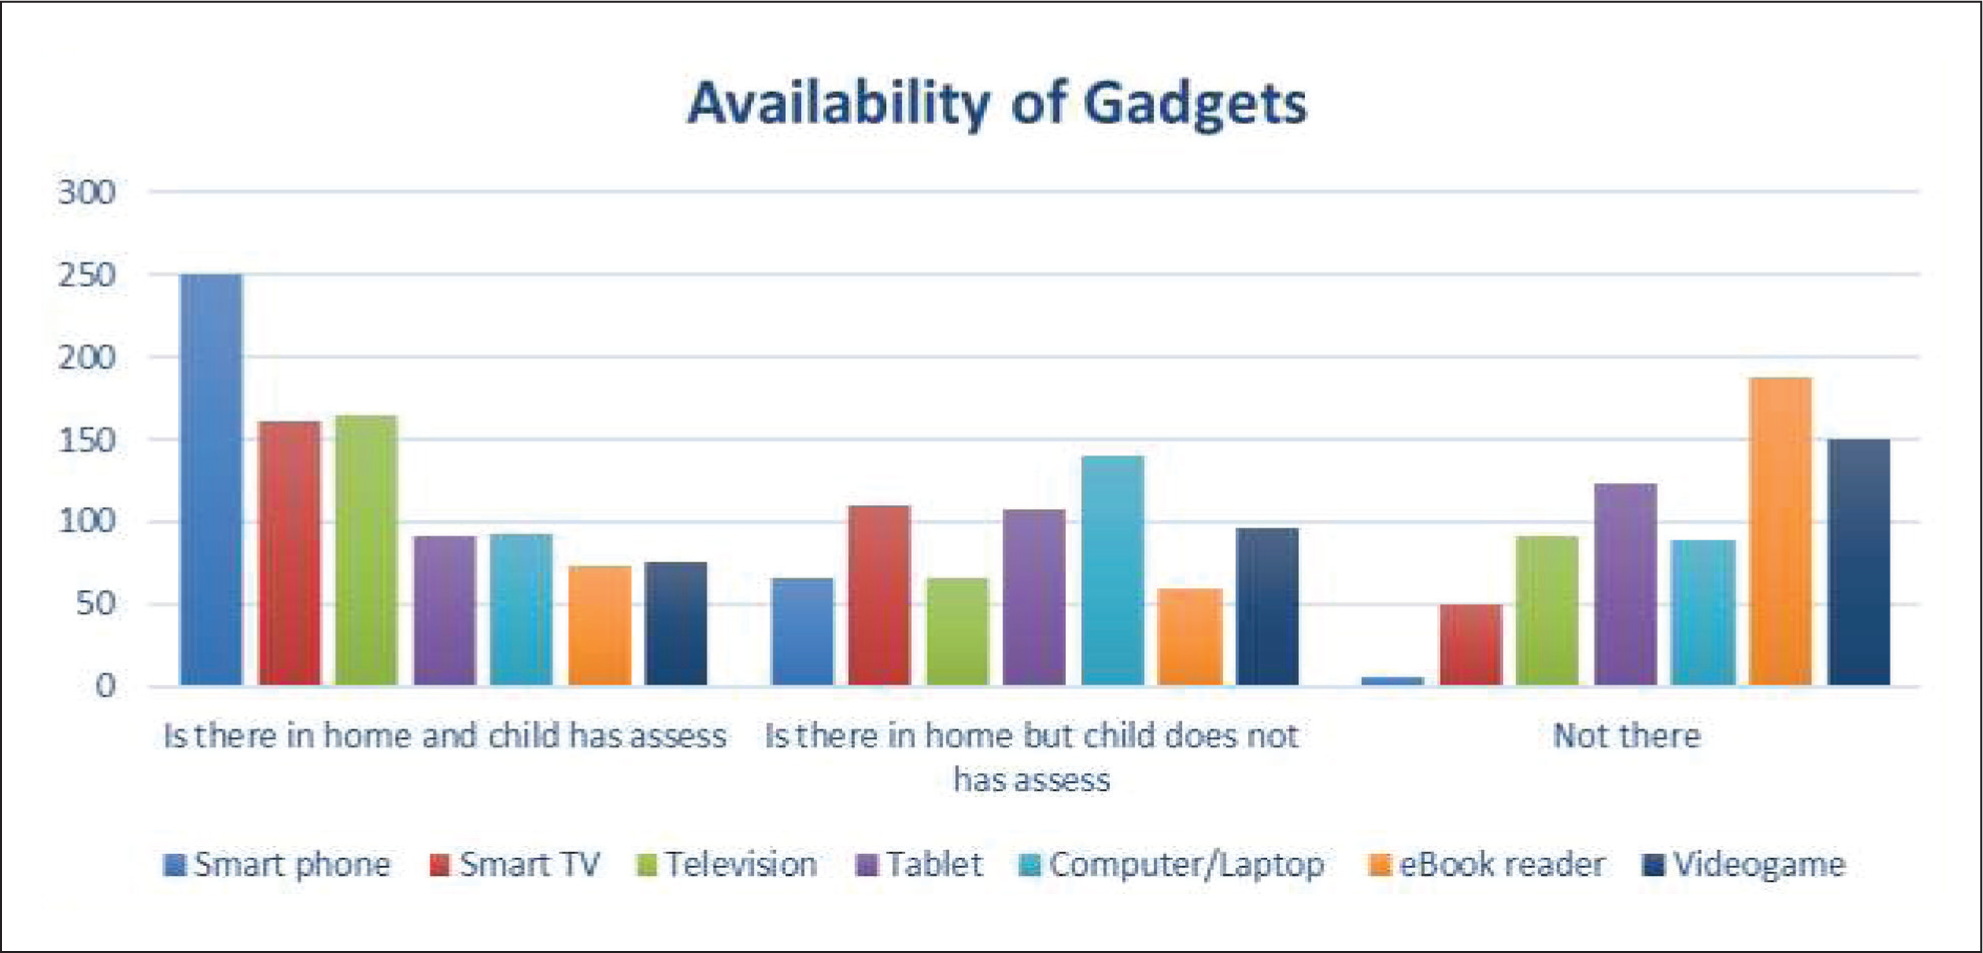
Gadget and Applications: Availability and Accessibility to the Child in the Home (Figures 1, 2, and 3)
The Availability and Accessibility of Various Gadgets.
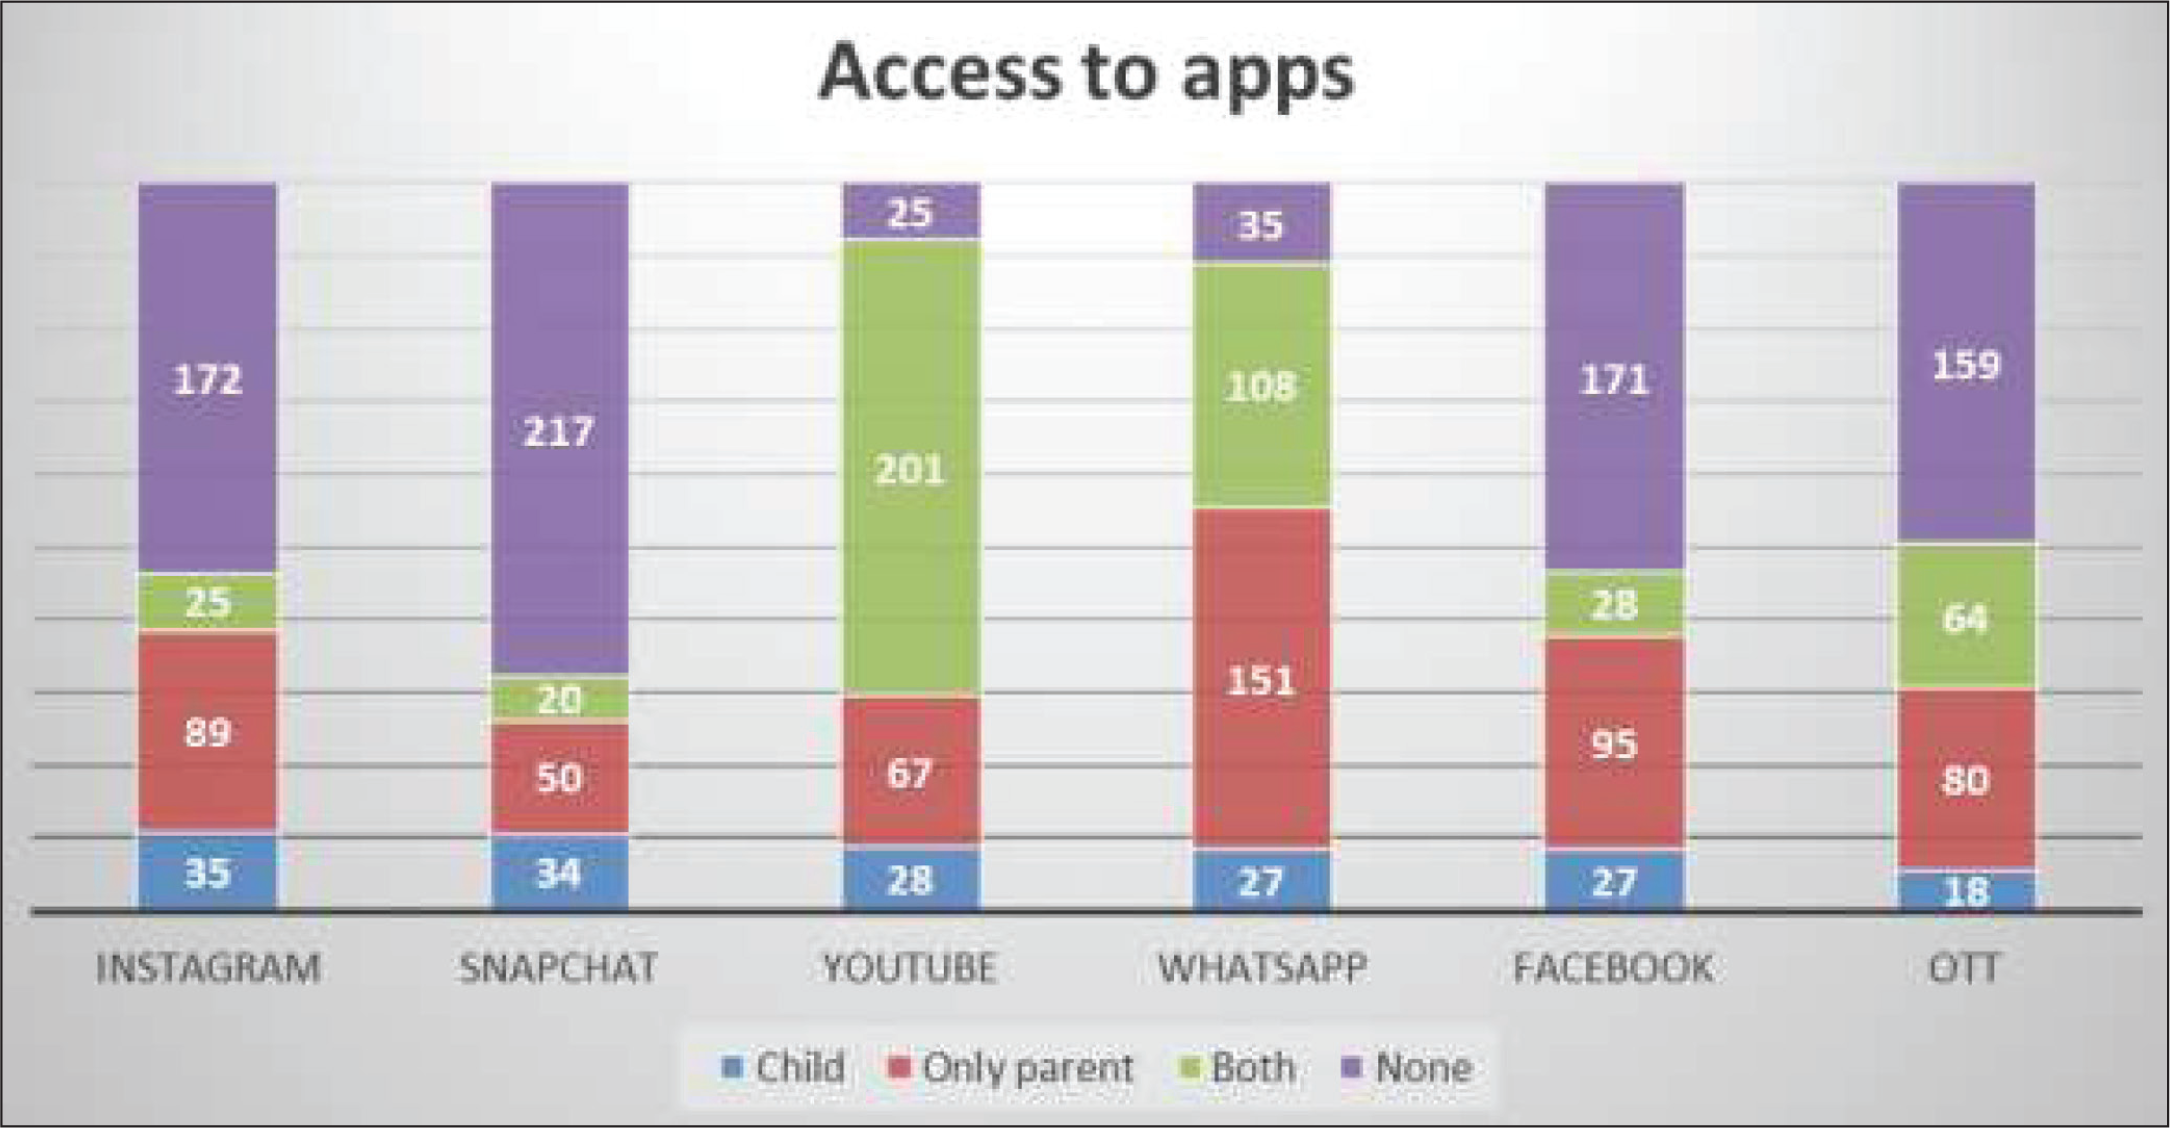
Accessibility for Child, Parent, or Both for Various Applications.
The Usage Frequency for Various Gadgets Over a Week for a Child.
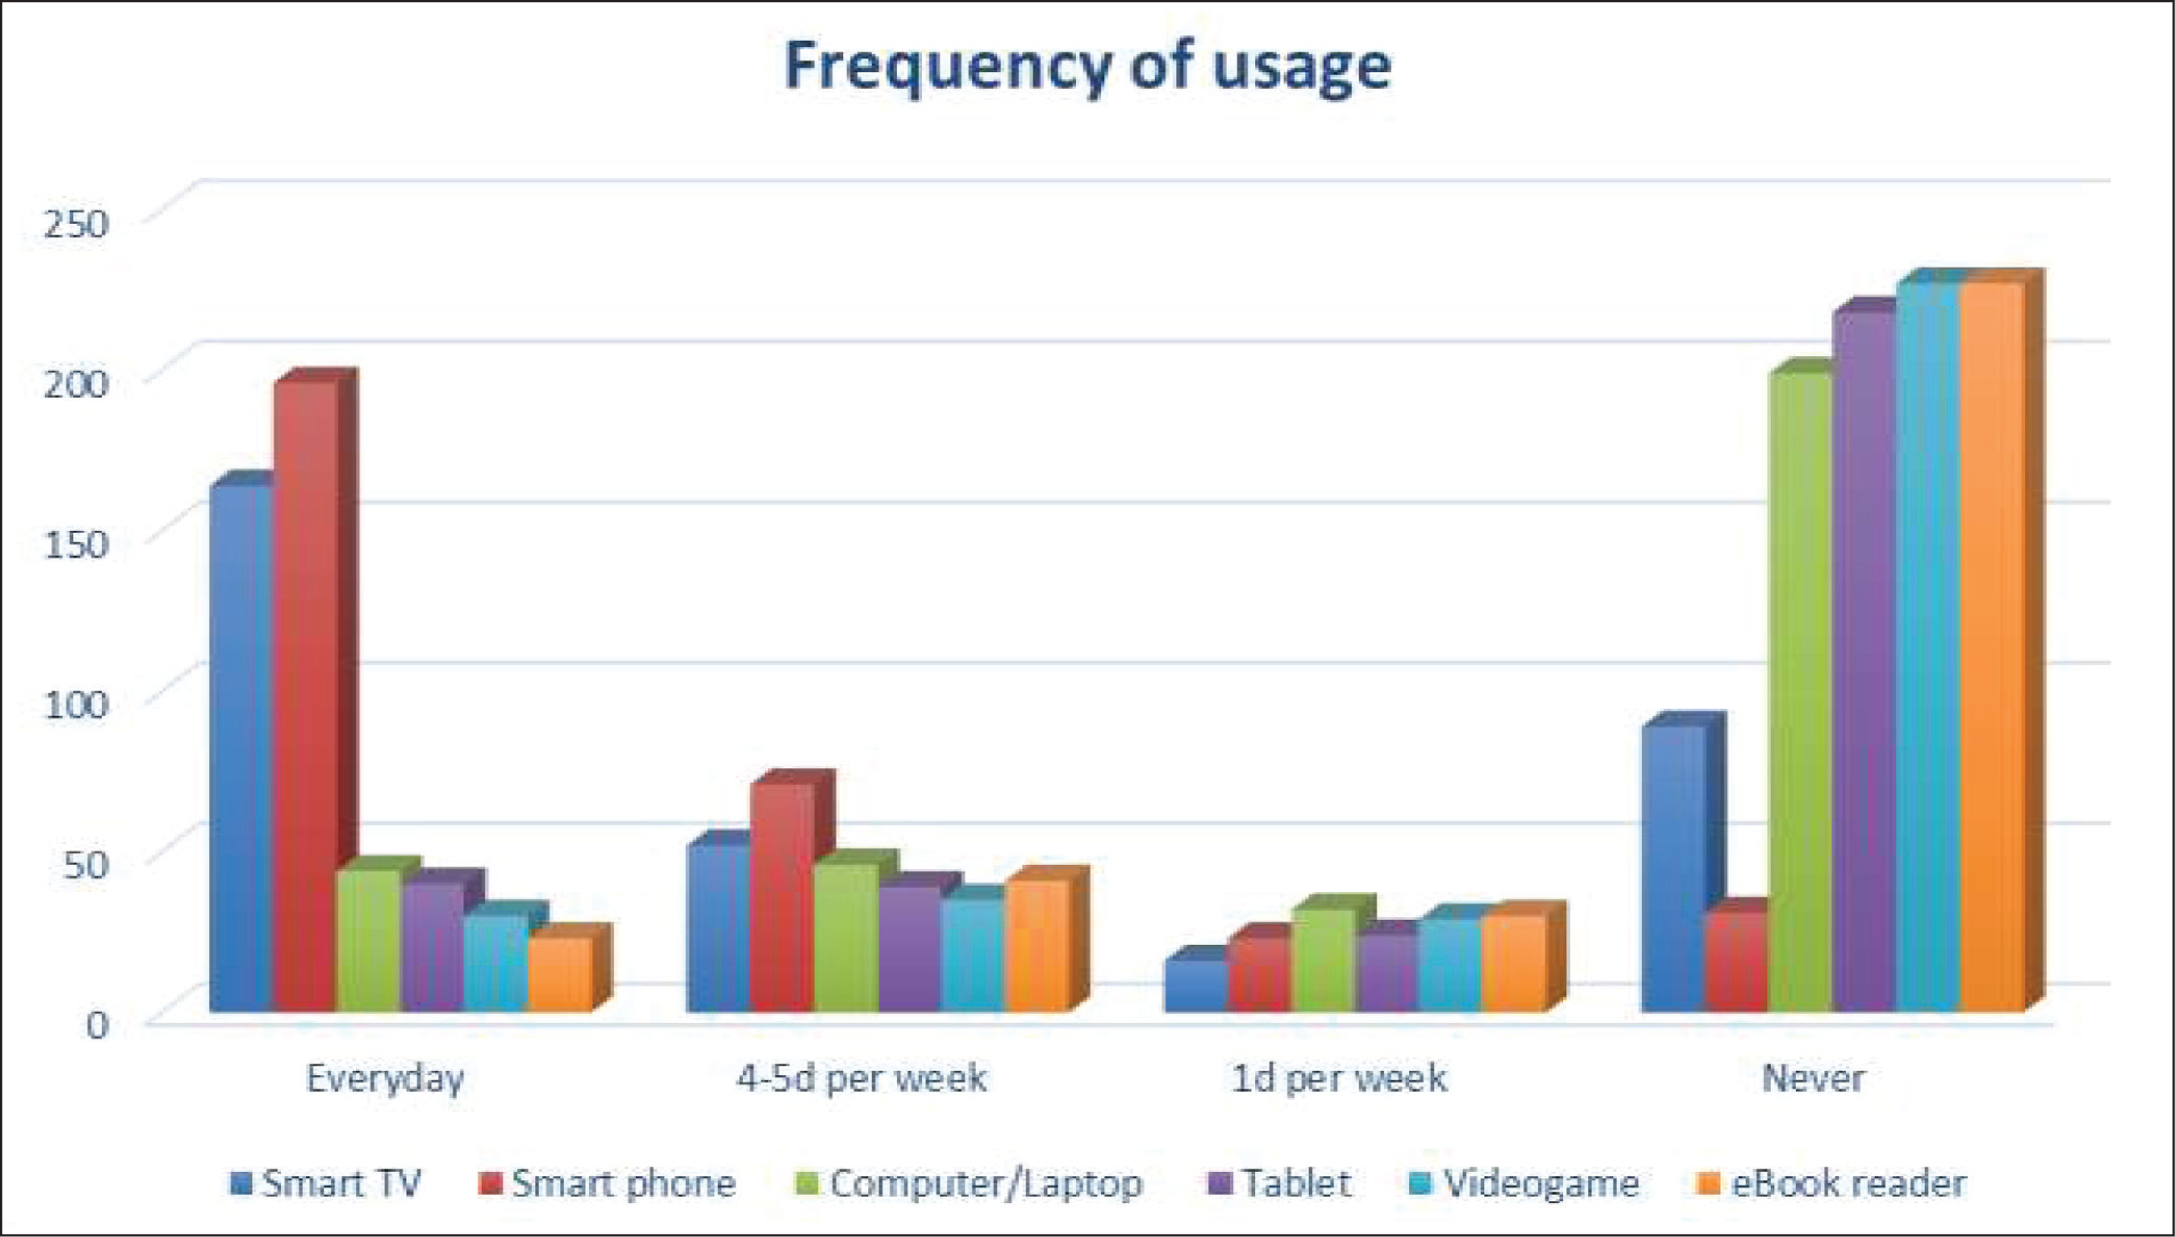
The smartphone has the highest accessibility (77.9%), followed by conventional television (TV) (51.4%) and smart TV (50.2%). Also, these are the devices to which the child has access every day. Those present at home but with less accessibility were computers or laptops (43.6%); followed by broadband connection (37.7%). The device which is reported not being present was an eBook reader (58.6%), followed by a video game (46.7%). For the majority of digital applications, child-alone usage is less than 10% (Instagram 10.9%, Snapchat 10.6%). The commonly used digital application by both parent and child was YouTube (61.6%), followed by WhatsApp (33.3%) and over-the-top (OTT) (19.9%) platforms.
Rules for Child’s Use of Screen Media (Table 3)
The Rules Followed by Parents for Child’s Screen Use.
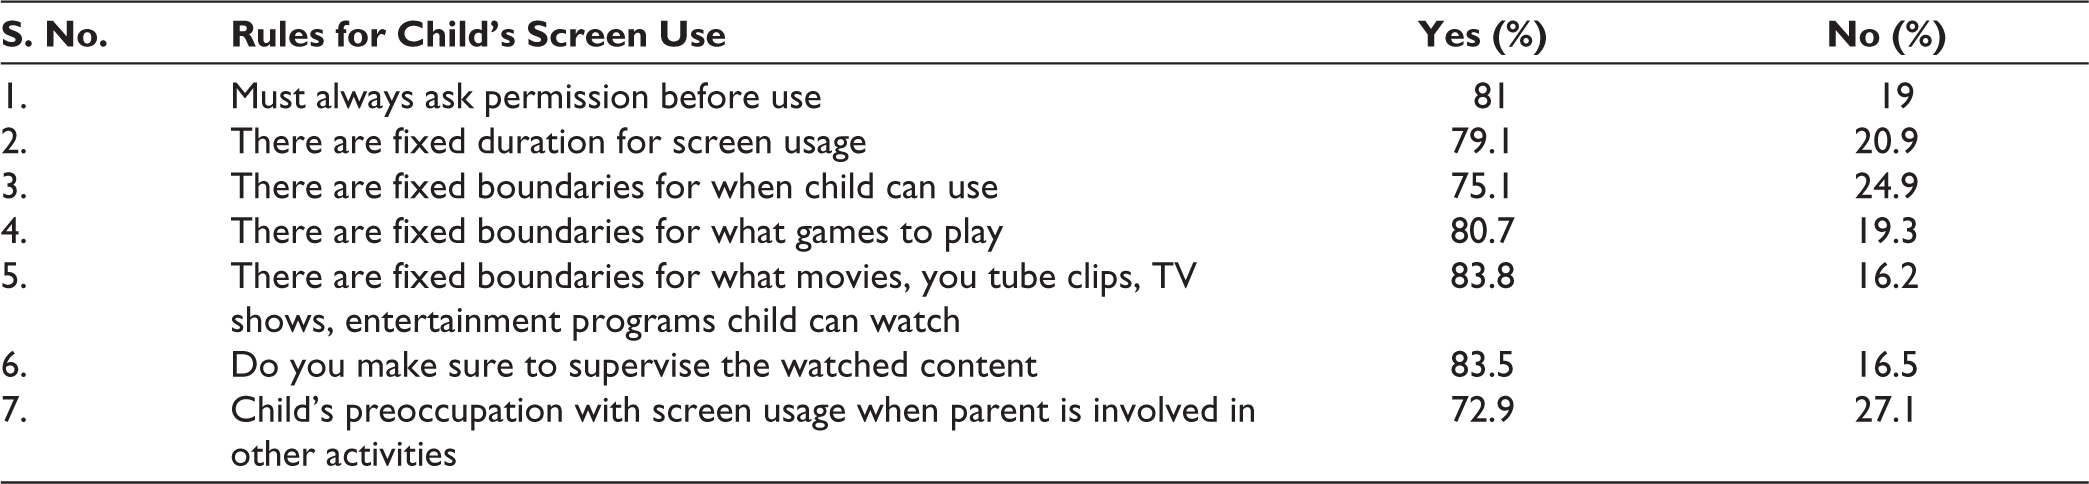
A majority of the parents report that they follow some rules for their child’s use of a screen. In almost all the questions, a control (replied as “yes”) is exercised ranging from 75% to 85%. Most of the parents were particular in that they make sure that they supervise the content the child is watching and have fixed boundaries on the content that the child can watch.
Variation of Screen Use Across Weekdays/ends and Ages (Figure 4 and Table 4)
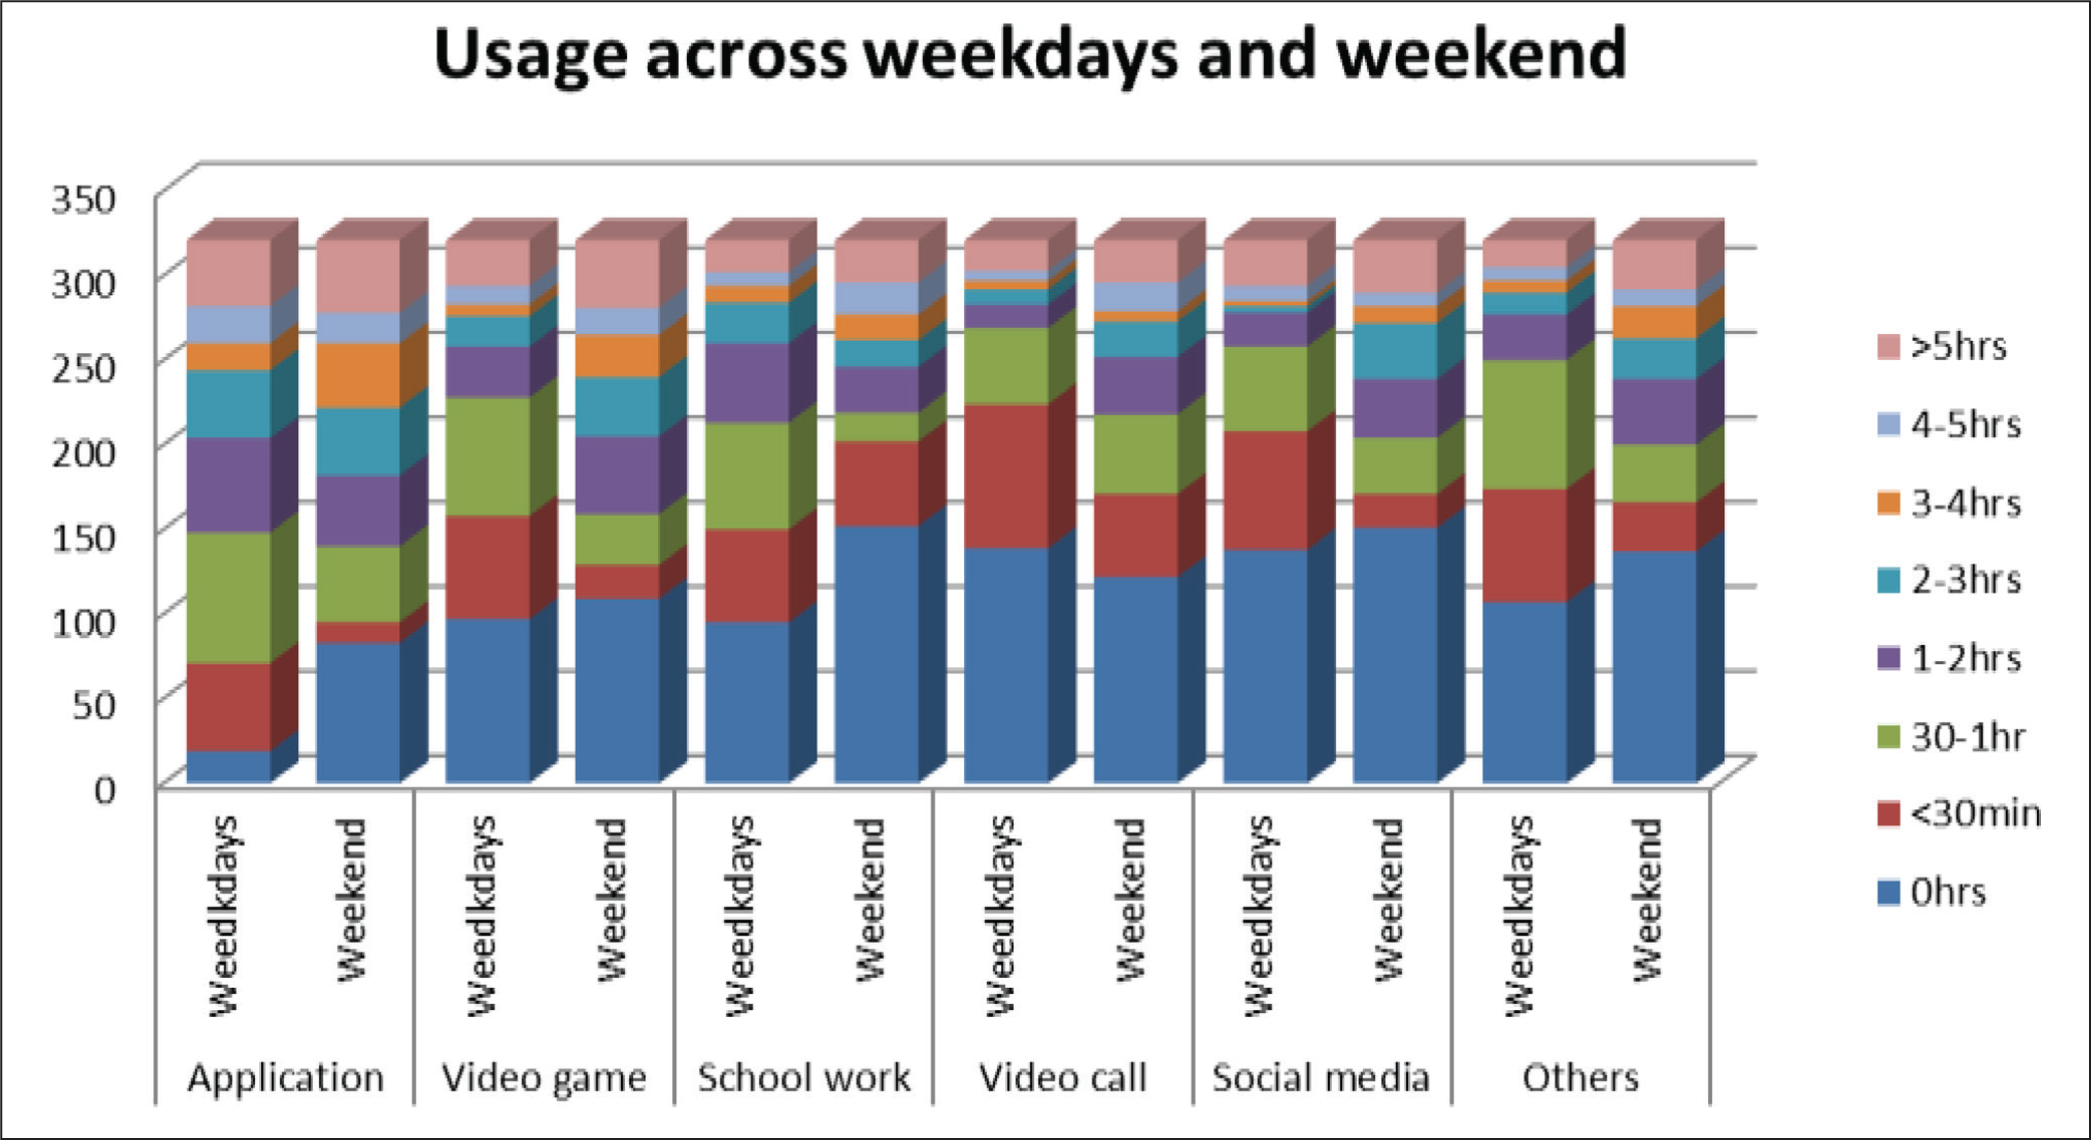
Hours of Usage Across Weekdays and Weekend.
Difference in Various Digital Screen Usage Between Age Groups (Both Taken as Qualitative Variables).
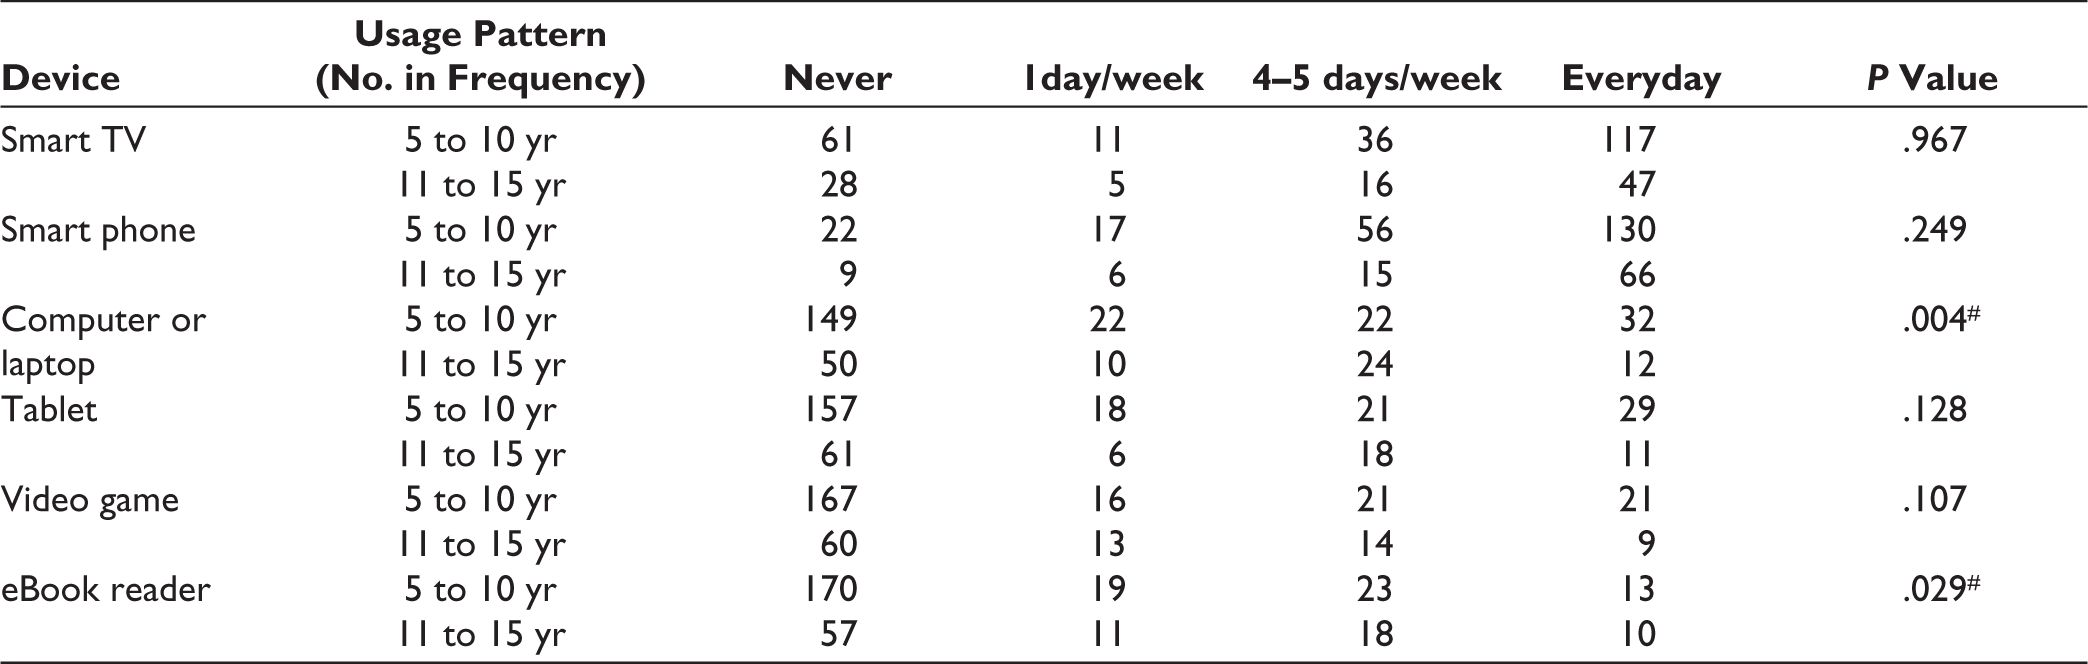
# test used: Chi square test; P value < .05 is significant.
A majority of parents’ report that the usage of digital applications (for movies, entertainment programs, etc) and social media is less than 30 minutes during weekdays, which increases by at least half to one hour during the weekend (considered as only Sunday in the study). The usage of video games, video calls, and others (drawing applications, composing music, and making videos) increases to 2 hours during the weekend from less than 1 hour during weekdays. But the usage for school-related tasks decreases from 1 hour during weekdays to less than half an hour during the weekend. There is also a significant association between usage patterns between weekdays and weekends for all except digital applications (P = .720) and school-related work (P = .066). Across age groups, there is a significant difference in usage of computers or laptops (P = .004) and eBook readers (P = .029), which is more among 11 to 15 years than among 5 to 10 years. There is a significant association between fathers’ (compared to mothers’) report of screen time use (more than 4 days per week) for almost all gadgets (except video games, P = .160 and ebook readers, P = .516).
Association of Gadget and Various Application Use with the PSC Scores (Tables 5 and 6)
Association Between the Various Gadget Usage and PSC Total Scores.
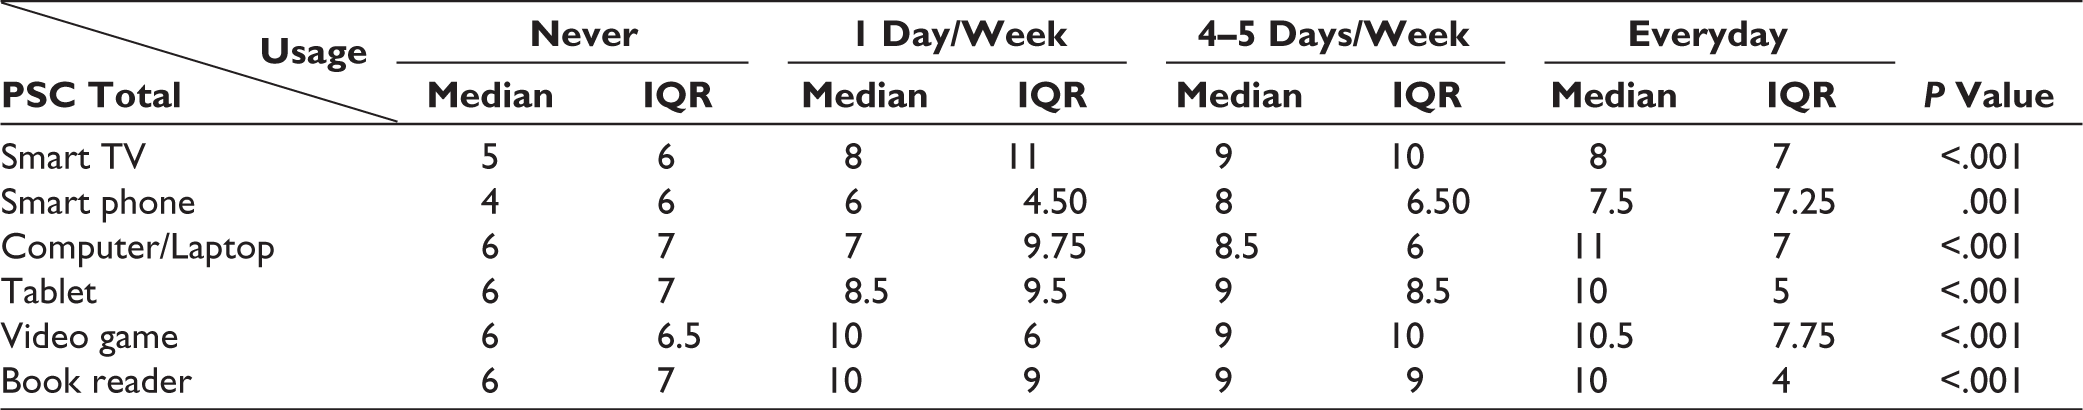
# test used: Kruskal-Wallis and Dunn test; P value < .05 is significant.
Association Between the Various Application Usage and PSC Total Scores.
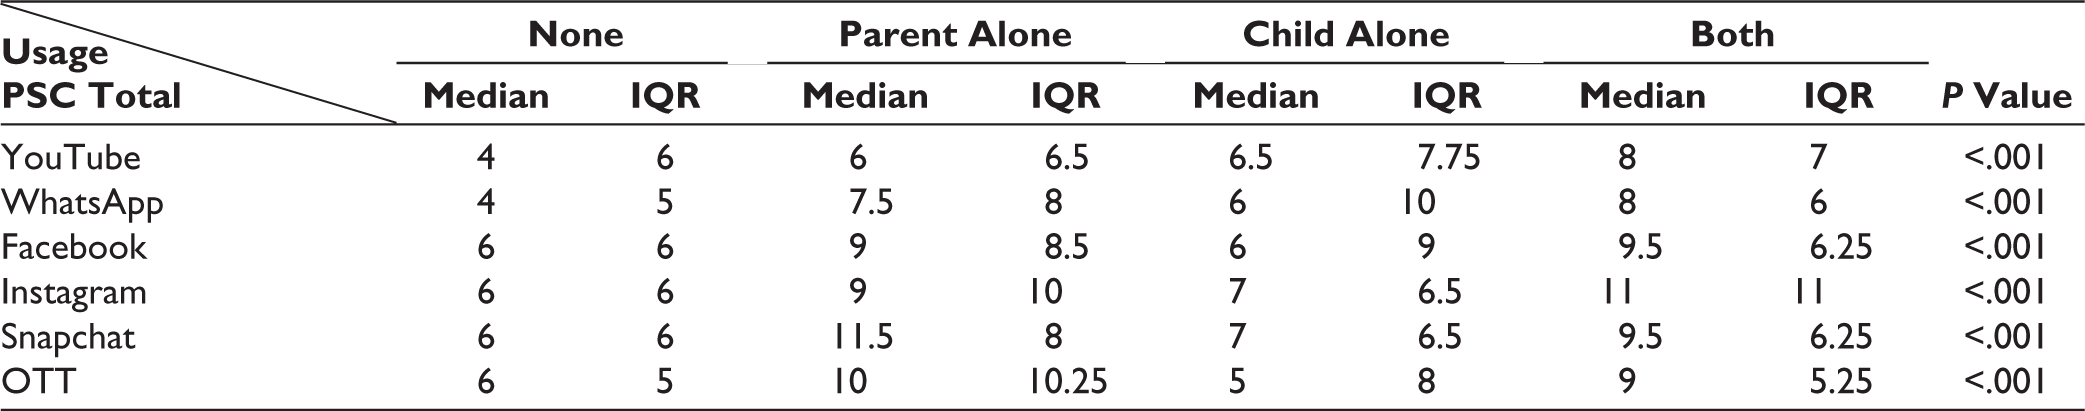
# test used—Kruskal-Wallis and Dunn test; P value < .05 is significant.
The median and range values for various PSC subscales were 2 (3); 3 (3); and 2 (3) for Internalizing, Externalizing, and Attention, respectively, and the total score was 7 (7). The values reported were below the cut-off values (Internalizing > 5, Externalizing > 7, Attention > 7, and Total > 15) for all the subscales and also the total score. Those scoring more than cut-off values (frequency [percentage]) were: 15 (4.7%), 23 (7.1%), 6 (1.8%), and 40 (12.46%) for Internalizing, Externalizing, Attention and Total score, respectively. But a significant association was found between the various gadget use and the PSC total scores. The median scores were high for all gadgets when used more than 4 days per week. Similarly, a significant association is also found between the various digital application usage and the PSC total scores. But when comparing the with the accepted IAP screen time, there was no significant association (P = .180). The median scores of PSC were high for combined usage (both parent and child) in the case of all except Snapchat and OTT, where just parent usage has high median scores.
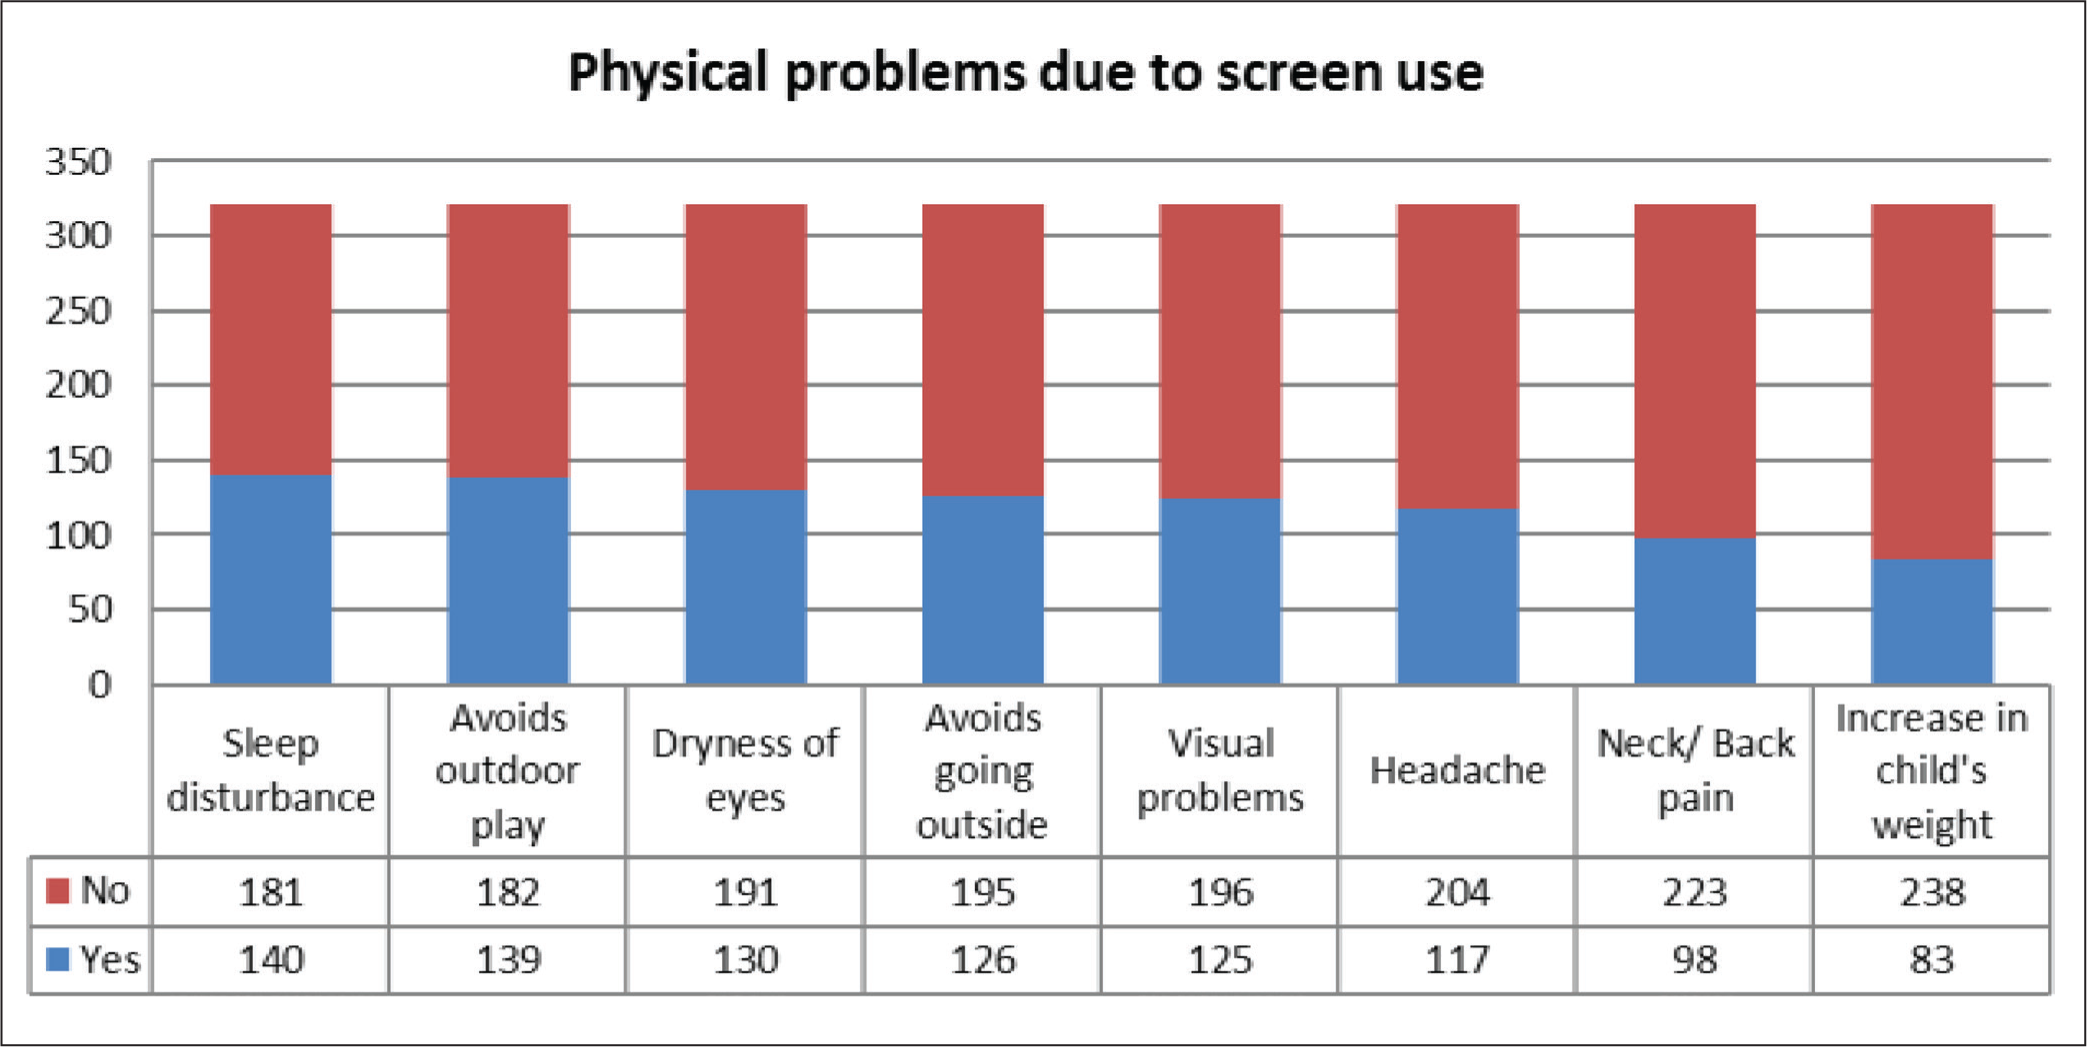
Physical Problems Reported Due to Screen Use (Figure 5)
Most common complaints noted by the parents due to screen use were sleep disturbances (43.6%), avoiding outdoor play activity (43.3%), and dryness of eyes (40.5%). Fewer parents were reporting an increase in their child’s weight (25.9%). A significant association is found between the various gadget used and the physical problems reported by parents, except in the case of a smartphone with weight gain and video game usage with avoiding outdoor play and going outside. Based on the IAP guideline cut off for screen time, there is an association between more screen time usage with headache (P = .008) and avoiding outdoor play (P = .019).
The Physical Problems Reported by the Parent in Child Due to Use of Screen.
Discussion
The study finds that number of days for which various gadgets are used among children has an association with mental health issues. When the days of usage per week are more than 4, the reported mental health issues appear to be more. But the (PSC) cut-off values are below the clinical range of abnormal. A study by Przbylski et al 20 found that the association between screen time and mental well-being is nonlinear and a moderate engagement in screen time is not harmful. They found that the effects of the screen depended on whether it was used on weekdays or weekends and also the type of digital gadget being used.
During the weekend, the duration of digital gadgets and application use is increased by at least half an hour to one hour and it is decreased for school-related work to less than half an hour. This is understandable as the school is closed and the usage is shifted to more entertainment activities such as video calls, video games, and social media. But this excess of screen time more than the prescribed limit (IAP guidelines) is not associated with mental health but with physical issues such as headaches and avoiding outdoor play. Excess screen time is also reported by Rathnasiri et al 21 from Sri Lanka, John et al 10 from Kerala, Lan et al 22 from Hong Kong, and Hinkley et al 23 from Australia. Also, screen time usage is more when there is a single child in the family, it may be because when there are two or more children, they have relatively more activities to keep them engaged rather than only using screens.
Among the digital gadgets, smartphones and smart TV are the ones that are used by children on an almost daily basis. A study conducted in South India found the most common digital gadget is a mobile followed by Television. 24 A similar study exploring the electronic screen device in Sri Lanka found the most commonly used digital screen device was conventional television followed by a smartphone among preschool children and the common reason for using digital media is for viewing cartoon programs.10, 21 As the smartphone is most commonly available (up to 66.21% penetration rate in India 25 ) and easily carried anywhere, it may be the reason why it is the most commonly used digital gadget.
Among the digital applications most accessed together (both parent and child) are YouTube and WhatsApp. We believe that the use of most of these digital applications by parents is to engage the child or for recreational purposes. A study by Babic et al 26 found that screen time for recreational purposes has a negative association with mental health and that nonrecreational use had no such association. Among the parents, fathers reported more screen time compared to mothers, we believe this may be because fathers are not aware of how to engage their children other than giving them screens or being busy with their work that they keep the child engaged with a digital screen. A similar explanation has been suggested by Kabali et al 27 —parents gave devices when doing chores or calming them and at bedtime. Also, parents who are illiterate or higher educated have more screen time; this is similar to the findings by Rathnasri et al. 21 We believe this could be because they are busy with work most of the time and may not provide time to their child and hence the easy access to gadgets to the child.
The usage pattern, that is, either parent using alone or both (parent and child) using together has a link with mental health issues. The mental health issues are more when both are using rather than the child alone using them, but the cut-off values are below the clinically accepted range of abnormal. Inconsistent supervised screen time was significantly associated with deficits in attention, intelligence, and social skills. 10 Similarly, studies by Skvarc et al 28 and Ganesh et al 29 found that entertainment TV viewing was associated with lower academic achievement. We found that usage by both is associated with mental health issues; so probably it is just not the supervised viewing but the content is also important. A similar suggestion has been put forth by earlier study, 29 where they suggest that the quality of screen time should be given more importance than quantity. Even parent-alone usage can lead to “technology interference,” 30 meaning parenting is affected and this predicts the child’s screen use. There may be a bidirectional link between screen time and mental health issues—Johnson et al 31 found that excess screen time is significantly higher among depressed individuals, whose parents had frequent fights and those who didn’t participate in outdoor play. Similarly, Magee et al 32 found that there is a bidirectional link between sleep and screen usage among children.
The common physical problems reported with digital screen use are sleep disturbance, avoiding outdoor play, and dryness of the eyes. These are associated with the usage pattern of various digital gadgets and also when used more than the prescribed screen time. A study by Kaur et al 33 found that higher screen exposure was associated with sleep problems like bedtime resistance and morning waking-up problems. A prospective cohort study 30 found that every one hour of screen time per day is associated with 0.22 higher body mass index after a one-year follow-up among children. In the current study, there is an association between screen time and parents’ perception of a child’s weight gain, but our finding is limited because the finding is not objectively assessed.
The majority of parents have reported placing some rules for the child’s use of screen time, but the reported screen time is still high. They may be using these rules to keep the various gadgets under their control but may not be aware of the harmful effects it causes or the proper ways to control screen time. A study by Milford et al, 34 reported that the majority of parents use both restrictive and active mediation methods to limit screen use which sometimes resulted in tension and opposition from children leading to increased screen time. Another study by Samaha et al 35 found that screen media rules by parents are negatively associated with exceeding the limit for screen time. They felt that parents should be educated to avoid screen-related parenting practices (controlling screen time for the good or bad behavior of the child) to reduce screen time. Singh et al 36 suggest a practical way of going about with the problem; they propose that having a well thought and discussed family digital media plan in collaboration with family members would be a better way of promoting healthy screen time, this would also prevent any negative resistance.
Finally, screen time and its impact on health issues is an ongoing area of research. Various guidelines mention what ideal screen time is allowed as per the age of the child which is least likely to cause harm, but parents need to be educated on how to implement them. There is strong evidence for the harmful effects of screen time on depression, sleep, cognition, and attention, but there is a lack of strong evidence for others like behavioral consequences, social adhesion, and multifaceted long-term effects.
Conclusions
The study highlights the common usage pattern of various digital gadgets and applications among children (5–15 years) and their parents, also the demographic factors of parents relating to increased screen time in children. There are no significant clinical mental health issues reported by parents, but a significant association is found between digital screen use with physical and mental health issues. Objectively identifying physical problems and detailed evaluation of mental health issues might reveal meaningful implications. Future studies should focus on understanding the psychological reasons and mechanisms of this association and also help in bringing out practical solutions to parents in our Indian context.
Limitations
The sample size was based on previous studies by Thakur et al 8 and John JJ et al. 10 The questionnaire used to understand the screen time and physical issues due to screen time was not validated. There is a possibility of self-report bias from the parents regarding screen time use. The physical problems assessed were purely based on the parent’s perception of the child’s digital gadget use; hence, there may be other reasons which might have been overlooked.
Supplementary Material
The supplementary material for this article is available online.
Footnotes
Acknowledgements
We would like to acknowledge the assistance provided by Dr Shivani Manchirevula in data collection and proofreading the final manuscript.
Declaration of Conflicting Interests
The authors declared the following potential conflicts of interest with respect to the research, authorship, and/or publication of this article: The manuscript has been read and approved by all the authors, the requirements for authorship as stated earlier in this document have been met, and that each author believes that the manuscript represents honest work, if that information is not provided in another form.
Ethical Approval
The study has been approved by the Institution’s ethics committee vide letter: IEC/CD/2022 dated June 28, 2022.
Funding
The authors received no financial support for the research, authorship, and/or publication of this article.
Informed Consent
Consent has been obtained from all the participants (parents) as per the ethics committee recommendations.
References
Supplementary Material
Please find the following supplemental material available below.
For Open Access articles published under a Creative Commons License, all supplemental material carries the same license as the article it is associated with.
For non-Open Access articles published, all supplemental material carries a non-exclusive license, and permission requests for re-use of supplemental material or any part of supplemental material shall be sent directly to the copyright owner as specified in the copyright notice associated with the article.