
Abstract
Background:
Studies in the field of learning disability (LD) have repeatedly shown that majority of the LD students experience negative social comparisons, result in negative self-perception (SP), especially in the classrooms. Literature has also described that these students are more prone to develop mental health issues which may reflect in the way they behave within the classroom. Though studies have been found done separately on some of the dimensions of SP, psychological well-being (PWB), and classroom behavior (CRB) on learning disabled and their normal peers, no scientific study was found done together either in India or abroad.
Objectives:
The study aims at comparing the differences in SP, PWB, and CRB of students with and without LD. The study has also attempted to assess the relationship and influence of SP and PWB on CRB of the learning-disabled students from the schools of Kerala.
Method:
A representative sample of learning disabled (N = 225) and normal pupils (N = 260) was selected for the study. The data was collected using a scale of SP, mental health profile, and CRB inventory along with a personal information sheet. The data was analyzed using (a) independent t test (two tailed t test for significant difference between the means of independent samples), (b) computation of statistical indices like mean, percentages, and standard deviation, (c) Pearson’s product moment coefficient of correlation (r), and (d) stepwise multiple regression analysis.
Result:
Results indicated that the pupils with LD were found to show lower SP, low PWB, and exhibit poor CRB in comparison to their normal peers. It was observed that there is a significant positive relationship found among all the major variables under the study namely, SP, PWB, and CRB of the learning-disabled students in the schools of Kerala. Findings also revealed that SP and PWB has a combined effect on CRB and PWB was found to be a better predictor of CRB of the learning-disabled students.
Conclusion:
The result of the study implies the need for enhancing the SP and PWB of LD students so as to improve their CRB with the help of psychologists, special educators, teachers, and other school authorities.
Introduction
In India, of late attention has been drawn toward the education of learning-disabled students. Students with LD constitute the largest and fastest growing population of special children in schools. Most of these students with LD are not identified for many years. As demands of the school increase, many of these students fall further and further behind their classmate’s academic achievement. There arises a distinctive gap between their potential and actual educational attainment. Such students may face persistent academic failures and their self-concept is particularly at risk.1, 2 In addition, identifying them as exceptional and isolating them from the larger school population for instructional purposes may result in further diminution of self-concept as a result of the stigmatizing effect of handicapped labels.
It is seen that social comparison processes play an important role in the formation of LD student’s perceived academic competence. LD student’s perception of stigma is related to negative social comparisons in terms of low self-esteem and high symptoms of psychological distress. 3 So they perceive themselves as less academically competent than normally achieving students in their regular classes. 4 Though students with learning disabilities (LDs) are often partly accepted by peers, they are found exhibiting deficiency in positive social behavior as compared to their nonhandicapped counterparts. 5
Problems related to psychological well-being (PWB) in people with LDs are more common than in the rest of the population. 6 Learning-disabled students frequently show the signs of social and emotional disorder as well. Most of these students get isolated in some way from their regular classroom activities and they begin to feel “different.”
Within the classroom, self-perception (SP) of learning-disabled students is commonly found to be negative. 7 Compared to their classmates without disabilities, students with LD are less socially accepted.8, 9 They have difficulty in developing close friendships10, 11 and are more often victims of bullying.12, 13
Studies related to SP have shown that LD students are more negative in their SP across domains compared with normally achieving students.7, 14 It has also been seen that individuals with LD display low self-concept,15–20 lower self-esteem,2, 21–23 and their self-efficacy beliefs are comparatively lower than their peers.20, 24, 25
Review of studies related to PWB of LD students has shown that young people with LDs are significantly more at risk of developing mental health difficulties than their nondisabled peers. 26 LD students are also more anxious and prone to depression than students without LD27–29 and it has been noted that LD students experience a higher level of anxiety than their normal peers.19, 30 Studies related to classroom behavior (CRB) suggest that students with LD show a higher than normal rate of behavioural problems 31 and they are more prone to show behavioral problems because approximately one-third of students with LDs are diagnosed with co-occurring of attention deficit hyperactivity disorder. 32 The difficulties experienced by a child with LD in the classroom could be a consequence of the interpersonal processes such as low self-esteem and feelings of inferiority.33, 34
Studies done in India on LD have focused on psychological variables like self-esteem, adjustment problems, social relationships,35, 36 social anxiety, self-concept, social competence, self-efficacy, emotional disturbances, 37 and also addressed the adjustment problems faced by students with LDs. 38 Though studies are found done separately on certain dimensions of the study variables among learning disabled and their normal peers, no scientific study is found done combining all these 3 study variables either in India or abroad as reported in the related literature. It was in this context that the present study was taken up, justifying the need and significance of the present study.
The present study aims at comparing the differences in SP, PWB, and CRB of students with and without LD. The study also has attempted to assess the relationship and influence of SP and PWB on CRB of the LD students from the schools of Kerala. Following are the major objectives of the study: (a) to determine if a significant difference exists between learning disabled and nonlearning-disabled students with respect to their SP, PWB, and CRB in the schools of Kerala. (b) To determine if a significant relationship exists among and between the variables under study with respect to the LD students in the schools of Kerala. (c) To determine the combined effect and to identify which of the 2 independent variables namely, SP and PWB is a better determinant/predictor of CRB among the LD students in the schools of Kerala.
Method
Participants
Sample
The population of the study comprised of the pupils of standards IX through XII with LD, from the high and higher secondary schools of state board in Kerala, India. Stratified representative sample of 225 pupils and 260 normal pupils of standards IX through XII with and without LD was obtained from different schools of the 3 districts namely, Thiruvananthapuram, and Calicut and Quilon of Kerala state. The breakup of the sample is given in Table 1.
Breakup of the Sample of Pupils With Learning Disability (LD) and Normal Pupils (NLD)
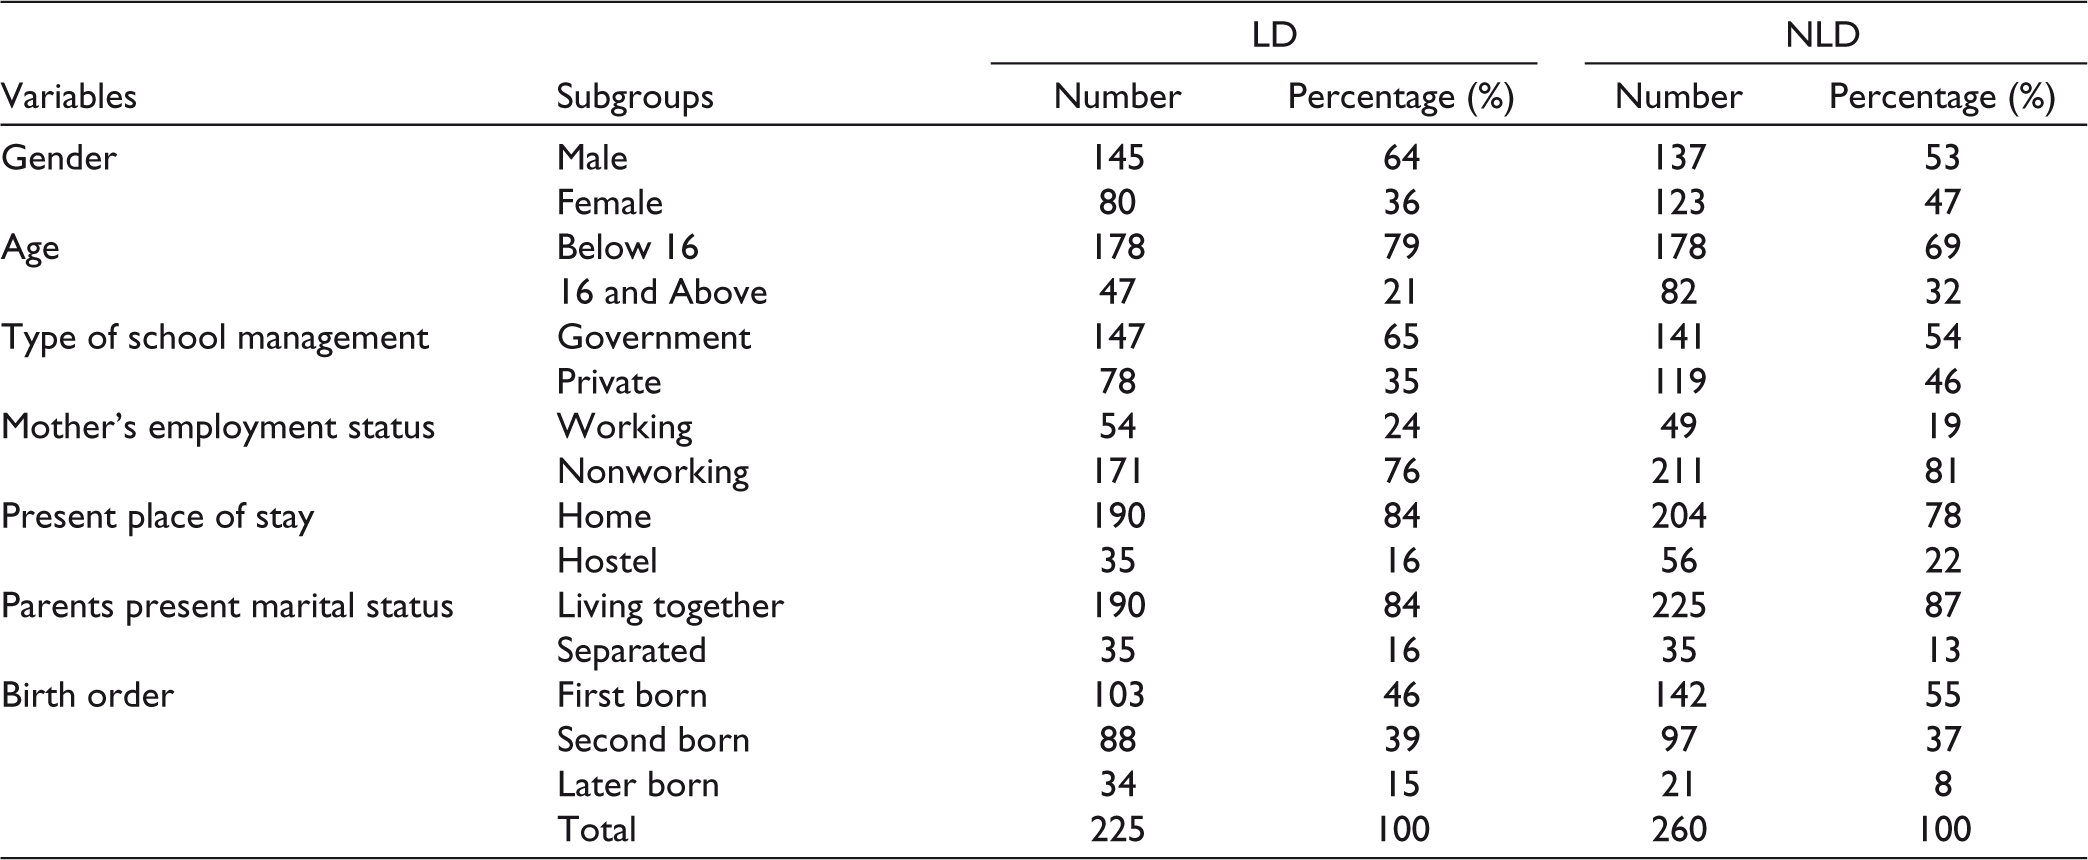
The inclusion criteria for the selection of students with LD were: male and female students aged between 13 and 20 years, who were clinically certified as learning disabled by clinical psychologists, from the mainstreamed schools of Kerala. Students with evident neurological or emotional disorder, below average intelligence, other sensory handicaps, and students less than 13 and more than 20 years of age were excluded from the study.
Instruments
A Scale of Self-Perception
A scale of SP was developed by Veni and Merlene (2016) to measure the SP of students. The scale consists of 70 items under 7 dimensions; moral and behavioural conduct, peer acceptance, social competence, physical appearance, scholastic competence, self-efficacy, and self-worth. The total score can range from 70 to 350.
The reliability coefficient for moral and behavioral conduct is 0.70; peer acceptance, 0.72; social competence, 0.71; physical appearance, 0.79; scholastic competence, 0.82; self-efficacy, 0.69; and self-worth, 0.76. The face validity, content validity, and item validity was established for the scale.
Mental Health Profile (for Measuring Psychological Well-Being)
For measuring the PWB in the present study, the mental health profile (the revised version of section 1 of healthy personality profile) developed by Sananda Raj and Rakhee (2003) was used. The scale consists of 60 items under 5 dimensions namely, attitude toward the self, integration, autonomy, perception of reality, and environmental mastery with 12 items in each dimension.
The reliability has been established in 2 ways namely, test-retest method and split half method by comparing “r: applying Spearman-Brown prophecy formula. The reliability coefficient for attitude toward the self is 0.84; integration, 0.88; autonomy, 0.89; perception of reality, 0.86; and environmental mastery, 0.83.
The concurrent validity of the tool was established by computing “r” between the score of the current tool and the score of the standardized tool used as external criteria. The coefficients of the dimensions are attitude toward the self, 0.89; integration, 0.86; autonomy, 0.88; perception of reality, 0.87; and environmental mastery, 0.83. Hence, the tool is found to be valid.
Classroom Behavior Inventory
The CRB inventory was developed by Veni and Merlene (2016) to measure the students’ CRB. CRB refers to how students see their behavior inside the classroom in terms of climate, challenges, interactions, and motivation. The scale consists of 48 items under the dimensions; classroom climate, classroom challenges, classroom interaction, and classroom motivation. The total score can range from 48 to 240.
The reliability coefficient for classroom climate is 0.71; classroom challenges, 0.83; classroom interaction, 0.89; and classroom motivation is 0.79. The face validity, content validity, and item validity was established for the scale.
Data Collection Procedure
Ethical approval for this study was obtained from Kerala University Ethical Committee as a standard procedure. Ethical consideration from psychology department was sought before finalizing the topic and planning the data collection for the study. Moreover, permission was sought from the director of Inclusive Education for the Disabled children (IED section). List of schools and data list were obtained from the IED section, Trivandrum, Kerala. Based on the identified list of schools and number of students, permission was taken from the individual schools and written informed prior consent was obtained from the parents of all subjects before the study. All the possible measures had been taken into consideration while collecting data.
Survey as a technique was used for collecting data from both learning disabled and normal students of the mainstreamed schools. The list of mainstreamed schools with LD students was obtained from the Department of Public Instruction. The principals of these schools were contacted and the details regarding the nature of investigation, time required for administration of the tools, and nature and form of cooperation expected from the authorities and participants were explained. The tools used for the study were administered following the conventional procedures, and the students were assured of the confidentiality of the data collected. Data collection was carried out by the investigator, with the help of special educators and student counsellors of the respective institutions. After completion of the data collection, the response sheets were scrutinized to ensure their appropriateness for inclusion in the study. The purpose of the study was clearly explained and confidentiality was kept with respect to the identity of the participant. The research was carried out objectively with no personal biases.
The data collected from 225 learning-disabled students and 260 normal pupils were tabulated and subjected to appropriate statistical analysis. The instructions for administration and scoring, as given in the test manuals, were strictly followed and care was taken to ensure that incomplete response sheets were not used for the final analysis. Before analyzing the data, the personal details of the sample under study along with their test scores for the variables were codified and analyzed using IBM SPSS Version 21.
Data Analysis
The statistical techniques used for data analysis were (a) computation of independent sample t test, (b) computation of statistical indices like mean, percentages, and standard deviation, (c) Pearson’s product moment coefficient of correlation (r) to find out if there is any significant relationship between the variables under study for the total sample, and (d) multiple regression analysis to find out the total influence of the independent variables, SP, and PWB on the dependent variable CRB and for studying the predictability and influence of the variables SP and PWB on the dependent variable CRB (SPSS-21).
Results
Table 1 describes the sociodemographic details of LD and NLD groups. Based on the percentage distribution, it can be observed that subjects were fairly distributed under both the study groups with respect to each of the selected demographic variables such as; gender, age, type of school management, mother’s employment status, parent’s present marital status, and birth order.
Comparison of the SP, CRB, and PWB scores of LD and NLD students was done to find out if a significant difference exists between the groups compared (LD/normal pupils) with respect to the study variables (Table 2). It is evident from Table 2 that a statistically significant difference exists between pupils with LD and normal pupils with regard to their overall SP, as well as in each of the 7 dimensions. Thus, SP was found to be lower among pupils with LD (M = 237.15) as compared to the normal pupils (M = 261.20). The present finding suggests that normal students have a higher level of SP than the LD students.
Results of t Test: Comparison of LD and Normal Pupils (NLD) With Respect to the Self-Perception (SP), Classroom Behavior (CRB), and Psychological Well-Being (PWB)
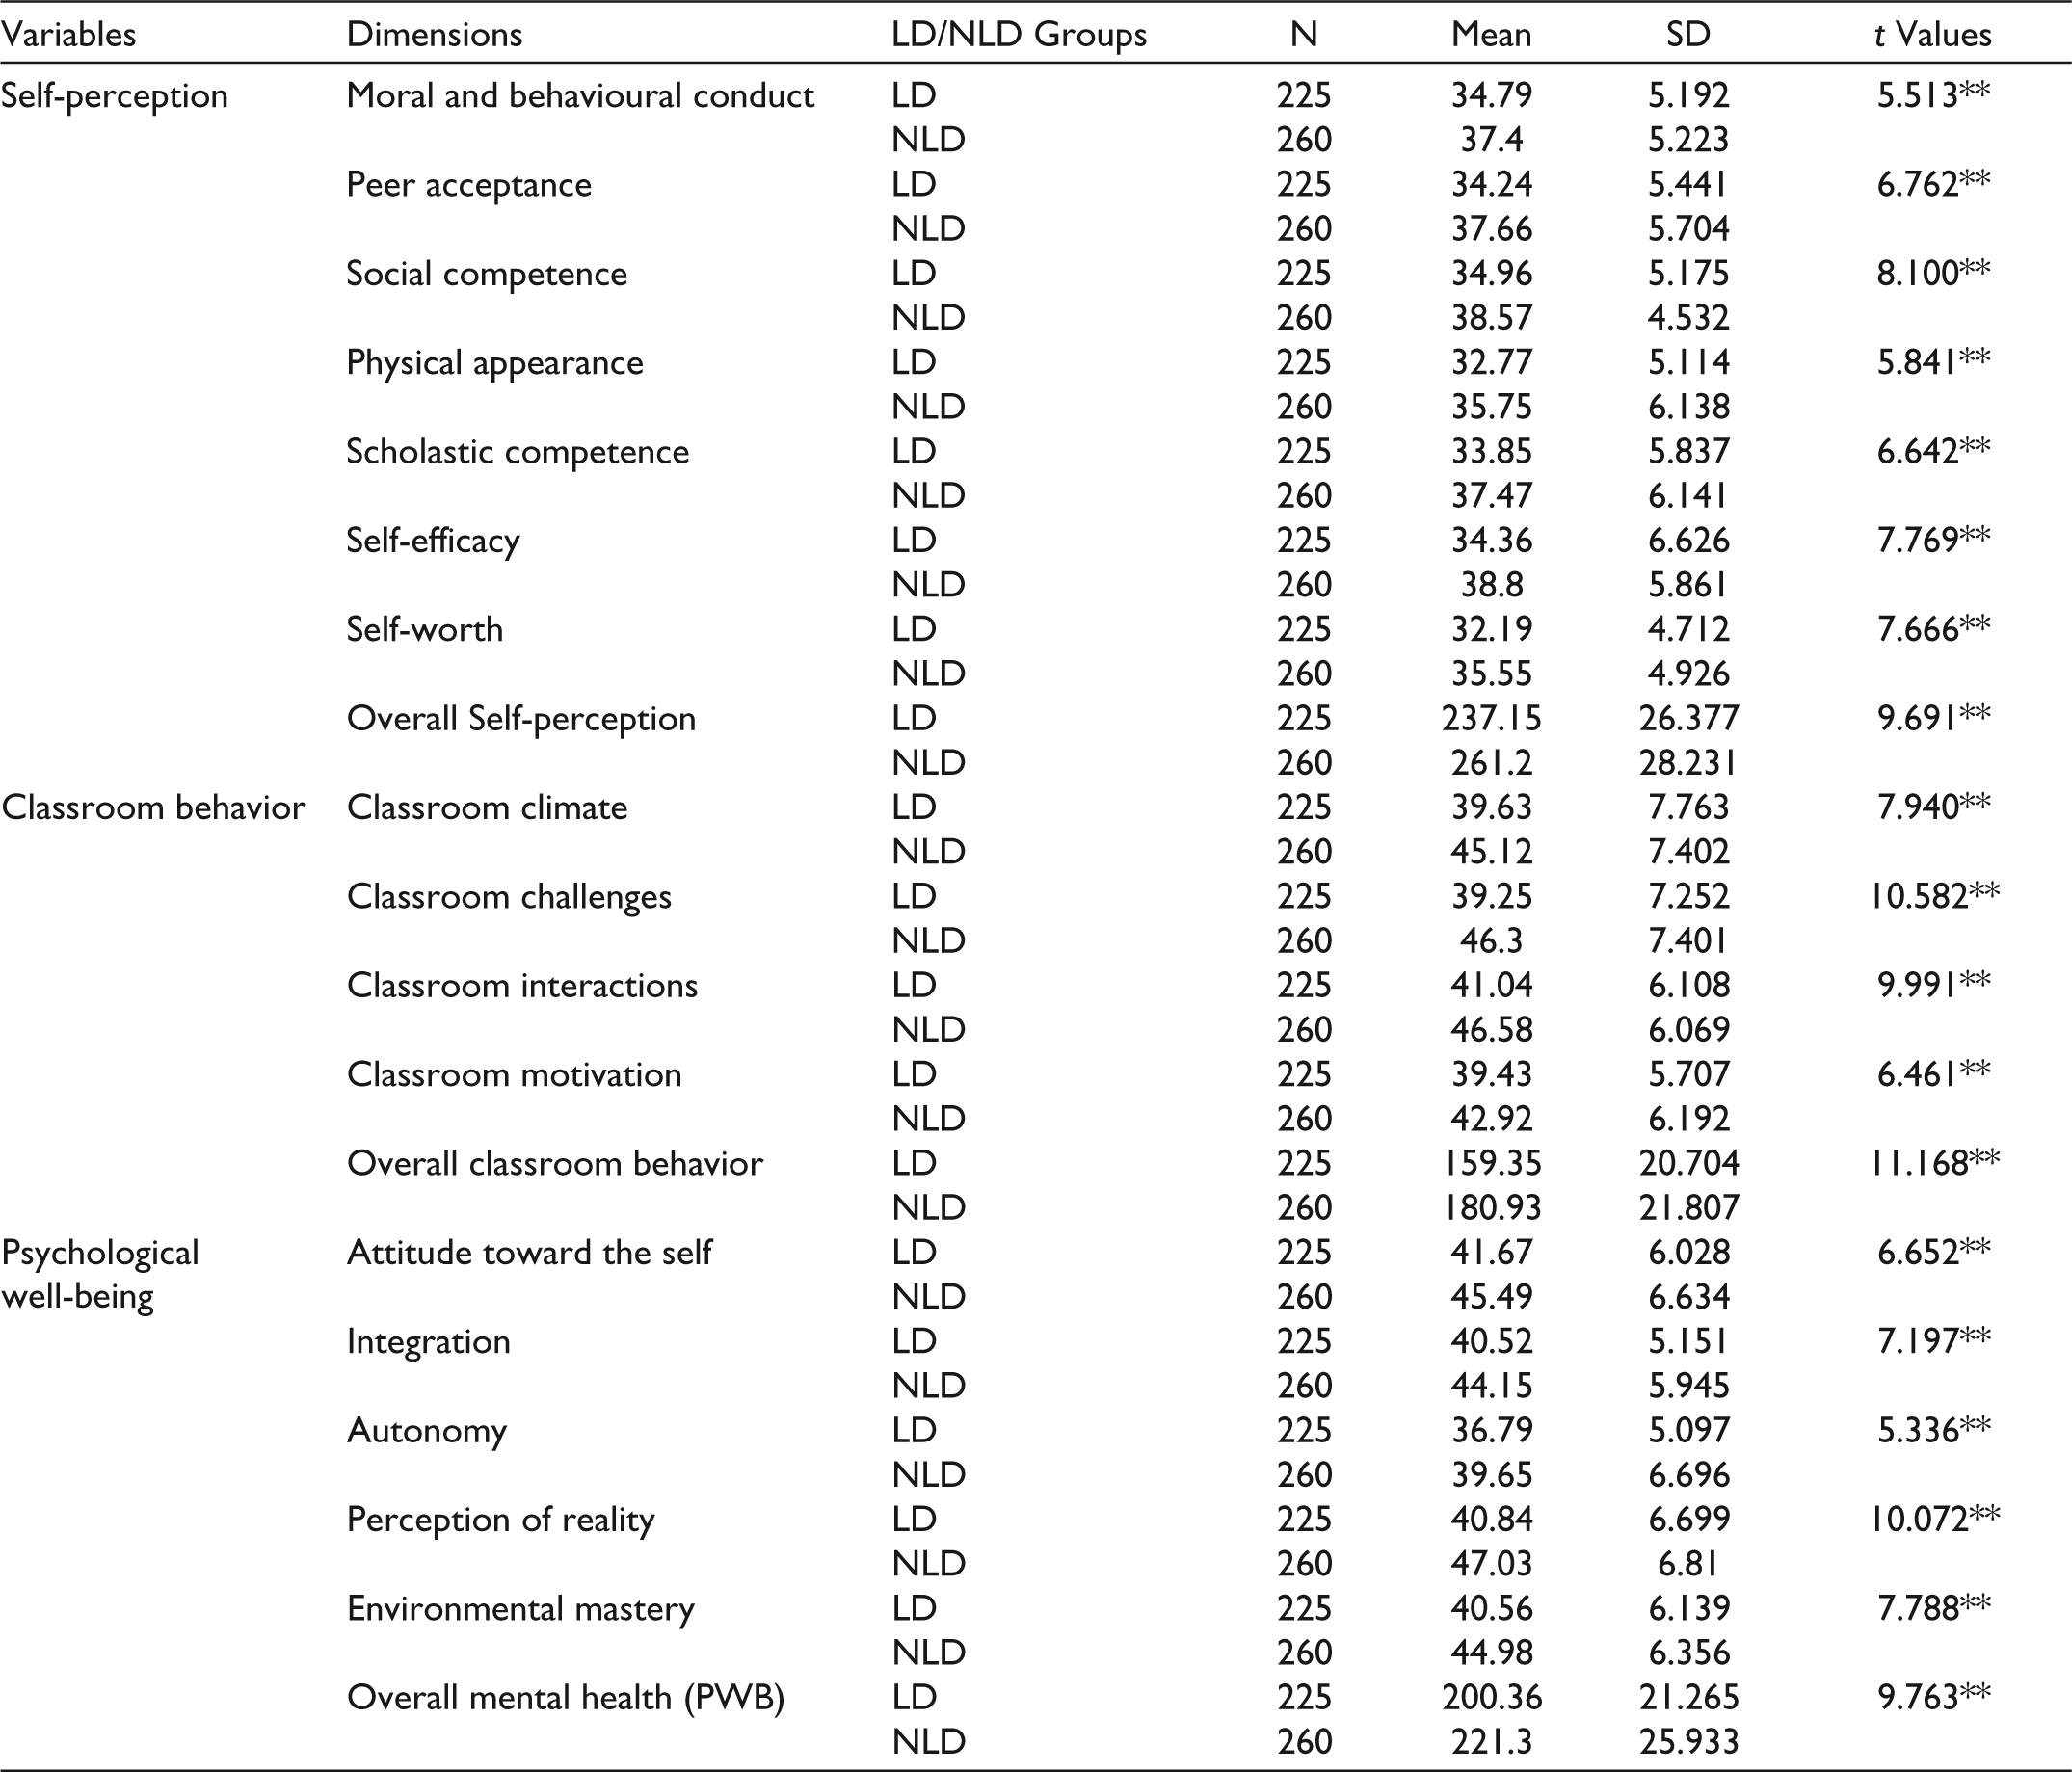
Comparison of LD and normal groups was carried out to find if a significant difference exists between the 2 groups with respect to their CRB in toto as well as dimension-wise. It is also observed that the NLD group is invariably better in CRB than the LD group.
It is clear from Table 2 that on comparing the study groups (LD and normal pupils), there exists a statistically significant difference with regard to the overall PWB and for the 5 dimensions of PWB. Further, it is observed that the group of normal pupils is better in PWB than the LD group invariably in each of the 5 dimensions as well as overall.
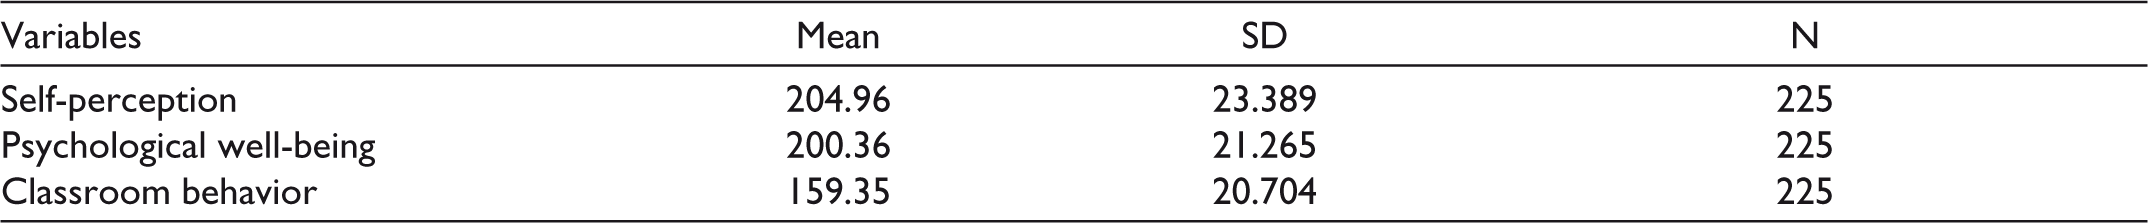
Table 3 shows the mean and SD scores of SP, PWB, and CRB of 225 LD students.
The Sample Size, Mean Scores, and Standard Deviance of Self-Perception, Psychological Well-Being, and Classroom Behavior of LD Students
Correlation analysis was carried out among 225 students with LD to find out the relationship among SP, PWB, and CRB (Table 4). Pearson product moment coefficient of correlation was used to find out if a significant relationship exists among variables under the study (Table 4).
Correlation Matrix of the Variables Self-Perception, Psychological Well-Being, and Classroom Behavior
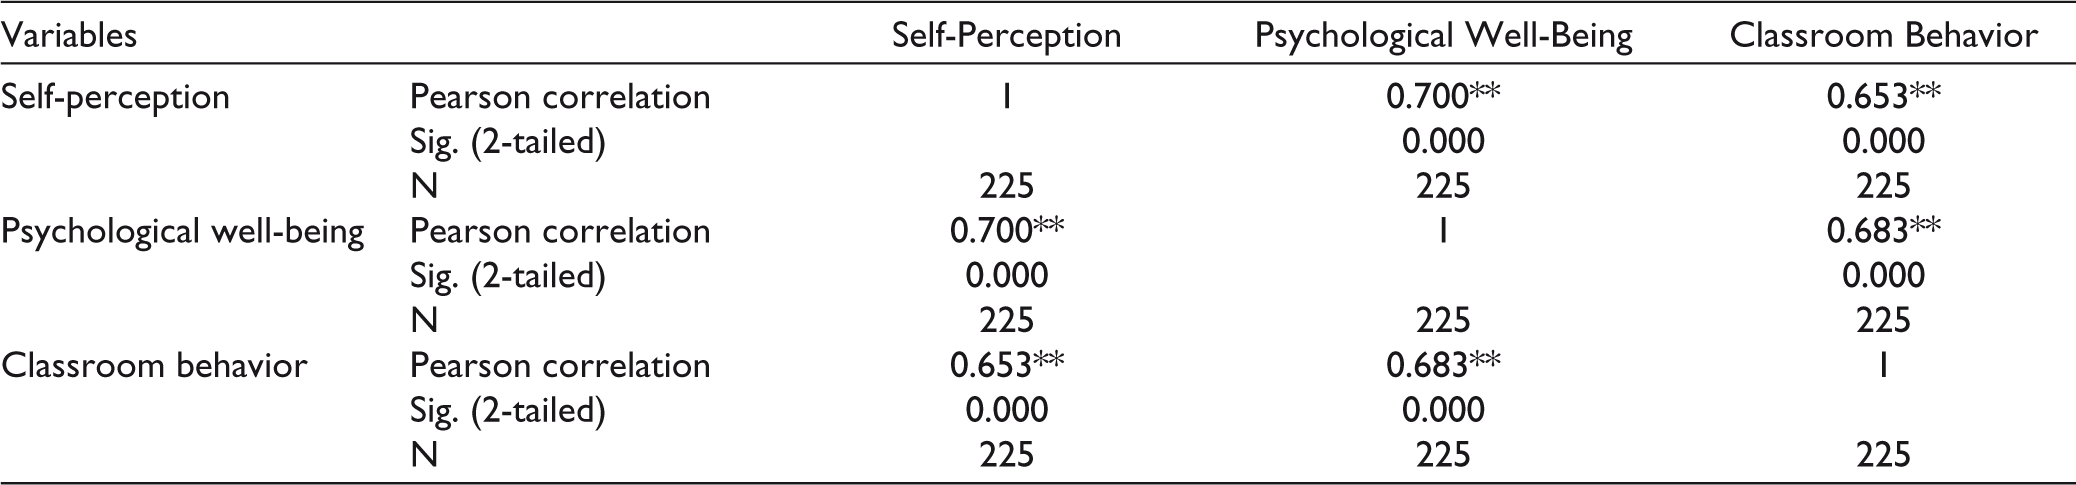
Results of correlation analysis revealed that a significant positive relationship exists between SP and PWB (r = 0.700); SP and CRB (r = 0.653); and PWB and CRB (r = 0.683).
Stepwise multiple regression analysis was used in the present study to find out the combined effect of SP and PWB on the CRB of pupils with LD (total sample) and predictor variable of CRB using the independent variables (SP and PWB).
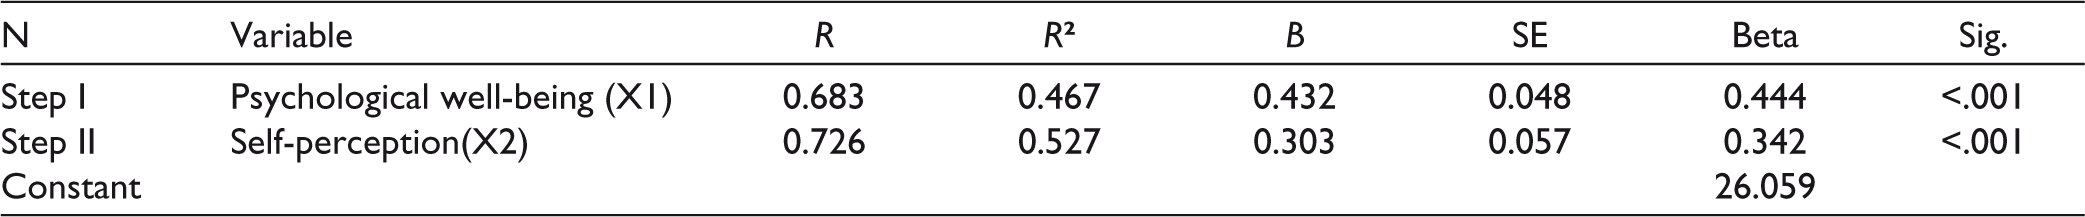
A stepwise multiple regression analysis was done with CRB as criterion-dependent variable and the variables namely, SP and PWB as predictor variables. The results of regression analysis (Table 5) indicate that the 2 variables identified as significant predictors of CRB jointly explained 52.7% of the variance in CRB. The score of multiple correlation coefficient (R) was 0.726 and R² was 0.527 (Table 5). This clearly indicates that the variables “self-perception” and “psychological well-being” have a combined effect on the CRB of learning-disabled students in the schools of Kerala.
Results of Regression Analysis: Classroom Behavior as Dependent Variable and Psychological Well-Being and Self-Perception as Independent Variables
Step I Regression Analysis
PWB was the first variable included in the regression model for CRB. This variable independently explained 46.7% of variance in CRB. The multiple correlation coefficient (R) was found to be 0.683 and R² was 0.467. The beta value of PWB (beta = 0.444) indicates a positive influence of PWB on CRB of pupils with LD.
Step II Regression Analysis
SP was the second variable entered into the regression model. It contributed an additional 6.0% of variance in CRB, which means that the multiple correlation coefficient value rose from 0.683 to 0.726 and therefore the R² score raised from 0.467 to 0.527. The second R² (0.527) indicates that PWB and SP together explained 52.7% of variance of CRB. The beta value of SP (beta = 0.342) indicates a positive influence of SP on CRB of LD students.
To compare the strength of contribution made by each of the variable, the beta value was used. The beta value obtained by the variable PWB being higher (beta = 0.444) among the obtained 2 beta values indicates that PWB is the better predictor to explain CRB of LD students than the variance explained by the second predictor variable, SP.
With the help of obtained constant value and B weights, the following regression equation for CRB was formulated. Y = 26.059 N + 0.432 X1 + 0.303 X2; Where, Y = CRB, X1 = PWB, X2 = SP.
Discussion
The finding of the present study with regard to SP of LD and NLD students indicated that LD students have a lower SP than their normal peers. This could be because compared to their classmates without disabilities, students with LD are less socially accepted,8, 9 have difficulty with developing close friendships,10, 11 and are more often victims of bullying 12 all of which may have contributed to their low SP.
The present finding lends support to the observations of previous researchers 7 who indicated that, within the classroom, SP of learning-disabled students is commonly found to be negative, and is also consistent with previous study 39 which noted that LD students display low SP in the academic areas than their nondisabled peers.
The finding that PWB of LD students was found to be lower than the normal peers, is in line with the finding of a previous study which stated that the prevalence of mental health problems in individuals with LD is higher in comparison to their nondisabled peers. 26
The finding with regard to CRB of LD students in comparison to their normal peers was found to be poor, goes along with the popular notion, and also as indicated by the finding of Hintze and Matthews 40 who noted that LD students experience elevated rates of inattentiveness and off-task CRB compared to nonlabelled peers. The finding is also in line with previous findings of researchers 41 who observed significant behavioral problems and deficits in LD children compared to their nondisabled peers.
The finding that SP has a significant positive influence on the PWB of LD students and vice versa lends support to the observations of Schulman, 42 who noted that SP of pupil with LD increases the likelihood of them gaining more favorable perspective of their overall well-being. The present finding can also be linked to the findings of various researchers43–47 who concluded that self-esteem, which is considered equivalent to self-worth, a factor of SP, is an important psychological factor contributing to health and quality of life and also subjective well-being significantly correlates with high self-esteem.
The next finding, SP and CRB, of learning-disabled students is positively correlated, can be linked to the observations of Philips et al 48 who noted that students with a positive view of themselves, along with other factors, have greater motivation to participate more in class.
Significant positive correlation was seen between PWB and CRB of LD students. The finding can be partially linked to a study 49 which indicated a negative relationship among maladaptive behavior in classroom and satisfaction of autonomy and relatedness among secondary students, as both autonomy and relatedness are dimensions of PWB.
Results of stepwise regression analysis revealed that SP and PWB have a combined effect on CRB of the LD students and PWB was found to be the better predictor of CRB of LD students in the schools of Kerala. The finding suggests that PWB has a major influence on the CRB of LD students. This could be because PWB affects how people think, feel, and act as they cope with life 50 and the same may be applicable to the students with LD. PWB is important as it helps them determine how to handle stress, 51 especially within a classroom setting where they are being judged and monitored throughout by the teachers and their peers.
The investigator adopted all the possible steps to make the study a valid and reliable one so as to generalize the results to a great extent. However, a few limitations might have crept into the study, which were inevitable. The sample for the present study was confined to 225 learning-disabled and 260 nonlearning-disabled students from the schools of 3 districts in Kerala namely, Thiruvananthapuram, Kollam, and Calicut. Other districts were not included due to practical difficulties. However, since Thiruvananthapuram district, being the capital city, consists of people from almost all the state, the sample provides a due representation of the population under study. The study was delimited to the variables SP, PWB, and CRB.
The large sample size, standardized tools, and statistical measures have strengthened the present study by making the findings more generalizable to the larger population. Addition of the NLD participants (control group) along with the LD group can be considered as a major strength of the study as it helps portray the exact status of the LD students with respect to the study variables. The study has also paved a way for understanding the shortcomings of the current inclusive education policies of the state. Another strength of the study is its novelty, as there is a shortage of research studies relating the study variables and learning-disabled group in Indian context.
The present study may open up new avenues for conducting further studies in the field of LDs. As the present study was confined to a representative sample of LD students at the high school and higher secondary level from the various schools of Kerala, it is recommended that similar studies be taken up with other groups including primary school students as sample of the study. Apart from the self-rating of students, another study gauging the teacher and peer ratings of students with LD with regard to the present study variables can be a fruitful area of research. A qualitative method such as focus group interview may yield worthwhile results along with the quantitative data.
To conclude, the result indicates that the normal learners, as expected, are found to be superior to the pupils with LD in the possession of all the desirable behavioral aspects covered in the 3 study variables, which implies the need for enhancing the SP and PWB of LD students so as to improve their CRB with the help of psychologists, special educators, teachers, and other school authorities. Strategies should be adopted by parents, teachers, and the policymakers to enhance the PWB of LD students, since it is found to be the major predictor of their CRB.
Footnotes
Declaration of Conflicting Interests
The authors declared no potential conflicts of interest with respect to the research, authorship, and/or publication of this article.
Funding
The authors received no financial support for the research, authorship, and/or publication of this article.
Statement of Informed Consent and Ethical Approval
Necessary ethical clearances and informed consent was received and obtained respectively before initiating the study from all participants.