
Abstract
Background
Age-related macular degeneration (AMD) is one of the major leading irreversible reasons for severe blindness in the aged population. Oxidative stress is said to be a leading cause of AMD and is very progressive in the major areas of the retina. The antioxidant nature of the macular pigments (MPs) and their position in the retina is believed to be responsible for minimizing the effect of AMD.
Objectives
The aim of this study is to assess the efficacy of Gleamax/VividawnTM containing lutein and zeaxanthin for its protective role against ultraviolet (UV)-induced stress in retinal cells in vitro and evaluating the benefits of eye health by evaluating the cell proliferation, cytoprotection as well as the measurement of lipofuscin (LPF) levels.
Materials and Methods
Human ARPE-19 cell lines were cultured and tested for cytotoxicity with Gleamax/VividawnTM samples. The cytoprotective activity of the Gleamax/VividawnTM was measured by the absorbance value over 72 h in comparison to the absorbance of irradiated and non-irradiated cell control. LPF was estimated using the enzyme-linked immunosorbent assay (ELISA) method, and N-retinylidene-N-retinylethanolamine (A2E) levels were estimated by the Bradford method. In vivo studies in C57BL/6 mice, 14 animals were nurtured with a rich fat diet for 2 weeks to boost obesity, and other animals of the standard control group (G1) received a normal chow diet for 2 weeks. The first group served as a normal control, the second group functioned as a high-fat diet (HFD) control, and the third group was a treatment group that received Gleamax/VividawnTM at 6.2 mg/kg physique weight of the animals per orally daily for consecutive 60 days.
Statistical Analysis Used
The experimental data were analyzed by one-way analysis of variance (ANOVA) with Dunnett’s test between the treatment and control groups.
Results
Lutein, with a combination of zeaxanthin supplementation, improves the dysfunction in the central retina, obtaining benefits in terms of visual activity (VA) and glare sensitivity. In this study, standard control (G1) and HFD-fed animals (G2) were observed with below limit of quantification (BLOQ) levels of lutein and zeaxanthin in plasma. However, Gleamax/VividawnTM treated group (G3) animals were found to have significantly elevated levels of lutein and zeaxanthin levels.
Conclusion
Introduction
In aged patients over 75 years, there is an early age-related macular degeneration (AMD) risk of 25% and a late AMD risk at 8% (Thomas et al., 2021). The etiology of AMD is still unclear owing to its multi-factorial character (Nowak, 2006). Studies show that the macular pigmentary change, presence of soft drusen, and choroidal neovascularization in the other eye are some of the major ocular reasons for AMD (Pieramici & Bressler, 1998). While hypertension, smoking, and a positive family history might also contribute (Evans, 2001). Metabolic, genetic, functional, and environmental factors are likely to lead to gradual changes in the ocular structures of the macular region such as the deposition of polymorphous, acellular debris between the Bruch’s membrane and retinal pigment epithelium (RPE) that contributes to various degrees of AMD (Nowak, 2006). With advancing age, the retina lacks the proper nourishment and gradually the waste materials start to accumulate in the form of amorphous deposits named drusen. The epithelium cells of retinal pigment lose their efficiency in performing their tasks, and membrane pigment cells start to degenerate slowly, leading to atrophy and loss in central vision (Fine et al., 2000).
When light is transmitted to distinct ocular tissues of the eyes, it gets absorbed by the chromophore and generates photochemical reactions. These chromophores are vulnerable to oxidative damage caused by reactive oxygen species. Whenever they are exposed to intense light, photo-oxidation reactions are caused, which might lead to AMD and other ocular diseases (Madhavan et al., 2018). Macula, the retina center, has a yellow pigmented spot known as macular pigment (MP), which plays a crucial role in protecting the macula from harmful blue lights and thus helps in maintaining the function of the macula. MP is constituted of two different carotenoids named lutein and zeaxanthin, which are obtained through diet (Jager et al., 2008). The lutein and zeaxanthin presence in the macula serves three functions: visual acuity, stability, and protection due to their antioxidant and light filtration characteristics. They also have the ability to increase contrast sensitivity and minimize chromatic aberration, thereby enhancing visual performance.
Oxidative stress has been identified as one of the major causes of AMD and is very progressive in the retina’s central region. The antioxidant nature of the MPs and their position in the retina are believed to be responsible for minimizing the effect of AMD (Jia et al., 2017). The MP is located in the inner plexiform layers (IPLs) and ganglion cells of the retina (Snodderly et al., 1984), is concentrated more near the fovea, and reduces rapidly with eccentricity (Berendschot & van Norren, 2005). Because of their position, the MP is believed to protect the retina from the harmful effects of intense blue light (Algvere et al., 2006). Being antioxidant in nature, they also protect the retina from oxidative stress by scavenging the free radicals (Khachik et al., 1997). They also have the efficiency to protect the eyes against AMD (Bone et al., 1985). The human body does not synthesize lutein and zeaxanthin; hence, they need to be obtained from dietary supplements (Khachik et al., 1997). Thus, the amount of MP depends on the amount of lutein and zeaxanthin-rich food intake, which can also be influenced by the nutritional supplement intake comprising lutein and zeaxanthin (Hammond et al., 1997). Lutein and zeaxanthin compounds belong to the family of xanthophyll known as carotenoids, which can only be synthesized by plants. The maximum concentration of lutein and zeaxanthin is found in the central fovea region of the eye, where they are found in 100-fold higher concentration than anywhere else in the eye. This region has the highest exposure to the light. This location is deemed to be ideal for protecting the retina from any photo-oxidative damage. The concentration of lutein and zeaxanthin decreases as it is moved away from the fovea region. Lutein and zeaxanthin are present in the retina with various levels at specified layers, playing different physiological functions. These carotenoids are considered to absorb around 40–90% of the blue light, which guards the retina from the damage that occurs through light.
Previous studies have reported that patients with high concentrations of MPs are less likely to have AMD when compared with those patients with lower levels of MPs (Roberts et al., 2009). Macular pigment optical density (MPOD) is a non-invasive method to quantify lutein/zeaxanthin in the macular. They serve as biomarkers for both visual function and protection against the risk of certain eye diseases. Studies also suggest that increased intake of lutein and zeaxanthin supplementation was found to increase contrast acuity with better visual performance even under ambient illumination (Johnson, 2014). As AMD is reported to affect visual acuity, the role of lutein and zeaxanthin in treating AMD is gaining much importance (Roberts et al., 2009). It is recorded that 12 months of ingestion of lutein and zeaxanthin supplementation has improved the MP density and contrast sensitivity. Study data showed that lutein provided protection against the harmful effect of long-term exposure to computer display lights, and when taken in combination with zeaxanthin, it has been found to diminish visual fatigue (Johnson, 2014). All these data support the fact that lutein and zeaxanthin play an important role in protecting eye strength majorly for retina (Roberts et al., 2009).
Tagetes erecta, commonly known as marigold, is a rich source of lutein and zeaxanthin. Gleamax/VividawnTM used in the present study was oil-soluble lutein zeaxanthin 10:2 sourced from a marigold scientifically known as T. erecta, which is the most abundant natural source of lutein and zeaxanthin. The flowers of the plant are used in the extraction of lutein and zeaxanthin by a unique extraction technique using hexane as a solvent. It is uniformly dispersed in sunflower flower oil to create a homogenized mixture. The product is in brick red flowing viscous paste with a characteristic odor, with lutein not less than 10% and zeaxanthin not less than 2%. The narrow particle size distribution of the product is thus highly responsible for its efficacy. These MPs possess an eye-protective role from oxidative progressions. Additionally, when eyes are exposed to light, it acts as a filter to improve vision, thereby enhancing both the object’s contrast and its background. Lutein and zeaxanthin are known to obstruct lipid peroxidation (LPO), whereas LPO is known to damage biological membranes, which includes ocular tissue damage and macular degeneration.
Lipofuscin (LPF) is a pigmented, heterogeneous fluorescent waste material that reserves with age in the active post-mitotic cells such as RPE, cardiac myocytes, and the select neurons (Brunk & Terman, 2002; Różanowski & Różanowski, 2008; Sparrow & Boulton, 2005). RPE LPF granules are considered to be membrane-bound residual bodies of the cell lysosomal compartment (Sparrow & Boulton, 2005). In general, LPF contains 30–70% protein, based on tissue and species (Warburton et al., 2005), and this protein may lead to pathogenesis. The outer retina of humans is relatively exposed to intense light and high oxygen tension. These two factors increase the LPO levels in the biological membranes, including photoreceptors and rod outer segments. The LPF level in RPE escalates with age, and its topographical distribution corresponds to the distribution of rods in the retina (Weiter et al., 1986; Wing et al., 1978). Consequently, in the macular region of the human eye, the proportion of LPF within an RPE enhanced from ~1% during the first decade of life to over 19% by the ninth decade (Feeney-Burns & Eldred, 1983). Similarly, an approximate 20-fold augmentation in LPF levels was noted throughout the lifespan of mice as assessed by fluorescence spectroscopy (Mukherjee et al., 2009). This characteristic increase is uncertain to some extent; few studies exhibited a relatively rapid increase during the initial two decades of human life, followed by a more moderate rate of growth in subsequent decades (Feeney-Burns & Eldred, 1983; Feeney-Burns et al., 1984; Weiter et al., 1986). Recent studies reported that employing mathematical and biophysical models of LPF accumulation suggests the rise is generally linear during the human lifespan (Family et al., 2010; Mazzitello et al., 2009). However, there is inadequate information regarding LPF-like material accumulation or the time course of LPF in RPE cell culture and whether this pace is comparable to that of accumulation in vivo.
Based on the above aspects, the present study aims to assess the efficacy of Gleamax/VividawnTM and their protective role against ultraviolet (UV)-induced stress in retinal cells in vitro, and evaluate the benefits of eye health by evaluating the cell proliferation, cytoprotection, as well as the measurement of LPF levels.
Materials and Methods
Chemicals and Kits
DMEM-F12 media, fetal bovine serum (FBS), streptomycin, penicillin, amphotericin B, Dulbecco’s phosphate buffered saline (DPBS), trypsin-ethylenediaminetetraacetic acid (EDTA), 3-(4,5-dimethylthiazol-2-yl)-2-5-diphenyl tetrazolium bromide (MTT), and dimethyl sulfoxide (DMSO). Media, anti-biotics, MTT, picric acid, and buffers were purchased from Hi-media, India. FBS was procured from Gibco, Brazil. Tween-20 was purchased from SD Fine Chem, India. Isoflurane was obtained from Raman & Well Pvt. Ltd., India. Ethanol was obtained from CS reagents in India. Superoxidase dismutase (SOD), catalase (CAT), glutathione peroxidase (GPx), and total antioxidant activity (TAC) enzyme-linked immunosorbent assay (ELISA) kits were procured from BT Lab, China. LPF (Human and Mouse) ELISA kits were procured from My BioSource, USA.
Equipment
All the instruments, including Microplate Reader (Biotech, USA), UV–vis spectrophotometer (Systronics, India), Weighing Balance (Citizen, Singapore), and additional laboratory equipment used for the experiments were regularly calibrated and validated.
In vitro Studies
Cell Culture
The Human Retinal Pigmented Epithelium (ARPE-19) cell line was obtained from the American Type Cell Culture Collection (ATCC), USA. The stock cells were cultured in DMEM-F12 medium and supplemented with 10% inactivated FBS, streptomycin (100 µg/mL), penicillin (100 IU/mL), and amphotericin B (5 µg/mL), maintained in a 5% CO2 humidified atmosphere at 37°C till confluent. The stock cultures were grown in 25 cm2 culture flasks, and a cytotoxicity study was performed in a 96-well micro-titer plate.
Sample Preparation for In Vitro Studies
10 mg of the Gleamax/VividawnTM was weighed separately, then dissolved in DMEM-F12 medium and 2% inactivated FBS. Additionally, a series of two-fold dilutions were made using the stock solution to prepare lower concentrations for additional tests and cytotoxicity testing.
MTT Assay
The cell culture monolayer was trypsinized, and the cells were adjusted to 100,000 cells/mL using DMEM-F12 medium comprising 10% FBS. To each well of 96 well micro-titer plate, 100 µL of the cell suspension dilution was seeded. After 24 h, the partial monolayer was formed, and then the supernatant was removed. The cell monolayer was once washed with DPBS, and 100 µL of varying test concentrations of Gleamax/VividawnTM with DMEM-1% glucose was treated on the partial monolayer in micro-titer plates. The plates were incubated for 24 h at 37°C with 5% CO2 atmosphere. After 24 h, the microscopic observations were noted. Then, the treatment solutions were discarded, and 50 µL of MTT with phosphate-buffered saline (PBS) was added to each well. The plates were shaken gently and further incubated at 37°C in a 5% CO2 atmosphere for 3 h. DMSO (100 µL) was added after removing the supernatant, and the plates were shaken gently to solubilize the formed formazan. A microplate reader was used to measure the absorbance at a wavelength of 570 nm (Denizot & Lang, 1986).
Cell-proliferation Assay
A 6-well plate was seeded with 5 × 10⁴ cells per well for the cell proliferation experiment. The Gleamax/VividawnTM was introduced to the wells so that the final concentration of the samples to be 500 or 250 µg/mL after a 24 h incubation period at 37°C. Wells were planted in triplicate for every sample and concentration. Following a 72-h incubation period, the supernatants were extracted from the wells, and 1 mL of MTT was added. The plate was incubated at 37°C for 3 h. After 3 h of incubation, DMSO 1 mL was added to the wells. Each well’s supernatants were extracted entirely and placed in different tubes before being centrifuged for 5 min at 4°C and 1,500 rpm. Each sample’s 100 µL supernatant was transferred, in duplicate, to 96-well plates together with a cell control. The microplate reader was used to measure the reading at 570 nm. Using the standard formula, the percentage of cell viability in Gleamax/VividawnTM treated groups was determined with respect to the cell control at 24 and 72 h (Jeong et al., 2011).
Cytoprotective Assay
After 24 h of cell seeding with 5 × 10⁴ cells at 37°C, the Gleamax/VividawnTM was treated to the wells such that the final test concentration of the sample was 500 or 250 µg/mL. Wells were planted in triplicate for every sample and concentration. Following an hour-long pre-incubation period with varying non-toxic sample concentrations, the culture medium was subjected to 50 min of UV exposure at 1.7 mW/cm2 (5 J/cm2) by using a UV simulator. The amount of irradiation given under exposure conditions was sufficient to cause oxidative damage to the cells. Following exposure, the plates were then incubated at 37°C in an environment containing 5% CO2 for a maximum of 72 h. The MTT test was employed to determine the cell’s viability after incubation. The cytoprotective activity of the Gleamax/VividawnTM was measured by the absorbance value over 72 h in comparison to the absorbance of irradiated and non-irradiated cell control (El-Mahdy et al., 2008; Jeong et al., 2011).
Estimation of LPF by ELISA Method
Step I: Stimulation of LPF Formation by UV Irradiation
Six well culture dishes were seeded with 1.5 to 2 × 10⁵ cells/mL of ARPE-19 cells in DMEM-F12 medium supplemented with 10% fetal serum. Following a 24-h incubation period, the cells were subjected to two doses (500 and 250 µg/mL) of Gleamax/VividawnTM, exposed to the UV at 1.7 mW/cm2 (5 J/cm2) using a UV simulator for 50 min and cultured in a medium at 37°C with 5% CO2 atmosphere for 24 h. After incubation, the cell samples were rinsed with PBS, and centrifuged at 1,000 g for 10 min, and the cells were kept for sediment and stored at −20°C until needed. The supernatant was then discarded.
Step II: Preparation of Non-irradiated Retinal Cells
Six well culture dishes were seeded with 1.5 to 2 × 10⁵ cells/mL of ARPE-19 cells in DMEM-F12 medium supplemented with 10% fetal serum. The cells were cultured in the medium at 37°C with an atmosphere of 5% CO2 for 24 h and then exposed to darkness for 50 min. Following incubation, the cell samples were rinsed with PBS, centrifuged at 1,000 g for 10 min, and the cells were kept for sediment and stored at −20°C until needed. The supernatant was then discarded.
Step III: Cell Lysate Preparation
For the lysate preparation, the cells were homogenized in PBS by sonication for 10 min. Cell homogenates were then subjected to a freeze–thaw cycle followed by centrifugation at 1,500 g at 4°C for 10 min to remove cellular debris. The clear supernatant was collected for the ELISA assay.
Step IV: Estimation of LPF in Cell Supernatant by ELISA
The levels of LPF in the supernatant were determined by ELISA kit (My BioSource, Lott No: MBS7230952) by competitive enzyme immunoassay using a polyclonal anti-LPF anti-body and an LPF-horseradish peroxidase (HRP) conjugate. The tests were performed according to the instructions provided by the manufacturer.
Estimation of N-retinylidene-N-retinylethanolamine (A2E) Level by Bradford Method
Human ARPE-19 cells were added into 6-well plates at a cell population of 1.5 to 2 × 10⁵ cells/mL in DMEM-F12 medium with 10% FBS. After 24 h, the cells were treated with two concentrations (500 and 250 µg/mL) of Gleamax/VividawnTM and exposed to the UV at 1.7 mW/cm2 (5 J/cm2) by using the UV simulator for 50 min along with non-treated cell control and incubated for 24 h in medium at 37°C with 5% CO2 atmosphere. After incubation, cell samples were washed with PBS and centrifuged at 1,000 g for 10 min. The supernatant was then removed, and the cells were kept for sedimentation. Finally, the cells were lysed with PBS. The collected cell supernatant was assayed by using the Bradford method.
Confocal Imaging
Using confocal microscopy, the LPF accumulation in retinal epithelial cells was observed, imaged, and quantified. Following the seeding of cells in a 6-well plate, the previously stated techniques for sample addition and UV irradiation were followed. After that, a 24-h incubation period was observed for the irradiated treated cells, cell control, and non-irradiated cell control. After the treatment was complete, the medium was taken out of each well, and a DPBS wash was performed. Following the removal of the DPBS, the cells were suspended in 250 µL of Image-IT fixative solution. Then the cells were incubated in the dark for 30 min at room temperature. After the incubation period, the fixative was removed, and the cells were washed twice with DPBS to get rid of any leftover fixative. The cells were then counter-stained before imaging for 10 min under the absence of light using 1,000 µL of 4′,6-diamidino-2-phenylindole (DAPI) solution (1 µg/mL). Then, using a filter cube with a 480/40 nm laser to detect the nucleus at a 63× magnification for “excitation and emission at 535/50 nm for green fluorescence (LPF)” and “an excitation of 341 nm and an emission of 452 nm for DAPI stain for the blue channel,” the cells were then examined under a ZEISS LSM 880 Fluorescence Live Cell Imaging System (Confocal Microscopy). The image was analyzed and recorded by ZEN Blue Software. The expression of LPF intensity was measured using Image J software (Lei et al., 2013).
In vivo Studies
Selection and Maintenance of Animals
C57BL/6 mice, weighing around 20–25 g, come under the age group of 7–8 weeks, were considered for the study. Mice were health examined, marked, and allowed for acclimatization for 7 days at laboratory conditions. Only healthy animals without any signs of illness were used in the study. Animals marked by picric acid and individual numbering was labeled to each animal. Cages were numbered separately to classify each group. All animals were randomized based on their body weight. Randomization was done by using Microsoft Excel Work Sheet.
Husbandry
Animals were maintained in an air‑conditioned animal room under standard laboratory conditions with adequate air changes per hour. The experimental room was maintained at a temperature of 22 ± 3°C and a relative humidity between 30 and 70% with the photoperiod (12 h light and 12 h dark cycles). The experimental room was cleaned daily with disinfectant. Mice were housed in sterile cages using corncob as the bedding material, and animals were fed with rodent feed and GenPure RO water ad libitum. Water was periodically monitored for microbial contamination. Drinking water bottles and their tubes were also examined routinely to ensure their proper operation. Normal chow diet (18% protein diet) and high-fat diet (60% fat HFD) from the National Institute of Nutrition (NIN), India were provided to animals throughout the experiment. All the animal experiments were performed as per the guidelines instruction of the Committee for the Purpose of Control and Supervision of Experiments on Animals (CPCSEA), Ministry of Fisheries, Animal Husbandry and Dairying (MoFAH&D), India (project approval no: RR/IAEC/122-2023).
Test Formulation
Test formulations were prepared daily with the test substance, Gleamax/VividawnTM. The required quantity of Gleamax/VividawnTM was taken in a mortar and pestle, and it was triturated. An adequate quantity of vehicles was uniformly mixed with triturate. The mixture was then transferred to a volumetric flask, and the volume was made up with vehicle and mixed well using a magnetic stirrer. A homogenous test formulation was administered to individual animals with respect to their body weights.
Grouping and Treatment
C57BL/6 mice were housed and acclimatized for 1 week. Fourteen animals fed with rich Fat diet for 2 weeks to boost obesity and other animals of the normal control group (G1) received a normal chow diet for 2 weeks. After 2 weeks, based on body weight, obese animals were randomized into two groups with seven animals each. The first group as normal control, the second group served as HFD control, and the third group functioned as a treatment group. Group I was treated with vehicle orally, the second group was treated with HFD orally, and Group III was treated with Gleamax/VividawnTM at 6.2 mg/kg body weight of the animals orally daily for consecutive 60 days.
Collection of Serum and Organs
Animals were observed during the treatment period for any clinical signs, and daily cage side observation, feed consumption, and weekly body weights were noted. During the first day of treatment, before dosing (Day 1), body weights were recorded, weekly thereafter (±2 days), and on the last day of treatment. Food consumption was calculated on a weekly basis (on the days that body weights are recorded) from the day of the start of treatment until sacrifice. After the end of the treatment period, a blood sample was collected, serum was separated for biochemical analysis, and plasma was separated for estimation of lutein and zeaxanthin by high-performance liquid chromatography (HPLC). Isoflurane was used to cull all the animals which were subjected to gross pathological assessments. Vital organs and tissues, namely, liver, kidney, heart, subcutaneous fat, epididymal fat visceral fat, and eyes were further processed for histopathological evaluation.
Biochemical Analysis
The serum samples for liver function parameters, lipid profile, TAC, CAT, SOD, GPx, and LPF levels were analyzed using standard kits.
HPLC Analysis
The serum was analyzed by HPLC technique using a C18 4.6 × 150 mm, 5-µm column. The column flow rate was 0.5 mL/min in an isocratic system maintained at ambient temperature. The wavelength of the column was maintained at 254 nm to detect the peaks, and the chromatography ran using an injection volume of 20 µL for 10 min. The analysis was performed under standard instrument conditions.
Statistical Analysis
All data, including body weight, organ weights, and clinical chemistry, were statistically analyzed using GraphPad Prism Software (version 5.01). All values were expressed as Mean ± standard deviation (SD). The significant difference between the control group and treatment was estimated by one-way analysis of variance (ANOVA) followed by Dunnett’s test.
Results and Discussion
Cytotoxicity Assay
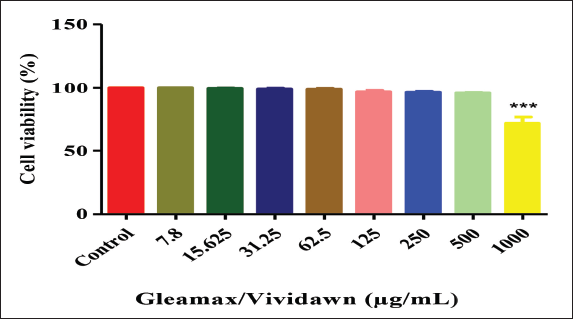
Gleamax/VividawnTMin vitro cytotoxicity was tested on the Human ARPE-19 cell line by MTT assay. The Gleamax/VividawnTM cytotoxicity was determined in terms of percentage cell viability, and it was found to be 42.07 ± 0.10% at higher concentration (1,000 µg/mL) on human ARPE-19 cell line. The CTC50 value of the Gleamax/VividawnTM was above 500 µg/mL (Figure 1), and two non-toxic concentrations (500 and 250 µg/mL) of Gleamax/VividawnTM were used for further experiments.
Cell-proliferation Assay
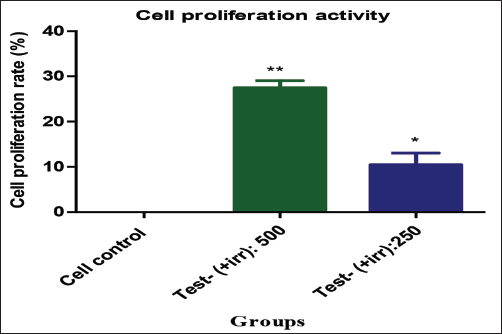
Gleamax/VividawnTM was tested for cell proliferation activity on the human ARPE-19 cell line to evaluate its ability to enhance both the quantity and function of cells. A predetermined quantity of cells (5 × 10⁴) was seeded into 24 well plates for the proliferation study, followed by treatment with Gleamax/VividawnTM at 500 and 250 µg/mL doses. After 72 h, the cells were examined for proliferation, and the MTT test was performed to determine the proportion of viable cells in each well. The Gleamax/VividawnTM showed 27.46% and 10.53% of cell proliferative activity over the control at higher and lower test concentrations (500 and 250 µg/mL), respectively (Figure 2).
Cytoprotective Assay
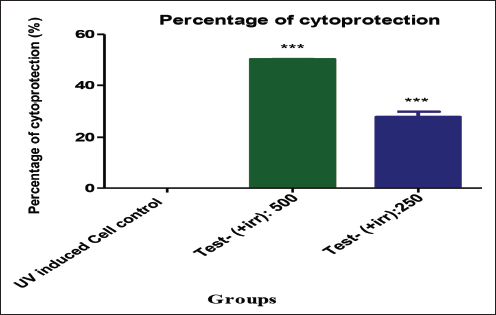
In order to ascertain the percentage of protection provided by the Gleamax/VividawnTM on maintaining cell viability following UV exposure, a predetermined number of cells was seeded into 6-well plates for the cytoprotective investigation, and the cells were monitored for viability after 72 h. The MTT assay was employed to determine the proportion of viable cells in each well. At 72 h, Gleamax/VividawnTM at 500 and 250 µg/mL exhibited 50.33% and 27.98% of cytoprotective activity on the human ARPE-19 cell line against UV-induced stress compared to control (Figure 3).
Estimation of LPF by ELISA Method
LPF is a fluorescent substance that accumulates with age in the RPE of the eye and possesses significant phototoxic potential, which might be a factor in retinal degeneration diseases. The most extensive LPF component characterized is A2E, which has been proposed as the byproduct of reactions involving the visual pigment chromophore. When the outer retina of the human eye is exposed to highly intense light and oxygen tension, it results in higher LPO levels in the rod outer segments, which contribute the A2E granules generation in the RPE.
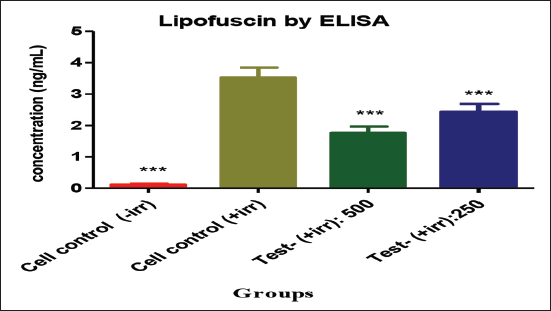
In this study, the stress is induced by UV in retinal cells, which is characterized by increased LPO and LPF production. The results showed that the treatment with Gleamax/VividawnTM at high concentration decreased the UV-induced LPF production in retinal cells. Treatment with Gleamax/VividawnTM at 500 and 250 µg/mL offered a protective activity to retinal cells with significantly lower LPF content of 1.77 and 2.43 ng/mL, respectively, when compared with the LPF content (3.53 ng/mL) of irradiated cell control (Figure 4).
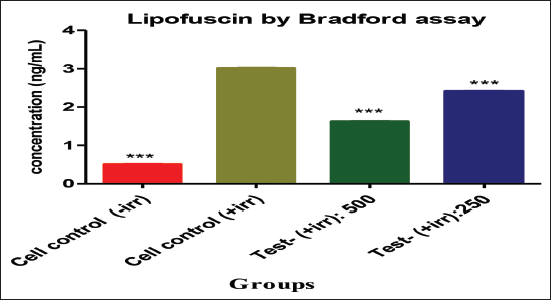
Estimation of A2E Level by Bradford Method
The identified byproduct of the visual cycle is bisretinoid A2E, which formed from retinal, and various in vitro studies resulted in toxicity associated with this compound. The first compound extracted from LPF is known to accumulate in the RPE with age. This study has been associated with the distribution of LPF and A2E across human retinal cells. In this study, the A2E spatial distribution was determined by the Bradford method, and the result indicated that the treatment with Gleamax/VividawnTM 500 µg/mL significantly decreased the A2E production (1.63 ng/mL) in irradiated retinal cells when compared to cell control (3.01 ng/mL) (Figure 5).
LPF Measurement in Retinal Cells
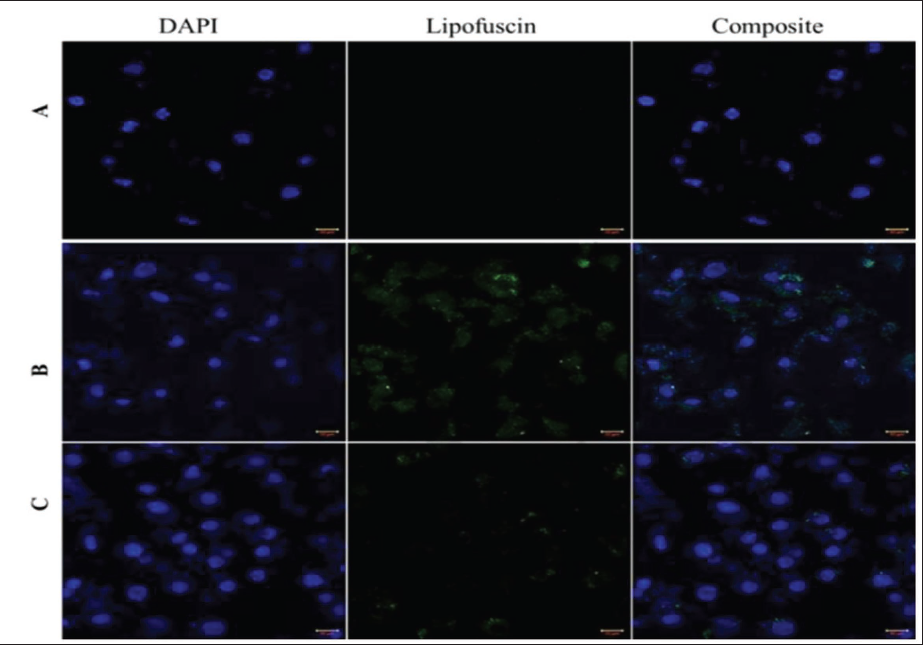
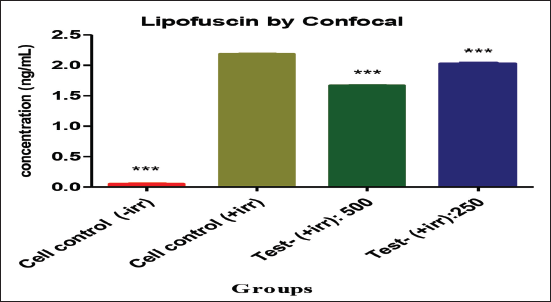
LPF fluorescence was imaged in the retinal cells by confocal microscopy. According to the microscopy analysis, it is imaged that chronic UV treatment caused a significant increase in LPF levels in human retinal cells (B) when compared to non-irradiated cells (A). Whereas cells treated with Gleamax/VividawnTM (C) caused a substantial reduction in LPF level when compared to the UV-irradiated cells (B). This finding suggests that the Gleamax/VividawnTM has a modulatory effect on reducing the accumulation of LPF in retinal cells. In addition, the fluorescence intensity of LPF in Gleamax/VividawnTM treated cells was measured, and it indicates the decreased fluorescent intensity in Gleamax/VividawnTM treated cells when compared to cell control (Figures 6 and 7).
Confocal Fluorescence Microscope Images Depicted the Lipofuscin Expression in Treated (C) and Cell Control Groups (A and B) on Human ARPE-19 Cells at the Magnification of 63× at Blue and Green Channels. Cell Nuclei are Counter Stained with 4′,6-Diamidino-2-phenylindole (DAPI) Solution.
Clinical Symptoms in Animals
There were no mortalities, clinical symptoms, or behavioral patterns observed in total treated groups throughout the treatment period.
Biochemistry
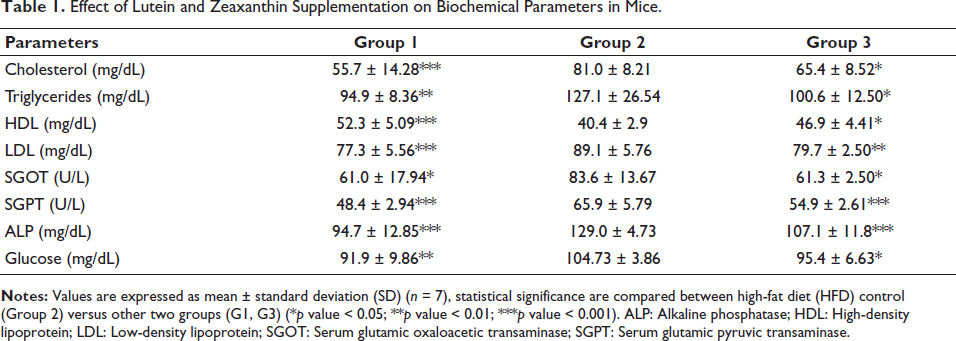
HFD treatment has elevated the liver parameters and along with lipid parameters in all treated animals. Elevated levels of cholesterol, glucose, and triglycerides emerged in the serum of the HFD control group (G2). The Gleamax/VividawnTM treated group (G3) exhibited significant total cholesterol reduction, triglycerides, and low-density lipoprotein (LDL), while high-density lipoprotein (HDL) was significantly enhanced when compared to the HFD control group (G2) (Table 1).
Effect of Lutein and Zeaxanthin Supplementation on Biochemical Parameters in Mice.
Antioxidant Levels in Serum
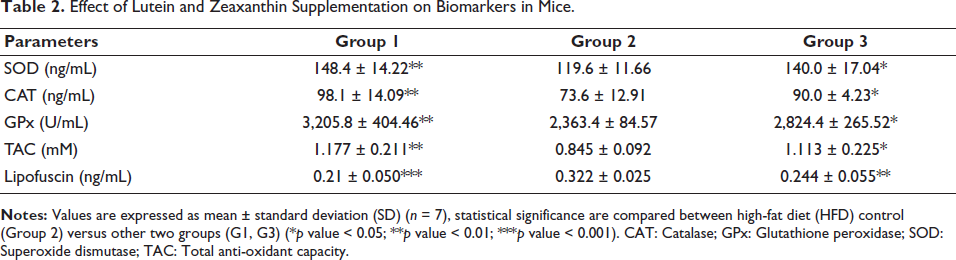
Antioxidant parameters play a crucial role in cellular membrane protection and lipoproteins against oxidative stress induced by reactive oxygen species (ROS). Antioxidative defense system markers, including TAC and mainly three antioxidant enzymes GPX, CAT, and SOD, were measured. In the HFD treatment group, animals exhibited lower levels of TAC and reduction in CAT, SOD, and GPx activity in the tissue of the retina when compared to normal control animals. In Group 3, Gleamax/VividawnTM significantly improved antioxidant levels compared to HFD-fed mice. The results revealed that HFD weakens the activity of antioxidant enzymes and causes oxidative stress by increasing the oxidation levels of the products, which can be reversed by Gleamax/VividawnTM supplementation (Table 2).
Effect of Lutein and Zeaxanthin Supplementation on Biomarkers in Mice.
In Vivo LPF Levels
LPF is a yellow-brown pigment comprising highly oxidized lipids, proteins, and metals.
Oxidative stress promotes LPF accumulation, and the production of reactive oxygen species by damaged mitochondria also leads to LPF formation. As LPF is covalently cross-linking, it is unable to be eliminated from the cytosol by the ubiquitin-proteasome system. Auto-phagosomes absorb cytosolic LPF and eventually build up in the system. LPF is usually observed in post-mitotic cells, particularly in long-lived cells like cardio-myocytes and neurons. In the present study, HFD-fed animals (G2) were found to have elevated levels of LPF when compared to the control group (G1). In Group 3 animals, treatment with Gleamax/VividawnTM significantly decreased LPF content in comparison with the HFD control group (G2) (Table 2).
Histopathology
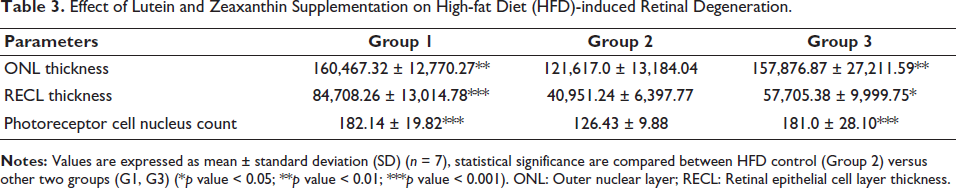
In the HFD mice model, the morphologic alterations in the retina observed were thinning of the IPL, outer plexiform layer (OPL), and ganglion cell layer (GCL). The outer nuclear layer (ONL) of the retina consists of rod photoreceptors and nuclei of the cone. Also, the cellular machinery loss comes across in these nuclei leads to irreparable loss of the photoreceptors and the capacity for visual function. The macula is a portion of the retina in the back of the eye that is liable for central vision, color vision, and fine detail. The macula contains cones, which are light-sensitive nerve cells that allow people to see color and fine detail. The RPE, a single layer of post-mitotic cells, is essential to the maintenance of the overlying photoreceptor layer because it functions as a selective barrier and a vegetative regulator. RPE forms tight junctions to control the transport of substances between the retina and choroid, including nutrients, water, and molecule solutes. The RPE acts as the second site of the blood-retinal barrier, after the capillary endothelium of the retinal vessels.
The protective effect of the Gleamax/VividawnTM against HFD-induced retinal damage on retinal degeneration was evaluated by image tissue analysis stained with hematoxylin and eosin (H&E). In the HFD-fed animals (G2), ONL thickness, and retinal epithelial cell layer thickness (RECL) were significantly reduced compared to those in the normal control group. In the fed group (G2), the retinal region showed edematous with mild inflammation. Many cells in the inner nuclear layer showed cytoplasmic vacuolations. Additionally, the number of photoreceptor cell nucleus counts was significantly lower in HFD-fed animals than in normal control group animals (G1). However, in the Gleamax/VividawnTM treatment group (G3), better thickness of the ONL and RECL was observed and found with a higher number of photoreceptor cell nucleus counts. These results indicate that Gleamax/VividawnTM offered shielding property on retinal degeneration in mice against HFD-induced retinal damage (Table 3).
Effect of Lutein and Zeaxanthin Supplementation on High-fat Diet (HFD)-induced Retinal Degeneration.
Lutein and Zeaxanthin Levels
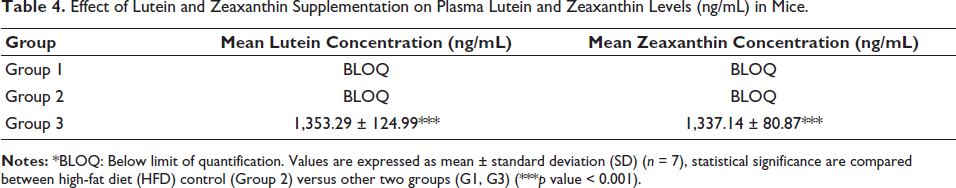
Lutein with a combination of zeaxanthin supplementation improves dysfunction in the central retina, obtaining benefits in terms of visual activity (VA) and glare sensitivity. In this study, normal control (G1) and HFD-fed animals (G2) were observed with below limit of quantification (BLOQ) levels of lutein and zeaxanthin in plasma. However, Gleamax/VividawnTM treated group (G3) animals were found with significantly elevated levels of lutein and zeaxanthin levels (Table 4).
Effect of Lutein and Zeaxanthin Supplementation on Plasma Lutein and Zeaxanthin Levels (ng/mL) in Mice.
Conclusion
LPF, a fluorescent material, contains substantial phototoxic potential that accumulates with age in the RPE of the eye. LPF is believed to be a factor in retinal degeneration diseases. The most widely categorized component of LPF is A2E, which has been proposed to be a byproduct of visual pigment chromophore reactions. When the outer retina of humans is exposed to intense light and high oxygen tension, it leads to high LPO levels in the rod outer segments, contributing to the A2E granules generation in the RPE.
In the present study, UV was used to induce stress in human retinal cells, which is characterized by increased LPO and LPF production in vitro. Treatment with Gleamax/VividawnTM has neutralized the UV-induced stress in retinal cells with reduced LPF and A2E levels, indicating the potential benefit of Gleamax/VividawnTM supplementation on eye health. Gleamax/VividawnTM also improved retinal cell proliferation along with offering significant cytoprotective activity against UV-induced stress, indicating its beneficial role in protecting the retinal cells.
The in vivo results also further asserted the in vitro observations indicating the beneficial effects of Gleamax/VividawnTM supplementation in mice. Additionally, the results indicated that HFD-induced oxidative stress by increasing the levels of oxidation products thus weakening the activity of antioxidant enzymes. Treatment with Gleamax/VividawnTM (G3) has significantly lowered the LPF levels and increased the antioxidant levels along with plasma lutein and zeaxanthin levels when compared to HFD control (G2). Also, observations from eye histology have clearly shown that Gleamax/VividawnTM exhibited potential effects in mice retinal degeneration against HFD-induced oxidative stress. These results clearly demonstrate that Gleamax/VividawnTM has the potential to prevent or neutralize the harmful effects of LPF by inhibiting the autoxidation of bisretinoids and A2E.
Gleamax/VividawnTM is a unique formula comprising lutein and zeaxanthin, known for their protective role against oxidative stress; these are the only dietary carotenoids that can accumulate in the retina, particularly in the macula. Elsewhere, it has been proven that supplementation with lutein and zeaxanthin has a potential effect by delaying the progression of eye diseases, including AMD and cataracts. From the present study results, it is evident that treatment with Gleamax/VividawnTM has favorable effects on eye health.
Footnotes
Abbreviations
AMD: Age-related macular diseases; A2E: N-retinylidene-N-retinylethanolamine; CAT: Catalase; HFD: High-fat diet; ONL: Outer nuclear layer; RECL: Retinal epithelial cell layer thickness; RPE: Retinal pigment epithelium; SOD: Superoxide dismutase; TAC: Total antioxidant capacity.
Acknowledgments
The authors would like to thank the management of Cell Green Biolab Co., Ltd., Korea, and Botanic Healthcare Pvt. Ltd., India for their support and appreciation of the benefits gained from this research work. In addition, the authors would like to thank Botanic Healthcare Private Limited, India for supplying the test material.
Declaration of Conflicting Interests
The authors declared no potential conflicts of interest with respect to the research, authorship, and/or publication of this article.
Ethical Approval and Informed Consent
This study has obtained ethical approval from the Committee for the Control and Supervision of Experiments on Animals (CCSEA) (Approval no: RR/IAEC/122-2023).
Funding
The authors disclosed receipt of the following financial support for the research, authorship, and/or publication of this article: This study was supported and funded by Botanic Healthcare Pvt. Ltd., India.