
Abstract
Background
Spirulina (Arthrospira platensis), a cyanobacterium, is being consumed worldwide owing to its high nutritional value and therapeutic potential.
Objectives
This study aims to determine the phytochemical content, antioxidant capacity, and antiglycation property of A. platensis PCC 7345 aqueous extract against glucose, fructose, and ribose-mediated glycation of hemoglobin.
Materials and Methods
The antioxidant property of the extract was determined by 2,2-diphenyl-1-picrylhydrazyl (DPPH), 2,2’-azino-bis(3-ethylbenzothiazoline-6-sulfonic acid) (ABTS), and a nitric oxide scavenging assay. Protein glycation and its subsequent prevention were interpreted by observing a reduction in browning, fructosamine, glycated hemoglobin (HbA1c) level, protein carbonyl content, advanced glycation end products (AGEs) formation, and protein aggregation using spectrophotometry and spectrofluorometry. The prevention of strand nicking/breaks in the pBR322 plasmid was analyzed using electrophoresis, and the change in integrated density was calculated using ImageJ software.
Results
The extract showed very good antioxidant potential, which is evident and could be estimated from the inhibition concentration (IC50) values that were 45.97, 31.09, and 52.29 µg/mL in the DPPH, ABTS, and nitric oxide scavenging assays, respectively. A. platensis aqueous extract was found to be the most effective in preventing glucose-mediated glycation and protein aggregation, wherein 100 µg/mL of the extract could effectively cause ~50% inhibition in the formation of early and AGEs and prevented the formation of protein aggregates. The highest antiglycating potential of the extract was observed in glucose-mediated glycation, followed by fructose and ribose. The formation of four fluorescent AGEs, such as argpyrimidine, vesper lysine A, pentosidine, and crossline, was reduced. The extract could prevent 97% of DNA nicking in pBR322.
Conclusion
The aqueous extract of A. platensis has a potent ability to prevent glycation and its secondary complications.
Keywords
Introduction
Diabetes and its secondary complications are major metabolic disorders affecting millions worldwide. Since the last few decades, there has been a rapid increase in the morbidity and mortality rate of diabetes. Thus, the American Diabetes Association (ADA) recommends screening for prediabetes and type 2 diabetes from the age of 35, even in the absence of any symptoms (American Diabetes Association, 2022). The screening includes determining glycated hemoglobin (HbA1c) levels in the blood. HbA1c is considered to be standard in the estimation of developing long-term complications. Since the half-life of hemoglobin (HB) ranges from 90 to 120 days, the HbA1c level is used as an indicator of glucose control for 2–3 months (American Diabetes Association, 2022; Singh et al., 2014). On the contrary, fructosamine levels help estimate glucose levels in 7–21 days. This helps in monitoring rapid insulin titrations and is helpful in the short-term monitoring of diabetes control.
Although not entirely determined, a complex cascade of reactions is activated in the presence of surplus sugar in the body. One of these reactions is glycation, or the non-enzymatic binding of sugar with biomolecules like proteins, lipids, and nucleic acids. Advanced glycation end products (AGEs) formed by protein glycation lead to structural and functional changes, thereby triggering secondary complications of diabetes (Singh et al., 2014).
According to Bunn et al. (1975), the N-terminal valine of the β-subunit of HB is the most prone to glycation. It reacts with the carbonyl group of reducing sugars to generate a Schiff base, which further rearranges to form Amadori products. Both products in the initial stages of glycation are formed by a reversible reaction (Thornalley & Rabbani, 2014); hence, these initial steps become the target for antiglycation activity. However, both the products are highly unstable and consequently and parallelly lead to the formation of irreversible AGEs. Though oxidation is not the only process that alleviates AGE formation, a combination of glycation and oxidation, i.e., glycoxidation, further triggers the formation of many AGEs (Ahmad et al., 2014; Thornalley & Rabbani, 2014). These AGEs could be classified into two types based on their ability to emit fluorescence, namely, fluorescent and nonfluorescent AGEs. Fluorescent AGEs get easily detected by simple fluorometric techniques (Thornalley & Rabbani, 2014) and are often used as a marker for glycoxidative damage (Ahmad et al., 2014).
The intermediate carbonyl species originating due to glycation and oxidative stress are highly reactive. They are further known to cause structural and functional changes in other biomacromolecules like nucleic acids and lipids. Glyoxal and methylglyoxal (MG) are the reactive carbonyl species that have been identified as being exclusively responsible for glycation in DNA (Ahmad et al., 2014). These have been used to trigger glycation processes for in vitro DNA studies. A glycated DNA can be identified by comparing it with the native DNA and determining the modification, mutation, or nicking of DNA (Ahmad et al. 2017).
Hypothesizing that oxidative stress is one of the major contributors to glycation and protein aggregation, the superfood Spirulina’s species, Arthrospira platensis, was selected for the test owing to its high antioxidant potential. In this study, A. platensis was sonicated, and its aqueous extract was used to determine its phytochemical constituents, antioxidant properties, and ability to prevent glycation and protein aggregation. Our results indicate that the extract could effectively reduce the structural and functional changes in HB as induced by three sugars, namely glucose, fructose, and ribose. Furthermore, using pBR322 as a model for DNA, an A. platensis aqueous extract was proven to be efficient in preventing its glycoxidation.
Materials and Methods
Materials
Axenic culture of A. platensis PCC 7345 was procured from Dr. Vani, BITS Pilani (Hyderabad, India). BG11 medium was purchased from Himedia Laboratories Pvt. Ltd., Mumbai, India. All other chemicals were purchased from SD Fine-Chem. Ltd., Mumbai, India.
Preparation of Extract
The exponential phase, that is, 11–15-day-old culture of A. platensis PCC 7345, was collected and centrifuged at 10,000 rpm for 10 mins at 4°C. The biomass was collected and washed twice with distilled water (D/W). The biomass was dissolved in D/W at 100 mg/mL concentration and sonicated at 37°C for 10 min at 15 pulses/min. This was further centrifuged, and the supernatant was used for further analysis.
Phytochemical Screening of the Extract
Quantification of Biochemical Compounds
The carbohydrate and protein content of the samples were quantified by 3,5-dinitrosalicylic acid (DNSA) and Bradford’s method at 540 nm and 595 nm, respectively, using a spectrophotometer. Total phenolic content was determined using a modified Folin-Ciocalteu’s method compared with gallic acid as the standard (Singh et al., 2002). Total flavonoid content was estimated using the aluminum chloride method, representing the result as quercetin equivalents/ml (Kumar et al., 2022).
Antioxidant Activity Profiling
The free radical scavenging activity of the extract was determined by the 2, 2-diphenyl-1-picrylhydrazyl (DPPH) assay. The Griess reagent was freshly prepared and used for the nitric oxide radical scavenging assay. Five milliliters of a varying concentration of extract (20–100 µg/mL) was mixed with an overnight prepared 2,2’-azino-bis(3-ethylbenzothiazoline-6-sulfonic acid) (ABTS) solution, and readings were taken after 30 min of incubation at 734 nm (Rajurkar & Hande, 2011). The percent inhibition in all three assays was calculated using the following formula:
% Inhibition = [(Abs Control−Abs Extracts)/Abs Control] × 100.
Determination of the Presence of Phycobiliproteins in the Extract
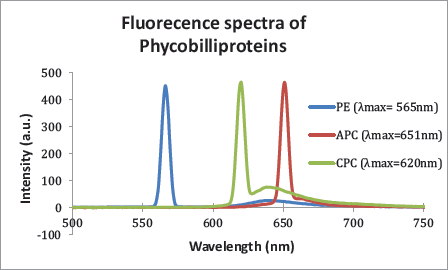
The cyanobacterium A. platensis contains three phycobiliproteins, namely, C-phycocyanin (C-PC), alloph-ycocyanin (APC), and phycoerythrin (PE). All the light-harvesting bilin proteins were determined fluorometrically using a Cary Eclipse Fluorescence Spectrophotometer. The excitation wavelengths of C-PC, APC, and PE are 620, 651, and 566 nm, respectively, and the emission was recorded at 500–750 nm (Dagnino-Leone et al., 2022).
Incubation for Antiglycating Assays
A. platensis aqueous extract (100 µg/mL) was tested for its antiglycation potential using HB (1 mg/mL) as the protein and various sugars, namely, glucose (100 mg/mL), fructose (100 mg/mL), and ribose (10 mg/mL). Glycated control contained sugar and protein, sodium phosphate buffer (0.1 M, pH 7.4), and sodium azide (30 mM), while the test sample contained glycated control with the extract. The tubes were incubated at 37°C for 28 days and then subjected to antiglycation assays immediately (Banan & Ali, 2016).
Determination of Early and Late Glycated Products
Browning
The extent of browning in the incubated samples was measured at 420 nm using the Shimadzu UV 1800 spectrophotometer. The results of test samples were compared with relative percentages concerning the standard (Banan & Ali, 2016).
Fructosamine and HbA1c
The ketoamine or Amadori product, formed during the initial stages of glycation, was determined using a nitroblue tetrazolium (NBT) assay. One hundred microliters of NBT reagent was incubated with 10 µL of glycated samples at 37°C for 15 min. 0.89 mL of D/W was added to this reaction mixture to increase the volume to 1 mL. Absorbance was measured at 530 nm, and the values were calculated in µmol/L using 1-deoxy-1-morpholinofructose (DMF) as a standard.
The amount of fructosamine and HbA1C are highly correlated. According to the ADA, 292 mmol/l of serum fructosamine content is equivalent to 6.57% of HbA1C (Cohen et al., 2003). Thus, using the fructosamine content, HbA1C levels in incubated samples were determined using the following formula (Vasista et al., 2015):

Protein Carbonyl Content
The carbonyl content in the glycated samples was measured using the 2,4-dinitrophenylhydrazine (DNPH assay. One hundred microliters of the incubated samples were added to 400 µL of DNPH reagent and incubated in the dark for an hour. 500 µL of trichloroacetic acid (TCA) was added to precipitate the protein in the samples. After 5 min of incubation on ice, the samples were centrifuged at 4°C for 10 min at 10,000 rpm. The pellet was collected and washed three times with ethanol:ethyl acetate (1:1) before suspending in 6M guanidine hydrochloride. The solutions were diluted up to 1 mL using D/W, and the absorbance was determined spectrophotometrically at 370 nm using a Shimadzu UV 1800 spectrophotometer (Banan & Ali, 2016).
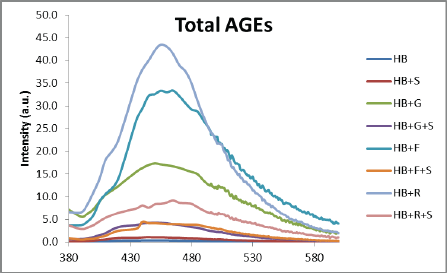
Total Fluorescent AGEs
The incubated samples were diluted ten times using D/W and checked for fluorescence by excitation wavelength at 370 nm and emission at 440 nm (Banan & Ali, 2016; Thornalley & Rabbani, 2014).
Fluorescent Individual AGEs
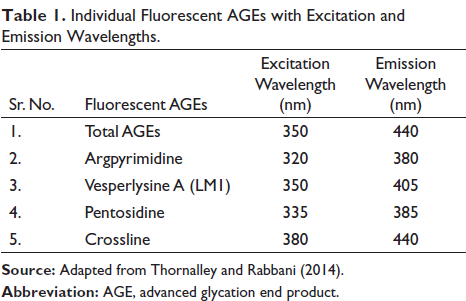
Some of the AGEs have been known to exhibit fluorescence. The incubated samples were analyzed fluorometrically for the same and checked for the formation of fluorescent AGEs (Thornalley & Rabbani, 2014). The fluorescent AGEs mentioned in Table 1 were determined.
Individual Fluorescent AGEs with Excitation and Emission Wavelengths.
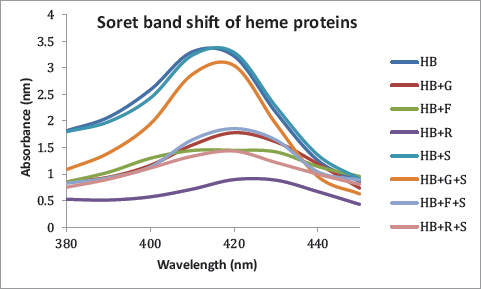
Determination of Band Shift of Heme Proteins in HB
All heme proteins exhibit a Soret peak in the blue wavelength region of the visible spectrum. The red band shift in the glycated proteins and its prevention were determined spectrophotometrically between 380 and 450 nm (Behroozi et al., 2014).
Analysis of Glycation-induced Protein Aggregation
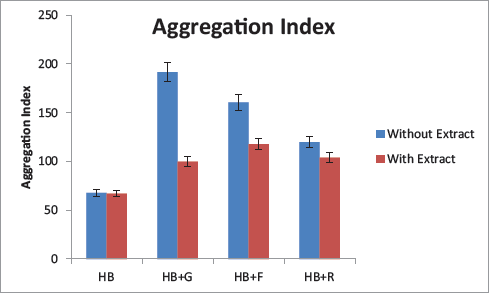
Protein Aggregation Index
The presence of protein aggregates in the sample was determined spectrophotometrically, and the protein aggregation index was then further calculated using the following formula:

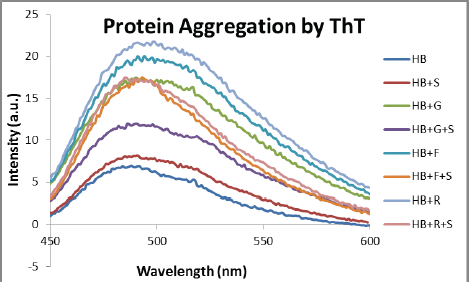
Protein Aggregation by Thioflavin-T
AGEs trigger the formation of protein aggregates. These increased β-structures were determined using a fluorescent dye, Thioflavin-T (ThT). The incubated sample was diluted 10 times with D/W. 40 µL of 8 mM ThT in 100 mM of sodium phosphate buffer (pH 7.4) was added to 1.0 mL of diluted sample and kept for incubation for 15 min at RT. The readings were acquired using 444/485 nm excitation/emission filters on a Cary Eclipse Fluorescence Spectrophotometer (Banan & Ali, 2016).
Prevention of Glycoxidative Damage to DNA
In vitro glycation of plasmid DNA in the presence of A. platensis extract:
pBR322 plasmid DNA (0.25 µg) in 100 mM potassium phosphate buffer (pH 7.4) was incubated with lysine (20 mM), MG (20 mM), and FeCl3 (100 µM) in the presence and absence of A. platensis extract. The reaction mixtures of samples were incubated at 37°C for 2 h. pBR322 plasmid DNA (0.25 µg) in 100 mM potassium phosphate buffer (pH 7.4) without a glycation system, and A. platensis extract was used as a control (Kumar et al., 2022).
Agarose Gel Electrophoresis of a Glycated Plasmid DNA Sample
Ten microliters of incubated samples were mixed with 2 µL of 6X gel loading dye and loaded onto a 1% agarose gel prepared in TAE buffer. Electrophoresis was carried out at 85 V, and the gel was run up to two-third of its length. The gel was stained with fluorescent dye Ethidium Bromide (5 µg/ml) and visualized using Gel-Doc.
Determination of Change in Band IntDen
DNA images from Gel-Doc were analyzed using ImageJ (Version 1.53s) to measure the integrated density (IntDen). The colors of the gel image were inverted/converted into dark bands-light background. A graph of gray area vs. density was plotted using the software. The IntDen was further calculated, and an increase/decrease in bands was determined.
Statistical Analysis
All the graphs were plotted and analyzed using GraphPad Prism version 9.4.0. Statistical significance of the data was evaluated using ordinary one-way ANOVA, and the Brown-Forsythe test was applied wherever applicable. p-values < 0.05 were considered statistically significant. The significance was further indicated in the graph as follows: **p < 0.05; ***p < 0.005; ****p< 0.0005.
Results
Biochemical Screening of the Extract
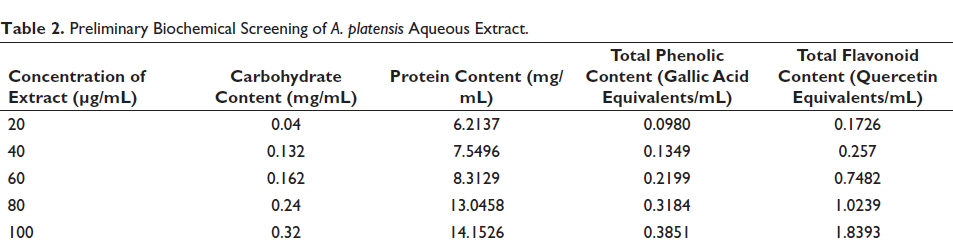
Aqueous extracts prepared from biomass at concentrations of 20–100 µg/mL were subjected to biochemical screening. There was a linear increase in all the measured phytoconstituents. A comparison of carbohydrate and protein content in the biomass clearly indicates the high level of protein present in the cells (Table 2). Similarly, the flavonoid content was found to be almost five times as high as the phenolic acid content. These compounds have been known to impart antioxidant properties to the organism.
Preliminary Biochemical Screening of A. platensis Aqueous Extract.
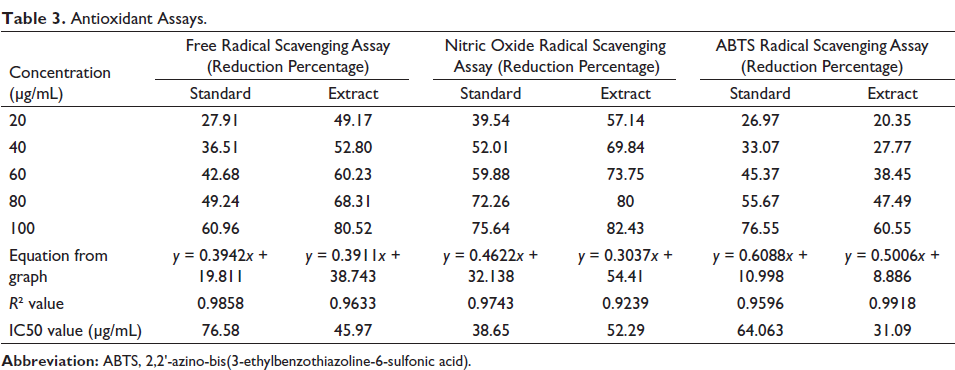
Antioxidant Profiling of the Extract
DPPH assay, or free radical scavenging activity assay, and ABTS decolorization assay help in the determination of the total antioxidant potential of the sample, herein the extract (Mahdi-Pour et al., 2012). However, the assays are performed in different solvents, that is, methanol and D/W, respectively (Figure 1).
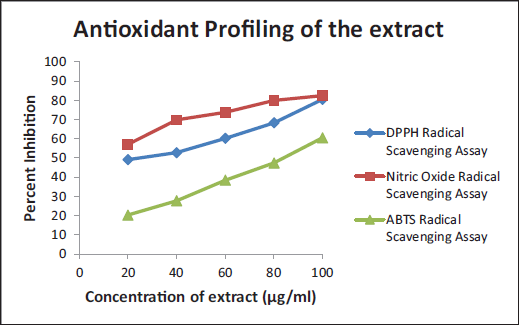
Thus, the higher solubility of organic compounds in organic solvents could be one of the reasons for the difference in the IC50 values. The IC50 values were calculated from the equations obtained through graphs. IC50 values of DPPH, NO radical, and ABTS scavenging assays were 42.5, 52.29, and 31.09 µg/mL, respectively (Table 3).
Antioxidant Assays.
Determination of the Presence of Phycobiliproteins
A. platensis contains a phycobilisome that captures light energy and helps the organism do photosynthesis. Three phycobiliproteins are present in this complex, which was determined by fluorometer. The maximum PE, APC, and C-PC emission was observed at 565, 651, and 620 nm (Figure 2).
Quantification of Glycated Products
Browning
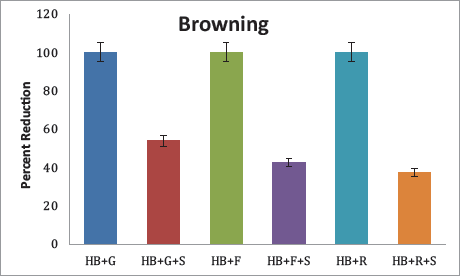
Browning is an indicator of the Maillard reaction, which is the first stage of glycation. Considering HB + sugars as the standard (100%), the percent reduction of browning of the samples was determined. The highest reduction of 53.83% was observed in glucose, followed by fructose and ribose, where the extract could inhibit browning by 42.62% and 37.43%, respectively (Figure 3).
Protein Carbonyl Content
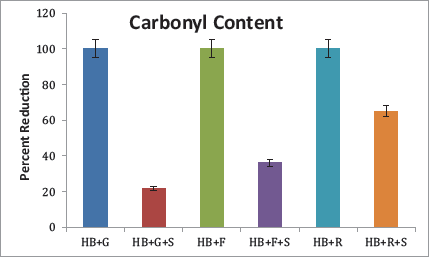
Protein carbonyls are formed during the second glycation stage, which further forms AGEs. The aqueous extract was found most effective by reducing 65.14% of the protein carbonyl content in the presence of ribose, followed by fructose, where the reduction was 36.17% (Figure 4). Though a similar reduction (21.74%) was also observed in HB incubated with glucose and the sample, the result was insignificant.
Fructosamine Content and HbA1C Level
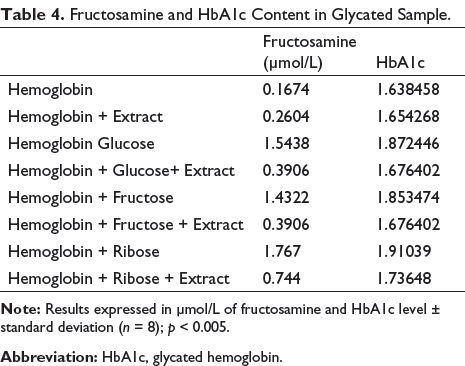
A standard graph of DMF was plotted, and values of fructosamine were extrapolated from the graph. The HbA1C level was further calculated using the previously mentioned formula (Table 4). In the presence of the extract, both fructosamine and HbA1C levels were reduced in all three sugars.
Fructosamine and HbA1C Content in Glycated Sample.
Total Fluorescent AGE
Some AGEs exhibit fluorescent properties. Inhibition was observed in all glycated samples (Figure 5) with extracts compared with the standards (HB + sugar).
Determination of Individual AGEs
Kiviat diagrams/radar chats were used to represent the different AGEs present in the incubated sample and their respective reductions in the presence of A. platensis aqueous extract. The blue line indicates the level of fluorescent AGEs in arbitrary units as a positive standard, that is, HB + sugar, while the red line indicates the level of AGEs after treatment with extract. All the sugars could induce all five types of fluorescent AGEs in HbA1C (Figure 6).
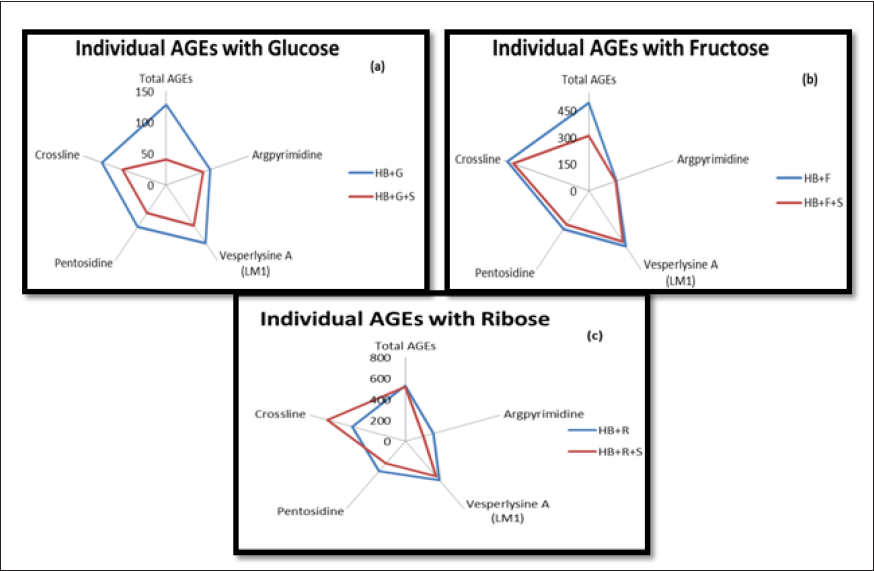
It can be observed from the graphical representation that glucose could induce the highest number of total AGEs, followed by crossline and vesper lysine A. Although A. platensis extract could reduce the fluorescent intensity of all AGEs, it was found more effective in reducing total AGEs and crosslines. Similarly, the extract could effectively reduce total AGEs in fructose-mediated glycation of HB, while in the case of ribose-mediated glycation, extract was more effective in reducing pentosidine and argpyrimidine.
Soret-Band Statue of Heme Proteins
A decrease in Soret peak as well as redshift can be observed in HbA1C (Figure 7). The highest change has been observed in HB incubated with ribose, fructose, and glucose, respectively. The extract had almost no effect on the absorptivity of heme proteins and could effectively preserve the absorptivity in the presence of all three sugars.
Quantification of Glycation-induced Aggregation of Proteins
Protein Aggregation Index
The highest aggregation index was observed in HB + glucose, followed by fructose and ribose. The aqueous extract of A. platensis could effectively decrease the aggregation of protein in all three sugars. The most significant decrease was observed in the case of glucose (Figure 8).
Protein Aggregation by ThT
A structural alteration in glycated proteins leads to an increase in amyloid fibrils and cross β-structure. These changes were monitored using the fluorescent dye ThT (Figure 9). A significant decrease in β-structure can be observed when HB + sugars were incubated with extracts in comparison with their standard.
Effect of A. platensis Extract on DNA Damage
Plasmid DNA pBR322 alone (lane 1) displayed two bands, band 1 indicating a linear form, and the lower band, that is, band 2, indicating supercoiled form (Figure 10a).
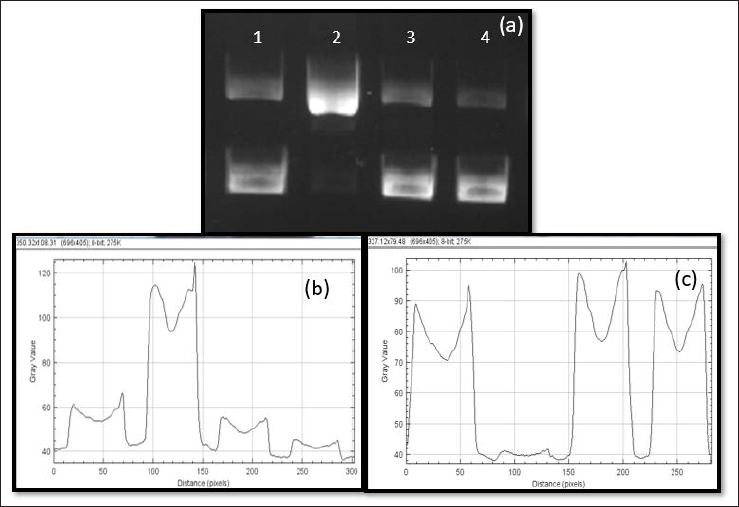
(a) Lanes: 1 – DNA alone; 2 – DNA + Glycation System (MG + FeCl3 + Lys); 3 – DNA + A. platensis Aqueous Extract; 4 – DNA + Glycation System + Extract [Incubation Time: 180 min; Stained with Ethidium Bromide].
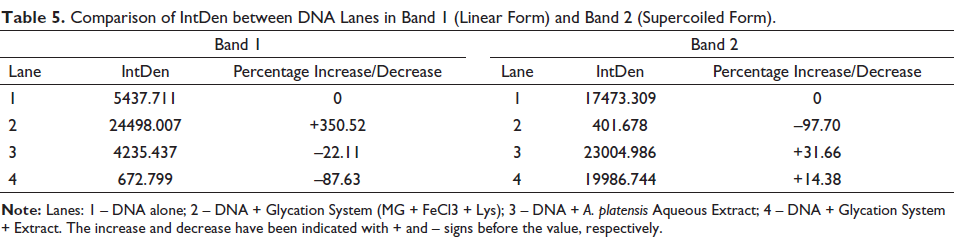
Glycation causes strand breaks in the supercoiled form, thereby turning them linear as observed in lane 2 (pBR322 + glycation system). Lane 3 containing DNA and A. platensis extract, appeared similar to lane 1 implying that the extract did not affect the DNA. Lane 4 containing DNA + glycation system + extract seemed to be similar to lane 1, with lesser intensity in the linear band (Figure 10b) and higher intensity in the supercoiled form (Figure 10c). This indicates that the extract could reverse the strand break induced by the glycation system on the DNA or prevent the same. These results were further analyzed using ImageJ, and it can be observed that MG could convert almost 97% of DNA from supercoiled form to linear form (Table 5). However, the presence of the extract was found to inhibit the perturbation in DNA and repair it back to its native supercoiled form.
Comparison of IntDen between DNA Lanes in Band 1 (Linear Form) and Band 2 (Supercoiled Form).
Discussion
Glycation is a spontaneous, non-enzymatic process occurring in hyperglycemia. Excess sugar in the body starts reacting with the biomolecules and altering their structural integrity, compromising their functionality. The current research is focused on detecting early glycation products and AGEs formed by HB in reaction with the three most abundant sugars in the body, that is, glucose, fructose, and ribose. Since ribose was the most highly reactive sugar among the three, glycation products appeared to be higher in comparison with fructose and glucose.
The first step of glycation is the Maillard reaction, wherein the carbonyl group from reducing sugars reacts with free amino groups to form a reversible Schiff base. It further undergoes autooxidation to form ketamine (e.g., fructosamine). Reactive protein carbonyl intermediates trigger the formation of AGEs and protein aggregates. All three stages of glycation liberate hydroxyl radicals, reactive oxygen species (ROS), reactive nitrogen species (RNS), and superoxide radicals in the presence of transition metals, which in turn leads to acceleration of the glycation process (Smith & Thornalley, 1992; Suantawee et al., 2015).
As oxidative stress is one of the triggering factors in the manifestation of glycation (Paramanya & Ali, 2019),A. platensis, a source of a powerful antioxidant, was checked for its antiglycating property. Fluorometric analysis of the extract shows the presence of all three phycobiliproteins, namely, APC, C-PC, and PE, all of which have been known to contain antioxidant properties. Notably, the extract was found to be more efficient in preventing and/or reversing the damage done to HB than glucose followed by fructose and ribose consecutively. It can be seen from our results that the extract is more efficient at preventing the formation of AGEs than it is at inhibiting the formation of early glycation products. One of the reasons for this could be narrowed down to the faster reaction rates in the formation of early glycation products with respect to AGE. The determination of bioactive compounds in the extract and improving its site-specificity might help prevent the glycation of hemoglobin at earlier stages.
The data collected in this research also represent the formation of different types of fluorescent AGEs induced by all three sugars in HB. The aqueous extract of A. platensis could reduce the formation of these AGEs; however, there was no direct similarity in reduction of AGEs when compared with HbA1C formed by the three sugars. Behroozi and colleagues (2014) reported that glycation of HB caused a red shift of the heme proteins. The findings of this research paper coincide with this study, wherein the changes in decreased absorptivity of heme proteins were attenuated effectively by A. platensis extract.
Ribose, the most reactive of the three tested sugars, appeared to elevate the levels of early and late glycation products and protein aggregates. Thus, the glycation potential of the sugars can be stated as ribose>fructose>glucose. The antiglycating potential of the extract was thus highest in glucose-mediated glycation, followed by fructose and ribose. It is noteworthy that the extracts were found to be more effective in preventing glycations at early stages compared to the reduction observed in the late stages and during protein aggregation.
The final part of the study dealt with determining the perturbation of DNA using the pBR322 model and further prevention of strand breaks using extract. MG, a dicarbonyl sugar, was used to induce strand breaks and convert DNA from supercoiled to linear (Ahmad et al., 2017; Jha et al., 2018). However, the A. platensis extract was found coherent, decreasing linearity and restoring the DNA back to its supercoiled form. Although A. platensis has been previously shown to have an anti-DNA damage effect in cadmium chloride-induced DNA damage (Aly et al., 2018), this article is the first to report DNA protective effects in glycoxidative DNA damage.
It has to be noted that this study has several limitations, which include the use of high sugar concentrations to elevate the glycation process. It is still unclear exactly how the compounds in the extract get metabolized in vivo and the plethora of factors orchestrating this process, like the amount and extent of glycemia. Based on the results, it can be concluded that the antioxidant properties of A. platensis could be one of the major contributing factors. However, a comprehensive study of the extract could help determine the bioactive compound involved in contributing to the antiglycating property of A. platensis.
Conclusion
A. platensis aqueous extract contains all three phycobiliprotein, which possess antioxidant properties. The current study on HB shows that this extract could effectively attenuate the damages occurring due to glycation induced by the three tested sugars, namely, glucose, fructose, and ribose. The extract could also prevent glycoxidative damage on pBR322, implying that A. platensis can be considered to possess antiglycating properties.
Footnotes
Summary
Spirulina (A. platensis) extract was evaluated for its antiglycating potential against three sugars, namely, glucose, fructose, and ribose. For protein, HB was used, and it was found that the extract prevented both early and late stages of glycation and protein aggregation against all three sugars. The extract also prevented the DNA strand breaks in pBR322 caused by glycoxidation.
Acknowledgments
We gratefully acknowledge Dr. Vani from BITS Pilani, Hyderabad, for providing an axenic culture of A. platensis PCC 7345. The authors would also like to extend their sincere appreciation to the Researchers Supporting Project number (RSP2023R154), King Saud University, Riyadh, Saudi Arabia.
Abbreviations
ABTS: 2,2’-azino-bis(3-ethylbenzothiazoline-6-sulfonic acid); ADA: American Diabetes Association; AGEs: advanced glycation end products; BSA: bovine serum albumin; DMF: 1-deoxy-1-morpholinofructose; DNPH: 2,4-dinitrophenylhydrazine; DNSA: 3,5-dinitrosalicylic acid; DPPH: 2,2-diphenyl-1-picrylhydrazyl; F: fructose; G: glucose; HB: hemoglobin; HbA1C: glycated hemoglobin; Lys: lysine; MG: methylglyoxal; NBT: nitroblue tetrazolium; R: ribose; RNS: reactive nitrogen species; ROS: reactive oxygen species; S: sample, i.e., A. platensis PCC 7345 aqueous extract (100 µg/ml); TCA: trichloroacetic acid; ThT: thioflavin-T dye.
Authors’ Contributions
Additiya Paramanya: Methodology, Formal analysis, Investigation, and Writing—original draft. Mohammad Abul Farah and Khalid Mashay Al-Anazi: Conceptualization, Funding acquisition, Writing—review & editing, and Formal analysis. Hari Prasad Devkota: Writing—review & editing and Formal analysis. Ahmad Ali: Conceptualization, Writing—review & editing, Supervision, Project administration, and Validation.
Declaration of Conflicting Interests
The authors received no financial support for the research, authorship and/or publication of this article.
Ethical Approval
Not Applicable.
Funding
The authors declared no potential conflicts of interest with respect to the research, authorship, and/or publication of this article.