
Abstract
Acknowledging the importance of fiscal decentralisation, this paper evaluates the fiscal performances of all the Gram Panchayats (GPs) in Birbhum and North 24 Parganas of West Bengal and identifies the determinants of disparities in their fiscal performances. Our analysis reveals that smaller GPs generate greater own source revenues per person, receive higher grants per person and spend more per person. Several factors including demographic characteristics, socio-economic characteristics and geographical locations shape the needs and priorities of the GPs and, therefore, are important for explaining the variations in their fiscal performances. The regression results reveal that willingness to pay taxes is greater among literate people and also the incidence of expenditure is significantly higher for GPs with higher literacy rates. The proportion of agricultural labour and concentration of scheduled caste/scheduled tribes population in the GPs show a negative impact on the collection of own source revenue and also on per capita expenditure but a positive impact on the grants and transfers received from higher levels of governments.
Keywords
Introduction
Decentralisation entails the devolution of administrative, financial and political power to the lowest levels of government. Among its different variants, fiscal decentralisation promises to create incentives for accountability and to attain efficiency in service delivery. On the one hand, this framework argues for devolving power and responsibilities to the local level of government while, on the other, it argues for tax assignment to the local level so that the local government can cover the expenditures for the devolved functions. Within the public economics framework, there are strong theoretical arguments in favour of the assignment of functions with localised benefits to local governments (Oates 1999). It empowers the local government to tax its people receiving benefits. Matching expenditure responsibilities with taxation powers produces a vertical fiscal balance and clearly links the benefits and costs of public services (Watt 2004). People are willing to ‘share the burden’ of the services that they access and use. This also makes the local decision-makers more accountable to the people and responsible towards the needs and priorities of local people (Klugman 1994). All these can bring about some positive changes in the delivery of public services at the grassroots level. Empirical literature notes a high correlation between greater revenue devolution and higher expansionary effects of expenditure decentralisation on local services across the countries (Mookherjee 2015).
Revenue autonomy and power of resource allocation of the local governments is central to improving the efficiency of the local governments (Bailey 2003; Bird 2000; Kim 2008). However, in developing countries, local governments lack the fiscal resources necessary to carry out their functions (Smoke 2001). In practice, local governments use taxes on property, advertisement tax, entertainment tax and charge user fees to finance their expenditures. However, these taxes are burdened with the problems of administrative difficulties, inelastic tax bases and political compulsions of lower tax rates, thereby severely hampering their revenue potential. In many cases, the local taxes bear very little relationship with the benefits received by the taxpayers (Bird 2000). This clearly weakens the local fiscal capacity for long-term investment in infrastructure and basic services (Watt 2004). Moreover, local governments in developing countries are more prone to local capture (Bardhan 2021). In those cases, the revenue autonomy of the local governments can be counter-productive as any regressive local taxes would put heavy burdens on the poor people and, eventually, they end up paying taxes for services delivered to the non-poor (Mookherjee 2015).
Given the paucity of their own revenue, the Gram Panchayats (GPs) rely highly on grants from central and state levels of government. Grants are categorised as unconditional grants (local governments enjoy discretion over their utilisation) and conditional grants (utilisation of grants depends on central mandates). Conditional grants are either used to mandate local expenditures on services of national importance or to achieve the target of service delivery at a satisfactory level. In contrast, unconditional grants can address the differential patterns of ‘fiscal need’ and ‘fiscal capacity’ among the local governments. Design of intergovernmental grants is crucial to incentivise the revenue efforts of the local government and to ensure ‘equalisation’—‘those local governments with greater expenditure needs should receive more, while those with greater local revenue capacity should receive less, to the point where each local government is able to provide a standard level of services at an average level of local tax (Devas 2002). ‘Properly designed transfers can facilitate the redistribution of funds to the poorer regions and even better local governments’ efficiency and accountability as local citizens are more concerned with the utilization of such grants and attendant improvement in the delivery of basic services in their jurisdictions’ (Bird 2000; Faguet 2014). Moreover, the local governments in developing countries face both soft and hard budget constraints. The former can result in excess fiscal spending and inefficiencies which, often, require bailouts by the higher levels of government. In contrast, the hardening of budget constraints reduces the local governments’ scope of manoeuvring inter-jurisdictional allocations as per the local needs and priorities, which in turn restricts the credibility of the GPs to provide basic services.
The 73rd Constitutional Amendment Act (CAA) in India has a provision for specifying the functional domain of the GPs through the identification of 29 functions. Regarding the financial domain of the GPs, the most important provision of the 73rd CAA is the recommendation to form a State Finance Commission (SFC) in order to examine the fiscal health of the GPs, to provide recommendations to the state governments on the distribution of grants among the Panchayati Raj Institutions (PRIs) and come up with suggestions to improve the condition of the same in every five years. Different states have exercised their discretion in implementing the 73rd CAA as the system of local governance is a state subject. It has been observed that the states are reluctant to devolve functions, finances and functionaries to the local level, albeit, with few exceptions.
In West Bengal, there are mismatches between the devolution of functional responsibilities and financial provisions to execute the devolved functions at the GP level (Bahl et al. 2010). The revenue-raising abilities of the GPs from tax and non-tax sources are limited and remain under-utilised (GoWB 2016; ISS 2015). GPs depend on grants from higher levels of government to address such mismatches. Grants under centrally sponsored schemes (CSSs), which constitute the major portion of finance, are conditional and cannot be used for any other developmental work. Funds transferred under the state finance commission and central finance commission give a certain amount of autonomy to the GPs. Even, for these funds, broadly the areas where they should be used are mentioned. So, GPs tend to have a low fiscal base and lack financial autonomy. Nevertheless, following the spirit of the 73rd CAA, it is imperative for the GPs to strengthen their financial health and improve the delivery of basic services. Given the resource crunch at the local level, the present scenario of GP finances deserves serious policy attention.
Against this background, this paper tries to understand the state of rural fiscal decentralisation in the two selected districts—Birbhum and North 24 Parganas—of West Bengal. The second section elaborates on the salient features of the 73rd CAA and its implications for fiscal decentralisation. The data and methodological approach are described in the third section. The fourth section evaluates the fiscal performances of all the GPs in the two districts. In the fifth section, we performed an econometric analysis to find out the factors responsible for the differences in the fiscal performances of the GPs. The sixth section discusses the results. The major findings have been summarised in the last section of this paper along with some policy recommendations.
The 73rd CAA and Its Implications for Fiscal Decentralisation
A three-tier Panchayat system has been introduced by the 73rd CAA at the local level, which includes the district level, block level and village level. Following the spirit of decentralisation, the Act promotes the devolution of responsibilities and tax powers from the higher level of government to the local levels. In particular, the 11th schedule specifies 29 subjects related to the delivery of public services, planning and implementation of development programs and devolution of power at the GP level. Under Article 243-G, GPs are endowed with adequate powers in order to function as a local-level government. Apart from the provision of grants-in-aid from the Consolidated Fund of the State, Article 243-H provide the powers to the GPs to levy, collect and appropriate taxes, duties, tolls and fees. Article 243-I recommends the SFC which will review the financial health of the GPs in every five years. Also, SFC will recommend measures to the state government to improve its financial position. Among the three tiers of PRIs, GPs enjoy more discretionary power as they are endowed with the power to fix the tax rates, which can potentially better their financial independence. But it has been observed that the collection of revenues from the sources allocated to the GPs is very poor resulting in poor financial health (Oommen et al. 2017; Sahasranaman 2012). So, the GPs rely on intergovernmental transfers that are mostly tied in nature. In accordance with the 73rd CAA, the West Bengal Panchayat Act has the provision for expenditure assignment by the state government to the GPs. In the case of revenue mobilisation, GPs are given the power to impose and raise taxes on land and buildings, that is, the property tax. GPs can utilise other non-tax revenue sources like water tax, fees and tolls, trade registration fees and building permission fees. The SFCs have been constituted at regular intervals and the successive SFCs have recommended higher levels of transfers to the GPs and emphasised greater mobilisation of resources from both existing and untapped revenue sources (GoWB 2016). In general, the rural local governments in West Bengal, like many other low-income countries and other Indian states, have ‘minimal expenditure responsibilities and even less revenue-raising power’ (Bahl et al. 2010).
Available empirical studies indicate the incidence of significant variations within the GPs in terms of expenditure assignment, collection of revenues and receipt of grants from the higher levels of government in West Bengal (Bahl et al. 2010; ISS 2015). Population size, percentage of people belonging to the scheduled caste/scheduled tribes (SC/ST) category, level of literacy, proportion of female population and proportion of marginal workers are some of the factors contributing towards the fiscal disparities among the GPs.
Data and Methodological Approach
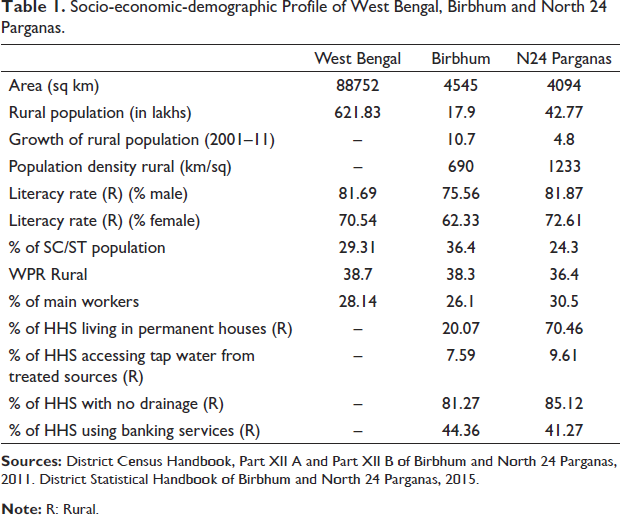
We have analysed the fiscal performances of all the GPs in two districts of West Bengal— Birbhum and North 24 Parganas, in two-time points 2015–16 and 2018–19 in terms of per capita own source revenue (PCOSR), per capita total grants (PCTGR) and per capita total expenditure (PCTE). Both the North 24 Parganas and Birbhum are distinctly different with respect to various demographic features along with contrasting geographical locations and also they possess different social and economic characteristics (Table 1). Data on GP finance are in general inadequate and often collected in a project-oriented format (Bahl et al. 2010). We have considered the GP finance data as collected from the West Bengal Panchayat and Rural Development department. Data on population, literacy rate and proportion of agricultural labours are available at the village level in the Census. Using the detailed village directory, these village-level data have been approximated to get the GP-level data. Per capita, figures are calculated using the projected populations of the GPs based on the population data from the Primary Census Abstract of 2001 and 2011. In order to calculate real PCOSR, real PCTGR and real PCTE, we have used the Net State Domestic Product (NSDP) deflator to deflate the data on GP revenues and expenditures. We collected the data on West Bengal’s NSDP at factor cost both at current prices and constant prices for 2015–16 and 2018–19 from the Reserve Bank of India’s Database on the Indian Economy (available online). The base year for these data is 2011–12. The ratio of NSDP at current to constant prices for the two above-mentioned time points is used as the deflator. Following Bahl et al. (2009), we have classified all the GPs in Birbhum and North 24 Parganas according to their population size and categorised them under four broad heads: ‘less than 15000’; ‘15001 to 20000’; ‘20001 to 25000’ and ‘greater than 25000’.
Socio-economic-demographic Profile of West Bengal, Birbhum and North 24 Parganas.
Multivariable regression models have been conducted to find out the factors responsible for disparities in PCOSR, PCTGR and PCTE across the GPs in two-time points 2015–16 and 2018–19. GPs differ in terms of their socio-economic-demographic features and location which influence their revenue-raising performances and expenditure responsibilities (Bahl et al. 2010; Oommen et al. 2017). The explanatory variables—population size, percentage of SC/ST population, literacy rate, proportion of agricultural labourers and the location of the GPs—capture these features and are, therefore, likely to be important in explaining the disparities in fiscal performances of the GPs (Table 2).
Descriptions of the Variables.
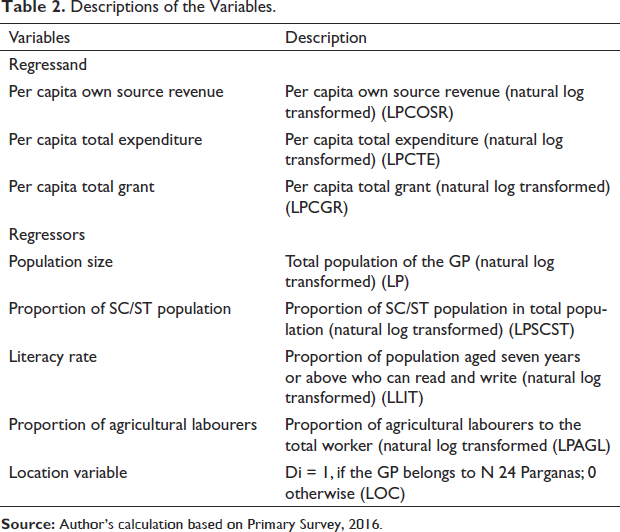
The hypothesised relationships between the dependent variable and the explanatory variables are as follows:
Fiscal Performances of All the GPs in Birbhum and North 24 Parganas
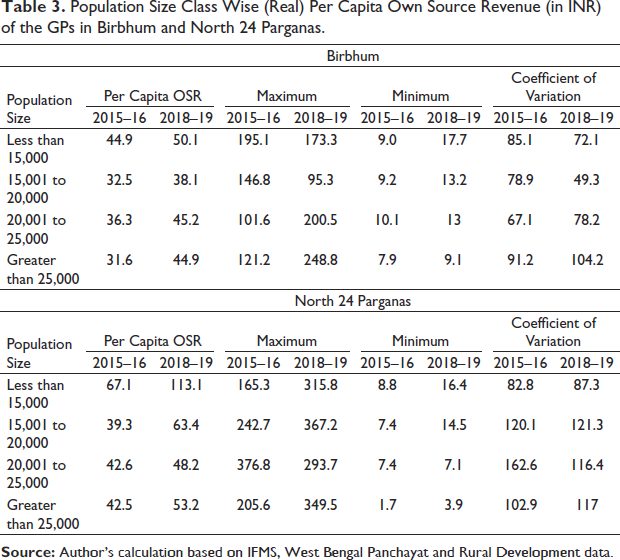
PCOSR is one of the important indicators for capturing the fiscal power and capacity of the GPs. We have calculated the population size class-wise average PCOSR for two time points 2015–16 and 2018–19 (Table 3). Three points deserve mention here. First, PCOSR generated by the GPs in two districts of West Bengal is quite low as compared to the GPs in some of the major states in India (e.g., Andhra Pradesh, Karnataka, Kerala, Tamil Nadu, Maharashtra etc.) (GoWB 2016). In Maharashtra, the GPs, on average, generated PCOSR of INR 165 during 2015–16 to 2017–18 which is considerably higher than the corresponding figures across different size class of GPs in West Bengal (Table 2). Poor revenue generation by the GPs can be attributed to disparate factors including improper evaluation and collection of tax on land and building, continuation of outdated tax rates, lack of capacity to collect revenue, lack of political willingness and motivation to utilise non-tax sources (GoWB 2016; ISS 2015). Second, the GPs with smaller populations have been able to generate higher PCOSR, on average, than their larger counterparts. In Birbhum, PCOSR, on average, ranged between INR 31.6 for GPs with a larger population to INR 44.9 for the GP with a smaller population in 2015–16 and the corresponding figures were INR 44.9 and INR 50.1 in 2018–19. Similarly, in North 24 Parganas, the smaller GPs, on average, generated PCOSR of INR 67.1 and INR 113.1 in 2015–16 and 2018–19, respectively. The larger GPs, on average, generated almost half of the PCOSR in 2018–19. This could be attributed to some of the socio-economic factors which outweighed the population effect. Third, the coefficient of variation for the PCOSR reveals disparities among the GPs in terms of their abilities to generate OSR. Such disparities seem to be higher for the GPs in Birbhum compared to the GPs in North 24 Parganas.
Population Size Class Wise (Real) Per Capita Own Source Revenue (in INR) of the GPs in Birbhum and North 24 Parganas.
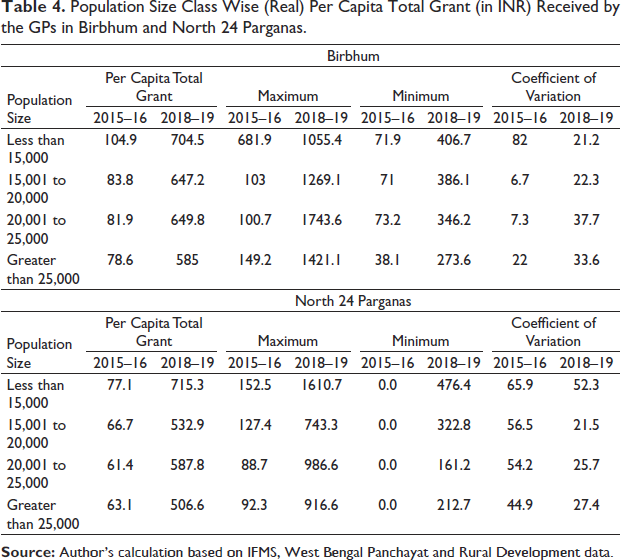
GPs in West Bengal depend heavily on intergovernmental grants to finance their expenditures. Differences in the fiscal capacities of the GPs result in fiscal imbalances among the GPs belonging to a different population size class. Table 4 indicates an increase in the average per capita grant received by the GPs over the two-time points 2015–16 and 2018–19. Such an increase is invariant to their population size. However, the GPs with smaller population sizes received higher amounts of grants from the higher levels of government. In Birbhum, the per capita total grant ranged between INR 78.6 for GP with a population greater than 25000 and INR 104.9 for GP with a population less than 10000 in 2015–16 and the corresponding figures increased to INR 585.0 and INR 704.5, respectively in 2018–19. In North 24 Parganas, the GP with a population of less than 10000 received a per capita grant of INR 77.1 in 2015–16 and this receipt increased to INR 715.3 in 2018–19. The per capita total grant receipts of GPs with greater than 25000 population were much lower at INR 63.1 in 2015–16 and INR 506.6 in 2018–19. Further, the magnitude of variations among the different size classes of GPs in Birbhum seems to be lower compared to that for the GPs in North 24 Parganas.
Population Size Class Wise (Real) Per Capita Total Grant (in INR) Received by the GPs in Birbhum and North 24 Parganas.
Overall, intergovernmental grant continues to be the most important component of financial resources of the GPs in West Bengal. GPs with smaller populations in the two districts receive higher amounts of intergovernmental grants. Higher transfer of grants from the upper level of the government to the GP with a smaller population might have increased the per capita expenditure incurred by them and resulted in betterment in the provision of services to the people. This might have encouraged the people to pay taxes. Also, higher intergovernmental transfer, in some cases, requires equal matching contributions from the GPs which might have incentivised the GPs to improve the collection of their own source revenues. So, all these might have contributed to higher PCOSRs for the smaller GPs.
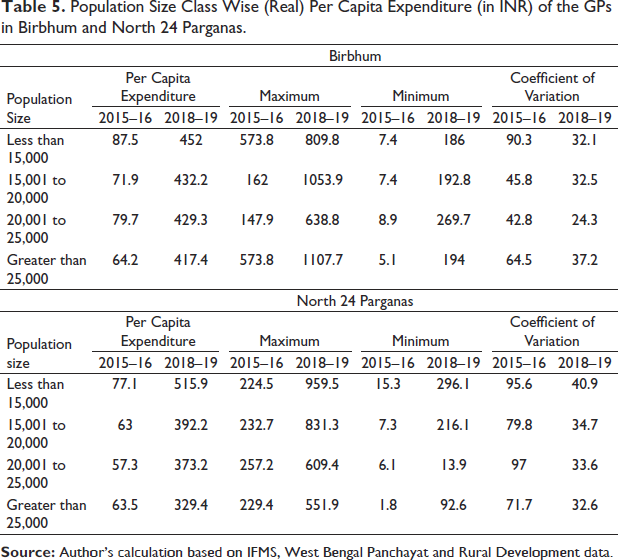
The trend and pattern of the (real) per capita expenditures indicate that the smaller GPs incurred, on average, higher per capita expenditures as compared to their larger counterparts (Table 5). The GPs in Birbhum with a population less than 15000 incurred higher per capita expenditure of INR 87.5 as against the per capita expenditures of INR 64.2 by the GPs with a population greater than 25000 in 2015–16. The corresponding figures increased to INR 452.0 and INR 417.4 in 2015–16 and 2018–19, respectively. In North 24 Parganas, the smaller GPs incurred per capita expenditures of INR 77.1 as against the corresponding figure of INR 63.5 by the larger GPs in 2015–16. These figures in 2018–19 increased to INR 515.9 and INR 329.4 for smaller and larger GPs, respectively. Incidences of higher per capita expenditures incurred by the smaller GPs could be attributed to the fixed costs expenditures of the GPs which is largely invariant to the population size. Irrespective of their size, the GPs need to incur a fixed proportion of their total expenditures on operating costs. Smaller GPs, with a lesser population but with almost the same amount of fixed expenditure as the larger ones, experience higher per capita expenditure. Also, inter-GP disparities in per capita expenditures were higher for North 24 Parganas, as evidenced from the larger values of the coefficient of variation than that of Birbhum. These results corroborate the findings in Oommen (2004), Bahl et al. (2010) and Das et al. (2021). It is important to note that the utilisation of funds at the GP level is a serious concern as the GPs in West Bengal could utilise only 60%–70% of the available funds during 2007–08 and 2012–13 (GoWB 2016).
Population Size Class Wise (Real) Per Capita Expenditure (in INR) of the GPs in Birbhum and North 24 Parganas.
Overall, our analysis indicates the incidence disparities in the fiscal performances of the GPs in two selected districts of West Bengal. Three indicators namely; (real) PCOSR, (real) PCTGR and (real) PCTE, show that smaller GPs generate greater own source revenues per person, receive higher grants per person and spend more per person. So, it is imperative to identify the factors influencing the disparities in the fiscal performances of the GPs.
Determinants of Disparities in Fiscal Performance of the GPs: An Econometric Analysis
Several factors including demographic characteristics, socio-economic characteristics and geographical locations shape the needs and priorities of the GPs and, therefore, are important for explaining the variations in their fiscal performances. In this section, we have focused on the three indicators of the fiscal performance of the GPs in two districts—North 24 Parganas and Birbhum in two-time points 2015–16 and 2018–19 and they are: PCOSR, PCTGR and PCTE.
Per Capita Own Source Revenue (PCOSR)
Table 6 presents the OLS estimates of the determinants of the disparities in PCOSR. The Breusch–Pegan test identifies the heteroscedasticity problem in the model as a result of which the heteroscedasticity-consistent estimation method has been employed. The statistical significance of the computed-F value has been used to validate the significance of the estimated model that has been used. The literacy rate has expected a positive and significant impact on PCOSR in both time points. This suggests the positive impact of economic development and greater willingness of the literate people resulting in a larger generation of revenue from own sources. The negative and significant effects of population size are contrary to our hypothesized relationships. This could be due to the economies of the size on the expenditure side by the larger GPs and their consequent lower demand as well as effort for revenue generation (Bahl et al. 2010). The negative impact of the proportion of agricultural labourers indicates that a greater proportion of people with less taxable capacity significantly reduces the revenue generation capacity of the GPs. The association between PCGR and PCOSR is significant and positive. This could be due to the requirement of larger matching contributions to the grants from the higher levels of government. Another plausible reason is that larger intergovernmental transfers might have resulted in higher local expenditure and improved delivery of services and scheme coverage. This, in turn, might have led to a better collection of revenues (both tax and non-tax) by the local people. The negative and significant impact of the location variable implies that GPs located in the Birbhum district have a higher revenue generation capacity. This could be due to the introduction of the ‘Institutional Strengthening of Gram Panchayats’ (ISGP) programme under which Birbhum was selected as one of the program districts with the provision for governance training and allocation of discretionary grants for selected GPs within the district. 1 This might have resulted in better revenue efforts by the GPs of Birbhum district.
OLS Estimation of Determinants of Variations in PCOSR of GPs.
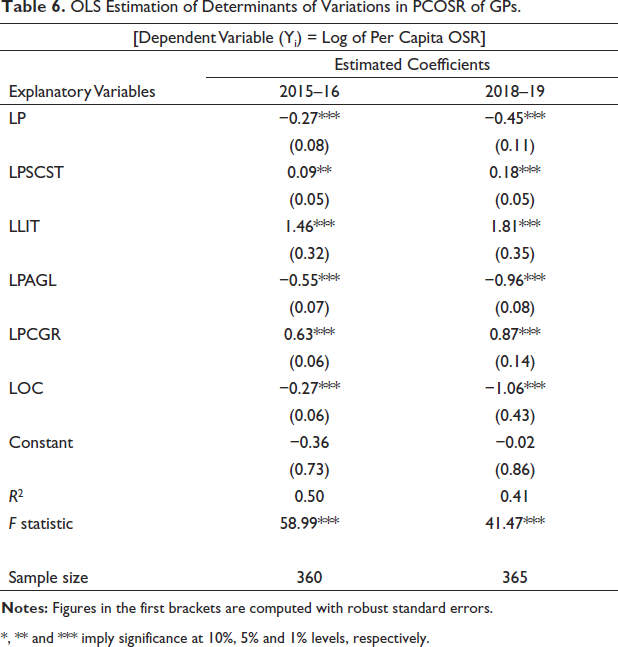
*, ** and *** imply significance at 10%, 5% and 1% levels, respectively.
Per Capita Total Grant (PCTGR)
Transfers from the central and state governments are the most important components of the total revenue of the GPs. In the earlier section, we observed variations in total grants received by the GPs in the two districts. In Table 7 we have the OLS estimates of the determinants of such variations. The Breusch–Pegan test identifies the heteroscedasticity problem and to avoid that we have employed an estimation method which is consistent with heteroscedasticity.–
OLS Estimation of Determinants of Variations in Grants Received by GPs.
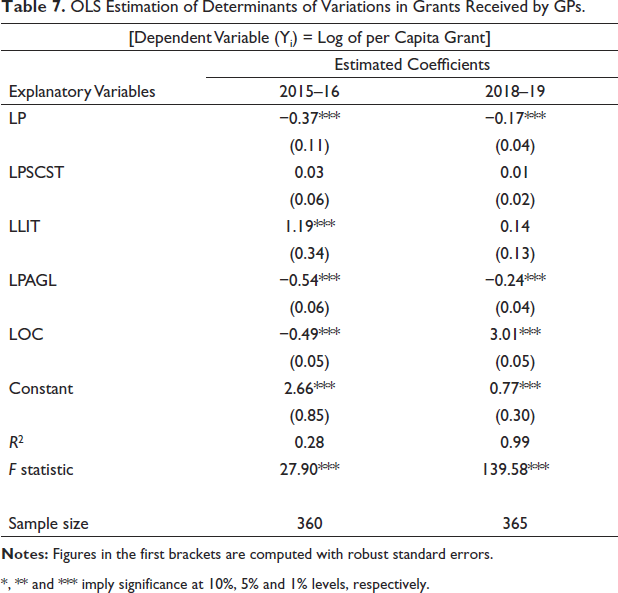
*, ** and *** imply significance at 10%, 5% and 1% levels, respectively.
To verify the significance of the model we have used the statistical significance of the computed-F value. Population size has a significant negative impact on the PCTGR for 2015–16 as well as 2018–19. This implies that the GPs with smaller populations receive higher total grants, suggesting equalising nature of the grants at the GP level. The estimated coefficients of the proportion of SC/ST cohere to the hypothetical relationship, but, are not significant statistically. The associations between literacy rate and PCTGR are positive with the same being statistically significant only in 2015–16. It is the same as the findings of Bahl et al. (2010) for rural local governments in West Bengal. The positive association might be related to the scenario that GPs with higher literacy ensures better administrative capacities and the ability to utilise the resources and, therefore, attract grant from the higher levels of government. The negative and significant coefficients of the proportion of agricultural labourers in both time points indicate that the GPs with a higher proportion of agricultural labourers receive fewer grants. This does not conform to our hypothesised relationship. Total grants received by the GPs have two components—federal grant and state grant and these two components vary in terms of their objectives and structures. Among them, federal grants turned out to be more equalising in nature (Bahl et al. 2010). Moreover, the third and fourth SFCs noted some fallacies in the formula followed for distribution. Also, after the introduction of the ISGP, the program GPs received higher discretionary grants, with the same being significantly higher in GPs having a majority of the All India Trinamool Congress elected village members (Das et al. 2021). These could be the reasons for a negative association between the proportion of agricultural labourers and PCTGR. Statistically significant coefficients of the location dummy variable and their change of signs in the two-time points also imply that management and political factors shape the disparities in PCTGR among the GPs in two districts of West Bengal in an ad hoc fashion. The Fourth SFC noted that the GPs in West Bengal cannot comprehend the mechanisms of fund flow from the higher levels of government and are unsure about their entitlements (GoWB 2016).
Per Capita Total Expenditure (PCTE)
Table 8 presents the OLS estimates of the determinants of disparities in PCTE. The Breusch–Pegan test indicates there is heteroscedasticity in the model and the heteroscedasticity-consistent estimation method has been applied to deal with the problem. To verify the significance of the model we have used the statistical significance of the computed-F value.
OLS Estimation of Determinants of Variations in Total Expenditure of GPs.
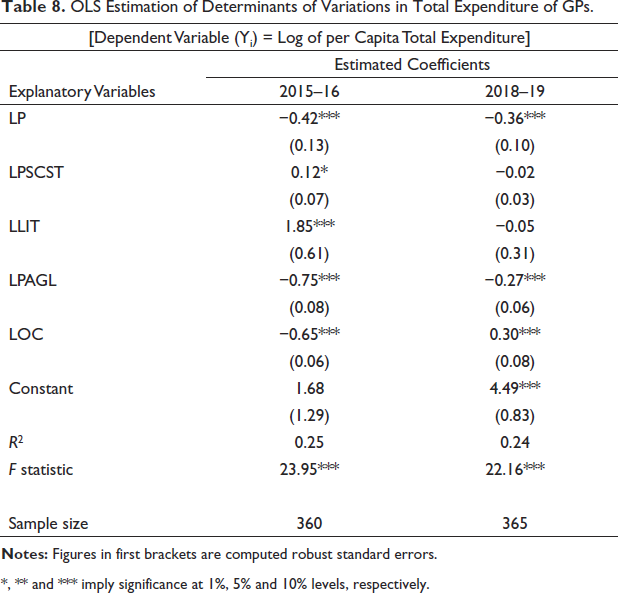
*, ** and *** imply significance at 1%, 5% and 10% levels, respectively.
Population size has a negative impact on PCTE and is significant statistically as well in both time points. This could be due to the fact that the smaller GPs are required to spend higher fixed costs for meeting administrative and salary expenditures. This raises serious concerns as these smaller GPs, in spite of incurring higher expenditures, are left with insufficient funds to spend on development purposes. This could also be due to higher transfers favouring the smaller GPs in West Bengal. A similar negative impact on the population is also noted by Oommen (2004) for GPs in Kerala. The impact of the literacy rate turns out to be positive and significant in 2015–16 and negative in 2018–19, although statistically insignificant. This is indicative of greater demand for services by the literate people and consequent higher expenditures incurred by the GPs. The association between the proportion of SC/ST and PCTE conforms to our hypothesised relationship for 2015–16. This indicates that a higher proportion of the SC/ST population results in increased levels of per capita expenditures. This result is supported by the findings of Bahl et al. (2010) for GPs in West Bengal and Rao et al. (2004) of GPs in Karnataka. However, the impact of the proportion of agricultural labourers is negative and statistically significant. This might be due to their low demand for services and consequent lower expenditure by the GPs. Lower utilisation of grants received by the GPs with a higher proportion of agricultural labourers might also contribute towards lower expenditures.
Discussion
In the context of fiscal decentralisation theory, our investigation of identifying the determinants of disparities in the fiscal performances of the GPs has crucial implications for strengthening the finances of the GPs. The lack of reliable data constrains the analysis of GP finance in India. Successive Central Finance Commissions noted this paucity of information on the GP finances and underscored the importance of the creation of a database at the local level. Moreover, available empirical studies predominantly focus on trends and patterns of fiscal outcomes, that is, revenue and expenditures of the GPs. This paper is in line with the existing body of research with the objective to describe and explain the disparities in fiscal performances of the GPs.
Within the fiscal decentralisation framework, revenue autonomy and powers of resource allocation are important preconditions for generating accountability and efficiency in local governance. Our analysis reveals low own-source revenue generation by the GPs in two districts of West Bengal which is a matter of serious concern. Moreover, with respect to the proportion of own source revenue in total revenue, GPs in West Bengal account for slightly more than 3% of total revenue; in the case of the eight other states it is 7% (GoWB 2016; Kapur 2023). 2 This is indicative of available tax space at the GP level in West Bengal. In practice, GPs have failed to fully exploit the existing revenue-raising power. In 2011–12, the GPs in West Bengal generated only INR 47.69 crores from property tax, the mainstay of OSR, as compared to the corresponding figures of INR 459.70 crores and INR 204.97 crores for Maharashtra and Karnataka, respectively. User charges contributed INR 74.65 crores of OSR for the GPs in West Bengal which was strikingly lower than the contribution of INR 301.09 crores of OSR for the GPs in Kerala in 2011–12 (GoWB 2016).
In West Bengal, property tax faces administrative bottlenecks with ad hoc assessment practices and low rates of collection (Bahl et al. 2010). Non-availability of information on the market value of the properties in rural areas provides scope for subjective assessment and corrupt practices of undervaluation (Datta 2007). Moreover, the Panchayat (Gram Panchayat Administration) Rules, 2004, contain the provision for self-declaration from the owner of land and building. However, the GPs lack capacity to verify them (GoWB 2016). The absence of any floor rate also induces the GPs to fix the tax rate at a lower level and contributes to their low revenue mobilisation (Jena and Gupta 2008). Moreover, among the non-tax sources, the GPs in West Bengal use only trade registration fees and building permission fees. The lack of procedural details on tax bases and the updation of tax rates create problems for the proper utilisation of non-tax sources (ISS 2015). Neither the Tax Collector nor the Executive Assistant at the GPs is aware of the assessment and collection of tax and non-tax revenues (GoWB 2016). In general, the weak capacity of the GPs in administering and levying the revenue instruments is a serious problem not only for the GPs in West Bengal but in other states as well (Rao and Rao 2008; Sahasranaman 2012). Proper assessment of revenue potential is crucial for improving revenue collection at the local level. Our analysis reveals that the socio-economically developed GPs with a higher proportion of literate people and a lower proportion of agricultural labourers could generate higher PCOSR. In essence, a virtuous circle would emerge where GPs increase fees and taxes and people, with better capacity and willingness, pay such taxes and fees which improves the financial autonomy of the GPs in delivering public services. In cases of clear linkages between higher tax payments and improved basic services, the revenue generation efforts would be sustainable. The usefulness of financially strong GPs is reinforced by the evidence of their better tax collection in different states of India and subsequent efforts to improve public service delivery (ISS 2015; Jena & Gupta 2008; Kapur 2023).
Given the incidence of low own-source revenue generation by the GPs, the trend of growing intergovernmental grant and expenditures signal a clear dependency syndrome. Evidence of equalising the nature of the grant and its positive impact on PCOSR is desirable for local finance. However, these outcomes have to be understood subject to some important qualifications. In West Bengal, the GPs receive funds from different sources including a share in entertainment tax and professions tax; grants transferred by the Central Finance Commission and the SFC; other transfers for implementation of CSSs under state budget heads and funds from state Line Departments and Members of Parliament Local Area Development (MPLAD) schemes. A significant portion of state grants and transfers is spent on salary components. The 14th FC and the 4th SFC recognised the importance of local-level governments disbursed 90% and 96%, respectively as untied grants (GoI 2015; GoWB 2016). The availability of performance incentive grants was conditional upon audited and reliable data on GP finance and improvement in revenue generation from their own sources. The 4th SFC recommended an additional criterion of entitlement of at least two instalments of CSSs in the last financial year. Since 2015, the Union Government Ministries imposed additional conditionalities in the form of preparing a Gram Panchayat Development Plan and emphasising it’s convergence with other CSSs for the utilisation of received funds. In 2017, the Ministry of Panchayati Raj introduced a GP ranking system on the basis of own source revenue mobilisation, status of open defecation and status of immunisation. 3 This ranking was linked to the receipt of a performance grant. No one can deny the importance of these conditionalities in operationalising village-level planning and in making the elected representatives of the GPs to be responsible, transparent and accountable to their citizens. But, implicit here is the presumption that the GPs do not know how to utilise the grant amount which, in turn, justifies the conditionalities as well as the ‘handholding’ approach (Kapur 2023). In essence, this would undermine the autonomy and flexibility of the GPs to be responsive to local needs. This is evidently contradictory to the avowed mandate of the 73rd CAA to create ‘institutions of self-government’. Moreover, the unpredictable nature of the grant is evident from transactional delays, deferments and denials by the higher levels of government; mandatory compliances with the conditionalities; shortfall in release amount relative to allocations and lack of proper incentives (Gupta and Chakraborty 2019; Rajaraman and Gupta 2016). In West Bengal, the GPs rarely had prior and correct knowledge about the allocation formula, entitlements and flow of funds (GoWB 2016). This has constrained the capacity of the GPs to plan for grant utilisation and improve public service delivery at the village level.
Conclusion
In essence, our analysis reveals the poor state of financial health and disparities in the fiscal performance of all the GPs in Birbhum and North 24 Parganas. The smaller the GPs in terms of population size, the higher the generation of own-source revenues, the higher the receipt of grants and the higher the expenditures incurred per person. Our econometric analysis identifies some of the demographic and socio-economic factors influencing such disparities in GP fiscal performances which conform with the existing empirical research on local government finance. The literacy rate plays a crucial role in determining the disparities across the GPs in both districts as they are more willing to pay taxes for improved services. On the other hand, the percentage of agricultural labour and concentration of the SC/ST population in the GPs have negative effects on their own source revenue generation. In the case of per capita grants received by the GPs, a greater proportion of the SC/ST population is associated with greater transfer from the higher levels of government coupled with receipts of special funds directed towards the backward classes and also a greater amount of expenditures on a per capita basis. Overall, the transfer of grants and the revenue generated from own sources fail to provide financial independence to the GPs. This seriously constrains their ability to act independent body of the government at the local level. The GPs in other states of India are experiencing poor revenue mobilisation and an increase in expenditure responsibilities (Oommen et al. 2017; Rao and Rao 2008; Sahasranaman 2012). Against this, the findings of this article would serve as policy inputs for strategising GP empowerment. To improve the financial scenario of the GPs, an increase in revenue from their own sources is the first crucial step. GPs should fully exploit the property tax by broadening the tax base, properly assessing the property valuation, setting the tax rate, and efficiently collecting the taxes. Equally important is the proper utilisation of non-tax sources. GPs should involve the people at each stage of the design and implementation of local tax policy processes to strengthen the linkages between local taxes and local expenditures on service delivery. Grants from the higher level of government need to be reliable and transparent. Restructuring of grants is required not to substitute but to supplement the own source revenue of the GPs. They should be provided with expenditure autonomy to match the local needs and priorities. Finally, concerted efforts should be made to create a comprehensive local finance database to track expenditure patterns and revenue-raising performances which, in turn, would lay the foundation for sound local fiscal management.
Footnotes
Declaration of Conflicting Interests
The author declared no potential conflicts of interest with respect to the research, authorship and/or publication of this article.
Funding
The author received no financial support for the research, authorship and/or publication of this article.