
Abstract
Recurrent natural disasters, the impact of economic turbulences, the COVID-19 pandemic and other factors have heightened concerns about constructing resilient systems. Supply chain weaknesses have been demonstrated in the past, encouraging the creation of preventative capabilities to retain competitiveness and respond to changes in both macro and local contexts. Examining the multiple risks presented in the culture and marketing of shrimp, as well as the measures taken by shrimp farmers to overcome the disturbances (producers of the group’s most valuable commodity), could provide insight into the current situation and aid in decision-making. Agility, distribution network structure, visibility relating producers to final consumers, communication between supply chain partners, sharing of benefits and uncertainties, global mapping and collaborative actions across supply chain partners were the drivers of supply chain resilience. Uncertainties associated with demand, supply, operational and environmental conditions were identified as supply chain vulnerability factors. The shrimp farmers maintain a balance between dependability measures and risks in the industry and continue the business, knowing that overcoming vulnerability could result in even higher susceptibilities.
Introduction
Shrimp is the most valuable source of protein traded worldwide, and farm-raised shrimp represents 55% of the world shrimp market. Shrimp culture and trade have a high return potential but come with many risks. Some of the challenges faced are climatic changes, endemic diseases, natural disasters, infections, insufficient infrastructure, overfishing and impediments to accessing advanced technologies. Resilience is key to developing the fisheries market by allowing access to affordable and healthy fish which is also safe to consume.
Resilience, a relatively recent term in ecological studies, was coined in 1973. A resilient system tolerates perturbations from within and without for a while and attains a stable state. In the face of environmental uncertainties, supply chains are also an unreliable system that suffers disruptions and volatility. Supply chain resilience theory developed from vulnerability studies undertaken in 2000–2001 to examine the economic disruptions caused by fuel protests, foot and mouth disease, terrorist attacks and other events (Christopher and Peck 2004). The frequent natural disasters, the impact of economic turbulences, the COVID-19 pandemic and other instabilities have added to the concern about building resilient systems. Design and deployment of lean management, centralised procurement techniques and other endeavours impair the firm’s ability to respond to contingencies (Tukamuhabwa et al. 2015).
It was observed that most internal decisions in the company are to overcome external threats and vulnerabilities. Several instances in the past have shown supply chain weaknesses, prompting the development of preventative capacities to maintain competitiveness and adapt to changes in both macro and micro contexts. The development of these resilient capabilities beyond a certain point leads to vulnerabilities. As a necessity, enterprises must understand vulnerability and resilience in terms of customers, firms, products and supply chains to maintain a strategic balance. Fish supply chains that deal with fresh products need to concentrate on susceptible quality standards. Shrimp trading businesses are vulnerable to a wide range of threats, so resilience capabilities must be updated regularly.
Steering to the Resilience and Vulnerability in Shrimp Farming: Research Gap and Objectives
The implementation of resilient strategies in various sectors was prompted by accidents, disasters and external changes. Changing environmental conditions and restrictions due to the COVID-19 pandemic imposed disturbance in almost all sectors. A significant paucity was found in reporting the insufficiencies in the production and supply of fast-moving consumer durables and the measures to overcome them. Recent turbulences have brought the development of competitive strategies. There has been much research on vulnerabilities and resilience of the supply chain, but few researchers (Blackhurst et al. 2018; Burgos and Ivanov 2021; Gu et al. 2021; Mandal and Sarathy 2018; Zhang et al. 2021) have emphasised vulnerability and resilience together. Therefore, an empirical study was conducted in the food industry relating the system’s vulnerability to resilience capabilities. This research develops approaches to create a balance between supply chain resilience and supply chain vulnerabilities.
Regression analysis in a study regarding the logistics of products with short shelf life revealed that supply chain capabilities have a positive impact on supply chain resilience. In contrast, supply chain vulnerabilities hurt supply chain resilience (Aigbogun et al. 2016). Kerala is blessed with enormous resources, although the fisheries sector accounts for only approximately 1% (constant prices) of the state’s gross state value-added. The aquaculture business in the state has grown slowly despite vast resources and a demanding market. An analysis of the numerous hazards associated with this sector and the steps implemented by shrimp farmers may provide insight into the current situation and aid decision-making.
This research is focused on identifying the contributing elements that fetch a balance between resilience and vulnerabilities in the supply chain of harvested shrimp from the state of Kerala. The state’s shrimp farming and sales activities have declined due to changes in the micro–macro environment. As part of supply chain strategies, it is vital to address this question: What can be done to balance shrimp supply chain resilience and vulnerability?
This study seeks the following objectives: (i) To identify the factors that ensure shrimp supply chain resilience. (ii) To assess the vulnerabilities faced in the supply chain of farmed shrimp and (iii) To establish a balance between resilience and vulnerability issues within the shrimp trade.
Literature on Resilience and Vulnerability
Vulnerability is the risk potential connected with anything, and it is defined as severe exposure to disruptions that may result from risks within and outside the supply chain (Christopher and Peck 2004). According to Peck (2005), vulnerability can be divided into three stages: information management, investing and acquiring technological breakthroughs and complex corporate relationships. Through vulnerability analysis, purchasing and sales managers could monitor supply chain issues (Blackhurst et al. 2018) beyond their immediate co-workers or risk missing out on prominent issues (Tang et al. 2009).
Numerous studies show that supply chain vulnerability is the weakness that leaves it open to disturbances (Blackhurst et al. 2018; Yaroson et al. 2021). Supply chain intensity and design determine each partner’s power, making the system dependable and vulnerable (Wagner and Bode 2006; Yaroson et al. 2021). Plant productivity, manufacturing costs and vendor development all contribute to supply chains that are longer, multi-layered, complicated, lowering transparency and increasing susceptibility (Craighead et al. 2007; Yaroson et al. 2021). For robust supply chains, resilience is required to restore service levels immediately after disruptions (Ambulkar et al. 2015; Pettit et al. 2013). ‘Adaptive capability, collaboration, trust, sustainability, risk and revenue sharing, information sharing, structure, market sensitivity, agility, visibility, risk management culture, minimising uncertainty, and technological capability identified to be antecedents of supply chain resilience’ and empirically confirmed (Jain et al. 2017). Empirical evidence about the role of collaboration and communication in incorporating supply chain resilience was gathered from Indian manufacturers and their supply chain partners (Mandal and Sarathy 2018).
Purwaningsih and Hermawan (2021) studied milkfish supply chains and identified 22 risk events. Low-quality raw materials, product defects, a lack of fresh fish and chlorine contamination were severe risks. In underdeveloped nations, traditional fish supply chains were burdened by high search costs, fluctuating demand patterns and a lack of trust. Disruptive technologies such as blockchain and satellite imagery minimised the chances of demand uncertainty, enhanced pricing strategies, improved customer trust and logistic capabilities, and minimised wastage and perishable loss. OFish, the application of Numer8 was a technological success that benefited the economic status of Indian fishers (Sengupta et al. 2021). COVID-19 highlighted vulnerability in health infrastructure, supply chain failures and poorly regulated fishing. A recent study suggested strengthening fisher networks as follows. (1) Making markets more accessible to fishers, mainly domestic and direct markets. (2) Securing the financial and other support fishers need to survive. (3) Considering environmental issues in a sustainable recovery strategy and refraining from reducing regulations to spur economic growth (Rosado et al. 2022).
Based on their review of literature related to supply chain vulnerabilities, Ekanayake et al. (2022) found that high disturbances in the system improve resilience. Blockchain adoption strengthens supply chain resilience, minimising vulnerabilities (Min 2019). The review of supply chain resilience suggested 17 indicators corresponding to supply chain management during the three phases. The nature of visibility, awareness, security, sustainability and supply chain risk management allow managers to foresee upcoming disturbances. Flexibility, redundancy, collaboration, supply chain network structure, revenue sharing and robustness are the measures to resist disruption to keep the firm operating. Managers were armed with speed, agility, public–private partnerships, flexibility, market position and information exchange to respond to and recover from the tragedy and get operations back on track (Singh et al. 2019). The need to construct a robust supply chain that ensures responsiveness, storage and capacity management, as well as demand management, was discussed (Burgos and Ivanov 2021). Resource reconfiguration and disruption orientation positively impact supply chain resilience, but supply chain robustness and agility do not seem to have such influence (Queiroz et al. 2021). Managers of cross-border e-commerce supply chains (CBECSC) must focus on strengthening resilience and determining the most effective measures to efficiently run their operations to reduce supply chain vulnerability. Strategies to improve supply chain resilience may expose the system to substantial challenges (Zhang et al. 2021).
H1: Shrimp trading’s resilience capabilities and vulnerabilities share a negative relationship.
Theoretical Concepts Concerning Resilience and Vulnerabilities
The resource-based perspective recognised the firm’s strengths and weaknesses, which illuminates the firm’s resource position while also exposing the firm’s vulnerable position. The firm’s resource position illustrates the resources it has access to, enhancing its competitive advantage. Firms develop resource management as their competitive edge over rivals (Wernerfelt 1984). ‘Firms obtain sustained competitive advantages by implementing strategies that exploit their internal strengths, responding to environmental opportunities, while neutralising external threats and avoiding internal weaknesses’ (Barney 1991).
Access to limited resources benefit businesses economically. Some of these are access to raw materials, development of skills and the formation of firm strategies. On the contrary, recognising vulnerabilities lead to the journey—towards acquiring a balanced position in the sector, learning new skills, developing new capabilities and confiscating assets that furnish the firm’s competitiveness also raises the firm’s resilience capacity. Developing dynamic capabilities enables the firm to gain a balanced competitive position that continuously changes with vulnerabilities, micro-environments and macro-environments (Teece et al. 1997).
Methodology
Factors That Contribute to Supply Chain Resilience and Vulnerability.
The study chose 107 shrimp farmers randomly (stratified random sampling) from 286 shrimp farmers (listed at
Drivers corresponding to supply chain resilience and categories of vulnerabilities were the variables considered in the study. The items corresponding to a specific variable were extracted with exploratory factor analysis. The agility measurement scale was modified from Faisal et al. (2007) (10 items), while items for supply chain visibility came from Holcomb et al. (2011) (7 items). The measurement scale for collaboration (5 items) was adopted from Simatupang and Sridharan (2005). This study adopted four measurements of information sharing and management and six measurements of network structure from Chen and Paulraj (2004). Measures of the variable: sharing risk and rewards were from Sharma and Bhat (2014) (4 items). The geographical location was estimated using statements derived (4 items) from Subhas and Sambrani (2009).
The literature categorises supply chain vulnerabilities into demand-side vulnerabilities, supply-side vulnerabilities, operational vulnerabilities and uncertainty about the external environment. The study analysed supply-side vulnerabilities, demand-side vulnerabilities and insufficiencies often occurring during supply chain operations based on items (3 + 3 + 4 items) from Wagner and Neshat (2010). Ponomarov (2012) analysed the uncertainty (6 items) in the external environment based on the scale. The primary data for the study were collected using telephonic interviews from February 2021 to July 2021, using a detailed interview schedule.
The data collected were coded on a 7-point Likert scale for analysis using IBM SPSS version 20. Based on an exploratory factor analysis, the items corresponding to supply chain resilience and supply chain vulnerability were compartmentalised. The confirmatory factor analysis performed with IBM SPSS AMOS version 23 confirmed the factors corresponding to the supply chain resilience and vulnerability constructs. Further, the balance between resilience and vulnerability in the supply chain system was justified with a regression equation.
Findings
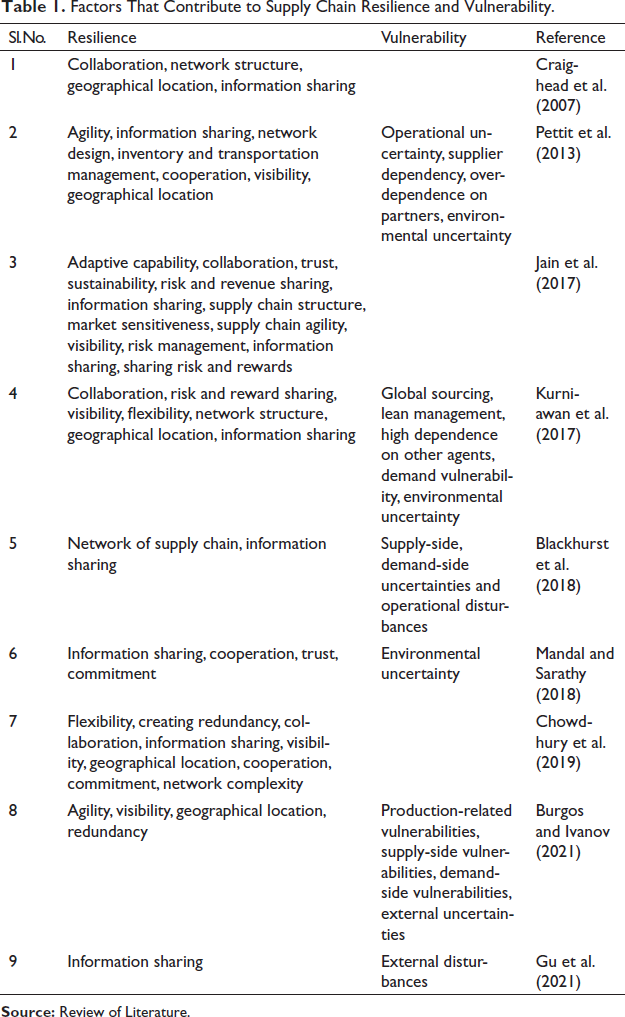
The factors corresponding to vulnerability and supply chain resilience were explored by conducting literature reviews. The respective indicators analogous to supply chain resilience and susceptibility are denoted in Table 1.
Demographic Profile of the Respondents (N = 107).
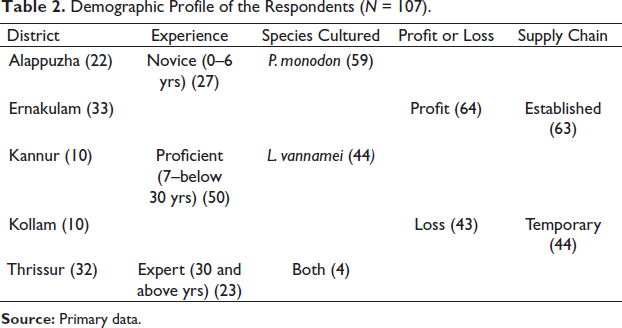
Most of the shrimp farms (60.7%) were located in Ernakulam and Thrissur districts. A fair number of respondents were experts (26.2%). Proficient farmers (46.7%) were included in the study, along with the new entrants in the sector (27.1%). Approximately 55.1% of respondents handled P. monodon, and 55.1% preferred associating with established supply chains. The difference between farmers reporting profits (59.8%) and those reporting losses (40.2%) was 20%.
Factors Influencing Supply Chain Resilience.
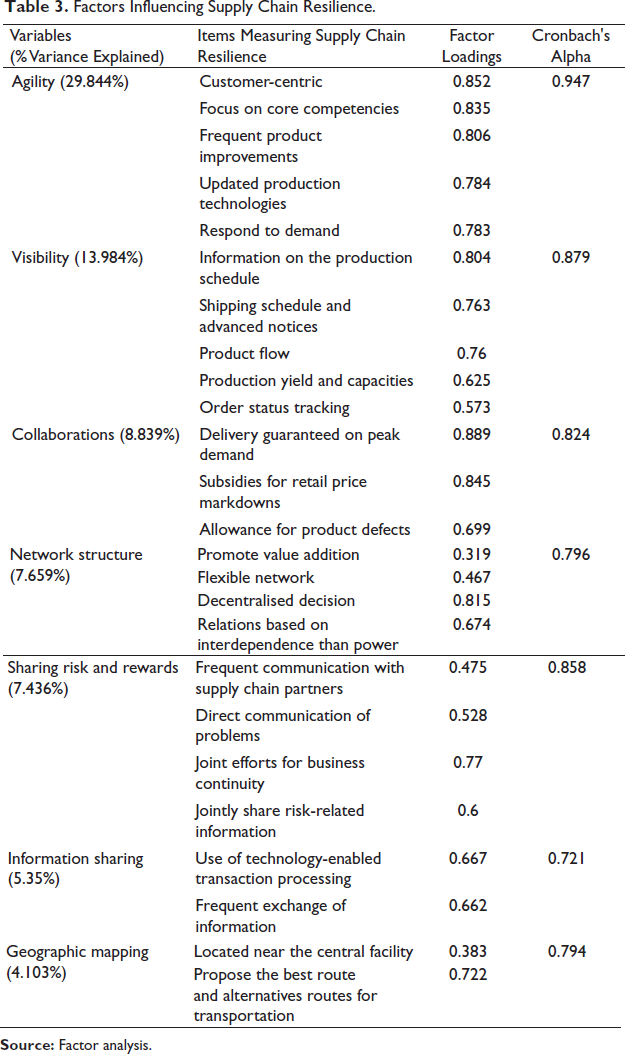
The construct formulated could explain a total of 66.747% variance. Agility and visibility of the system were measured with five items, while four items represent sharing of risks and rewards. Three items constitute collaborations, and information sharing and geographic mapping are described with two items each.
Factors Contributing to Supply Chain Vulnerability.
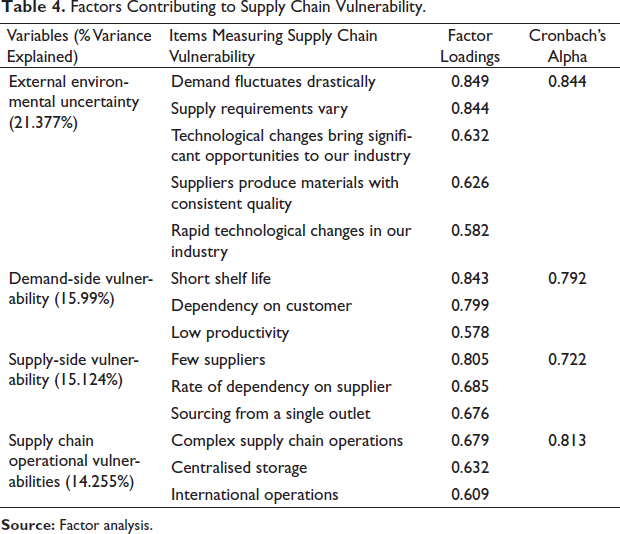
Table 4 represents the various vulnerability categories measured to the construct, supply chain vulnerability. The model explains the overall 77.215% variance. External environment uncertainty was represented by five items, while demand-side, supply-side and operational vulnerabilities were measured with three items each.
Estimates from Confirmatory Factor Analysis.
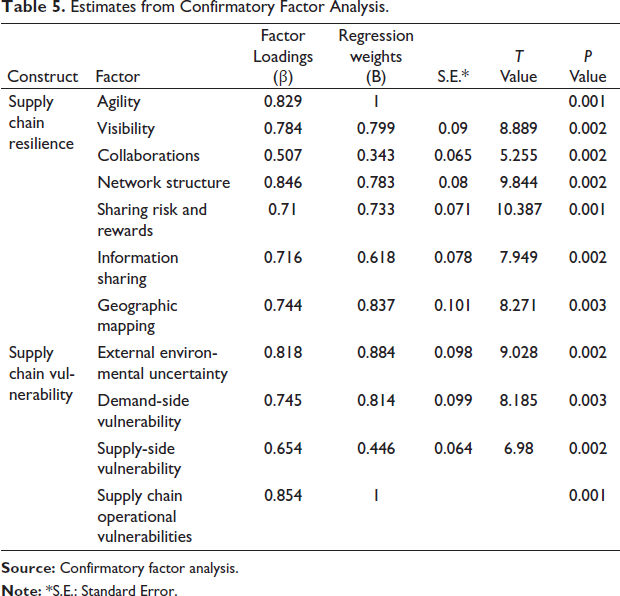
The factors determined by the literature review were found to be significantly contributing to their respective constructs. Factor loadings were above 0.5, and the average variance extracted for the supply chain resilience and supply chain vulnerability constructs were 0.549 and 0.595, respectively. The squared construct correlation between the two constructs were found to be 0.251. Fit indices corresponding to the construct supply chain resilience are, Chi-squared value = 18.422 (P value 0.103), Comparative fit index = 0.985, ‘Standardised root mean square residual (SRMR)’ = 0.033 and ‘Root Mean Square Error of Approximation (RMSEA)’ = 0.071 (P value 0.265). Similarly, fit indices of supply chain vulnerability are, Chi-squared value = 1.101 (P value 0.577), CFI = 1, SRMR = 0.013 and RMSEA = 0.000 (P value 0.653). Consequently, the data showed an acceptable fit with the proposed constructs (Hair et al. 2007: 777).
In conjunction with Table 5, these facts list the factors that contribute to the resilience and vulnerability of the shrimp harvest supply chain. The supply chain’s resilience can be attributed to its agile supply chains, network structure and visibility. In addition, the study revealed that collaboration among channel partners, sharing of risks and rewards, information sharing and geographic mapping made supply chains more resilient. It was found that operational vulnerabilities and external uncertainties often caused supply chain vulnerabilities along with the risks from the supply and demand sides.
This study examined the balance between two constructs by comparing supply chain vulnerability with resilience utilising primary data from shrimp farmers in Kerala. The inverse relationship between these two constructs led to the equation: Supply chain resilience = 3.209 − 0.462 × supply chain vulnerability, with significant constant and coefficient (both with P value = 0.000) and an R2 value of 0.216. An association between shrimp supply chain vulnerability and supply chain resilience is evidenced by F value (1,105) = 28.991 and P value = 0.000. It was inferred that supply chain vulnerability and resilience share an antagonistic connection, thereby accepting H1. The literature emphasises the need to focus on system vulnerability while designing supply chain resilience. Up to a certain point, a system can manage uncertainty and generate profits, but beyond this point, it is vulnerable to new risks.
Discussions
Several stable–unstable agents operate along with the shrimp harvest supply chain. Such CBECSC often feature complicated supply systems that deal with recurring orders for small amounts of globally traded goods. As a result of its complexity, unpredicted mishaps usually harm supply chain operations (Zhang et al. 2021).
Decentralised manufacturing units, increased inventory quantities, global vendor allocations and other factors may contribute to the risk of financial loss during product development. Additionally, a scarcity of critical resources may lead to an overextension of demand, causing the bullwhip effect (Slone et al. 2007). Consequently, supply chain managers should strike a balance between vulnerability and resilience. Empirically, some studies have confirmed the relevance of supply chain resilience and supply chain vulnerability (Chowdhury et al. 2019; Kurniawan et al. 2017). Information technology can be used as a tool to meliorate supply chain resilience and supply chain performance (Gu et al. 2021). Phases contributing to vulnerabilities in the supply chain process include employee commotion as strikes, unexpected operating mechanisms interruptions, uncertainties, transportation issues due to the global allocation of resources, etc.
The study delves into supply chain vulnerability and resilience determinants and analyses those factors. The drivers of supply chain resilience were agility, network structure, visibility, information sharing, risk and revenue sharing, geographic distribution and collaborative actions between supply chain partners. Supply chain vulnerability is classified into four types. On the supply side, quality risk, delivery risk and supplier dependency had an impact on supply chain vulnerability. Unexpected demand fluctuations and forecasting errors are the susceptibilities on the demand side (Samvedi et al. 2013). Among the operational risks are worker strikes, machine malfunctions and safety hazards in the logistic network. Natural and artificial calamities, as well as tariff policy, are the supply chain vulnerabilities of the CBECSC that correspond to environmental hazards (Zhang et al. 2021).
Specific Disclosures: Resilience Contributors and Vulnerability Drivers
The supply chain drivers relating to resilience were identified. The study listed the supply chain vulnerabilities of shrimp harvested from Kerala, and each factor was individually analysed for its presence and specificity in the supply chain. During the interviews, shrimp farmers in Kerala detailed their vulnerabilities and the resilience measures they use to survive.
Agility
Shrimp farmers revealed that they were wary of certain uncertainties and planned to improve the supply chain’s agility by implementing specific procedures during their interviews. Several situations, ranging from environmental changes to changes in market demand, impact the culture and sale of shrimp in Kerala. A significant change in climatic conditions in the state necessitated a shift in culture timings, forcing farmers to postpone the culture period until January. They relied on government subsidies, contracts and vendor relationships to stay informed about and confront input changes. System agility (5 items) averaged 22.14, indicating that it needs further improvement. The universal usage of information and communication technology (ICT) allowed buyers to contact sellers and avoid a price drop in the near market. Using ICT, they designed, harvested and sold farmed shrimp. Partial harvests were efficiently used to manage fluctuations in feed running costs for shrimp growers in the local market. The majority of farmers were concerned about disease outbreaks. As a result of regular surveillance, immediate measures such as total harvesting were taken when disease symptoms appeared.
Visibility
As a result of observations and interactions, the shrimp farming business has been recognised as expensive and risky. For this reason, few farmers attempt it. Primary data show that the dispersed nature of shrimp supply contributed to the producers only receiving 50% of the customer’s price and the consumed product’s value of 20%. It was also acknowledged that there is a lack of infrastructure, technological capabilities and high labour costs in the state. The shrimp farmers in Kerala report only limited supply chain visibility (5 items), with a mean score of 19.53. They suggest creating a reliable system backed by an efficient database to increase the system’s resilience.
Collaborative Actions (Collaboraions)
Strong horizontal or vertical cooperation is expected to build trust and information exchange between supply chain partners. In the shrimp supply chain, vertical collaboration was rare. In the study, the partnership pooled an average value of 5.40 (3 items). Vertical coordination helps to balance demand and supply. Their products have a short shelf life, necessitating alternative delivery methods using robust and rapid information transfer. The supply chains had a low level of vertical cooperation, but practical cooperation was horizontal. Through a horizontal collaboration, Ernakulam city has introduced organic farming into its shrimp supply chain in three panchayaths. Inputs, such as seedlings and feed, were transported at reduced costs due to horizontal collaboration among farmers.
Network Structure
Shrimp farming, harvesting and commercialisation follow a fragmented network structure built on trust and relationships. In the interview, shrimp farmers pointed out that these network properties make getting rid of perishable goods easier. Farmers encompass a wide range of supply chains to dispose of their harvest in alternative ways, avoiding price fluctuations caused mainly by excess product supply in a specific market. Several of them said that they sold their products after value addition. The capacity of processing plants is higher than the harvested produce, so they demand bulk production. In a few cases, farmers overcome exploitation by intermediaries. The average score of network structure (4 items) from the primary data is 15.87 (4 items). The respondents suggested creating and maintaining active channels that deliver farmed shrimp constantly.
Sharing Risk and Rewards
An analysis of primary data found that farmers share risk and revenue (4 items) with their supply chain partners only to a limit, with an average score of 19.70. Cooperation among supply chain partners is critical to the chain’s ability to absorb disruptions over time. Internal or external forces might produce instabilities, but in today’s imperious world, unanimity is required to surmount the commotion. In Kerala, shrimp farming and harvesting are seasonal, which means collaboration between partners involved in the production and sale of farmed shrimp tends to arise when stresses arise. Resilient measures and synergy minimise vulnerabilities, although such relationships are unfortunately infrequent. In interviews with farmers who retained their relationship, few said they gained access to alternatives for solving problems and managing risks.
Information Sharing
Information, in addition to materials and money, is a third flow critical to the channel’s operation, balancing supply and demand. An analysis of interview responses revealed details about the transfer of information in shrimp farming and marketing. The method of culture, strains utilised, feed and probiotics applied should be acknowledged downstream in the existing situation of the food market, where the traceability of food products is an issue. Hazard Analysis Critical Control Point (HACCP) certification ensures food safety while adding value to products, and certified organic products have a higher market value. Upstream information transfer concerning demand and other criteria was found to be less, resulting in an above-average score of 10.40 for overall information management (2 items). Training and transfer of information technology to the farmed shrimp supply chain that is backed with a capable monitoring system is the requirement of the existing system.
Geographic Mapping (Geographical Location)
A supply chain’s flawless performance is affected mainly by the location of its agents. The shrimp farmers reported uncertainty in the environment and the postponement or cancellation of manufacturing operations. Shrimp farmers’ opinions on the contribution of geographic mapping (2 items) in shaping resilience capabilities averaged 9.24. According to them, climate change has caused severe problems in shrimp cultivation and sales since 2018. Though shrimp exports began in Cochin, processing companies established branches nearby Tamil Nadu and Andhra Pradesh. The state’s seafood items were insufficient to meet demand in the local market, necessitating the import of products from other states. Due to the high labour costs and HACCP regulations, processing companies were forced to employ labourers from other states and implement pre-processing procedures within the processing plants to ensure Good Manufacturing Practices. Moreover, vehicles lack cold storage facilities, making it challenging to transport fish hygienically, as the state’s cold chain is poor.
Furthermore, the interactions forced the farmer groups to develop online platforms and farmgate sales that saved them from heavy losses after the COVID-19 lockdown. The COVID-19 lockdown led to difficulty in selling the product, leading to the development of online platforms and farmgate sales that saved farmers from heavy losses.
There are four categories of supply chain vulnerabilities: supply side, demand side, operational and environmental uncertainties.
Kerala is a small state with cyclones and a tropical rainforest climate. Recent severe changes in the state’s meteorological conditions and the regular occurrence of cyclones, heavy rains, floods, earthquakes and improper waste management have severely disrupted shrimp production and transportation. Demand and supply patterns are affected by these severe conditions. Since most waterbodies will flood, farming and other related operations will have to be put on hold until this period, from the information gathered after analysing the primary data. Uncertainty of the external environment (5 items) was represented by an average score of 19.78. Several infectious diseases ravaged the industry. The technological revolution and new opportunities have brought significant competition to the market. A combination of practical training and technology adoption could overcome these vulnerabilities.
Conversations with shrimp farmers regarding information transfer in the supply chain revealed the uncertainties faced by customers at different stages in the farmed shrimp supply chain. An imbalance is observed in the product’s shelf life and the demand for fresh products in the local market. A mean score of 9.79 represented demand-side inadequacies (3 items). The limited information transmission in shrimp supply channels makes it difficult to estimate demand. Intermediaries and processing corporations work to grab a large percentage of earnings, while farmers who contribute most of the products receive barely half of what the consumer pays. Demand-side risks are also increased by intermediaries exploiting products and insufficient storage mechanisms. As the per capita fish consumption of the state is relatively high, and production of cultivated and captured fish is low, a bullwhip effect is unlikely to occur. One must target the right market, not flood the local market, to succeed.
The type of farm determines the quality of cultured shrimp, the inputs used and the procedures to ensure freshness and sanitation throughout harvest and transportation. Several quality tests must be completed before a product gets marketed. According to the interview responses, supply-side shortfalls (3 items) averaged 14.28. Insufficiencies in the collection, transportation and procuring of resources were determined. In the state, resources for riskier operations, such as refrigerated vehicles and hygienic packaging, are scarce to ensure zero contamination. Shrimp feed manufacturers and seed nurseries enjoy monopolistic advantages, contributing to supply-side vulnerabilities. Access to local resources brings down production costs and reduces the power of suppliers by fostering entrepreneurship among suppliers.
Shrimp farmers analysed the challenges they face in producing quality shrimp per market demand (3 items), averaging 11.48. The labour and operational costs kept escalating yearly, but a proportional change in farmers’ selling prices was not observed. Floods, earthquakes and storms frequently occur in the state and cause operational difficulties. In the agriculture sector, young people leave the industry to work in other sectors, resulting in a labour shortage. There is also a scarcity of skilled workers with traditional knowledge and expertise. Lack of trust and cooperation among vertical supply chain segments contributes to the system’s complexity and diminishing competence. The COVID-19 pandemic hampered the shrimp trade. Due to the complete shutdown during harvest season, sales were also limited. The corrective actions that were implemented at the eleventh hour were only partially successful.
Conclusion
The parameters contributing to supply chain resilience and various supply chain vulnerabilities of harvested shrimp from Kerala were explored. Shrimp is considered the state’s most profitable aquaculture species. Despite the high returns, shrimp farming in the state is declining due to the considerable dangers. The farmers’ strengths and weaknesses assessment classified four risk categories: supply-side, demand-side, operational and environmental risks. An in-depth study on vulnerability and its precautionary measures led to the emergence of resilience, a return to the safe mode of overcoming the challenges encountered. Several reviews converged on seven drivers that enabled firms to be resilient in their operations. Interviewing 107 shrimp farmers regarding their supply chain resilience capabilities and the various vulnerabilities they experienced gave evidence of the negative impact of supply chain uncertainties on resilience measures. Scores corresponding to resilience capabilities and vulnerabilities experienced by the shrimp farmers were regressed to derive a significant equation.
Factors contributing to the development of supply chain resilience were agility, network structure, information sharing, geographic mapping, sharing of risk and rewards, visibility and collaboration. Various dimensions of vulnerability were demand-side vulnerabilities, supply-side vulnerabilities, operational vulnerabilities and external environmental uncertainties. Agility in the supply chain was observed as a critical factor in supply chain resilience, allowing for prompt adjustments.
The shrimp supply chain’s vulnerability is inversely related to its resilience, indicating that building a risk-proof system could ensure sustainability. Shrimp farmers bonded with one another and the supporting authorities to overcome the challenges they faced on their journeys. Relationships between them, which are maintained by advanced technology and formerly established networks, assist in keeping track of business and protecting it from market fluctuations. The supply chains that were exposed to environmental uncertainties were balanced while keeping enough visibility across the entire chain to make alternative decisions in partnership with other chain partners. Sharing risks, rewards and knowledge, among other things, aid in balancing demand–supply vulnerabilities. Recognising that overcoming vulnerability could lead to far bigger susceptibilities, they strive to strike a balance between vulnerabilities and resilience measures while continuing to operate as usual.
System vulnerabilities experienced during the manufacture and distribution of farmed products and the resilient capacities of the harvested shrimp supply chain constantly change with environmental conditions, technology adopted and resources (including humans) involved. Developing research in this sector will enhance the capabilities of supply chains to remain globally competitive.
Footnotes
Declaration of Conflicting Interests
The authors declared no potential conflicts of interest with respect to the research, authorship and/or publication of this article.
Funding
The authors received no financial support for the research, authorship and/or publication of this article.