
Abstract
Background
High altitude (HA) environments expose individuals to chronic hypoxia, which can affect cognitive function. While studies have explored cognitive deficits in lowlanders ascending to HAs, there is limited research on cognitive function among natives of HA.
Purpose
This study aimed to evaluate cognitive functions in the tribal population of Himachal Pradesh India using the Montreal Cognitive Assessment (MoCA) tool and assess the effect of high and very HAs along with age and gender variation in cognitive functions in these HA natives.
Methods
This study included 359 participants who lived at HAs. Cognitive function was assessed using MoCA. Participants were stratified by altitude (3,000–3,500 m and >3,500 m) and age group (20–40, 41–60 and >60 years). Appropriate statistical analyses were performed to determine the association of altitude, age, and sex with MoCA total and subscale scores.
Results
Significant associations were found between altitude and performance on the Naming, Attention, Delayed Recall, and Orientation subscales (p < .001, p < .001, p < .001 and p = .002, respectively). Specifically, a significant age-related decline was observed across the MoCA total score and most subscales (p < .001, Kendall’s Tau = 0.48). Gender also had a significant association with the Visuospatial/Executive and Attention subscales (p < .001 for both), with males scoring higher than females.
Conclusion
Increasing altitude was associated with lower scores on specific cognitive domains. Age is a primary factor influencing cognitive performance in high-altitude natives and is associated with lower MoCA scores. Gender differences were also observed in specific cognitive functions. These findings suggest that altitude, age, and sex play important roles in shaping the cognitive profiles of individuals living at HAs.
Introduction
High altitude (HA) environments, typically defined as elevations above 3,000 m above sea level, present physiological challenges due to reduced atmospheric pressure and low oxygen availability. 1 With increasing altitude, barometric pressure drops, reducing partial pressure of ambient oxygen (PaO2), resulting in inadequate oxygen supply for individuals in HA. 2 Chronic hypoxia exposure affects cardiovascular and respiratory systems, and neurocognitive performance. 3 Since 20%–25% O2 maintains cerebral bioenergetic function, HA hypoxia affects brain function and cognition. 4 While acute exposure effects have been studied in lowlanders with altitude sickness, long-term cognitive effects on HA natives remain poorly explored. Although research has explored acute HA hypoxia’s impact on physiological and cognitive functions, the effects of long-term HA exposure on native populations’ cognition are not well understood. 5 The brain is highly sensitive to oxygen fluctuations, and hypoxia is linked to both short-term cognitive impairment and long-term adaptation. Prolonged hypoxia exposure during HA may affect attention, executive function, memory, and processing speed.6, 7 Despite adaptive mechanisms in HA natives (Andeans, Bolivians, Tibetans), prolonged exposure may cause subtle cognitive impairments compared to those at lower altitudes.8–10 Ageing contributes to cognitive decline, but its interaction with high-altitude hypoxia remains unclear. Studies show older adults in HA exhibit lower cognitive performance than younger individuals, suggesting cumulative hypoxia effects over time. Few studies have addressed gender-based differences in cognitive performance in HA patients. 8 Though findings indicate similar cognitive challenges between genders, variations in oxygen utilisation, hormonal influences, and lifestyle factors may affect cognitive outcomes. 11 This study aims to assess cognitive function among HA natives across age groups, genders, and altitudes using the Montreal Cognitive Assessment (MoCA) tool. Objective: To assess the cognitive function of high-altitude natives using MoCA and determine altitude, age, or sex variation in cognitive functions.
Methodology
A cross-sectional study was conducted on 380 tribal population aged 20–60 years, residing at altitudes >3,000 m in Lahul Spiti, Himachal Pradesh, India. Participants were selected by stratified randomisation between age groups (20–40 years, 40–60 years, and >60 years). Group I comprised the population residing between 3,000–3,500 m, and Group II above 3,500 m. Subjects beyond 20–60 years, illiterate, having cognitive impairment, disability, psychiatric disorders, sensorial or motor function impairment, or under psychoactive medication were excluded. All participants provided informed consent.
The Hindi/English version of the MoCA test (v. 7.3), with correction by education, was used. The education level of all the participants was above 5 years. The standard +1-point correction for participants having an education of ≤12 years was applied. The MoCA assesses mild cognitive impairment (MCI) by evaluating cognitive function, short-term memory, visuospatial ability, executive function, attention, concentration, working memory, Language, Orientation to time, and place. 12 The MoCA has been validated as a highly sensitive tool for early detection of MCI in hundreds of peer-reviewed studies since 2000 and is widely used in clinical settings and research worldwide. The test took approximately 10 minutes with scores ranging from 0 to 30. Higher scores indicate better global cognitive function. The MoCA has good reliability and validity compared to the MMSE, and a score below 26 indicates cognitive impairment.13, 14
Results
Sociodemographic Distribution
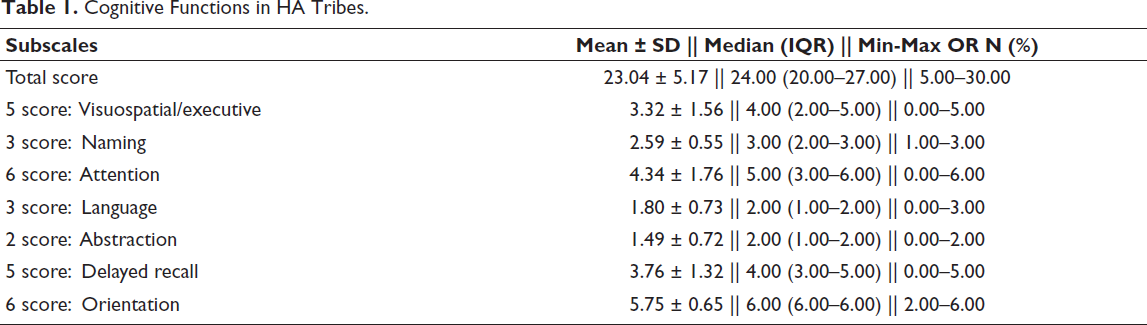
The study recruited 380 HA tribes, but 359 participants completed all subscales. The participants who were unable to complete the test were excluded. So, results were analysed of 359 participants only. In this study, 180 (50.1%) participants lived at an altitude of 3,000–3,500 m, while 179 (49.9%) were from an altitude >3,500 m. There were 120 (33.42%) tribes in the 20–40 years age group, 125 (34.81%) in the 40–60 years age group, and 114 (31.75%) in the >60 years age group. The distribution of males and females were 169 (47%) and 190 (52.92%), respectively. Cognitive Functions in HA Tribes—The skewness of all parameters ranged from −0.23 to −3.35%, indicating the data were negatively skewed and not normally distributed. The kurtosis for all variables ranged from −0.24 to −0.68, suggesting normal distribution. The Shapiro–Wilk test was significant (p < .001), indicating the data were not normally distributed. Multiple modes appeared, making all data multimodal and not normally distributed.
Visuospatial/Executive Score
The mean (SD) score was 3.32 (1.56). The median (IQR) was 4.00 (2–5). Scores ranged from 0 to 5.
Naming
The mean (SD) score was 2.59 (0.55). The median (IQR) was 3.00 (2–3). Scores ranged from 1 to 3.
Attention
Mean (SD) of score was 4.34 (1.76). The median (IQR) score was 5.00 (3–6). Scores ranged from 0 to 6.
Language
The mean (SD) score was 1.80 (0.73). The median (IQR) score was 2.00 (1–2). Scores ranged from 0 to 3.
Abstraction
The mean (SD) of the score was 1.49 (0.72). The median (IQR) score was 2.00 (1–2). The scores range from 0 to 2.
Delayed Recall
The mean (SD) of the score was 3.76 (1.32). The median (IQR) score was 4.00 (3–5). Scores ranged from 0 to 5.
Orientation
The mean (SD) score was 5.75 (0.65). The median (IQR) score was 6.00 (6–6). Scores ranged from 2 to 6.
Total score
The mean (SD) was 23.04 (5.17). The median (IQR) total score was 24.00 (20–27). The total score ranged from 5 to 30 (Table 1).
Cognitive Functions in HA Tribes.
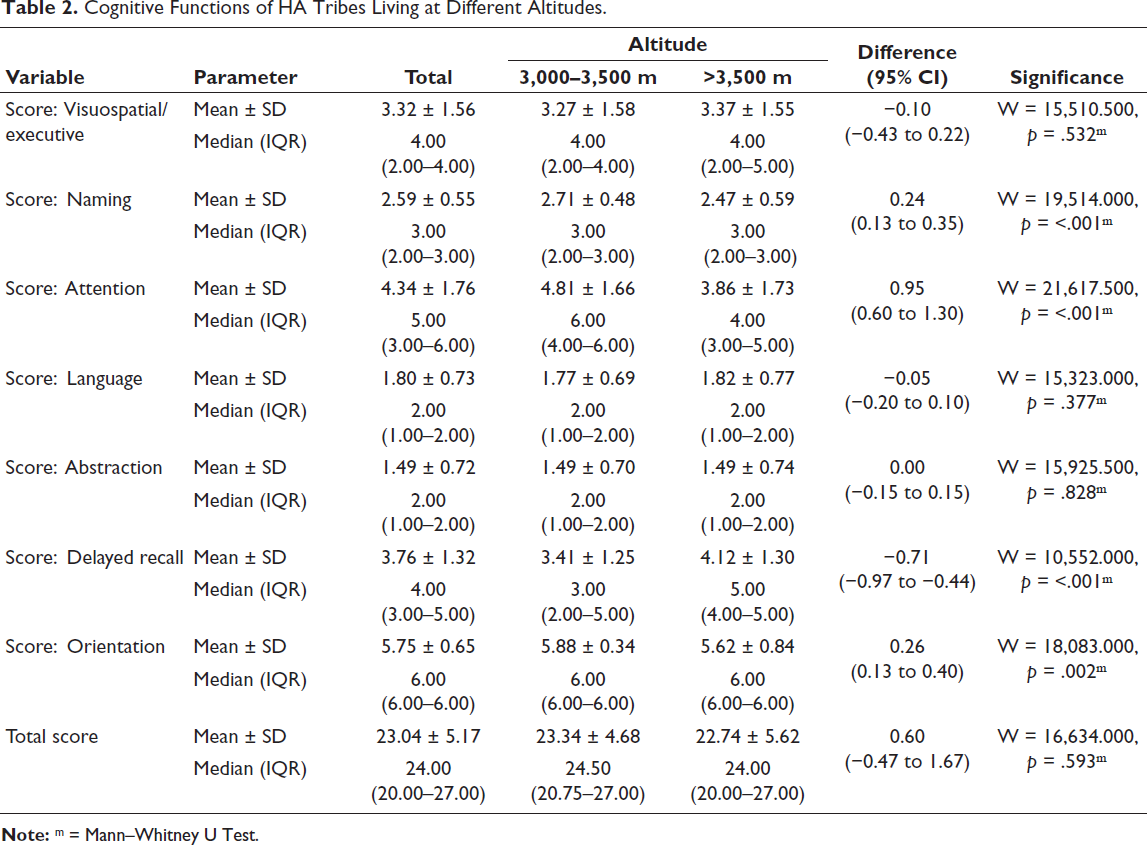
Cognitive Functions in HA Tribes Living at Different Altitudes
Dependent variable scores were not normally distributed in the two subgroups of the independent variable altitude. Thus, non-parametric tests (Wilcoxon–Mann–Whitney U Test) were used to compare the groups (Table 2).
The variable score: Visuospatial/executive—The mean (SD) of the visuospatial/executive score in the 3,000–3,500 m altitude group was 3.27 (1.58). In the >3,500 m group, it was 3.37 (1.55). The median (IQR) score in the 3,000–3,500 m group was 4 (2–4), while in the >3,500 m group it was 4 (2–5). The visuospatial/executive score ranged from 0 to 5 in both altitude groups. There was no significant difference between groups in visuospatial/executive score (W = 15,510.500, p = .532). The strength of association (Point–Biserial correlation) = 0.03 (little/no association). The variable score: Naming—The mean (SD) score: Naming in altitude: 3,000–3,500 m group was 2.71 (0.48). The mean (SD) score in altitude: >3,500 m group was 2.47 (0.59). The median (IQR) score: Naming in altitude: 3,000–3,500 m was 3 (2–3). The median (IQR) score: Naming in altitude: >3,500 m was 3 (2–3). Score: Naming ranged from 1 to 3 in both altitude groups. There was a significant difference between groups in naming score (W = 19,514.000, p < .001), with the mean score: Naming highest in altitude: 3,000–3,500 m group. Strength of association (Point–Biserial correlation) = 0.22 (small effect size). The variable score: Attention—The mean (SD) Score: Attention in the altitude: 3,000–3,500 m group was 4.81 (1.66) and in the >3,500 m group was 3.86 (1.73). The median (IQR) score: Attention in the 3,000–3,500 m group was 6 (4–6), and in the >3,500 m group was 4 (3–5). The score: Attention ranged from 0 to 6 in both groups. There was a significant difference between groups in score: Attention (W = 21,617.500, p ≤ .001), with the median being highest in the 3,000–3,500 m group. Strength of association (Point–Biserial correlation) = 0.27 (medium effect size). The variable score: Language—The mean (SD) score: Language for altitude 3,000–3,500 m was 1.77 (0.69) and for >3,500 m was 1.82 (0.77). The median (IQR) score: Language for altitude 3,000–3,500 m was 2 (1–2) and for >3,500 m was 2 (1–2). The score: Language ranged from 0 to 3 in both altitude groups. There was no significant difference between groups in language scores (W = 15,323.000, p = .377). Strength of Association (point–biserial correlation) = 0.03 (little/no). The variable score: Abstraction—The mean (SD) of score: Abstraction for altitude: 3,000–3,500 m was 1.49 (0.70) and for >3,500 m was 1.49 (0.74). The median (IQR) score: Abstraction was 2 (1–2) for both groups. The score: Abstraction ranged from 0 to 2 in both altitude groups. There was no significant difference between groups in score: Abstraction (W = 15,925.500, p = .828). Strength of association (Point–Biserial correlation) = 0 (little/no association). The variable score: Delayed recall—The mean (SD) of score: Delayed recall in the altitude: 3,000–3,500 m group was 3.41 (1.25), while in the >3,500 m group was 4.12 (1.30). The median (IQR) score for delayed recall in the altitude: 3,000–3,500 m group was 3 (2–5), while in the >3,500 m group, it was 5 (4–5). The score: Delayed recall ranged from 1 to 5 in the 3,000–3,500 m group and from 0 to 5 in the >3,500 m group. There was a significant difference between groups in score: Delayed recall (W = 10,552.000, p < .001), with the median being highest in the >3,500 m group. Strength of association (Point–Biserial correlation) = 0.27 (medium effect size). The variable score: Orientation—The mean (SD) score: Orientation in altitude: 3,000–3,500 m group was 5.88 (0.34). The mean (SD) score for orientation in altitude: >3,500 m group was 5.62 (0.84). The median (IQR) score for orientation at 3,000–3,500 m was 6 (6–6). The median (IQR) score for orientation at >3,500 m was 6 (6–6). Score: Orientation in Altitude: 3,000–3,500 m ranged from 4 to 6. Score: Orientation in Altitude: >3,500 m ranged from 2 to 6. There was a significant difference between groups in score: Orientation (W = 18,083.000, p = .002), with the mean score highest in altitude: 3,000–3,500 m. Strength of association (Point–Biserial correlation) = 0.2 (small effect size). The variable total score—The mean (SD) total score in the Altitude: 3,000–3,500 m group was 23.34 (4.68) and in the >3,500 m group was 22.74 (5.62). The median (IQR) total score in the Altitude: 3,000–3,500 m group was 24.5 (20.75–27) and in the >3,500 m group was 24 (20–27). Total scores ranged from 10 to 30 in the 3,000–3,500 m group and 5 to 30 in the >3,500 m group. There was no significant difference between groups in total score (W = 16,634.000, p = .593). Strength of Association (Point–Biserial correlation) = 0.06 (Little/No)
Cognitive Functions of HA Tribes Living at Different Altitudes.
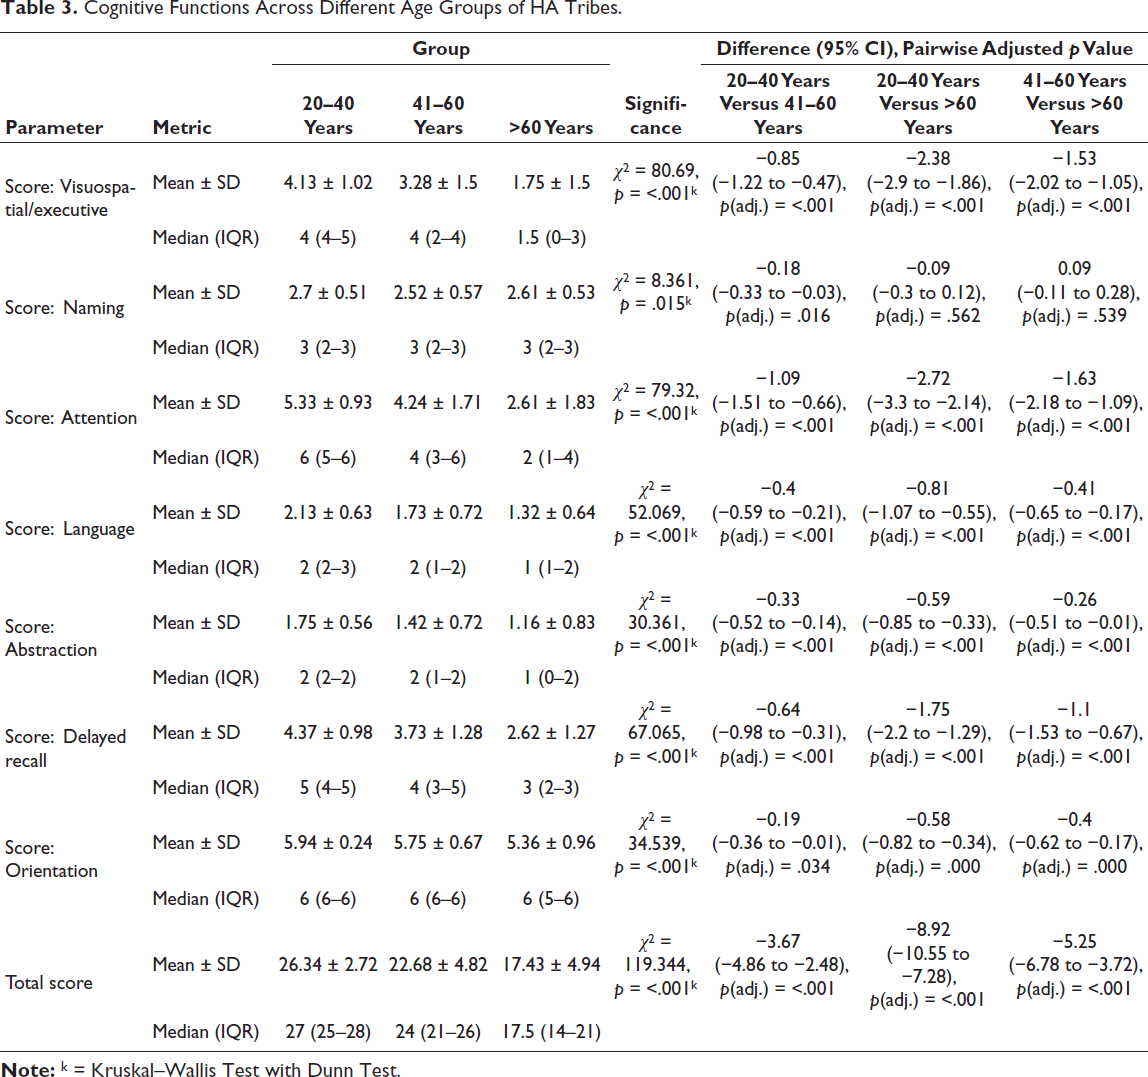
Cognitive Function Across Different Age Groups of HA Tribes
Dependent Variable scores were not normally distributed in the three subgroups of the independent variable Age Group. Thus, non-parametric tests (Kruskal–Walli’s test) were used for group comparisons (Table 3).
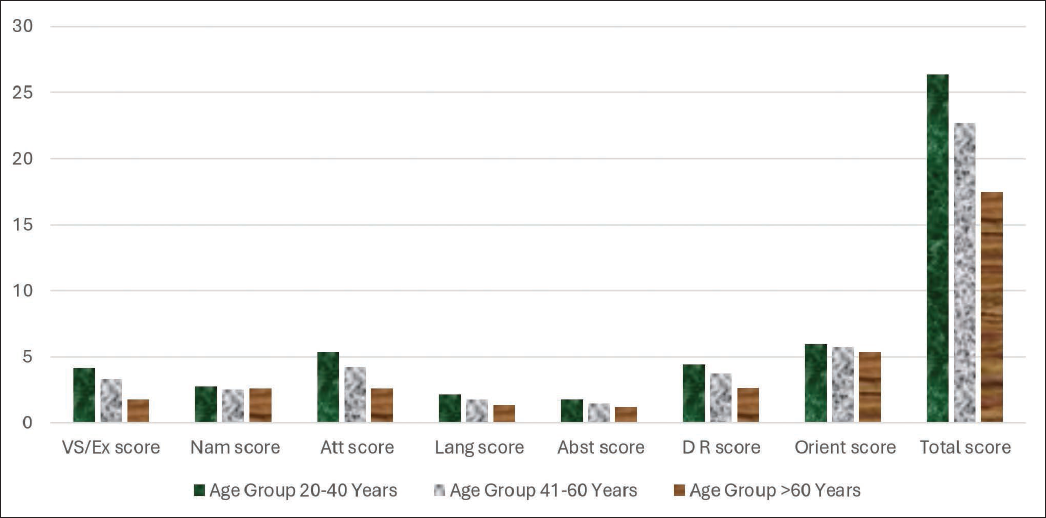
The variable score: Visuospatial/Executive—The mean (SD) of the visuospatial/executive score in the age group 20–40 years was 4.13 (1.02). For the age group 41–60 years, it was 3.28 (1.50), and for >60 years, it was 1.75 (1.50). The median (IQR) for age group 20–40 years was 4 (4–5), for 41–60 years was 4 (2–4), and for >60 years was 1.5 (0–3). The visuospatial/executive score ranged from 1 to 5 in the age group 20–40 years, and from 0 to 5 in both the 41–60 years and >60 years groups. There was a significant difference between the three groups in visuospatial/executive score (χ2 = 80.690, p ≤ .001), with the highest mean in age group 20–40 years. Strength of association (Kendall’s Tau) = 0.4 (medium). The variable score: Naming—The mean (SD) of naming score in age group 20–40 years was 2.70 (0.51). For the age group 41–60 years, it was 2.52 (0.57), and for >60 years, it was 2.61 (0.53). The median (IQR) of naming score in the age group 20–40 years was 3 (2–3). For the 41–60 age group, it was 3 (2–3), and for those over 60 years, it was 3 (2–3). The naming score ranged from 1 to 3 across all age groups. There was a significant difference between the three groups in terms of score: Naming (χ2 = 8.361, p = .015), with the mean score: Naming being highest in the age group: 20–40 years group. Strength of association (Kendall’s Tau) = 0.1 (small). The variable score: Attention—The mean (SD) score: Attention for age group 20–40 years was 5.33 (0.93). For the age group 41–60 years, it was 4.24 (1.71), and for >60 years, it was 2.61 (1.83). The median (IQR) attention score for age group 20–40 years was 6 (5–6), for 41–60 years was 4 (3–6), and for >60 years was 2 (1–4). The score: Attention ranged from 2 to 6 in the age group 20–40 years, and 0–6 in both 41–60 years and >60 years groups. There was a significant difference between the three groups in score: Attention (χ2 = 79.320, p ≤ .001), with the median being highest in age group 20–40 years. Strength of association (Kendall’s Tau) = 0.4 (Medium) The variable score: Language—The mean (SD) score: Language for age group 20–40 years was 2.13 (0.63). For the age group 41–60 years, it was 1.73 (0.72), and for >60 years it was 1.32 (0.64). The median (IQR) language score for the age group 20–40 years was 2 (2–3), for the age group 41–60 years was 2 (1–2), and for >60 years was 1 (1–2). Language scores ranged from 1 to 3 in the 20–40 years group, and 0–3 in both 41–60 years and >60 years groups. There was a significant difference between groups in score: Language (χ2 = 52.069, p ≤ .001), with the highest mean in the 20–40 years group. Strength of association (Kendall’s Tau) = 0.34 (medium). The variable score: Abstraction—The mean (SD) of score: Abstraction in the Age Group: 20–40 Years group was 1.75 (0.56). The mean (SD) score: Abstraction in the Age Group: 41–60 Years group was 1.42 (0.72). The mean (SD) score was as follows: Abstraction in the >60 years age group was 1.16 (0.83). The median (IQR) score for abstraction in the Age Group: 20–40 Years group was 2 (2–2). The median (IQR) of score: Abstraction in the Age Group: 41–60 Years group was 2 (1–2). The median (IQR) score for abstraction in the >60 years age group was 1 (0–2). The score: Abstraction in the Age Group of: 20–40 Years ranged from 0 to 2. The score: Abstraction in the Age Group of: 41–60 Years ranged from 0 to 2. The score: Abstraction in the Age Group >60 years ranged from 0 to 2. There was a significant difference between the 3 groups in terms of score: Abstraction (χ2 = 30.361, p < .001), with the mean score: Abstraction being highest in the Age Group: 20–40 Years group. Strength of Association (Kendall’s Tau) = 0.27 (small). The variable score: Delayed Recall—The mean (SD) of delayed recall in the 20–40 years group was 4.37 (0.98). The mean (SD) in the 41–60 years group was 3.73 (1.28). The mean (SD) in the >60 years group was 2.62 (1.27). The median (IQR) for delayed recall in the 20–40 years group was 5 (4–5). The median (IQR) in the 41–60 years group was 4 (3–5). The median (IQR) in the >60 years group was 3 (2–3). Delayed recall scores in the 20–40 years group ranged from 1 to 5. Scores in the 41–60 years group ranged from 0 to 5. Scores in the >60 years group ranged from 0 to 5. There was a significant difference between groups in delayed recall scores (χ2 = 67.065, p ≤ .001), with the highest median scores in the 20–40 years group. Strength of Association (Kendall’s Tau) = 0.37 (medium). The variable score: Orientation was not normally distributed across the three Age Group subgroups. Thus, non-parametric tests (Kruskal–Walli’s test) were used for comparisons. The mean (SD) score for orientation in the Age Group: 20–40 Years was 5.94 (0.24). The mean (SD) score for orientation in the Age Group: 41–60 Years was 5.75 (0.67). The mean (SD) score for orientation in the >60 years group was 5.36 (0.96). The median (IQR) score for orientation in Age Group: 20–40 Years was 6 (6–6). The median (IQR) score for orientation in Age Group: 41–60 Years was 6 (6–6). The median (IQR) score for orientation in the >60 years group was 6 (5–6). Orientation scores ranged from 5–6 in the 20–40 Years group, and 2–6 in both the 41–60 Years and >60 years groups. There was a significant difference between groups in orientation scores (χ2 = 34.539, p < .001), with the highest mean score in the age group: 20–40 years. Strength of Association (Kendall’s Tau) = 0.27 (small). The variable: Total score—The mean (SD) total score in age group 20–40 years was 26.34 (2.72). The mean (SD) total score in age group 41–60 years was 22.68 (4.82). The mean (SD) total score in >60 years was 17.43 (4.94). The median (IQR) total score in Age Group 20–40 Years was 27 (25–28). The median (IQR) total score in Age Group 41–60 Years was 24 (21–26). The median (IQR) total score in >60 Years was 17.5 (14–21). Total scores ranged from 16–30 in Age Group 20–40 Years, 5–30 in Age Group 41–60 Years, and 5–27 in >60 Years. There was a significant difference between groups in total score (χ2 = 119.344, p ≤ .001), with the highest median score in age group 20–40 years. Strength of association (Kendall’s Tau) = 0.48 (medium).
Cognitive Functions Across Different Age Groups of HA Tribes.
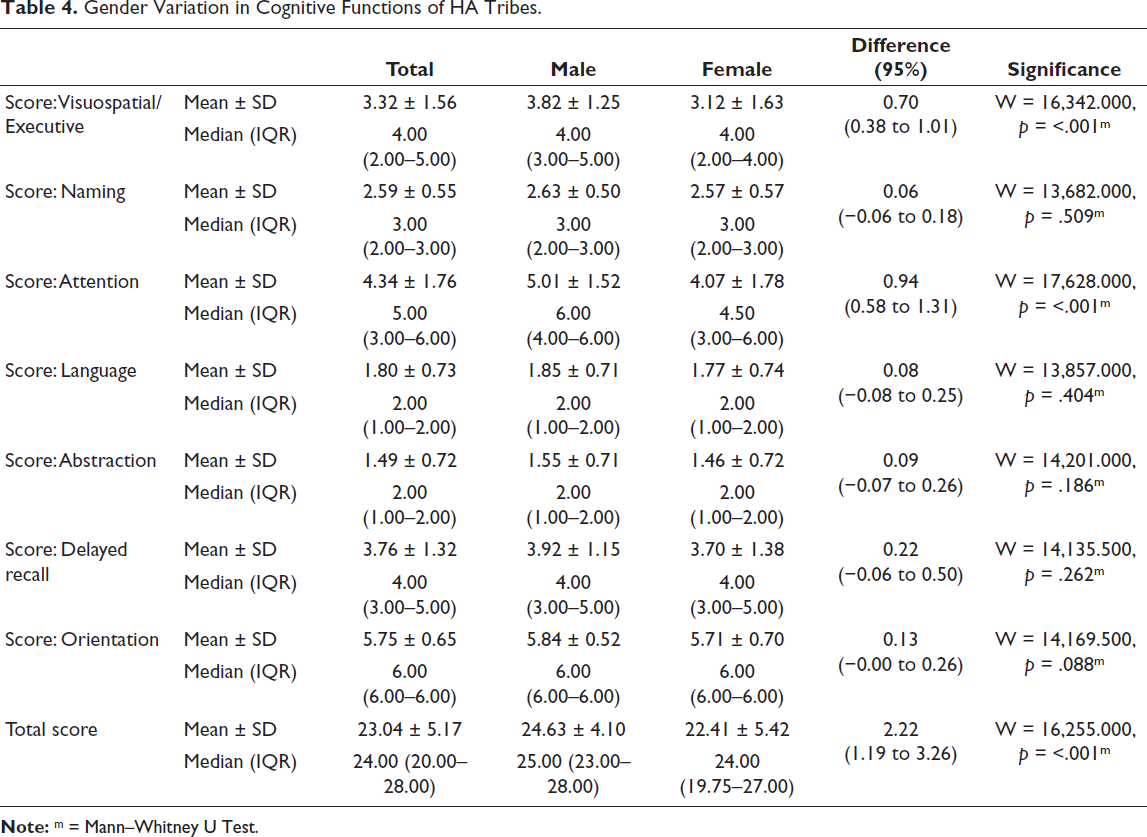
Gender Variation in Cognitive Functions of HA Tribes
Dependent Variable scores were not normally distributed in the two subgroups of the independent variable sex. Thus, non-parametric tests (Wilcoxon–Mann–Whitney U Test) were used to compare the groups (Table 4).
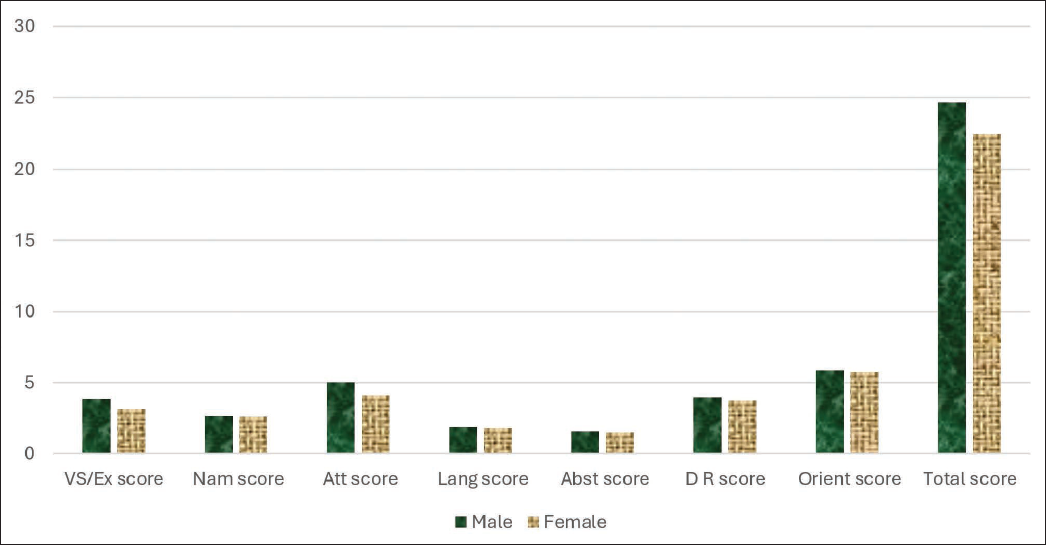
The variable score: Visuospatial/Executive—The mean (SD) of score: Visuospatial/executive in the gender: Male group was 3.82 (1.25). The mean (SD) score was as follows: Visuospatial/executive in the gender: female group was 3.12 (1.63). The median (IQR) of score: Visuospatial/executive in the gender: Male group was 4 (3–5). The median (IQR) of score: Visuospatial/executive in the gender: Female group was 4 (2–4). The score: Visuospatial/executive in the gender: Male ranged from 0 to 5. The score: Visuospatial/executive in the gender: Female ratio ranged from 0 to 5. There was a significant difference between the two groups in terms of score: Visuospatial/Executive (W = 16,342.000, p < .001), with the mean score: Visuospatial/Executive being highest in the male group. Strength of Association (Point–Biserial correlation) = 0.2 (small effect size). The variable score: Naming—The mean (SD) of score: Naming in the gender: Male group was 2.63 (0.50). The mean (SD) score was as follows: naming in the gender: female group was 2.57 (0.57). The median (IQR) of score: Naming in the Gender: Male group was 3 (2–3). The median (IQR) of score: Naming in the Gender: Female group was 3 (2–3). The score for naming in gender: Male ranged from 1 to 3. The score: Naming in the Gender: Female ranged from 1 to 3. There was no significant difference between the groups in terms of naming scores (W = 13,682.000, p = .509). Strength of Association (point–biserial correlation) = 0.05 (little/no). The variable score: Attention—The mean (SD) of score: Attention in the Gender: Male group was 5.01 (1.52). The mean (SD) score: Attention in the Gender: Female group was 4.07 (1.78). The median (IQR) score: Attention in the Gender: Male group was 6 (4–6). The median (IQR) score: Attention in the Gender: Female group was 4.5 (3–6). The score: Attention in the Gender: Male ranged from 1 to 6. The score: Attention in the Gender: Female ranged from 0 to 6. There was a significant difference between the two groups in terms of score: Attention (W = 17,628.000, p ≤ .001), with the median score: Attention being highest in the male gender group. Strength of Association (Point–Biserial correlation) = 0.24 (medium effect size). The variable score: Language—The mean (SD) of score: Language in the Gender: Male group was 1.85 (0.71). The mean (SD) score: Language in the Gender: Female group was 1.77 (0.74). The median (IQR) score: Language in the Gender: Male group was 2 (1–2). The median (IQR) score: Language in the Gender: Female group was 2 (1–2). The score: Language in the Gender: Male ranged from 0 to 3. The Score for Language in the Gender: Female ranged from 0 to 3. There was no significant difference between the groups in terms of language scores (W = 13,857.000, p = .404). Strength of Association (point–biserial correlation) = 0.05 (little/no). The variable score: Abstraction by gender: Male group was 1.55 (0.71)—The mean (SD) score: Abstraction in the gender: Female group was 1.46 (0.72). The median (IQR) of the score: Abstraction in the gender: Male group was 2 (1–2). The median (IQR) of score: Abstraction in the Gender: Female group was 2 (1–2). The score: Abstraction in the Gender: Male ratio ranged from 0 to 2. The Score for Abstraction in Gender: Female ranged from 0 to 2. There was no significant difference between the groups in terms of score: Abstraction (W = 14,201.000, p = .186). Strength of Association (Point–Biserial correlation) = 0.06 (little/no). The variable score: Delayed Recall—The mean (SD) of score: Delayed recall in the gender: Male group was 3.92 (1.15). The mean (SD) score: Delayed Recall in the Gender: Female group was 3.70 (1.38). The median (IQR) score: Delayed Recall in the Gender: Male group was 4 (3–5). The median (IQR) score: Delayed Recall in the Gender: Female group was 4 (3–5). The score: Delayed Recall in the Gender: Male ranged from 1 to 5. The score: Delayed Recall in the Gender: Female ranged from 0 to 5. There was no significant difference between the groups in terms of delayed recall scores (W = 14,135.500, p = .262). Strength of Association (point–biserial correlation) = 0.08 (little/no). The variable score: Orientation—The mean (SD) of the score: Orientation in the gender: Male group was 5.84 (0.52). The mean (SD) score for orientation in the gender: Female group was 5.71 (0.70). The median (IQR) score for orientation in the gender: Male group was 6 (6–6). The median (IQR) score for orientation in the gender: Female group was 6 (6–6). The score: Orientation in gender: Male ranged from 2 to 6. The score: Orientation in the gender: Female ratio ranged from 2 to 6. There was no significant difference between the groups in terms of orientation (W = 14,169.500, p = .088). Strength of association (Point–Biserial correlation) = 0.09 (little/no). The variable: Total score—The mean (SD) of the total score in the male group was 24.63 (4.10). The mean (SD) of the total score in the gender: Female group was 22.41 (5.42). The median (IQR) total score in the gender: Male group was 25 (23–28). The median (IQR) of the total score in the female group was 24 (19.75–27). The total score on gender: Male ranged from 9 to 30. The total score on gender: Female ranged from 5 to 30. There was a significant difference between the two groups in terms of total score (W = 16,255.000, p = .001), with the median total score being highest in the male gender group. Strength of Association (Point–Biserial correlation) = 0.19 (small effect size).
Gender Variation in Cognitive Functions of HA Tribes.
Discussion
Altitude-related Differences
Research on cognitive function at HAs has primarily focused on lowlanders who experience altitude sickness and the associated cognitive decline. However, HA natives have undergone genetic and physiological adaptations that may influence their cognitive performance differently.
This study found that cognitive functions are better in natives residing between an altitude of 3,000 and 3,500 m in comparison to natives residing above 3,500 m (Figure 1). This is similar to a study that reported that cognitive function worsens with increasing altitude, as prolonged hypoxia impairs memory, attention, and executive functions. 7
Cognitive Functions of HA Tribes Living at Different Altitudes.
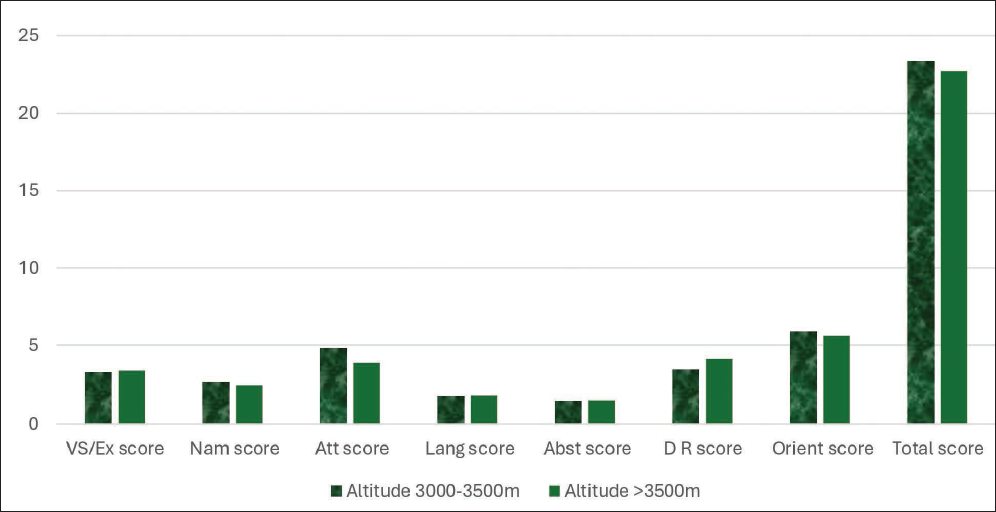
The current study found a significant association between Altitude (3,000–3,500 m vs. >3,500 m) and the Naming, Attention, Delayed Recall, and Orientation subscale scores. This suggests that even among high-altitude natives, living at very HAs (>3,500 m) might impose additional cognitive demands or lead to more pronounced subtle impairments compared to moderately HAs (3,000–3,500 m). The degree of hypoxia was more severe at >3,500 m than at 3,000–3,500 m. While natives have adapted, this increased stress may push cognitive systems closer to their functional limits. The naming, attention, delayed recall, and orientation subscales could be more susceptible to subtle neurological changes induced by more profound chronic hypoxia. 15
The literature supports that at very HAs (>3,500 m), impairments in attention, learning, and memory (including recall) are more commonly reported. 16 Chronic severe hypoxia can also lead to microstructural changes in the brain, including alterations in white matter integrity, neurotransmitter systems, and even brain volume, which may be more pronounced at higher altitudes. These changes can affect pathways involved in attention and memory networks. 17
Lack of Significant Difference in Total MoCA Score
It is important to note that this study did not find a significant difference in the Total MoCA score between the two altitude groups (p = .593). This could imply that while specific cognitive domains are affected, the overall cumulative impact might not be large enough to significantly alter the total score across these two altitude ranges, or that MoCA’s sensitivity might be limited by very subtle differences in already adapted populations. Alternatively, it could suggest that the core adaptive mechanisms function well enough to maintain overall global cognitive function, even if certain subdomains are more vulnerable.
Age-related Decline
The study found a significant difference between age groups in terms of the Total MoCA score (p < .001), with a medium effect size (Kendall’s Tau = 0.48), indicating that the 20–40 years group had the highest median score, followed by a decline in older groups (Figure 2). The significant difference in total score and scores of other subscales across age groups, with the 20–40 years group exhibiting the highest median score, is consistent with the general cognitive ageing patterns observed in both low- and high-altitude populations. This pattern of age-related cognitive decline has been consistently observed across almost all MoCA subscales (Visuospatial/Executive, Naming, Attention, Language, Abstraction, Delayed Recall, and Orientation).18, 19
Cognitive Functions Across Different Age Groups of HA Tribes.
From cohorts in Western China, a study suggested that long-term high-altitude exposure may hasten biological ageing (accelerated by 0.85–2.23 years depending on the method). While not directly measuring MoCA, accelerated biological ageing implies a more rapid decline in age-related cognitive function, thereby indirectly supporting the observed age-related decline in MoCA scores in this high-altitude population.20, 21
Decline in total MoCA score may also be called cognitive aging, which is attributed to various age-related factors affecting cognition, such as reduced brain volume, particularly in the prefrontal cortex, hippocampus, and other areas crucial for executive function and memory; decreased levels of neurotransmitters (dopamine, acetylcholine, and serotonin) affecting attention, memory, and processing speed; demyelination and axonal damage with aging; compromised vascular health; and impaired oxygen and nutrient supply to the brain. 19
While high-altitude natives adapt, chronic exposure to hypoxia may exert cumulative, subtle stress on the brain over a lifetime, potentially accelerating or exacerbating typical age-related cognitive decline. Even with physiological adaptations, the brain may operate closer to its limits, making it more vulnerable to the additional stress of ageing.2, 22 This suggests that adaptation might not completely negate the impact of environmental stressors caused by ageing.
Similar to low landers, a decline in specific subscales of cognitive function across age groups may be attributed to age-related structural and functional changes in the frontal lobe affecting visuospatial/executive functions & abstraction; demyelination and axonal damage affecting attention & delayed recall, and similar language and orientation.16, 19
Gender Variation in Visuospatial/Executive and Attention
The study showed a significant association between Gender and the visuospatial/executive and attention subscale scores (p < .001 for both), with males having a higher median total score (Figure 3).
Gender Variation in Cognitive Functions of HA Tribes.
Gender differences in cognitive performance are complex and widely studied, often influenced by a combination of biological (hormonal, brain structure) and socio-environmental factors (education and cultural roles). 23 Sex hormones (oestrogen and testosterone) are known to modulate brain structure and function, including regions involved in visuospatial processing and attention. High-altitude environments can influence hormone levels, which can differentially impact sex. 24
A recent study found that Tibetan females had poorer performance than males in digit serial accumulation and forward digit span, which are common neuropsychological measures of attention and working memory (components of the attention subscale and executive functions). This study further suggested that Tibetan female brains are more susceptible to HA, providing a biological basis for observed gender differences in cognitive performance in high-altitude environments.
25
Although less direct, gender roles, educational opportunities, and daily activities within high-altitude communities might differ between males and females, potentially influencing the development or maintenance of specific cognitive skills. For instance, if certain tasks requiring visuospatial skills or sustained attention are more prevalent in one gender’s daily life or traditional occupations, they could contribute to the observed
Vulnerability to Hypoxia-induced Stress
It is plausible that chronic hypoxia might differentially affect neural pathways or physiological responses in males and females, leading to variations in cognitive performance. One study suggested that women might be more susceptible to mood changes at HAs, which could indirectly affect their cognitive test performance. 16
Conclusion
These findings suggest that chronic HA exposure is associated with subtle cognitive decline, particularly in older adults. The gradual decline in MoCA scores with age aligns with previous research indicating a cumulative impact of hypoxia on cognitive function. The lack of significant gender differences may indicate similar physiological adaptations to hypoxia across sexes.
HA natives exhibit MCI with age-related declines in attention, executive function, and visuospatial ability. Further research is required to explore the underlying mechanisms and potential interventions for cognitive preservation in HA patients.
Limitation
As the study could not collect data from the lowlanders of Himachal Pradesh, for the comparison of functions, we need to depend on the findings of other studies that might have used other tools to assess cognitive functions.
Footnotes
Abbreviations
HA: High altitude
MoCA: Montreal cognitive assessment
PaO2: Partial pressure of ambient oxygen
O2: Oxygen
MCI: Mild cognitive impairment
MMSE: Mini-mental state examination
IQR: Interquartile range
SD: Standard deviation
CI: Confidence interval
MRI: Magnetic resonance imaging
CMO: Chief medical officer
BMO: Block medical officer
ICMR: Indian council of medical research
Acknowledgement
We acknowledge the contribution of the tribal population of the Lahul Spit for supporting the data collection. We also acknowledge the support provided by the CMO and the BMO of Lahul Spiti.
Authors’ Contributions
Punam Verma, Hitesh Jani, and Rupali Parlewar contributed to the conceptualisation, study design, and literature search. Priti Bhanderi, Ritika Thakur, and Harshali Rankhambe were involved in data collection, data arrangement, and data analysis. Bhoopendra Patel, Navdeep Ahuja, and Prashant Saini contributed to data collection and manuscript writing.
Statement of Ethics
All procedures performed in studies involving human participants were in accordance with the ethical standards of the institutional and/or national research committee and with the 1964 Helsinki Declaration and its later amendments or comparable ethical standards. The study was approved by the Institute’s Ethical Committee with the letter no. 08/21 dated 26 April 2022.
Declaration of Conflicting Interests
The authors declared no potential conflicts of interest with respect to the research, authorship and/or publication of this article.
Funding
The authors disclosed receipt of the following financial support for the research, authorship and/or publication of this article: This study received funding from the Indian Council of Medical Research (ICMR) for extramural project with project ID 2021-13364.
Patient Consent
Written informed contest was taken from all the participants of this study.