
Abstract
Background
Adversities during perinatal critical windows act as a major risk factor for several psychopathologies during adolescence and adulthood. Protein malnutrition, infections, neurotoxicant exposure and social stressors are significant adverse factors encountered by neonates born to socio-economically compromised societies.
Purpose
The purpose of this study is to understand how the cumulative exposure to multiple perinatal stressors can result in conditions that mimic various neurological disorders in affected individuals later in life. The present study aimed to understand the involvement of microglia, their activation, priming and dystrophy due to multi-hit exposure in severe spatial learning and memory impairments.
Methods
Naïve female Wistar rats (n = 32; 140–150 gm) were divided into control and low protein (LP) groups and fed with 20% and 8% protein diets, respectively, starting from 15 days prior to breeding, followed by mating with healthy males. Pups from both control and LP groups, with their respective mothers, were maintained on their respective diets throughout the experimental regime. Both control and LP F1 Pups were injected intraperitoneally either with deltamethrin (DLT; 0.7 mg/kg body weight) from postnatal day (PND) 1–7 or lipopolysaccharide (LPS; 0.3 mg/kg body weight) at PND3 then a booster on PND5 or both in combination on specified days, forming eight groups: Control, Control+DLT, Control+LPS, Control+DLT+LPS, LP, LP+LPS, LP+DLT and LP+DLT+LPS (Multi-hit). Microglial priming was studied using immunohistochemical procedures, and spatial learning and memory were estimated by the Morris water maze test in F1 rats (1, 3, 6 months).
Results
Results revealed that LP F1-treated rats were more susceptible to stressors with reduced brain weight, long-term microglial activation specifying primed states with enhanced expression of CD11b/CR3, MHC-II/OX-6 and ED2.
Conclusion
Multi-hit exposure induced dystrophic changes in a large population of microglia, causing severe learning and memory impairments, suggesting that perinatal multi-hit exposure might become a significant risk factor for developmental disorders in adulthood.
Keywords
Introduction
Perinatal period of nervous system development is vulnerable. Thus, any stress exposure during this time can potentially impact the developing brain.1, 2 Cumulative exposure to variable combinations of multiple perinatal stressors (multi-hit), namely maternal protein malnutrition, viral and bacterial infections, trauma, exposure to neurotoxins, social stressors, etc.3–5 may act in numerous ways to significantly hamper brain development and increase the incidence of neurological and neuropsychiatric illnesses among affected individuals. The hippocampus is highly susceptible to such stressors because of its extended developmental trajectory 6 and involvement in cognitive functions, and is crucial for learning and memory. Furthermore, early life exposures have been frequently linked to cause changes in brain structure, function, connections and epigenetic programming and alterations in the trajectories of brain maturation7–9 raising possibilities for neurological illnesses later in life.
The aberrant neurodevelopmental outcomes caused by exposure to early-life adversities have been recently attributed to microglial cells. 10 Microglia are the immunocompetent cells of the central nervous system (CNS) with important functional roles in immune defence and maintenance of its homeostasis. In response to any danger signals, they experience a quick morphological and functional change, secrete inflammatory mediators and produce phagocytosing inflammatory stimuli.11, 12 This phenotypic change may transform them into phagocytic and amoeboid states which enables them to migrate to damaged areas 13 and initiate a cascade of neuroinflammation by secreting a number of cytokines and chemokines. Many of the cytokines like interleukin-1β (IL-1β), tumour necrosis factor (TNF-α) and interleukin-6 (IL-6) are critically involved in the management and regulation of cognitive processes and long-term memory formation. 14 Although low/baseline cytokine levels are suggested to support long-term plasticity and learning and memory in normal physiological states, whereas persistent and elevated cytokine expression may impair memory processes 14 and lead to neurodegenerative states. 15 Furthermore, abnormal functioning of maturing microglia itself can affect their developmental processes, causing long-term consequences on their reactivity. 16
During development, microglia actively participate in pruning, modification, stability and maintenance of synapses, refinement of neural circuitry and survival of neurons.17, 18 In addition, microglia continue to shape cognitive ability by altering synaptic strength and plasticity into adulthood. 11 Mounting research demonstrates that early life stress (ELS) may impede their developmental functions by interfering with microglial developmental programmes 16 and can turn them to ‘primed states’ to respond more readily to subsequent challenges that occur later in life, leaving a lasting impression of these stressful events and undetermined consequences during adulthood.19, 20 In addition, priming essentially increases their immunological sensitivity to secondary insult and strengthens their resistance to negative or regulatory feedback.21, 22 Such primed microglia never go back to their normal states due to their resistance to regulatory feedback and may get involved in the pathogenesis of neurogenerative diseases like Alzheimer’s disease (AD), Parkinson’s disease (PD), Huntington’s, amyotrophic lateral sclerosis (ALS) and multiple sclerosis.23, 24
Nutrition is a dominant and pivotal determinant for the development of CNS. Maternal and perinatal PMN are positively correlated with changes in development, growth, functions and anatomical organisation of brain.25, 26 Maternal PMN is reported to cause impaired formation and maturation of astrocytes, 27 and oligodendrocytes, myelination 28 and promote neurodegeneration.29, 30 Additionally, numerous studies have indicated decreased synaptic connections following PMN. 31 Bacterial infection is one of the most frequent immunological challenges for neonates. A bacterial endotoxin, LPS, interacts with the toll-like receptor-4 to trigger the host’s innate immune response. Experimental studies in rats clearly indicate the long-term impacts of LPS exposure as impaired learning and memory, neuromuscular deficits, prolonged microglial activation and neuronal degeneration.32–34 Both preclinical and clinical settings have demonstrated that excessive microglial activation causes the release of a variety of pro-inflammatory molecules, namely reactive oxygen species, TNF-α, IL-1, IL-6, and nitric oxide, which are thought to cause neuronal injury and accelerate the progression of neurodegenerative diseases.35, 36
Pesticides make up about 45% of neurotoxic substances with a high global consumption 37 and a risk factor for major neurodegenerative diseases such as idiopathic PD, AD, ALS and neurodevelopmental impairments.38–40 Toxic levels of these substances may stimulate the immune system of CNS through various pathways, namely either by decreasing the activation of Nrf2 or stimulation of NF-kB or by opening the neuronal voltage-gated calcium channels. 41 DLT, a type II pyrethroid insecticide, is known to promote microglial activation and neurodegeneration by binding to distinct sodium channel sites, leading to prolonged opening of sodium channels involved in the regulation and maintenance of microglial function, finally disrupting adult hippocampal neurogenesis, leading to cognitive deficits in adults.42–44
Most studies on ELS have focused on a specific type of stressor, exposed during gestation or neonatal period. In addition, developmental windows are vulnerable to environmental changes, thus making the developmental period vulnerable to a variety of stressors, which synergistically may affect the growing brain and result in developmental abnormalities. Furthermore, the synergistic and concerted effects of a number of perinatal stressors on the developing brain are extremely difficult to evaluate and demand intense investigation. Children born to malnourished mothers themselves are more susceptible to bacterial and viral infections. Information gathered from in vitro studies, animal models and human cohorts suggests that immune dysfunction is both a cause and an outcome of malnutrition. 45 The immune defects cause modification in the immune-epigenome of the nutritionally challenged mothers, which may be inherited by the progeny, contributing to the aetiology of malnutrition in newborns. In the present study, maternal PMN is used as the first stressor, and F1 pups delivered by both healthy and malnourished mothers exposed perinatally to LPS and DLT or both together as additive stressors. The resultant multi-hit model represents the situation most comparable to that of underdeveloped and developing countries. In the current study, we aimed to ascertain the possible correlation of microgliosis and microglial dystrophy in the hippocampus and spatial memory impairments at adulthood of a multi-hit rat model of maternal PMN and perinatal exposure to LPS and DLT.
Methods
Experimental Animals
Wistar rats from the School of Studies in Neuroscience, Jiwaji University, Gwalior, were used to create a perinatal multi-hit stress model. The rats were housed in translucent polypropylene cages (3/cage; 52 × 28 × 22 cm) maintained with standard animal house facilities, such as clean and dust-free husk bedding, regulated temperature (25°C ± 2°C) and humidity (50%–65%), 12:12 h light-dark cycle, ad libitum food and clean water. Prior permission was taken for the use of animals (IAEC/JU/74; Dated: 25/01/2021), and the procedures were performed as per the guidelines of Animal Ethics Committee (IAEC) of Jiwaji University, Gwalior, MP (Registration no. 1854/GO/Re/S/16/CPCSEA). Necessary precautions were taken to reduce the number of animals used and minimise their suffering.
Experimental Design
Healthy virgin females (n = 32; body weight 140–150 gms), chosen from the breeding colony, were switched to control (n = 16, 20% protein) and LP (n = 16, 8% protein) diets for 15 days before mating. Both 20% and 8% protein diets were isocaloric 31 and procured from the National Institute of Nutrition, Hyderabad, India. Following acclimatisation to diets, the females were paired with healthy males (same strain) in a ratio of 2:1 for mating. Mating was confirmed by vaginal smear test, males were isolated, pregnant females were marked as gestation day 0 (GD 0) and were fed their respective diets throughout gestation and lactation periods. The day pups (F1) were born and were designated as postnatal day 0. Both the litter weight and size were recorded and the pups were raised in aseptic conditions with their respective mothers while being observed for any anomalies, followed by weaning at PND21. Both male and female F1 rats (equal number) were used as we did not observe any sex-related changes in post hoc analysis and average values were generated by combining data from both sexes.
Experimental Groups
As per type of stress, both control and LP F1 pups were divided into the following groups (Figure 1):
Outline of the Experimental Design, Methodology and Treatment Schedule.
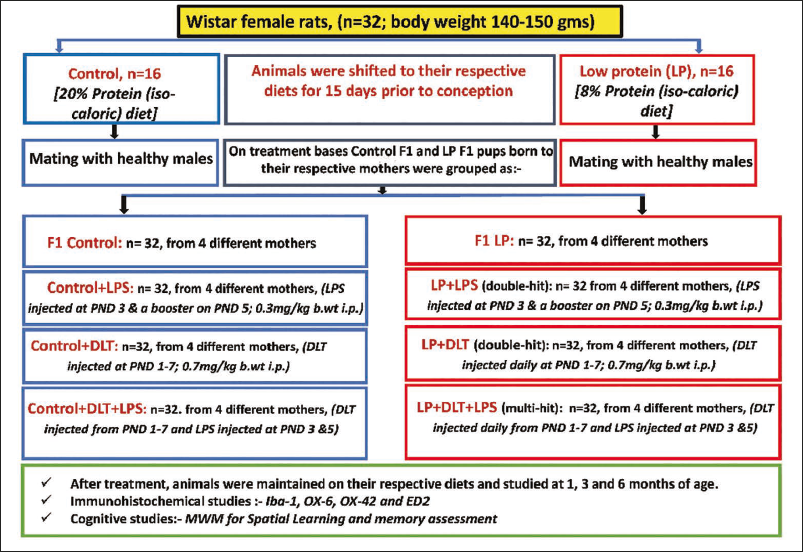
LPS (Sigma, E. coli, serotype O11:B4) was dissolved in sterilised PBS (0.3 mg/ml), while DLT (Sigma, D9315-10MG) was dissolved in dimethyl-sulphoxide (1 mg/ml). For complete absorption, both LPS and DLT were injected in low volumes under hygienic settings using Stoelting Nanoinjector and Hamilton micro-syringe and 26s-gauge needle (s-denotes inner diameter of needle) at a steady rate of 30 µl/min. No anaesthesia was used for injection; pups were gently handled, injected and promptly returned to their home cage to minimise the stress of being separated from their mothers. The pups were reared with their mothers, weaned at PND 21, and fed with their respective diets until used for immunohistochemical and cognitive studies at 1, 3 and 6 months (M) of age.
Immunocytochemical Procedures
Perfusion and Tissue Harvesting
F1 rats from different groups and age (1, 3 and 6 M; n = 6, from six separate dams/group) were anesthetised with diethyl ether, perfused transcardially with pre-chilled PBS (0.01 M, pH-7.4), followed by 2% buffered paraformaldehyde (0.01 M PB, pH-7.4) so as to preserve tissue morphology and cell structure. The whole brain was carefully dissected out and weighed. Tissues were then post-fixed in the same fixative, overnight at 4 ℃, through immersion fixation. After brief washing with PBS, tissues were immersed in sucrose gradients (10%, 20%, 30% sucrose in Phosphate buffer- PB) for cryoprotection. Coronal sections (14 µm) were cut through the occipito-temporal region by using a Leica CM1900 cryotome. Serial hippocampal sections were mounted on sequentially numbered chromalum-gelatin-coated glass slides and refrigerated at −20 ℃ for immunohistochemical studies.
Immunohistochemical Procedure for Microglial Activation Using Iba-1, OX-6 (MHC-II), OX-42 (CR3) and ED-2 Antibodies and Streptavidin Biotin-HRP (SABC) Method
The SABC method was used for localisation, cell quantification and activation of microglia as per the standardised protocol used earlier in our laboratory.33, 46
Slides containing cryocut sections (n = 6 slides/six different animals/group) through hippocampal region from all the groups and age parameters (1, 3 and 6 M) were randomly chosen, air-dried for 1 h at 37 °C and washed thrice (5 min each) with PBS for Iba-1, and tris-buffer saline (TBS, 0.05 M, pH 7.4) for OX-6, OX-42 and ED-2 immunolabelling. This was followed by membrane permeabilisation with varying concentration of triton-X 100 (Sigma) at room temperature (RT) for 20 min (1% in PBS for Iba-1, 0.1% in TBS for OX-42, 0.2% in TBS for OX-6 and ED-2). Subsequently, sections were washed (3 × 5 min each) with respective buffers, and treated with 1% hydrogen peroxide (H2O2, Merck) in PBS/TBS for 20 min for endogenous peroxidase blocking. Sections after buffer washing (3 × 5 min each) were incubated with 1% normal serum for 2 hrs at RT in PBS (Vector kit PK6101 for Iba-1) and 1% normal serum in TBS (Vector kit PK6200 for OX-6, OX-42 and ED-2) in a humid chamber for non-specific protein blocking. Sections were then incubated with primary antibodies, namely Iba-1 (1:800; Rabbit polyclonal, 019-19741, Wako, Japan) diluted in 1% bovine serum albumin (BSA) in PBST (0.5% tween-20 added to PBS); OX-6 (1:100, mouse monoclonal antibody, MCA46G, Serotec), OX-42 (1:200, mouse monoclonal antibody, MCA275G, Serotec) and ED-2 (1:100, mouse monoclonal antibody, MCA342R, Serotec) diluted in 1% BSA in TBST (0.1% tween-20 added to TBS).in a humid chamber overnight at −4 °C. Next morning, sections were normalised to RT followed by washing with respective buffers (3 × 5 min) to wash unbound primary antibody and further incubated with biotinylated secondary antibodies, anti-rabbit (1:100, Vector kit PK6101 diluted in 1% BSA in PBST) for Iba-1, anti-mouse (1:75, Vector kit PK6200, diluted in 1% BSA in TBST) for OX-6, OX-42 and ED2 for 2h at RT. After washing with PBS/TBS (3 × 5 min), sections were incubated with SABC complex (1:200, Vector kit PK6101 diluted with 1% BSA in PBST, for Iba-1; 1:150, Vector kit PK6200 diluted with 1% BSA in TBST for OX-6, OX-42 and ED-2 for 2h at RT. The sections after buffer washings were incubated with substrate solution for antigen visualisation, [0.025% 3,3′-diaminobenzidine tetrahydrochloride (DAB; Sigma) in PBS + 60 µl H2O2 (BDH- British Drug House) for Iba 1], in dark for 20 min at RT. For OX-6, OX-42, and ED-2, nickel-enhanced DAB was used for signal enhancement. After rinsing the sections with 0.05M Tris-HCl (pH 7.4), they were incubated with nickel-enhanced DAB [2.5% nickel sulphate (NiSO4.6H20; Sigma) + 0.025% DAB in Tris-HCl + 60 µl H202] for 20 min at RT. Finally, DAB reaction was terminated by immersing slides in flowing tap water, followed by rinsing in distilled water. Slides were air dried at 37 °C for 1h, dehydrated 100% alcohol (2 × 10 min), cleared in xylene (20 min) and mounted with dibutyl phthalate polystyrene and xylene, air dried and stored in cool dry place.
Image Acquisition and Quantitative Analysis of Microglia
Bright field images (20X) presenting specific structural information for a designated morphological study were captured by Leica DM6000 microscope fitted with a DFC 310FX camera and Leica application suite software (LAS V4.2). For quantification purposes Leica Laborlux microscope with digital camera (DFC 420C) and Leica application suite software (LAS V4.2) was used. Digital images (n = 30) with same magnification (20X) and frame size (21670.9 µm 2 ), were grabbed through Cornu Ammonis (CA3) region of the hippocampus (six slides/six distinct animals/time point/group). Interactive measure (IM) tool of the Leica QWin software (version 3.1) was employed for cell counting (cells/mm 2 ) and area fraction (% immunolabeled area) studies, on digitally grabbed images of Iba-1, OX-6, OX-42 and ED-2. To avoid discrepancies and erroneous results while analysing immunoreactivity, all images at all time points/groups were acquired at the same configuration settings, such as exposure duration, saturation, and digital gain parameters. The slides from all three age groups (1, 3 and 6 M) were analysed for both morphological and quantitative analysis, but because of the large data, only the microscopic representations from 1 and 6 M are given in the results.
Cognitive Studies for Memory Assessment
F1 rats (n = 12/group/time point, from distinct mothers) were assessed for spatial and memory abilities at the age of 1, 3 and 6 months.
Morris Water Maze (MWM)
To assess the spatial learning and memory abilities, MWM test was employed as per the protocol used previously in our lab.4, 29 The experimental pool used was a circular metallic tank, measuring three feet deep and six feet in diameter, painted black and half-filled with water (25 °C ± 1 °C) and spatial cues pasted along the inner surface. The data were recorded and analysed through a high-quality video camera mounted on the ceiling vertically towards the tank, in order to cover the entire tank within the camera’s field of view. The camera was connected to a computer interface loaded with ANY-maze software (Stoelting, v4.82). The test protocol comprised of two memory phases. In the first phase, rats were placed gently within the water pool at a specific location and permitted to swim freely to find the platform raised to an elevation of one inch above the water surface within 120 sec (four trails/animal/group/time point/inter-trial interval of 60 min) and the same procedure was repeated for 3 consecutive days. The rats which could not reach platform within defined time were guided manually to learn to locate the platform in a duration of 120 sec via spatial clues, following the shortest and straight path from the start point to the escape platform and kept there for 15 sec. During the second phase/final test day (4th day) the data was recorded for the rats, who reached the escape platform successfully within a duration of 120 sec and parameters like path efficiency (shortest distance travelled to locate the platform), latency (total time taken to locate the platform), percent time spent and percent number of entries in the target quadrant (south-east) were recorded (three trials/animal/group/time point). The pool was cleaned regularly and the temperature of the water and the platform position were kept constant throughout the test.
Statistical Analysis
The data are presented as mean ± standard error of mean (SEM). Standard Sigma Stat software (v14.5) was used for all statistical analyses. The data among groups were compared by One-way ANOVA (analysis of variance), and for two independent variables, that is, diet and exposure type, were analysed by two-way ANOVA, followed by post hoc Holm-Sidak test to assess the significance of difference. The p values of ≤.05 were considered significant.
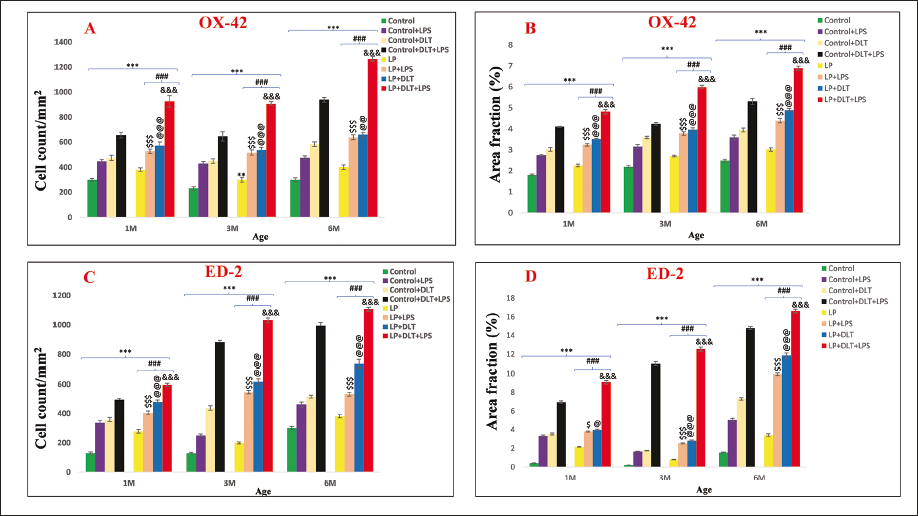
Note: *p ≤ .05, **p ≤ .01, ***p ≤ .001, for control versus treated groups.
#p ≤ .05, ##p ≤ .01 ###p ≤ .001, for LP versus treated groups.
$p ≤ .05, $$p ≤ .01, $$$p ≤ .001, for control+LPS versus LP+LPS group.
@p ≤ .05, @@p ≤ .01, @@@p ≤ .001, for control+DLT versus LP+DLT group.
&p ≤ .05, &&p ≤ .01, &&&p ≤ .001, for control+DLT+LPS versus LP+DLT+LPS group.
Results
Brain Weight
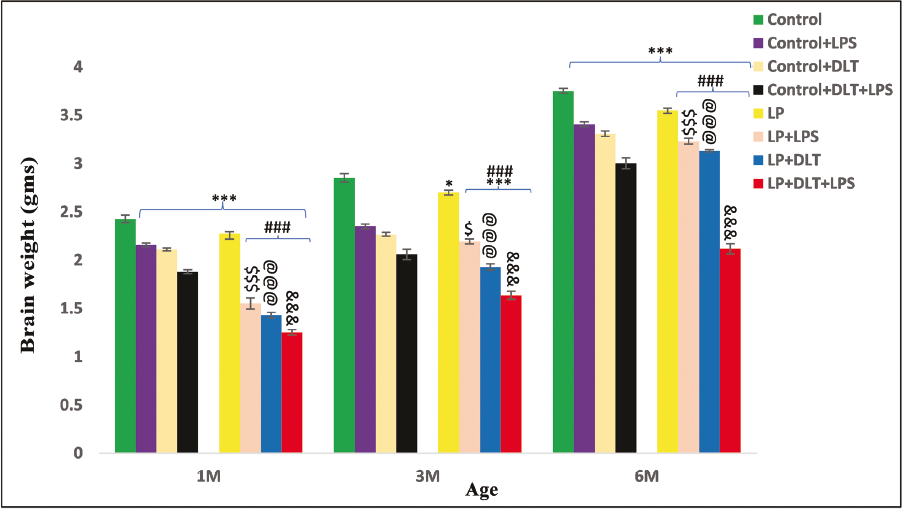
The LP rats presented a clear compromise in brain weight at all the age points (1, 3 and 6M) in contrast to the age-matched controls (Figure 2). Upon exposure to LPS or DLT or both LPS and DLT, LP multi-hit rats presented further significant reduction {control vs. LP+DLT+LPS at 1M [F(7,47) = 27.076, p ≤ .001], 3M [F(7,47) = 24.404, p ≤ .001], 6M [F(7,47) = 33.658, p ≤ .001]}. However, values were lowest in LP+DLT+LPS rats indicating a significantly high reduction in brain weight in contrast to control+DLT+LPS group rats at the age of 1M [F(1,47) = 14.479, p ≤ .001], 3M [F(1,47) = 8.491, p ≤ .001] and 6M [F(1,47) = 18.253, p ≤ .001]. Additionally, the brain weight of the LP-treated group rats remained significantly reduced in contrast to their age-matched control-exposed groups.
Impact of Singular (LPS/DLT) or Multi-hit Exposure on Brain Weight: The LP F1 Rats Revealed a Significant Reduction in Brain Weight at All the Age Points (1, 3 and 6 M) in Contrast to the Age-matched Controls. LP Rats Exposed with Either LPS or DLT (LP+LPS and LP+DLT) or Both (LP+DLT+LPS), Resulted in a Further Significant Reduction in Brain Weight in Contrast to Age-matched Controls and LP Rats, with the Lowest Values in LP+DLT+LPS Group in Contrast to Their Control-treated Rats (control+DLT+LPS). Data Is Presented as Mean ± SEM (n = 6 per group/time Point).
Long-term Microglial Priming
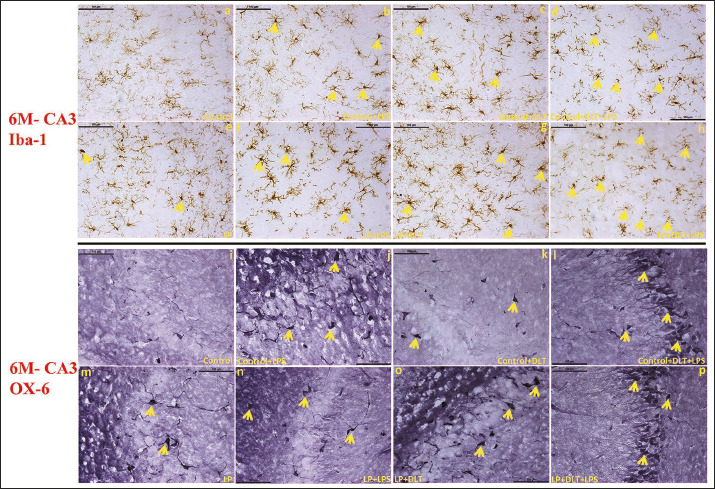
Ionised calcium-binding adaptor protein (Iba-1) is a well-established marker employed for the detection of resting, activated and dystrophic microglia. In control animals, resting microglia with small, round cell soma and ramified processes were found evenly distributed throughout the CA3 region of the hippocampus at 1 (Figure 3a) and 6M (Figure 4a) of age. While in LP F1 rats, unevenly distributed microglia with activated morphologies, round or elongated form, larger and darkly stained cell bodies, thick retracting processes, and weak ramification were predominant at 1 (Figure 3e) and 6M of age (Figure 4e). However, LP+LPS and LP+DLT groups presented increased density of highly activated microglia at 1M (Figure 3f and 3g), and a further increase by 6M, with predominance of amoeboid microglia (Figure 4f and 4g). Although few microglia with amoeboid morphology were also seen in control+LPS and control+DLT groups at 1 (Figure 3b and 3c) and 6M (Figure 4b and 4c) of age, but with lower density and level of activation. Cumulative exposure of LPS and DLT to LP rats (LP+DLT+LPS) resulted in further exaggeration in the microglia population bearing highly activated morphology with hypertrophied round/elongated/rod-shaped appearance, with thick retracted processes, and even some participating in stripping at 1M (Figure 3h) in contrast to mild activation in control+DLT+LPS group (Figure 3d). Interestingly, many of these activated microglia get switched into dystrophic states with deramified or fragmented appearance at 6M (Figure 4h), while in control+DLT+LPS group, such dystrophic microglia were limited in number at 6M (Figure 4d). This suggests long-term microglial priming leading to microglial dystrophy following multi-hit exposure during early life.
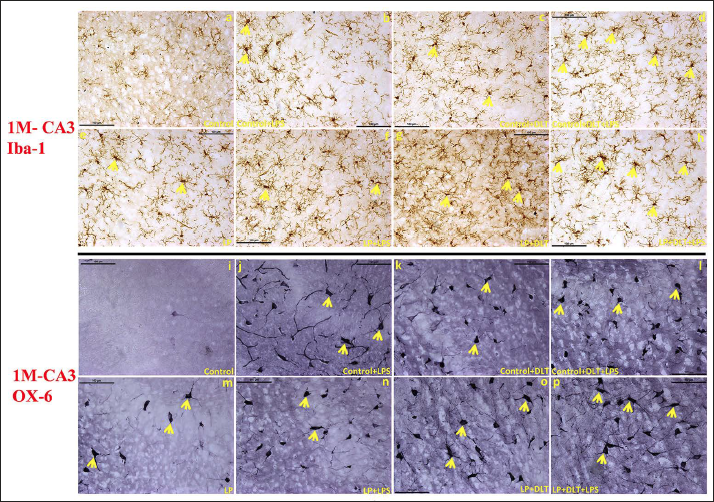
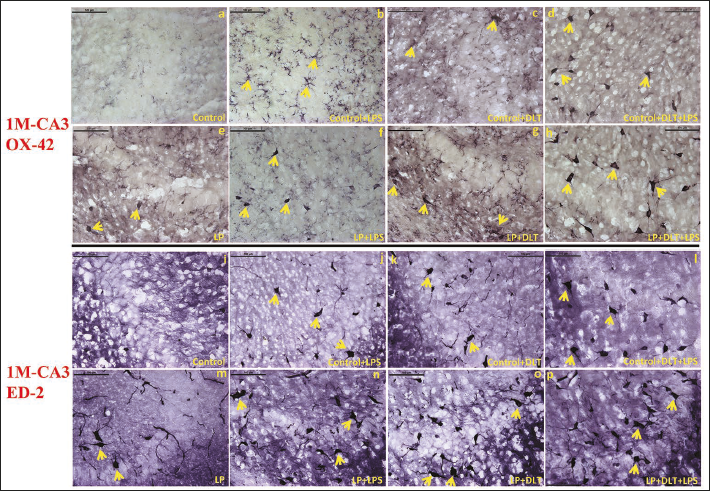
OX-6 Immunolabelling Showing MHC-II Expression Revealed Strongly Labelled Cells in LP Group Rats at 1 (3m) and 6M (Arrows) (4m) of Age, While Only a Few with Almost Negligible Immunopositivity in Age-matched Controls (3i; 4i). Following DLT or LPS Exposure to Control and LP Animals, MHC-II Protein Immunopositivity Was Heightened and the Labelled Cells Appeared Amoeboid, Oval or Round in Shapes and Typical Phagocytic Morphology (Arrows) at 1 (3j, k, n, o) and 6M (4j, k, n, o) of Age. Upon Cumulative Exposure of Both DLT and LPS to Control (Control+DLT+LPS) and LP (LP+DLT+LPS) Animals, the Number of Cells and Intensity of OX-6 Immunolabelling (Arrows) Increased Further at 1 (3l, p) and 6M (4l, p) of Age with a Higher Response in LP Multi-hit Rats.
OX-6 Immunolabelling Showing MHC-II Expression Revealed Strongly Labelled Cells in LP Group Rats at 1 (3m) and 6M (Arrows) (4m) of Age, While Only a Few with Almost Negligible Immunopositivity in Age-matched Controls (3i; 4i). Following DLT or LPS Exposure to Control and LP Animals, MHC-II Protein Immunopositivity Was Heightened and the Labelled Cells Appeared Amoeboid, Oval or Round in Shapes and Typical Phagocytic Morphology (Arrows) at 1 (3j, k, n, o) and 6M (4j, k, n, o) of Age. Upon Cumulative Exposure of Both DLT and LPS to Control (Control+DLT+LPS) and LP (LP+DLT+LPS) Animals, the Number of Cells and Intensity of OX-6 Immunolabelling (Arrows) Increased Further at 1 (3l, p) and 6M (4l, p) of Age with a Higher Response in LP Multi-hit Rats.
Quantitative data confirmed these results, showing a highly significant increase in total (Figure 5A) number of Iba 1 labelled microglia at all time points in LP multi-hit (LP+DLT+LPS) versus control multi-hit (control+DLT+LPS) group {[F(1,239) = 3.172, p = .010], [F(1,239) = 3.048, p ≤ .001], [F(1,239) = 2.718, p = .021]} and control versus LP+DLT+LPS {[F(7,239) = 20.554, p ≤ .001], [F(7,239) = 3.244, p = .011], [F(7,239) = 4.110, p ≤ .001]} groups. Similar results were observed for dystrophic microglia, with highly significant increase in LP+DLT+LPS versus control+DLT+LPS group {[F(1,239) = 8.946, p ≤ .001], [F(1,239) = 4.509, p ≤ .001] and [F(1,239) = 8.857, p ≤ .001]} and control versus LP+DLT+LPS group {[F(7,239) = 46.142, p = .003], [F(7,239) = 20.997, p ≤ .001] and [F(7,239) = 28.021, p ≤ .001]} at 1, 3 and 6M of age (Figure 5B). The low total microglia count in the LP multi-hit group seen in Figure 5A could be because of the high dystrophic microglial count shown in Figure 5B.
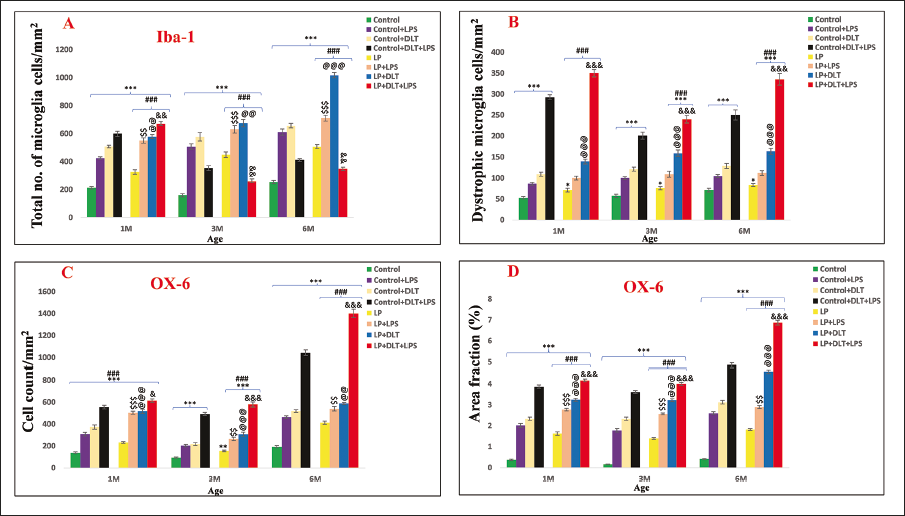
Bar Graphs Showing the Total Number of Iba-1 Positive Microglia (5A) Reveal a Significant Increase in LP and LP-treated Group Rats at All-time Points (1, 3 and 6M) in Contrast to Their Respective Control Groups. Similar to This, Number of Dystrophic Microglia Was Also Significantly High in All the LP Groups with Respect to Their Control Counterparts (5B). Significantly Increased MHC II Positive Cell Population (5C) and Area Fraction of MHC-II Immunopositivity (5D) in LP and LP Group Rats Indicated Their Susceptibility to Early Life Stressors.
MHC-II Overexpression Further Demonstrated Microglial Priming
Microglial activation and their transformation into MHC-II expressing cells assessed by OX-6 immunolabelling presented only a few labelled cells in LP groups at 1 (Figure 3m) and 6M (Figure 4m), in contrast to age-matched controls showing only a very few weakly labelled cells at (Figures 3i and 4i). Following DLT or LPS exposure to control and LP animals, MHC-II protein expression was elevated and the cells with amoeboid, oval or circular forms and peculiar phagocytic appearance were prominently seen in control+LPS, control+DLT, LP+LPS and LP+DLT groups both at 1 (Figure 3j, 3k, 3n and 3o) and 6M (Figure 4j, 4k, 4n and 4o) of age. Multi-hit exposure to control and LP rats (LP+DLT+LPS and control+DLT+LPS), resulted in further increase in MHC-II expression with a hype in both the cell number and intensity of OX-6 labelling at 1 (Figure 3l and 3p) and 6M (Figure 4l and 4p) of age with a higher response in LP multi-hit group suggesting long-term microglial activation and priming.
The quantitative data (Figure 5C and 5D) also support the above findings. All the LP groups showed a significantly increased cell count with a highest number in LP multi-hit group in contrast to control+DLT+LPS group at 1, 3 and 6 M of age {[F(1,239) = 2.835, p = .020], [F(1,239) = 4.252, p ≤ .001], [F(1,239) = 12.901, p ≤ .001]}. The values were also significantly high in LP+DLT+LPS group when compared to the normal control group rats {[F(7,239) = 28.021, p ≤ .001], [F(7,239) = 22.835 p ≤ .001], [F(7,239) = 43.440, p ≤ .001]}. Similar significant increase was found for total area fraction at 1, 3 and 6M of age: LP+DLT+LPS versus control+DLT+LPS {[F(1,239) = 2.832, p = .005], [F(1,239) = 4.500, p ≤ .001], [F(1,239) = 17.645, p ≤ .001]} and control versus LP+DLT+LPS {[F(7,239) = 36.659 p ≤ .001], [F(7,239) = 36.554, p ≤ .001], [F(7,239) = 56.759, p ≤ .001]}.
Complement Receptor 3 (CR3) Upregulation Demonstrated Microglial Priming
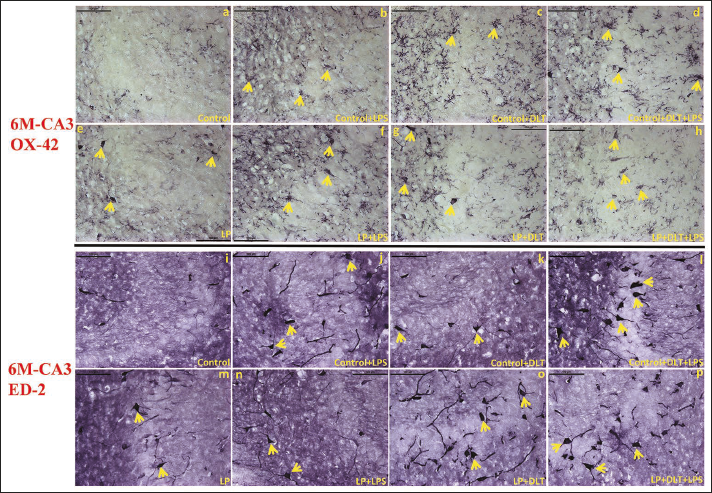
OX-42 labels CD11b, a component of CR3, expressed on the surface of microglia. In LP rats, OX-42 labelled CD11b/CR3 expressing cells were observed in large numbers at 1 (Figure 6e) and 6M (Figure 7e) of age in contrast to the control group where only a very few weakly positive cells were recorded at 1 (Figure 6a) and 6M (Figure 7a) of age. Following exposure to DLT or LPS in LP rats (LP+LPS; LP+DLT), several brightly OX-42 labelled cells with typical activated microglial morphology were seen both at 1 (Figure 6f and 6g) and 6M (Figure 7f and 7g) of age. The number of such cells increased significantly after combined exposure of DLT and LPS to LP rats (LP+DLT+LPS) at 1 (Figure 6h) and 6M (Figure 7h). Moreover, in this group, the cells were strongly labelled with thicker and retracted processes, enlarged irregular and rod-shaped cell soma resembling amoeboid microglia, suggesting chronic microgliosis. Single and multi-hit exposure to control group rats (Figures 6b–7d and 7b–7d) also resulted in CD11b/CR3 upregulation, but to a lower degree, in contrast to their respective LP groups.
Quantitative data (Figure 8A and 8B) further supported the results vide supra, with a significant increase in OX-42 labelled cells following singular or multi-hit exposure and highly significant in LP+DLT+LPS versus Control+DLT+LPS {[F(1,239) = 10.589, p = .005], [F(1,239) = 10.033, p ≤ .001], [F(1,239) = 16.174, p ≤ .001]} and control versus LP+DLT+LPS {[F(7,239) = 24.568, p ≤ .001], [F(7,239) = 26.058, p ≤ .001], [F(7,239) = 47.891, p ≤ .001]}. Increase in total area fraction was also significant in control+DLT+LPS versus LP+DLT+LPS {[F(1,239) = 7.782, p ≤ .001], [F(1,239) = 17.246, p ≤ .001], [F(1,239) = 11.068, p ≤ .001]} and control versus LP+DLT+LPS {[F(7,239) = 32.465, p ≤ .001, [F(7,239) = 37.407, p ≤ .001], [F(7,239) = 30.738, p ≤ .001]} at 1, 3 and 6 M of age.
ED-2 Immunolabeling Revealed Phagocytic Activity Following Microglial Priming
ED-2 antibody is a specific macrophage marker in rats and recognises rat CD163 cell surface glycoprotein. The number of ED-2 labelled CD163+ cells was increased in LP rats at 1 (Figure 6m) and 6M (Figure 7m) of age, in contrast to age-matched controls (Figures 6i and 7i). The number of these cells increased further in control+LPS, control+DLT, LP+LPS and LP+DLT groups and presented oval or round shapes with thicker processes, resembling phagocytic microglia at 1 (Figure 6j, 6k, 6n and 6o) and 6M (Figure 7j, 7k, 7n and 7o). In multi-hit groups (control+DLT+LPS and LP+DLT+LPS) further increase in strongly ED-2 immunolabelled macrophagic cells with hypertrophied cell bodies and few long, thick processes was observed both at 1 (Figure 6l and 6p) and 6M (Figure 7l and 7p) of age. However, the density of such cells was higher in the LP+DLT+LPS group as compared to control+DLT+LPS group.
The ED-2 Labelled/CD163+ Cells (Arrows) Also Increased Significantly in LPF1 Rats Both at 1 (6m) and 6M (7m) of Age, in Contrast to Age-matched Controls (6i, 7i). Upon Exposure to DLT Or LPS to Control (Control+LPS; Control+DLT) and LP Group Rats (LP+LPS; LP+DLT), ED-2 Labelled/CD163+ Cells with Elliptical or Ring-shapes and Dense Processes, Comparable to Phagocytic Activated Microglia Were Seen (Arrows) at 1 (6j, k; n, o) and 6M (7j, k; n, o) of Age. In Multi-hit, Control+DLT+LPS and LP+DLT+LPS Groups, Strongly ED-2 Immunolabelled Macrophagic Cells with Hypertrophied Cell Bodies and Very Few Long, Thick Processes (Arrows) Were Observed Both at 1M (6l, p) and 6M (7l, p) of Age, with Higher Density in LP+DLT+LPS Group.
The ED-2 Labelled/CD163+ Cells (Arrows) Also Increased Significantly in LPF1 Rats Both at 1 (6m) and 6M (7m) of Age, in Contrast to Age-matched Controls (6i, 7i). Upon Exposure to DLT Or LPS to Control (Control+LPS; Control+DLT) and LP Group Rats (LP+LPS; LP+DLT), ED-2 Labelled/CD163+ Cells with Elliptical or Ring-shapes and Dense Processes, Comparable to Phagocytic Activated Microglia Were Seen (Arrows) at 1 (6j, k; n, o) and 6M (7j, k; n, o) of Age. In Multi-hit, Control+DLT+LPS and LP+DLT+LPS Groups, Strongly ED-2 Immunolabelled Macrophagic Cells with Hypertrophied Cell Bodies and Very Few Long, Thick Processes (Arrows) Were Observed Both at 1M (6l, p) and 6M (7l, p) of Age, with Higher Density in LP+DLT+LPS Group.
The cell count data for ED-2 labelled CD163+ cells also supported the above results (Figure 8C and 8D) with a significant and gradual increase following exposure to single, dual or multiple stressors to LP animals, with the highly significant difference in LP+DLT+LPS group as compared to control+DLT+LPS {[F(1,239) = 5.63, p ≤ .001], [F(1,239) = 8.018, p ≤ .001], [F(1,239) = 4.794, p ≤ .001]} and control versus LP+DLT+LPS {[F(7,239) = 26.102 p ≤ .001], [F(7,239) = 48.686, p ≤ .001], [F(7,239) = 34.005, p ≤ .001]} at 1, 3 and 6M of age respectively. In addition, total area fraction was also significantly high in LP+DLT+LPS group versus control+DLT+LPS {[F(1,239) = 14.263, p ≤ .001], [F(1,239) = 9.582, p ≤ .001], [F(1,239) = 7.900, p ≤ .001]} and control versus LP+DLT+LPS {[F(7,239) = 57.221 p ≤ .001], [F(7,239) = 75.246, p ≤ .001], [F(7,239) = 64.913, p ≤ .001]} groups at 1, 3 and 6M of age.
Morphometric Analysis of OX-42 and ED-2 Immunolabelling Signifies Microglial Priming: Graphs Showing Significant Increase in the Number of OX-42 Labelled Cells (8A, and Area Fraction of OX-42 Expression (8B) Following Singular or Multi-hit Exposure. A Significant and Gradual Increase in the Cell Count and Area Fraction Data for ED-2 Labelled/CD163+ Cells (8C, 8D) Following Exposure to a Single, Dual or Multiple Stressors Reveals Increased Phagocytic Activity.
Impaired Spatial Learning and Memory Following Multi-hit Exposure
The mean path efficiency and latency data (Figure 9A and 9B) indicated that the latency to reach the hidden platform was significantly high in LP+DLT+LPS versus control+DLT+LPS group {[F(1,95) = 11.057, p ≤ .001], [F(1,95) = 7.116, p ≤ .001], [F(1,95) = 3.801, p = .003]} and control versus LP+DLT+LPS group [F(7,95) = 24.263, p ≤ .001], [F(7,95) = 11.285, p ≤ .001], [F(7,95) = 31.000, p ≤ .001]; while the path efficiency was significantly low {LP+DLT+LPS vs. control+DLT+LPS [F(1,95) = 3.361, p = .007], [F(1,95) = 3.905, p = .003], [F(1,95) = 3.804, p = .003; control vs. LP+DLT+LPS [F(7,95) = 16.958, p ≤ .001], [F(7,95) = 29.438, p ≤ .001], [F(7,95) = 33.242, p ≤ .001]} at 1, 3 and 6M of age.
Impaired Spatial Learning and Memory Following Multi-hit Exposed (LP+DLT+LPS) Rats Assessed by MWM: LP Dual Hit and Multi-hit Rats Presented Significantly High Escape Latency (B) and Lowest Path Efficiency (A), % Time (C) and % Entries (D) in the Target Quadrant Zone in Contrast to Respective Controls and LP Alone Group Rats at 1, 3 and 6 M of Age (n = 12/group/timepoint).
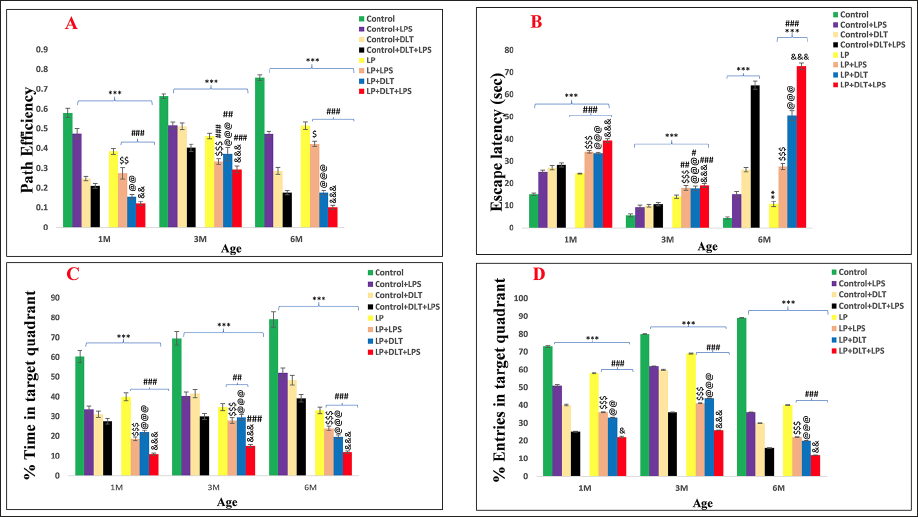
LP-alone and LP+DLT, and LP+LPS group animals also showed significantly higher latency and poor path efficiency, indicating poor spatial memory as compared to age-matched controls. In addition both the percentage of time spent {control vs. LP+DLT+LPS [F(7,95) = 29.414, p ≤ .001], [F(7,95) = 34.378, p ≤ .001], [F(7,95) = 29.414, p ≤ .001]; control+DLT+LPS vs. LP+DLT+LPS [F(1,95) = 7.636, p ≤ .001], [F(1,95) = 9.311, p ≤ .001], [F(1,95) = 15.445, p ≤ .001} and percentage number of entries {control vs. LP+DLT+LPS [F(7,95) = 19.345, p ≤ .001], [F(7,95) = 18.934, p ≤ .001], [F(7,95) = 26.149, p ≤ .001]; control+DLT+LPS vs. LP+DLT+LPS [F(1,95) = 2.496, p = .048], [F(1,95) = 4.889, p ≤ .001], [F(1,95) = 3.856, p ≤ .001} in the target quadrant were significantly low for the LP multi-hit rats at 1, 3 and 6M of age (Figure 9C and 9D), indicating poor spatial memory.
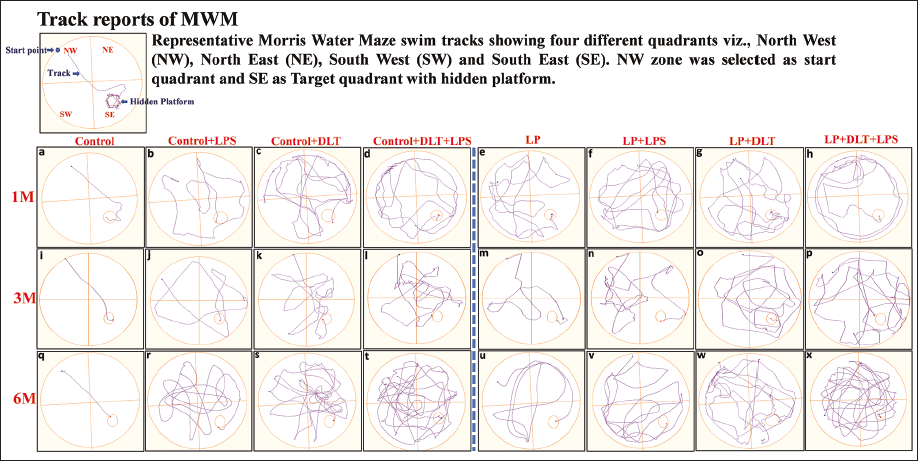
MWM track reports (Figure 10a–10x) clearly indicate that LP and LP group animals at all age time points followed an indirect, complicated and haphazard trajectory (Figure 10e–10h, 10m–10p, 10u–10x) suggesting poor spatial memory in contrast to age-matched controls with a straight path from start point to the hidden platform (Figure 10a, 10i and 10q). In addition, single or combined exposure to DLT or LPS to control animals also resulted in decreased path efficiency as they opted random path as compared to control rats (Figure 10b–10d, 10j–10l, 10r–10t). However, multi-hit rats (LP+DLT+LPS) travelled the longest and most intricate path (Figure 10h, 10p and 10x) with the poorest path efficiency and highest escape latency.
Representative Tracks of the MWM Test Showing Poor Spatial Learning and Memory Following Early Life Multi-hit Exposure: The Track Reports Reveal a Complicated, Indirect and Random Path Taken by LP Dual (f,n,v; g,o,w), and Multi-hit Group Rats (h,p,x) as All Age Points (1, 3, 6M) in Contrast to Straight Path Trajectory from Start Point to the Hidden Platform Opted by Age Matched Controls (a,i,q). However, Control Dual (b,j,r; c,k,s) and Muti-hit (d,l,t) Rats Also Travelled Longer Distances with Random Trajectory. LP Multi-hit Rats Travelled the Longest Distance with the Most Complicated and Haphazard Path.
Discussion
Exposure to ELS during perinatal critical windows is a major risk factor for a myriad of psychopathologies during later life. Nutritional and social stress, infections and neurotoxicant exposure are amongst the most common stressors leading to the acute and long-term neurological consequences in terms of behavioural and cognitive impairments.47, 48 The cumulative exposure to multiple adversities during these critical windows potentially enhances the risk of developing neuropsychiatric disorders like intellectual disability, attention deficit hyperactive disorder, autism spectrum disorder, schizophrenia and others. 49 LP diet during gestation and lactation leads to low birth weight and poor immune system of the F1 progeny, making them prone to infections or other challenges.25, 45, 50 The immune system at birth remains immature, gets worse due to maternal PMN and responds more vigorously to subsequent challenges like systemic LPS or DLT administration and even more robustly to cumulative exposure. In this study, such a response has been seen as the long-term priming of microglia, which then undergo fragmentation and dystrophy by adulthood, especially in multi-hit animals, leading to impaired spatial learning and memory.
A steady and significant decrease in brain weight of the LP and LP-treated double-hit and multi-hit rats through adulthood was an important finding in this study. Early brain development is characterised by neurogenesis, migration and differentiation of new neurons, gliogenesis, establishment of neuronal circuitry, formation, pruning and maturation of synapses. Thus, any adverse factor during this susceptibility period would negatively impact development and growth of brain. Studies in rodent models indicate that maternal PMN significantly affects fetal brain developments,25, 28, 51, 52 causing abnormalities in the hippocampal formation and deficits in cognitive abilities. 53 Other factors like maternal mental health, drug and/or alcohol consumption, infections and exposure to environmental toxins also affect fetal brain development and mental health. 54 Thus, ELS may be the major contributor to poor mental outcomes due to altered brain development. 55
Our observations also indicate the long-term microglial activation specifying their primed states
with enhanced expression of CD11b/CR3, MHC II/OX-6 and ED2 following cumulative exposure to multiple stressors. The microglial density increased, with uneven distribution, activated morphologies varying from round to elongated, darkly stained hypertrophied cell soma, thick, stunted, poorly branched processes in the hippocampal CA3 region of LP rats. Their density increased further with an additional exposure of either LPS or DLT to F1 rats, while their cumulative exposure to LP rats resulted in further exaggeration in the microglial cell number bearing highly activated morphology, some of them stripping around the neuronal perikarya. Many of these activated microglia get switched into dystrophic morphology with deramified or fragmented processes, suggesting that priming/long-term activation causes their degeneration following early life multi-hit exposure. The microglia with deramified processes, aberrant swellings in residual processes, and cytoplasmic fragmentation were designated as dystrophic microglia.56, 57 Streit et al. 56 also claimed that the dystrophic attributes of these cells can be recognised only by such morphological abnormalities, and are not correlated with modifications at a molecular level. 58
Inflammation is the major link between ELS and neurological disorders and is mediated by microglia by secreting pro-inflammatory cytokines and chemokines, and acts as the major miscreant in most neurodegenerative diseases. 59 Such effects are more pronounced in the developing brain because of its vulnerability to adversity. The inflammatory response of microglia induced by infections is associated with microglial priming and is considered to be an intermediary in the development of neurodegenerative diseases. 22 Microglia are highly dynamic cells and can switch from homeostatic state to anti-inflammatory to facilitate tissue remodelling and repair, or pro-inflammatory to characterise inflammatory conditions, involving upregulation of CD11b, MHC-II, interleukins, etc. 60 During this transition microglia acquire thick branched processes with a prominent round cell soma or may finally assume amoeboid macrophagic phenotype with very few thick processes and large cell body. 61 However, the microglia become chronically active when such conditions persist longer and may assume a neurodestructive phenotype. Such phenotypic and functional transformation of microglia may be instrumental as causatives in the development of neurodegenerative diseases.62, 63 The dystrophic morphology of microglia seen in our multi-hit rat model resemble the dystrophic/senescent microglia reported in physiologic brain ageing and AD.64–66 Malvaso and group 66 also indicated that such changes in microglial morphology had no clear-cut molecular signature, and their dystrophic morphology is accelerated by the age-associated neurodegeneration. Shahidehpour and associates 65 also believed that cellular senescence is a hallmark of ageing, and age could be a cause of dystrophic microglia. However, the number of dystrophic microglia increased significantly in the diseased brains than the normal healthy brains. Studies in neurodegenerative models suggest that deramified microglia no longer perform their neuroprotective function 67 rather, the dystrophic microglia are the disease-associated microglia morphology, accounting for microglial degeneration in neurodegenerative diseases.
Microglia are essentially required for remodelling of neural circuits and maintenance of synaptic plasticity during postnatal development and adulthood. The ELS critically affects the microglial structure, leading to their overactivity and priming. If such overactivation persists for long, the microglia undergoes dystrophic changes, causing impaired phagocytosis. Such dysfunctional microglia contribute to an enhanced inflammatory response and neuronal dysfunction, causing synaptic plasticity and memory deficits in many degenerative diseases. 68 Recent reports from our group also delineated degenerative changes in hippocampal pyramidal neurons, including loss of dendritic arborization and spines, downregulation of synaptic plasticity proteins, Egr 1 and Arc, gliosis, behavioural and cognitive deficits following ELS.4, 69 Recently, Cornell et al. 68 discussed the positive role played by resting microglia in synaptic plasticity, while the activated microglia can lead to synaptic plasticity and cognitive deficits associated with various neurological and mental disorders. They also raised the possibility that manipulation of microglia may possibly be explored as a therapeutic tool to ameliorate cognitive deficits. The CR3/CD11b expressed primarily on microglial surface mediates synaptic pruning, and loss of its expression prevents pruning, while increased expression enhances pruning. 70 ELS is increasingly being reported to alter the expression of CR3/CD11b. 71 Thus, increased CR3/CD11b expression both as area fraction and the number of CR3/CD11b expressing cells observed in multi-hit rats in this study suggests the enhanced synaptic engulfment and loss of spines following ELS. This indicates that early life exposure targets the synaptic connections and weakens them, which are then engulfed by microglia. Synapse elimination is an activity-dependent process, and complement-mediated recognition targets the elimination specifically by microglia, so that the active synapses are strengthened and inactive synapses are pruned. 72
Conclusion
The present study indicates that any adverse factors causing deviation from the normal environment during critical periods of development can lead to devastating changes in brain health and poor cognitive outcomes. Microglial priming plays a central role, due to which they become over-reactive and show exaggerated responses to subsequent stimuli and finally undergo dystrophic changes as they become exhausted and are unable to perform homeostatic functions, rather participate in neurodegeneration. Thus, microglial dysfunction may be a crucial factor in the pathogenesis of many neuropsychiatric and neurodegenerative diseases.
Footnotes
Acknowledgement
The authors thankfully acknowledge BSR-UGC grant, New Delhi.
Authors’ Contribution
Syed Mujtaba: Data curation, formal analysis, investigation, methodology, writing of original draft; Nisha Patro: Conceptualization, formal analysis, investigation, methodology, supervision, validation, visualization, review, editing; Ishan K. Patro: Conceptualization, experimental design, project administration, resources, supervision, finalization of manuscript.
Statement of Ethics
All experimental procedures were pre-approved (IAEC/JU/74/25/01/2021), and performed as per the guidelines of Institutional Animal Ethics Committee (IAEC), Jiwaji University, Gwalior, Madhya Pradesh (Registration no.1854/GO/Re/S/16/ CPCSEA).
Declaration of Conflicting Interests
The authors declared no potential conflicts of interest with respect to the research, authorship and/or publication of this article.
Funding
The authors disclosed receipt of the following financial support for the research, authorship and/or publication of this article: Syed Mujtaba received SRF from BSR-UGC grant [25-1/2014-15/(BSR)/7-97/2007/(BSR)].
ICMJE Statement
NA.