
Abstract
Background
Studies suggest that obesity predisposes individuals to developing cognitive dysfunction and an increased risk of dementia, but the nature of the relationship remains largely unexplored for better prognostic predictors.
Purpose
This study, the first of its kind in Indian participants with obesity, was intended to explore the use of quantification of different neurocognitive indices with increasing body mass index (BMI) among middle-aged participants with obesity. Additionally, machine-learning models were used to analyse the predictive performance of BMI for different cognitive functions.
Methods
In the cross-sectional analytical study, a total of 137 (n = 137) participants were included. Out of the total, 107 healthy obese (BMI = 23.0–30.0 kg m−2; age between 36 and 55 years of both genders) were recruited from the out-patient department of the Department of Endocrinology and General Medicine, and 30 participants were recruited as the control group, between March 2023 to February 2024. The participants underwent neuropsychological assessments, including mini-mental state examination (MMSE), Montreal cognitive assessment (MoCA) and serum levels of brain-derived neurotrophic factor (BDNF).
Results
Significant (p < .05) differences were observed for neurocognitive functions for the obese group versus the control group. According to the correlation heatmaps, BMI was significantly (p < .05) negatively associated with BDNF. Multivariate linear regression analysis revealed a substantial (p < .05) decline in BDNF with a change in BMI, accenting its significant impact on cognitive ageing. Additionally, consistent decreasing trends were observed across the MoCA and MMSE, confirming the robustness of the findings across diverse analytical methodologies. Furthermore, the linear regression model and super vector machine model contributed additional evidence to the consistency of the trends in cognitive decline linked to BMI variations.
Conclusion
The preliminary results of the present study support that increased BMI is an important physiological indicator that influences neurocognition and neuroplasticity in individuals with obesity.
Keywords
Research Highlights
This is India’s first preliminary report to explore the scientific evidence to quantify a decrease in neurocognitive markers with increasing body mass index (BMI) among middle-aged participants with obesity using both aspects of subjective and objective assessments of psycho-neurocognitive parameters.
Additionally, different machine-learning models were used to analyse the predictive performance of BMI for different cognitive functions. This research contributes valuable insights for scientific understanding and practical applications in the ever-evolving intersection of health and technology.
Introduction
The prevalence of overweight and obesity is increasing worldwide, 1 and the major causative factors are related to lifestyle changes occurring due to rapid socioeconomic transitions. This situation has been exaggerated in the present scenario of the COVID-19 pandemic. 2 Reduced physical activity at work due to mechanisation, improved motorised transport, preferences for viewing television and video games during leisure time and consumption of fast food and sweetened carbonated drinks have resulted in a positive energy balance in most Asian countries.1, 3–5 As youths progress through adolescence, their participation in physical activity declines markedly.3–7 The immediate risks of obesity to physical health are well established. 7 However, available evidence8–13 has shown that obesity predisposes individuals to developing cognitive dysfunction and an increased risk of dementia, but the nature of the relationship remains largely unexplored for better prognostic predictors.14–19 However, assessing how rapidly cognitive decline progresses has important implications in clinical practice since the rate of disease progression may be the most important factor in determining prognosis. 19 A biological marker for rapid cognitive decline would be valuable because at-risk patients could be targeted early for pharmacological, medical and psychosocial interventions designed to slow deterioration. Brain-derived neurotrophic factor (BDNF) is a member of the neurotrophins family of small secreted proteins that play major roles in nervous system development and function and has been studied as a biological marker for cognitive decline.14,19,20–24
Currently, researchers are using different machine-learning models (MLMs) to explore cognitive performances. 25 To the best of our knowledge, only a few studies have reported the effect of BMI on changes in cognitive functions, and concomitant results have been obtained. These inconsistencies in their study findings may be due to the statistical methods used, methodological paradigms, population sampling methods and/or the setup of machine-learning (ML)-based algorithms, which have underestimated the potential efficacy of these methods in cognitive science. Therefore, the present study aimed to quantify the changes in specific psycho-neurocognitive functions (as cognitive ageing markers), including serum levels of BDNF, as well as questionnaires Montreal cognitive assessment (MoCA) and mini-mental state examination (MMSE) scores with increasing BMI among middle-aged participants with obesity. To achieve these goals, the authors have comprehensively explored the association between BMI and neurocognitive measures to increase clinical utility for future diagnostic and prognostic purposes. Therefore, the present study, part of a larger study, is intended to explore the association of quantification of different neurocognitive indices with increasing body mass index (BMI) in middle-aged participants with obesity without any comorbidities. Additionally, different MLM were used to analyse the predictive performance of BMI for different cognitive functions. This research might contribute valuable insights for scientific understanding and practical applications in the ever-evolving intersection of health and technology using conventional as well as model-based algorithms methods.
Methods
Study Population
The present study was a cross-sectional analytical research study conducted in the Department of Physiology, Psychiatry along with Endocrinology & Department of Medicine, All India Institute of Medical Sciences (AIIMS), Bathinda, India, from March 2023 to February 2024. After obtaining approval from the scientific advisory committee, the clinical trial registry (CTRI/2022/10/046935) and the Institutional Ethics Committee (IEC/AIIMS/BTI/370), a total of 137 middle-aged participants aged between 36 and 55 years of both genders were enrolled. Out of the total, 107 participants were overweight/obese (BMI values between 23.0 and 30.0 kg m−2; as per ICMR, 2014) 26 ; and 30 were control participants (BMI of 18.5–22.9 kg m−2; as per ICMR, 2014). 26 The aim of including a control group was only to compare the natural variation in the cognitive performances of normal BMI participants versus higher BMI participants and was therefore not age- and sex-matched. Patients with known cases of diabetes or hypertension, neurological disorders, other endocrinology disorders, taking drugs for any chronic illness, history of uncontrolled smoking, alcoholism or who were currently engaged in any weight-loss programme were excluded from the study. Written informed consent was obtained from all the participants before they participated in the study.
Anthropometric Measurements
The height was recorded while the participants stood and had bare feet using a wall-mounted stadiometer (Holtain Ltd, UK). Body weight was measured using a digital weighing balance (Seca, Germany) to the nearest 0.1 kg. Waist circumference (WC) was measured at the widest diameter between the xiphoid process of the sternum and the iliac crest. Obesity indices, including BMI,26, 27 were calculated as weight (kilograms) divided by height (metres) squared and kg m−2.
Cognitive Assessment Tools
All participants in the present study underwent cognitive assessment using the English and Hindi versions of the MMSE and the MoCA questionnaires. Both tools are valid and reliable among Indians by considering cultural and linguistic differences. Under the supervision of an expert clinician in the Psychiatry Department, administered the MMSE and MoCA within 5–10 min and 10–15 min, respectively.
MMSE: The MMSE is a 30-point questionnaire used extensively in clinical and research settings to measure cognitive impairment, including simple tasks in a number of areas: the test of time and place, the repeating lists of words, arithmetic such as serial subtractions of seven, language use and comprehension and basic motor skills. The total score was 30; this score provides a picture of an individual’s cognitive performance, and a score of <24 indicated cognitive impairment. 28
MoCA: The MoCA is another 30-point test covering eight cognitive domains for a rapid screening instrument for mild cognitive dysfunction that includes attention and concentration, executive functions, memory, language, visuoconstructional skills, conceptual thinking, calculations and orientation. MoCA score categories were defined as severe deficit (<10), moderate deficit (10–17), mild deficit (18–25) and normal (>26). 29
Serum levels of BDNF: An assessment tool to capture the complex nature of cognitive health measuring the serum levels of BDNF, a molecular marker that is essential for neurotrophic support and synaptic plasticity, is important. Estimating BDNF levels provides researchers with a better understanding of the neurobiological factors affecting cognitive function by illuminating the molecular details underlying cognitive processes. The concentration of serum BDNF levels was estimated using a commercially available sandwich enzyme-linked immunosorbent assay kit (Immunotag, Geno Technology, Inc, USA). Fasting venous blood samples (5 ml) were collected, allowed to clot for 10 min at room temperature, and centrifuged at 2,000–3,000 rpm for 10 min. The serum was stored at −80 °C until analysis. The detection limit for BDNF levels ranged between 31.25 and 2,000 pg ml−1. Quality control assays for biomarkers and validation were performed. Fasting blood glucose levels were estimated using an enzymatic method using commercially available kits (Randox Laboratories Ltd, UK). All the assessments were carried out in the morning hours between 8:00 and 10:00 am.19, 21
MLM-based Algorithms
Applying MLMs 25 involves utilising advanced algorithms to analyse data in studying BMI and cognitive assessments. Specifically, ML algorithms, including linear regression (LR), support vector machine (SVM) and random forest (RF) and XGBoost (XGB), are harnessed to reveal intricate patterns and forecast cognitive trajectories. Integrating conventional testing methods with advanced MLM-based analysis aims to comprehensively understand the relationship between BMI and cognitive function. This synergistic approach allows for developing ML-based algorithm-assisted applications in healthcare domains.
LR: LR30, 31 is a statistical method used to model the relationship between two variables. In this model, the algorithm assumes a linear relationship between the predictor variable (BMI) and the response variable (cognitive functions), allowing researchers to quantify and predict the impact of BMI on cognitive performance.
SVM/networks: This model is associated with learning algorithms that analyse data for classification and regression analysis for the predictor variable (BMI) and the response variable (cognitive functions). In this scenario, SVM might segment the study population based on various factors related to body mass (BMI) and cognitive function. It can help identify critical thresholds or conditions under which BMI significantly impacts cognitive abilities. 32
RF: RF33, 34 is a ML algorithm combining multiple decision trees’ output to reach a single result. In the context of BMI and cognitive function, the RF model can capture a broader range of patterns and relationships by combining the strengths of individual decision trees. This approach helps mitigate overfitting and provides a more robust analysis by considering diverse perspectives within the data. The RF model enhances the model’s predictive power and generalisability.
XGBoosting: XGB, or eXtreme Gradient Boosting,35, 36 is a ML algorithm that sequentially builds decision trees, correcting errors made by preceding trees and enhancing overall predictive accuracy. Its gradient-boosting framework optimises the model by minimising errors, contributing to a highly accurate predictive tool. With regularisation techniques, XGB prevents overfitting, ensuring robust generalisation to new data. Additionally, its ability to handle missing data enhances flexibility. When applied to the BMI-cognitive function context, XGB excels in predicting cognitive outcomes, capturing complex relationships and nonlinear patterns within the data and offering a nuanced understanding of how BMI indicators influence various cognitive abilities.
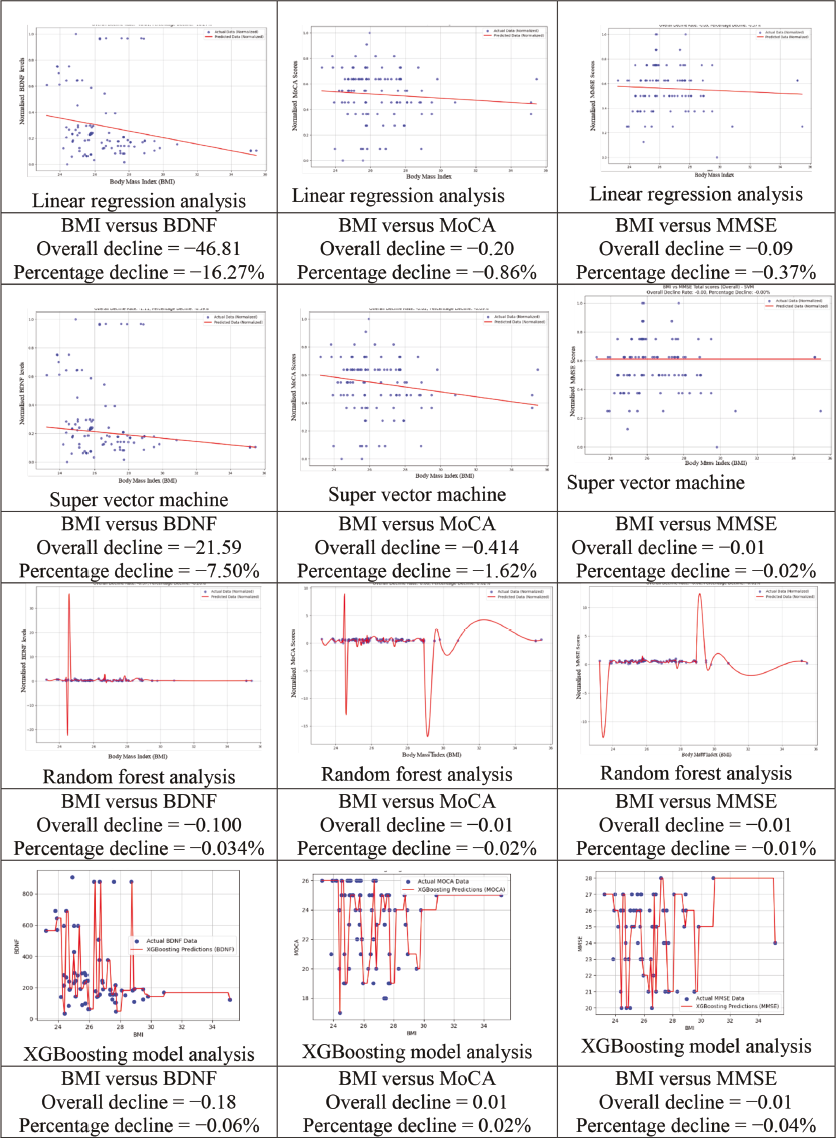
Furthermore, the different MLMs, including LR, SVM, RF and XGB, were used to analyse the predictive performance of BMI for different cognitive functions for scientific understanding and practical applications in the ever-evolving intersection of health and technology. Using single-time point research data of the present study, the authors have used error metrics to assess the model’s accuracy and stability. This provides valuable information on how well the model performs with the available data and can guide us in improving or choosing better models. The error metrics will help us to understand how accurate our model’s prediction is compared to the actual data. The overall decline measures the average difference between predicted and actual values; it indicates how reliable the model is for predicting future outcomes. On the other hand, the percentage decline measures the proportion of decline, making us understand the magnitude of the change in a relative sense; it also gives insight into the model’s performance and stability. A negative rate indicates that the predictions are lower than the actual values, while a positive rate means the predictions are higher.
Statistical Analysis
The data were analysed using SPSS software Version 20.0 (IBM, Chicago, IL, USA, October 2020) for conventional data analysis and Python programming (version Jupyter Notebook 6.5.4) software for ML-based algorithms. The normality of the data was analysed using the Kolmogorov–Smirnov test. The data is presented as the mean ± standard deviation and interquartile range for parametric and non-parametric variables, respectively. The mean differences between different sociodemographic and neuropsychological parameters were measured using an ‘Independent two t-test with equal variance’ for parametric variables at a confidence interval (CI) of 95% and a ‘Mann–Whitney test’ for non-parametric variables and also for sub-domain analysis for different psychological parameters. An ‘Independent sample t-test’ was used to determine gender differences in neuropsychological variables for the obese group. The ‘Multivariate Linear regression’ analysis with an adjusted model (β-coefficient) with all co-founders, including age, gender and education among the obese group, to explore the quantitative association between BMI and BDNF, MoCA and MMSE. The correlation heat maps between BMI and various neurocognitive parameters were assessed using Pearson’s correlation analysis. Different MLMs, including LR, SVM, RF and XGB were used to analyse the predictive performance of BMI for different cognitive functions for scientific understanding and practical applications in the ever-evolving intersection of health and technology. The p-value < .05 was considered to indicate statistical significance.
Results
Associations Between BMI and Different Neurocognitive Functions
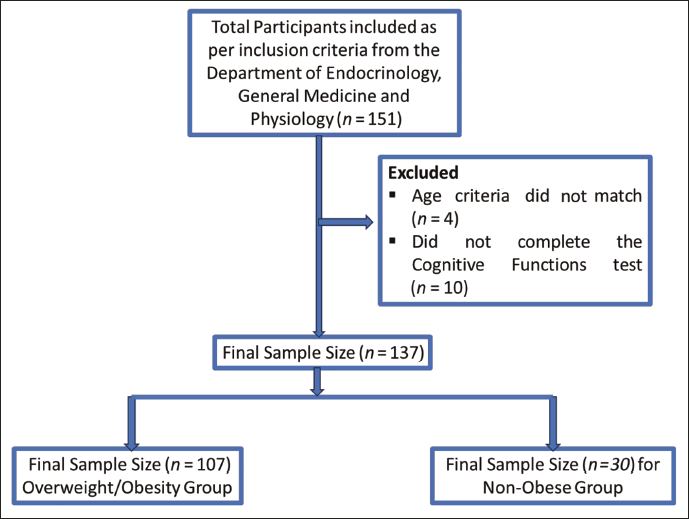
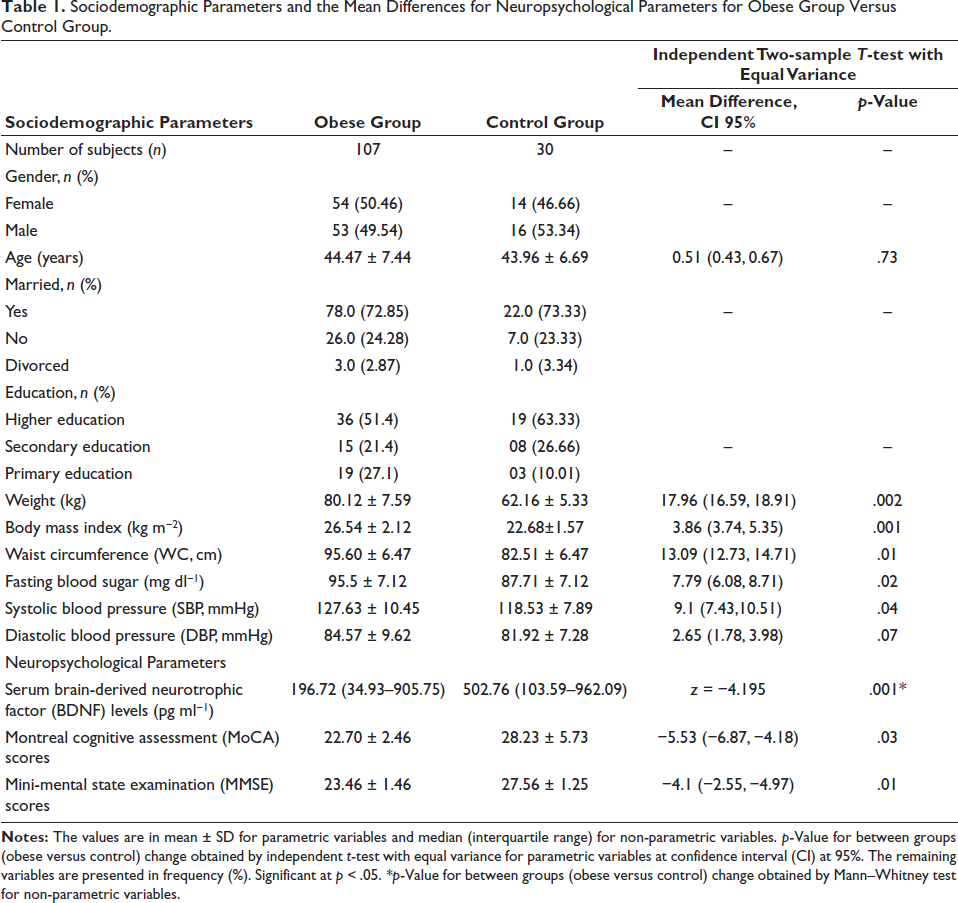
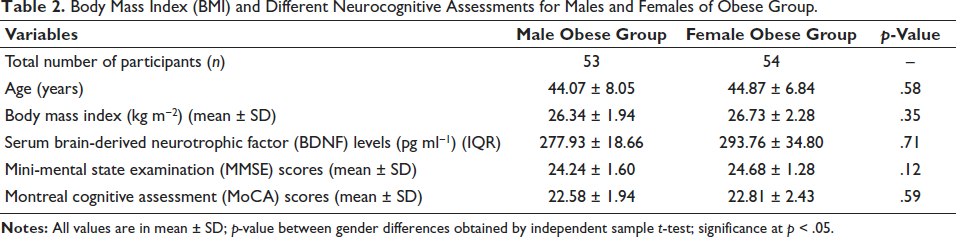
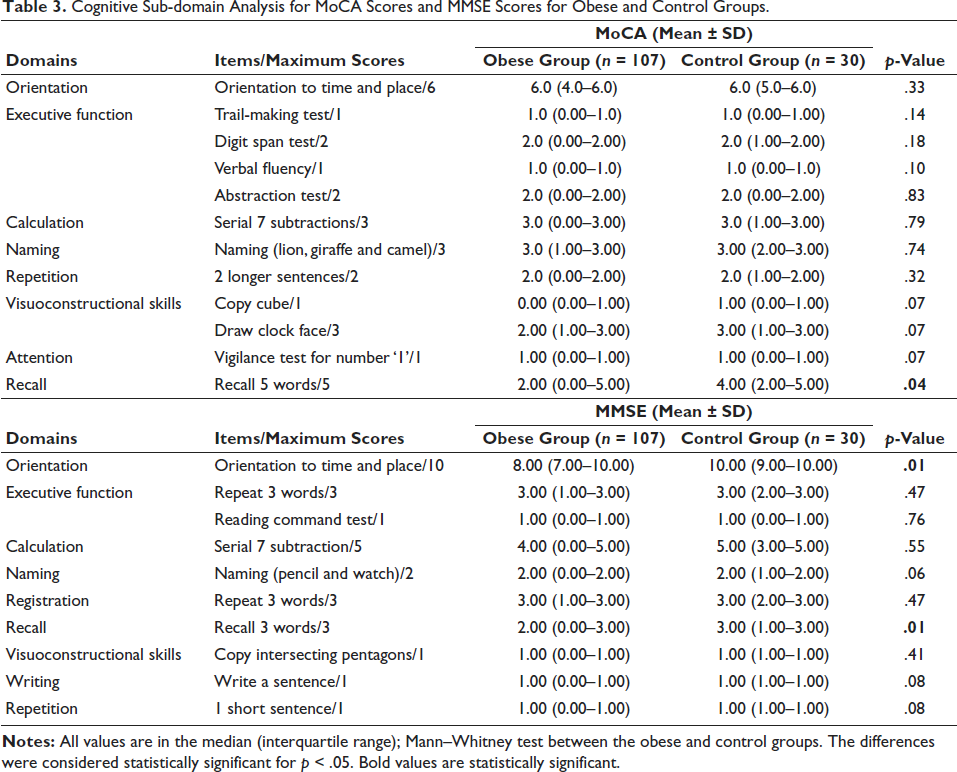
A total of 107 participants with obesity (F = 54; M = 53), age 44.47 ± 7.44 years, and 30 control participants, age 43.96 ± 6.69, were included in the analysis. The flowchart of the sample selection process in the study is mentioned in Figure 1. Using Independent two-t test with equal variance, the significant mean differences for weight (p = .002), BMI (p = .001), WC (p = .01), fasting blood sugar levels (p = .02), systolic blood pressure (p = .04), MoCA scores (p = .03) and MMSE scores (p = .01) were observed for the obese group versus control group. On the other hand, using the Mann–Whitney test, the mean difference for the serum BDNF levels was significantly (z = −4.19; p = .001) reduced for the obese group compared with the control group (Table 1). The present study did not find significant results for BMI and different neurocognitive assessments for males and females, as shown in Table 2. The cognitive sub-domain analysis for MoCA scores and MMSE scores for obese and control groups was carried out, and it has been observed that the recall domain (p = .04) of MoCA and orientation domain (p = .01) for MMSE were found to decrease significantly for the obese group when compared to the control group as shown in Table 3.
Flowchart of the Sample Selection Process in this Study.
Sociodemographic Parameters and the Mean Differences for Neuropsychological Parameters for Obese Group Versus Control Group.
Body Mass Index (BMI) and Different Neurocognitive Assessments for Males and Females of Obese Group.
Cognitive Sub-domain Analysis for MoCA Scores and MMSE Scores for Obese and Control Groups.
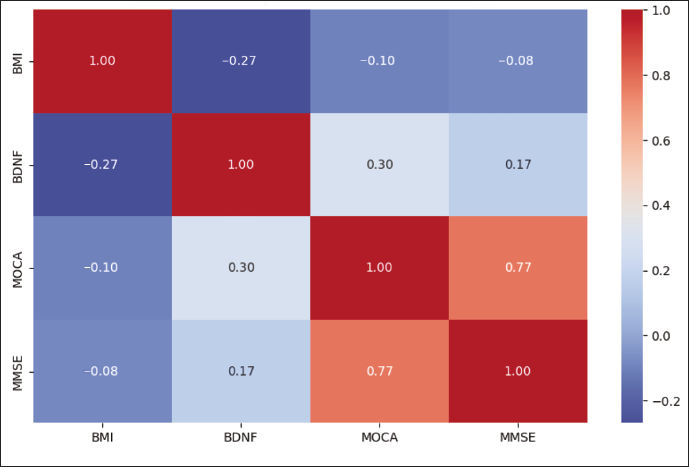
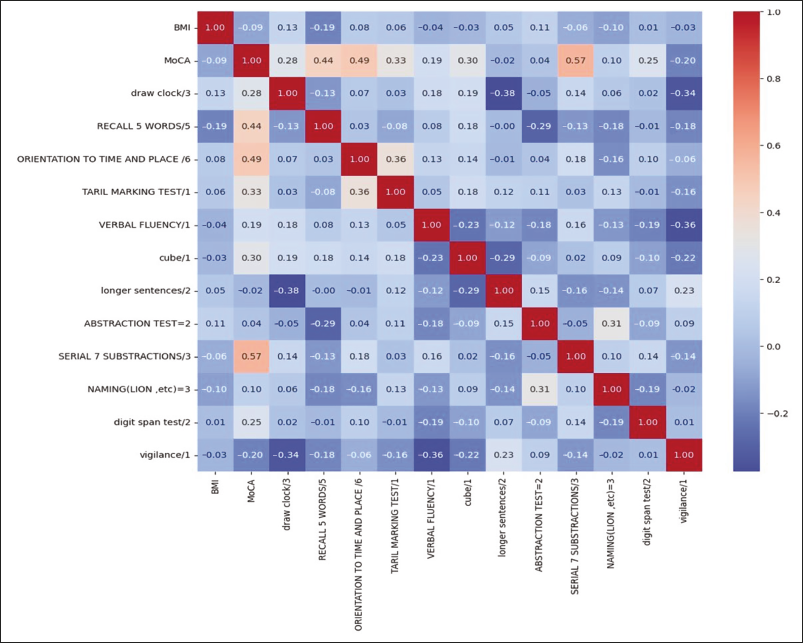
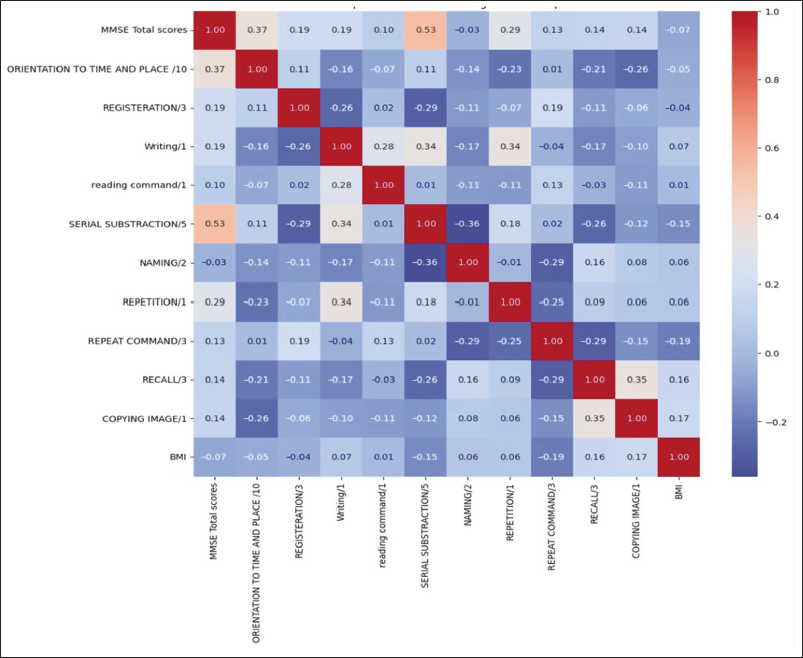
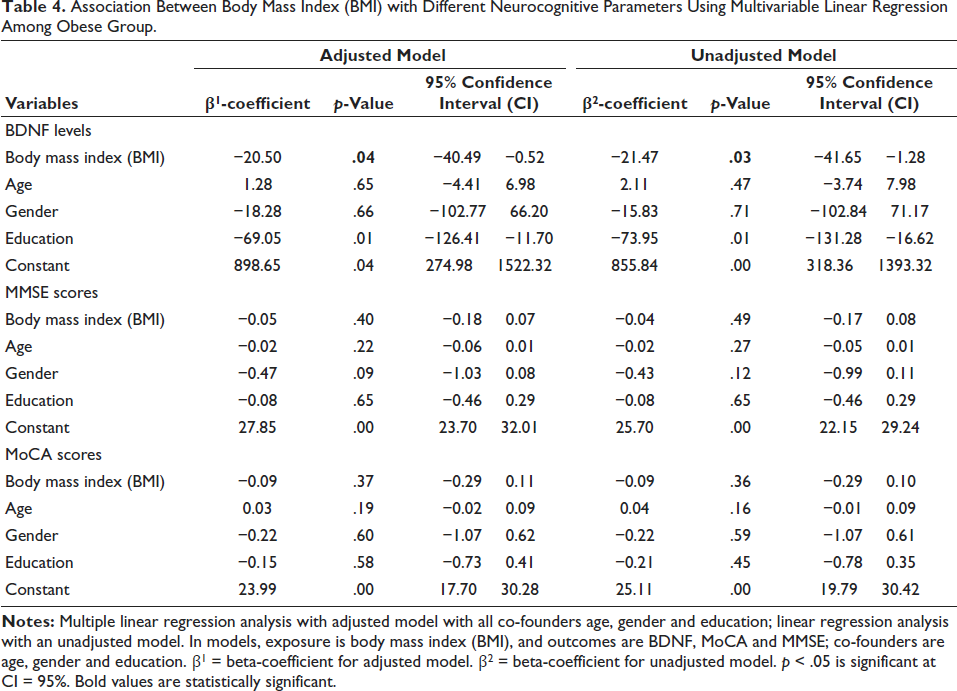
MMSE: Mini-Mental State Examination, SD: Standard Deviation.Using a multimodal approach, notable significant differences were observed in the correlation between BMI and different neurocognitive parameters among middle-aged participants with obesity. Using Pearson’s correlation heatmaps, a significant negative correlation was observed between the BMI of overweight/obese participants and the serum BDNF concentration (r = −0.27; p = .024) (Figure 2). However, the MMSE and MoCA scores were negatively correlated with BMI, but the differences were not statistically significant (r = −0.083; p = .49; r = −0.099; p = .41, respectively) (Figure 1). For sub-domain analysis for MoCA and MMSE, it has been observed that the recall domain (r = −0.189; p = .04) of MoCA and serial subtraction (calculation) (r = −0.12; p = .013) domain of MMSE were negatively associated with increasing BMI (Figures 3 and 4). Furthermore, to determine the strength of the association between BMI and BDNF levels, the multivariate LR-adjusted and unadjusted models were used for all potential confounders, including age, gender and education. A significant negative association with the β-coefficient of −20.50, with CI at 95% is −40.49, −0.52; p = .04, between BDNF levels and BMI, has been observed. Also, a significant negative association with the β-coefficient of −69.05, with CI at 95% is −126.41, −11.70; p = .01, between BDNF levels and BMI, has been observed. These negative associations signify that BDNF levels tend to decrease with a magnitude of −20.54 as BMI increases with each unit and vice versa, also affecting the education strata, as shown in Table 4.
Association Between Body Mass Index (BMI) with Different Neurocognitive Parameters Using Multivariable Linear Regression Among Obese Group.
Model Performance Comparison
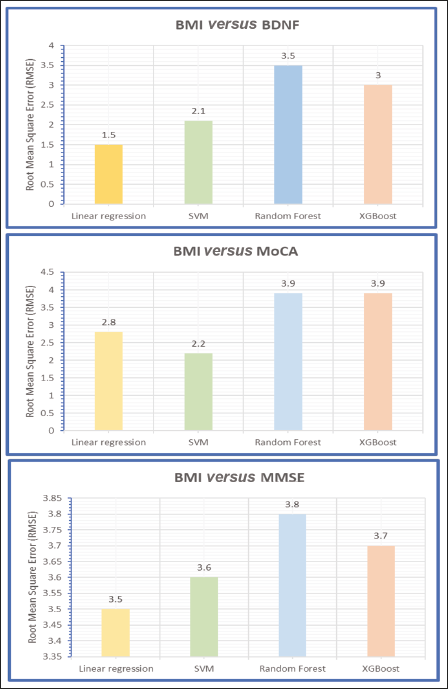
Furthermore, the associations between BMI and different neurocognitive parameter datasets were analysed by using innovative ML-based algorithms, including LR, super vector machine, RF and XGB methodologies, to quantify the interpretations behind the associations between cognitive decline and increasing BMI (Figure 5). For this purpose, the authors divided the datasets into two categories, the training dataset and the testing dataset, to extract algorithm-based insights into the associations between BMI and BDNF and between the MoCA and MMSE scores. The training dataset comprises 80% of the data, while the remaining 20% is allocated to the testing dataset. The root mean square error (RMSE) was calculated to assess the efficiency of the MLMs considered in this study (Figure 6). From the present datasets, LR and super vector machine models were shown to have lower RMSEs than did the RF and XGB models; hence, large datasets are needed to validate these models.
Notes: BMI – body mass index; BDNF – brain-derived neurotrophic factor; MoCA – Montreal cognitive assessment; MMSE – mini-mental state examination.
On the other hand, LR and SVM analysis revealed a particularly noteworthy finding, revealing a substantial (−) 46.81 (−16.27%) and (−) 21.59 pg ml−1 (−7.50%) increase in the incidence of cognitive decline in association with BMI and BDNF, respectively (Figure 5). Moreover, the investigations extended to the impact of BMI on the MOCA and MMSE scores, revealing a more moderate cognitive decline of −0.20 (−0.86%) and −0.414 (−1.62%), respectively (Figure 5). Additionally, the outcomes obtained from the super vector machine, RF and XGB models revealed consistent patterns of cognitive decline with increasing BMI. These results reinforce the initial LR and super vector machine findings and underscore the robustness and coherence of the observed trends in cognitive decline, reinforcing the study’s implications for understanding the impact of BMI variations on cognitive health across diverse analytical approaches and methodologies. The present study is ongoing to obtain more datasets that can be generated to increase the MLM’s performance for better application development for the healthcare industry to assess the changes in the cognitive functions in obesity.
Discussion
In the present study, the authors aimed to quantify the association between BMI and neurocognitive markers, including the serum BDNF concentration and MMSE and MOCA scores, employing ML-based models in obesity. The present study found significantly decreased cognitive task performances with increasing BMI in obesity without comorbidities. These decreases in BDNF levels may be due to low-grade inflammation, increased oxidative stress, lifestyle factors and mutations in the BDNF gene or tyrosine kinase (Trk)-B receptor in individuals with obesity.14, 37, 38 Our study findings contrast with those of Monteleone et al, 37 who recorded increased serum BDNF levels with increasing BMI and weight. This inconsistency in the research findings may be due to differences in ethnicity, population age group, study design, methodology and sample size. Thus, to generalise these findings to the entire population with obesity, we validated our findings with present datasets generated using ML-based algorithms. Furthermore, we found greater BDNF levels in females than males, but we did not find any significant difference between them. Our study findings are supported by Marcos-Pasero et al, 38 who did not find a significant correlation between sex differences and cognitive functions. Lower education strata for obese group participants also exhibited more cognitive decline, possibly due to limited resources such as access to education that has affected healthcare disparities, lifestyle factors and social interactions. These findings are in line with the previous study, which showed that cognition is affected by sociodemographic parameters. 26
The present study observed decreased MoCA and MMSE scores with mild deficiency and a significant negative association between MoCA and MMSE scores with an increasing BMI, which was positively supported by decreased BDNF levels in obesity. This decrease in cognitive performance with a decrease in the serum BDNF concentration indicates the impairment of recall memory, serial subtraction (calculation) and orientation to time and place in an individual, thus revealing diminished cognitive processing. Consistent decreasing trends were observed across the MOCA and MMSE scores, confirming the robust findings highlighting the impact of BMI on cognitive health. This decline in cognitive functions among the middle-aged obese group may be due to decreased physical activity; psychological dysfunction with negative mood; consumption of a high-fat diet that may modulate the brain ageing, zinc finger proteins downregulation that further affects the expressions of the BDNF genes or its Trk-B receptor; and limited resources to access the education that may affect the health domains.39–41 The present research findings concur with previous studies showing decreased neural circuits for sensory and motor activity using ERPs-P300 and decreased BDNF levels along with various neurocognitive assessments, including MoCA and MMSE.42–46 Moreover, peripheral BDNF levels could parallel central BDNF levels, as BDNF has both neural and nonneural origins and can aid in developing neural circuits in the brain and cognitive function via neuroplasticity after crossing the blood–brain barrier. These neural circuits help in basic learning, memory and other cognitive functions. Our findings concur with those of Marqués-Iturria et al, 47 who found a correlation between lower BDNF levels and obesity, resulting in lower cortical thickness, associated with more cognitive performance task errors.
Importantly, for the first time, India has proposed a potential application for quantifying cognitive decline using the model’s algorithms. Understanding how BMI affects cognitive health can contribute to diagnostic and prognostic purposes in clinical settings.48, 49 Recently, Du et al, 49 have tried to develop an obesity risk prediction system for better health management plans and achieving obesity management with few shortcomings. The present study also shows the trend to bridge the gap between BMI and cognitive decline using MLM-based algorithms, offering valuable insights for scientific understanding and practical applications. The LR and super vector models obtain superior results for the present research study compared to other techniques. Body size (BMI) is linked to cognitive decline, and various methods, including traditional and algorithm models, have been used to gain deeper insights. 49 The strengths of this study lie in its comprehensive approach, diverse use of artificial intelligence-based algorithms, conventional analysis and potential for cognitive problem detection.
Although conducted with a relatively sound methodology, this study has a few limitations. First, due to the small datasets, the findings of this study with learning algorithms need to be corroborated with larger datasets because the authors presented preliminary datasets with the algorithms-based approach of an ongoing research study. Second, the present study did not analyse the possible effects of different menstrual cycle phases on females’ cognitive functions. Third, diet assessment could not be carried out for obese patients to provide a better explanation of cognitive decline. Despite these limitations, the present findings provide scientific evidence with algorithm-based solutions for overweight/obese participants to be aware of their cognitive status, which will guide them to undergo lifestyle modification programmes. Nevertheless, the present study findings provide valuable insights into the intricate relationship between cognitive functions and obesity within the Indian context. Furthermore, the algorithms-based sub-domain cognitive domain analysis for overweight and obese individuals is not shown in the present study and will be covered in a future research paper.
Conclusion
The present findings scientifically affirm the quantitative decline in cognitive functions in terms of recall memory domain, serial subtraction domain and orientation to time and place in obesity, affecting their quality of life in day-to-day activities. Therefore, these patients should undergo lifestyle modification programmes to improve cognitive performance. Furthermore, the use of ML-based algorithms helps to provide feasibility to quantify the cognitive decline in obese participants and are used to predict obesity levels and associated cognitive decline. These model analyses also help assess the risk of cognitive decline in obese patients by identifying key risk factors and predictive biomarkers.
Footnotes
Acknowledgement
The authors thank the participants for cooperating to make this research possible. Thanks to the committed research team, collaborators and institutions (All India Institute of Medical Sciences, Bathinda, Punjab and All India Institute of Medical Sciences, New Delhi) for their invaluable support.
Author Contributions
Dipti Magan was involved in the study conceptualisation, study design, acquiring and interpreting the data, ML-based datasets analysis, data interpretation, manuscript writing and manuscript review. Raj Kumar Yadav was involved in datasets interpretation and manuscript review. Jitender Aneja was involved in psychological questionnaire analysis and data interpretation. Shivam Pandey was involved in data analysis and data interpretation.
Clinical Trial Registry
The study was registered at the Clinical Trial Registry India (CTRI), CTRI/2022/10/046935.
Copyright
The copyright (registration number: L-147090/2024) for ML-based algorithms for the present research data has been approved by the Government of India.
Data Availability Statement
The data underlying this study will be made available upon reasonable request.
Ethical Approval
All study procedures and protocols involving human participants were approved by the Institutional Ethics Committee (IEC/AIIMS/BTI/205) and adhere to the tenets of the Declaration of Helsinki.
Patient Consent
Informed consent was obtained from all participants included in the study.
Declaration of Conflicting Interests
The authors declare no potential conflicts of interest concerning the research, authorship and/or publication of this article.
Funding
The authors received no financial support for the research, authorship and/or publication of this article.