
Abstract
Background
The Graph theory provides the platform that could be used to model complex brain networks mathematically, and it could play a significant role in the diagnosis of various neurodegenerative diseases such as Alzheimer’s.
Purpose
The main aim of our study is to perform a comparative analysis in terms of various graph theoretic measures of structural brain networks. In particular, the paper evaluates graph theoretical measures by first forming graphs using magnetic resonance imaging (MRI) data.
Method
In this paper, we study and evaluate graph theoretical measures using MRI data, namely characteristic path length, global efficiency, strength, and clustering coefficient, in a cohort of normal controls (N = 30), a cohort of mild cognitive impairment (MCI) (N = 30), and a cohort of Alzheimer’s disease (AD) (N = 30). In our work, MRI data is preprocessed and cortical thickness is extracted for each brain region. The connectivity matrix is obtained, and thus a graph is formed. We have also performed receiver operating characteristic (ROC) and area under the ROC analyses of all graph theoretical measures to better elucidate and validate the results.
Results
It is observed that these measures may be used to differentiate Alzheimer’s from normal. In our study, we observed that a very random and disrupted network is obtained in the case of Alzheimer’s in comparison with the normal and MCI cases. The other observations in terms of graph theoretic measures are an increase in characteristic path length, a decrease in global efficiency, a decrease in strength, and a reduction in values of the clustering coefficient in the case of Alzheimer’s.
Conclusion
The findings suggest that graph theoretical measures and alterations in network topology could be used as quantitative biomarkers of AD.
Introduction
The brain is the most fascinating and least understood organ in the human body. Researchers have for a long time pondered the relationship between behavior, emotion, memory, thought, consciousness, and the physical body. 1 The role played by medical imaging in the field of neuroscience is significant. The neuroimaging or brain mapping 2 is the use of various techniques to image the structure and functions of the nervous system. Various imaging modalities, 3 such as X-ray, computed tomography, and magnetic resonance imaging (MRI), allow better understanding and characterization of tissues at the structural, hemodynamic, and functional levels.
MRI is a neuroimaging technique 1 that provides structural information about the brain. One of the major advantages of MRI 4 is the ability to image the soft tissue in the human body and its metabolic processes. It is a powerful imaging modality because of its flexibility and non-invasive nature. 5 It offers great promise for understanding the human body at the structural, functional, and hemodynamic levels. The MRI stems from the application of nuclear magnetic resonance (NMR) to radiology imaging. 4 MRI, based on the phenomenon of NMR, 5 produces images of the human body with excellent soft tissue contrast, distinguishing between gray and white matter of the brain and brain defects such as tumors. It provides excellent characterization between the gray matter, 3 white matter, and cerebral spinal fluid. MRI is a non-ionizing technique 5 with full three-dimensional capability and high spatial resolution. 4 It is well known that neurodegenerative diseases 6 severely affect the structural connectivity of the brain. Since graph theoretic measures 7 are best suited to capture such information, we employed them in our study. Hence, in our study, we have carried out a graph theoretical analysis of MRI data comprising 30 normal controls, 30 mild cognitive impairment (MCI), and 30 Alzheimer’s patients, acquired from the Alzheimer’s Disease Neuroimaging Initiative (ADNI) database.
In the literature, most of the papers investigate network alterations in Alzheimer’s disease (AD) by using electroencephalogram, 8 functional MRI, 9 diffusion tensor imaging 10 data, but there are very few studies focusing on network alterations in the continuum of AD using MRI data. In our work, we have performed a comparative analysis in terms of various graph theoretic measures of structural brain networks in normal controls, MCI, and Alzheimer’s patients using MRI data. To perform a structural whole-brain connectivity analysis, 11 it is necessary to define the brain Atlas. In our analysis, we have used the Desikan Atlas, 11 which has 68 brain regions.
Methods
Subjects
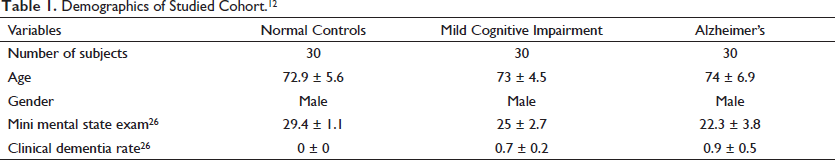
In our study, we have used the MRI data obtained from the ADNI database, 12 available at adni.loni.usc.edu. For our analysis, we have taken the MRI data of 90 subjects, out of which 30 were normal controls, 30 were MCI, and 30 were Alzheimer patients. Table 1 provides relevant details about the database 12 used in our study.
Demographics of Studied Cohort. 12
MRI Acquisition
The data were obtained from the ADNI database 12 where all the participants have gone through an MRI scan of 1.5T using a T1-weighted magnetization prepared rapid gradient echo 13 sequence having repetition time (TR) = 9−14 ms, echo time (TE) = 3.2−4 ms, inversion time (IT) = 900 ms, flip angle = 7 degrees, and voxel size = 1 × 1 × 1.2 mm3.
Image Processing
All MRI data were preprocessed using the Free-surfer tool,
14
which is freely available at
Graphical Analysis
The graph theoretical analysis means obtaining brain graphs from human MRI data18, 19 (simply image data). The whole analysis comprises three main steps.
Network Construction
Network construction implies building the structural connectivity matrix 7 from MRI data. To obtain the connectivity matrix, 20 first of all, the raw MRI data was preprocessed. This preprocessing 21 involves several steps such as realignment, magnetic field homogeneity correction, registration, and segmentation. After carrying out preprocessing steps, the cortical thickness 22 was extracted for each brain region for each of the subjects listed in Table 1, so the nodes 23 in the connectivity matrix correspond to brain regions of the atlas 11 employed in the analysis. The edges were calculated as the correlation coefficient 9 of the value of cortical thickness extracted earlier (for each of the three cases separately, namely normal controls, MCI, and Alzheimer’s) between pairs of brain regions across the group of subjects. Therefore, the structural connectivity matrix was obtained for each group of subjects, 30 in each category. 24 So the connectivity matrix was built such that rows and columns represent brain regions, and entries represent correlation coefficients between cortical thicknesses for each pair of brain regions. 25
Network Analysis
Once we have the structural connectivity matrix at our disposal, we can calculate various graph theoretic measures, or brain measures 26 that assess the topology of the whole brain network. These brain measures are degree, 7 which is the average number of connections a node has with the rest of the network or the total number of edges connected to a node; characteristic path length 7 is the average distance from a node to all other nodes; clustering coefficient 7 is a fraction of triangles present around a node; global efficiency 7 is the average of the inverse shortest path length from a node to all other nodes; and strength 7 is the sum of weights of all the edges connected to a node.
Network Implications
The network implication implies the pattern of brain graphs that depict early changes within individuals over time, depicting the alterations 27 in network topology.
Results and Discussion
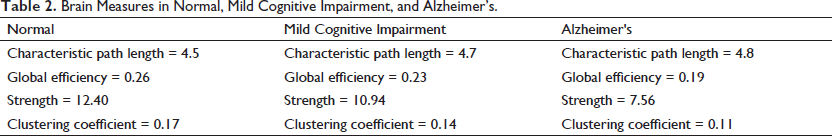
As mentioned earlier, after preprocessing the MRI data for all three cases, namely normal controls, MCI, and Alzheimer’s, connectivity matrices are computed. The connectivity matrices are used to compute various graph theoretic measures, mentioned in subsection “Network Analysis” and tabulated in Table 2. These graph theoretic measures were computed using the brain connectivity toolbox 28 (brain-connectivity-toolbox.net), which is a MATLAB-based toolbox. The results so obtained suggest that these measures could act as biomarkers of AD. In Alzheimer’s, the observable brain measures are increased in characteristic path length and reduced in global efficiency, strength, and clustering coefficient, which differentiates Alzheimer’s from normal controls. It is also interesting to note that values for MCI (Table 2) fall in between, suggesting continuity in the degradation process, which may be exploited to quantify the measure of degradation.
Brain Measures in Normal, Mild Cognitive Impairment, and Alzheimer’s.
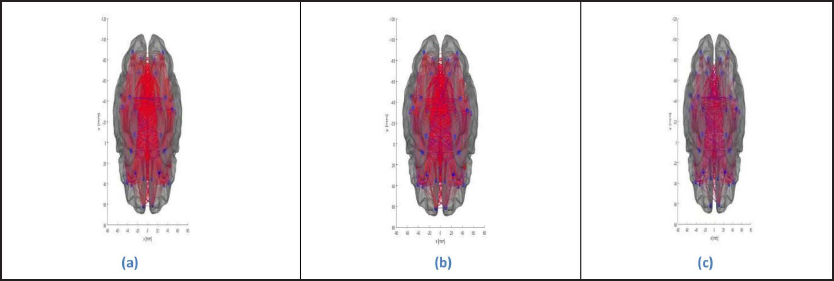
The brain graphs were obtained as presented in Figure 1a–c, which represents the structural connectivity pattern in the cases of normal controls, MCI, and Alzheimer’s, respectively, describing the degradation process in terms of strength of connection and number of connections connecting various brain regions (Table 2). In normal controls, a much more organized and consistent network is obtained, depicting high connectivity strength; on the other hand, in MCI, the connectivity strength declines, and in the case of Alzheimer’s, a more random and disconnected network is obtained. In particular, the connections are disconnected between
Interhemispheric frontal poles Interhemispheric lateral occipital lobes Intrahemispheric frontal poles and pars orbitalis Intrahemispheric lateral occipital lobes and superior temporal sulcus.
(a) Brain Graph of Normal controls. (b) Brain Graph of Mild Cognitive Impairment. (c) Brain Graph of Alzheimer’s.
Receiver Operating Characteristic and Area Under the Receiver Operating Characteristic Analysis
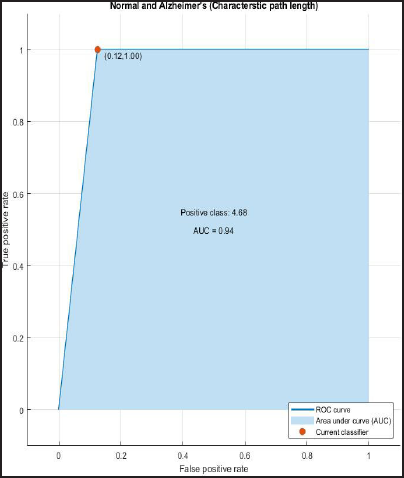
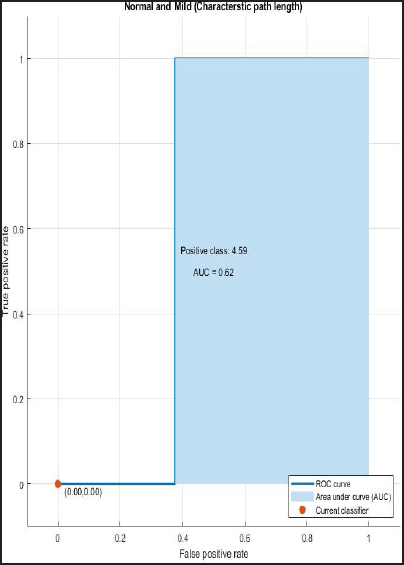
ROC and AUROC analysis of (normal and Alzheimer’s) and (normal and mild) considering characteristic path length (Figures 2 and 3).
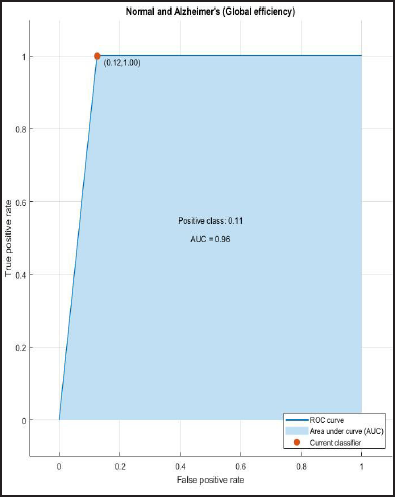
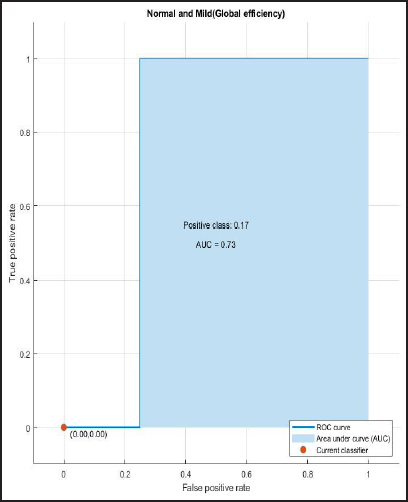
ROC and AUROC analysis of (normal and Alzheimer’s) and (normal and mild) considering global efficiency (Figures 4 and 5).
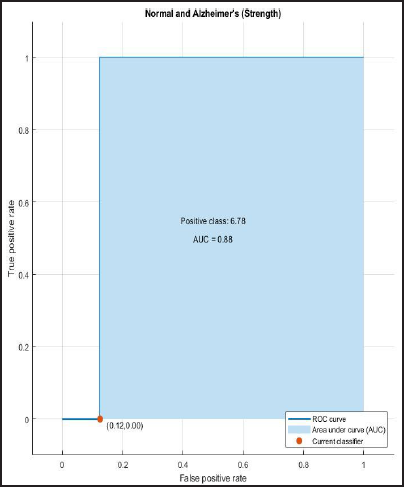
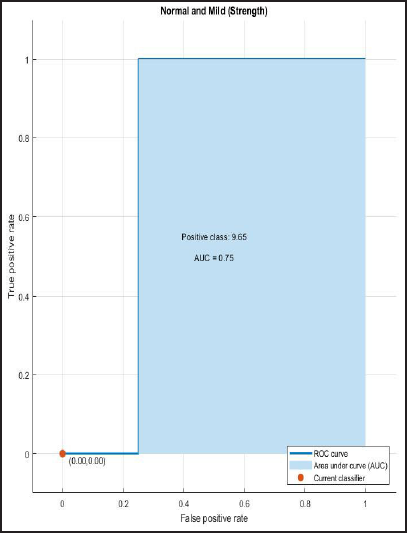
ROC and AUROC analysis of (normal and Alzheimer’s) and (normal and mild) considering strength (Figures 6 and 7).
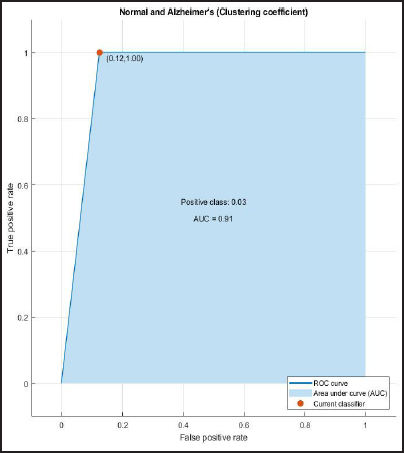
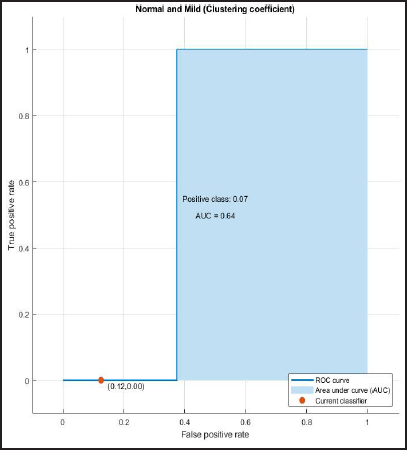
ROC and AUROC analysis of (normal and Alzheimer’s) and (normal and mild) considering clustering coefficient (Figures 8 and 9).
ROC Curve of Normal and Alzheimer’s having AUC = 0.94.
ROC Curve of Normal and Mild Having AUC = 0.62.
ROC Curve of Normal and Alzheimer’s Having AUC = 0.96.
ROC Curve of Normal and Mild Having AUC = 0.73.
ROC curve of Normal and Alzheimer’s having AUC=0.88.
ROC Curve of Normal and Mild Having AUC = 0.75.
ROC Curve of Normal and Alzheimer’s Having AUC = 0.91.
ROC Curve of Normal and Mild Having AUC = 0.64.
Logistic Analysis
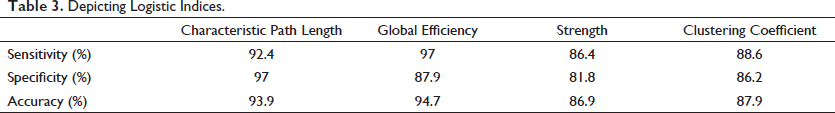
In the logistic analysis, we have calculated the diagnostic test indices
7
as depicted in Table 3 for each graph theoretic measure for Alzheimer’s versus normal which are:
Sensitivity Specificity Accuracy.
Depicting Logistic Indices.
The logistic analysis can be best explained by the following example depicting the sensitivity and specificity at various values of one of the graphic theoretical measures, that is, the characteristic path length for the detection of Alzheimer’s (Table 4).
An Example Depicting the Sensitivity and Specificity at Various Values of One of the Graphical Measure, that is, Characteristic Path Length for Detection of Alzheimer’s.
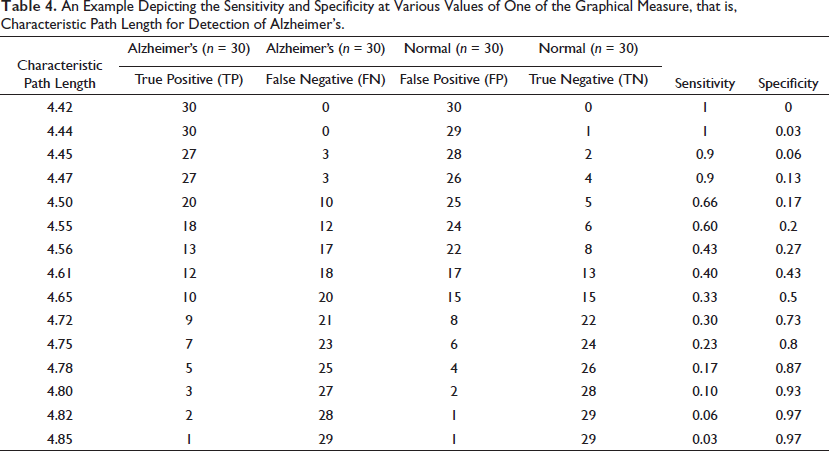
Sensitivity = TP/(TP+FN)
Specificity= TN/(TN+FP)
Accuracy = (TN+TP)/(TN+TP+FN+FP).
So calculated the diagnostic test indices for each graph theoretic measure for Alzheimer’s versus normal, which are: sensitivity, specificity and accuracy are depicted in Table 3.
Conclusion
The analysis presented shows that the amalgamation of structural MRI with graph theory may help in the early diagnosis of AD. It is observed that the calculated brain measures (characteristic path length, global efficiency, strength, and clustering coefficient) and the brain graphs clearly distinguish Alzheimer’s from normal controls. All these findings suggest that alterations in network topology and various brain measures may act as quantitative biomarkers of AD. Also, since the values of graph measures for MCI fall in between, we conjecture that the continuous variations in these measures could be exploited to quantify the degree of degradation.
Further studies with a large patient cohort should evaluate and validate the diagnostic certainty of these brain measures. Also, further implementation could be done to analyze the structural connectivity of the brain and alterations in network topology by focusing on specific brain regions such as sub-cortical regions and the hippocampus.
Appendix A
Mathematical formulation and explanation of calculated brain measures:
The 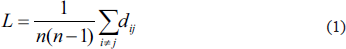
where n = total number of nodes and dij is the shortest distance between node i and node j computed using Dijkstra’s algorithm.
The 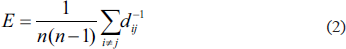
The 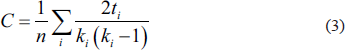
here ki = degree of node i, ti = number of triangles around node i and
The 
where aij are corresponding weights.
Footnotes
Data Availability
The data used in preparation of this article were obtained from the ADNI and is available with permission to all researchers.
Acknowledgements
This work is supported by Ministry of Education (MoE), formerly the Ministry of Human Resource Development (1985–2020), Government of India. And a sincere thanks to ADNI for providing us the access of their valuable database.
Authors’ Contribution
Rakhi Sharma: conceptualization, methodology, software, and writing-original draft. Shiv Dutt Joshi: conceptualization, methodology, and supervision.
Statement of Ethics
All the data were obtained from ADNI database, 12 available at (adni.loni.usc.edu). Informed consent from the patients is obtained before assessment is carried out by ADNI study team and this study is secondary data analysis of the ADNI data collection. The data access and usage are within the ADNI data use agreements.
Declaration of Conflicting Interests
The authors declared no potential conflicts of interest with respect to the research, authorship, and/or publication of this article.
Funding
The authors received no financial support for the research, authorship and/or publication of this article.