
Abstract
This article examines the link between financial literacy and financial inclusion in India between 2015 and 2018 using household-level survey data. We explore heterogeneities by gender using data from households with female respondents. We find a strong and positive association between financial literacy and inclusion, and a small positive impact of the demonetization policy and the Pradhan Mantri Jan Dhan Yojana on inclusion. The subgroup analyses suggest that these associations are driven by men, those residing in the eastern states of India and belonging to the upper two quintiles of the wealth distribution. Limitations of the current work and implications for policy are discussed.
1. Introduction
Financial inclusion (FI) programs and interventions have gained popularity in the last decade as a tool for poverty alleviation and empowerment of the marginalized, including women and historically marginalized caste groups. Governments worldwide have looked expanding access to formal financial services. India, at the time of the setting for this article, has steadily rolled out various policies to increase access to formal financial services since 2014, especially to the rural population. For example, launched in 2014, the Pradhan Mantri Jan Dhan Yojana (PMJDY) has facilitated the opening of more than 300 million bank accounts in rural areas alone (Government of India, 2022). There have also been policies aimed at increasing the coverage of the formal financial system and widening the tax base (e.g., the withdrawal of high-value banknotes in 2016, also known as demonetization, and the introduction of the Goods and Services Tax, or GST, in 2017). Despite such policies, gaps in FI and knowledge persist, particularly among women. This has resulted in a lack of active use of bank accounts or other financial instruments, such as digital payments (Arora, 2016; Baluja, 2016; Fonseca et al., 2012; Klapper et al., 2016; OECD, 2013). Data from the Global Findex Database (Demirgüç-Kunt et al., 2022) shows that India has made steady progress in bridging the gender gap in account ownership, but overall account ownership (a common way to define FI) has dipped in 2021. As has been highlighted elsewhere, financial literacy (FL; especially among women) is critical to bridging such gender gaps (Singh, 2018).
This article aims to empirically investigate the relationship between FL and FI in the Indian context and examine whether this relationship is heterogeneous by gender and a range of other sociodemographic characteristics. In order to investigate this relationship, we use large-scale survey data available between 2015 and 2018, a period in which substantial policy changes related to FI have taken place. We define FL as one’s ability to utilize their knowledge of financial resources and use them to their fullest potential. Typically, FL is measured using respondents’ ability to count and undertake basic arithmetic calculations, knowledge about financial concepts, and attitudes toward formal financial services, and it is rated along a spectrum. It has been suggested that FL determines financial decision-making, especially related to savings and financial transactions (Alsemgeest, 2015; Khan et al., 2022). According to recent estimates by Dash and Ranjan (2023), there is spatial variation in FL across India, but on average 38.5% are considered to be financially knowledgeable. By examining how FL influences FI, particularly for women, we also aim to inform policy efforts to improve financial access and usage in India. 1
While there are many working definitions of FI, in this article, we define it as ownership of a bank account. An individual is considered to be financially included if they own a bank account in their own name. Earlier work suggests that adult bank account ownership, although increasing, is still low (Demirguc-Kunt et al., 2013), which could be shaped by their ability and knowledge of financial instruments (i.e., FL). As Lusardi and Mitchell (2014) suggest, there may be wide variations in how individuals acquire such knowledge as well as how they use it to access formal financial services. Thus, the link between FL and FI operates through both supply- and demand-side factors. We outline how each of these play a role and how they have been studied in the literature in what follows.
Typically, access to financial institutions primarily explain FI, proxied by the distance to the nearest banks and/or the density of financial institutions (Ghosh, 2019, 2020). These are primarily supply-side factors, though there are some studies in the Indian context that also discuss demand-side issues. For example, Kumar et al. (2019) establish that education, employment status, income, and gender norms are associated with FI more strongly than its supply counterparts. They also find that income and employment status have a stronger association with a household’s FI in urban areas. In rural sectors, female-led houses and socially deprived classes are less likely to use formal financial services than male and upper-caste households. Women on average tend to display lower levels of FL than men (Ghosh & Vinod, 2017). Women, in developing economies, are also much less likely to use formal financial services and institutions (Demirguc-Kunt & Klapper, 2012). Lack of economic and physical mobility, regressive patriarchal norms, and unawareness could be attributed to this (Dildar, 2015; Rink et al., 2021; Zaccaria & Guiso, 2020). This suggests that gender plays an important role in the relationship between FL and FI. India is an important context in which we can test this claim, especially since the Government of India has recently implemented several policies that aim to enhance access to financial markets. However, these policies may not have fully taken the gender variegations in the FL–FI link into account during design and implementation.
This study uses pooled cross-sectional survey data between 2015 and 2018 from the Financial Inclusion Insights (FII). Ideally, detailed panel data on household and individual financial behavior from rural India would be useful to test this claim. In the absence of such data, using pooled cross-section data common in other large-scale survey datasets in other domains such as health (e.g., the National Family Health Survey in India) could be useful (Parekh et al., 2022). Using data from more than 150,000 individuals over this four-year period, we apply a linear probability model (LPM) and regress FL on FI using a district fixed-effects approach to account for any unobserved heterogeneity at the district level. We then examine how the relationship between FL and FI changes by gender, poverty status, region, and household wealth. Consistent with the literature, we find a generally positive relationship between FL and FI, but the strength of this relationship varies by gender, region, and wealth status. For instance, we find that being financially knowledgeable is most strongly associated with FI in the highest wealth group. Overall, FI has increased because of policy changes such as demonetization. To the best of our knowledge, this is the first empirical investigation using pooled cross-section data at the individual level to study linkages between FL and FI in India. As per the best of our knowledge, this is among the first to look at relatively recent data and study FI following the demonetization policy event, as well as the implementation of the PMJDY and Goods and Services Tax (GST).
The remainder of the article is organized as follows. Section 2 contains a brief review of the literature on FI and FL from a gendered lens. Section 3 contains a description of the data used. Section 4 provides an overview of the empirical framework. Section 5 provides key results of the association between FL and FI over time. Section 6 concludes and provides implications for FI policy in India.
2. Literature
2.1. Relevance of Financial Inclusion
Financial inclusion or an integration into the formal financial system can reduce transaction costs, improve efficiency of welfare payments, build financial histories to assess creditworthiness, and generate benefits to women (and thus to their households) by way of autonomy and access to funds (Singer et al., 2017). These outcomes related to FI can manifest as reduced poverty (Churchill & Marisetty, 2020). However, the beneficial impacts of FI are likely to be heterogeneous across genders (Saha & Qin, 2023).
Financial deepening and widening, defined as an increase in the number of financial services, products, institutions, and simultaneous increase in access to the same, have since been long associated with economic growth (De Gregorio & Guidotti, 1995). Financial inclusion is considered a prerequisite for empowerment, employment, economic growth, poverty reduction, and social cohesion (Mahendra Dev, 2006). Čihák et al. (2021) in their review of macroeconomic literature on financial stability and FI identify stability imparted by access to (cheap) deposits and diversification as key channels associated with the positive aspects of FI.
2.2. Financial Literacy and Financial Inclusion Linkages
While distance and time (to financial institutions) are observed as some of the more proximate causes of FI (Ghosh, 2019), demand-side factors can also have a bearing on the likelihood of being financially included. Work from developing country contexts such as Kenya (Kodongo, 2018) and Nigeria (Adetunji & David-West, 2019) show strong and positive associations between FL and FI. Higher incomes and better education can warrant a greater demand for FI (Fungáčová & Weill, 2016; Yangdol & Sarma, 2019). There have been studies that look at the links between financial decision-making and inclusion in the context of migrant workers (Kurian et al., 2022), as well as social embeddedness using survey data (Roy & Sapre, 2016). Taking a closer look at education, skills relevant to financial decision-making such as numeracy appear to be more relevant in explaining FI than general literacy (Grohmann et al., 2018). While existing work has used cross-sectional survey data (Ghosh, 2019) and randomized control trials (RCTs; Dalla Pellegrina et al., 2019) to link FL and FI or inclusion with the formal financial system, this article attempts to more rigorously evaluate the association by examining a large multiyear household-level dataset.
2.3. Gendered Perspectives on Financial Inclusion and Financial Literacy
Günther and Ghosh (2018) use the same source as this study, that is, FII survey, but the second wave, based on the year 2014, to quantify the FL of Indian states. Their score finds that female respondents of their study displayed 5.6% lower FL than their male counterparts, and this holds true across variables for different inclusion variables. Lusardi and Mitchell (2008) also find that women’s lower FL further serves as an impediment in their loan market transactions, indicating that there may be downstream impacts of FL on broader definitions of FI.
It is well established that women, at least in the Indian context, display lower levels of FL than men (Günther & Ghosh, 2018). Not just this, but they also have lower confidence in their FL and skills (Heinberg et al., 2014). While women are already at a disadvantage, lower levels of FL further perpetuate the difference between men and women in access and use. For starters, lower levels of FL can hinder women’s economic participation, demand for financial goods, and have an implicit adverse effect on their children. From a macroeconomic perspective, households that accumulate formal financial experience generate greater demand for financial products, and pressure for market transparency, competitiveness, and efficiency; on the other hand, increased wealth accumulation and increases in private savings contribute to economic stability (Heinberg et al., 2014). Thus, we try to assess if FL has any gender heterogeneous effects on FI.
2.4. Public Policy, Financial Inclusion and Their Interactions
Financial market reforms and policies could also affect both FL and FI. For instance, the demonetization policy event in November 2016 (where two high-value banknotes were withdrawn from circulation, followed by a remonetization with a higher value banknote) obliquely aimed at FI via a reduction in black money (i.e., more flows into the formal financial system) and an increase in digital payments (i.e., more bank-linked transactions for payments), among others (Lahiri, 2020). However, its impact on increasing FI appeared temporary, as the core barriers to access to financial resources continue to persist well after demonetization, and that any increase in bank accounts did not have implications for the economy at large (Singh & Ghosh, 2021). Given that the data used for this article were composed of datasets belonging to time periods before, during, and shortly after the policy of demonetization, it is worthwhile and necessary to estimate the effects the policy might have had on FI.
3. Data
We use household-level data from four waves of the FII survey conducted by InterMedia global and funded by the Bill and Melinda Gates Foundation. Each wave of the “tracker” survey is conducted annually starting September or October, and data are available for 2013–2018 (five waves). However, data from the first and second waves (2013 and 2014) do not provide extensive details on FL, which is a focal independent variable in our article. Additionally, the households surveyed across multiple waves are not the same, thus precluding the formation of a panel dataset. Apart from Jammu and Kashmir, Andaman and Nicobar Islands, and the Lakshadweep Islands, data on all states and union territories are available. Since the southern state of Telangana was formed in 2014, data for this state are included within Andhra Pradesh. More details on the sampling strategy and the sample size for each round can be found in Günther and Ghosh (2018).
There are minor variations in the questionnaire and data collected across survey waves in the FII datasets. Thus, we harmonized the survey data at the household level to form pooled cross-sectional data spanning over four years (2015–2018) that include the period during which policy reforms such as demonetization were implemented. The details of the variable harmonization can be found in Tables A1 and A2, alongside the variable definitions.
To compute a measure of FL, we use a simple total of correct answers to questions from the “financial literacy” section of the survey, standardized by wave. The FL score we use is constrained by questions that are available across waves: we, therefore, focus on constructing the score from responses to survey questions on basic arithmetic (counting, addition, subtraction, multiplication, division, and percentage calculations). This is perhaps motivated by the idea that to be able to save, borrow, and invest efficiently, one needs to be able to undertake basic mathematical operations accurately. Furthermore, knowledge about simple and compound interest is also measured in these questions. An additional question in risk diversification is included, and an understanding of inflation and its effects on the purchasing power of one’s income/money is also included in this measure. Figure 1 shows the variation in the standardized FL score by gender and over time. 2 Variable definitions are provided in Table A1.
Financial Literacy Scores by Gender and Year.
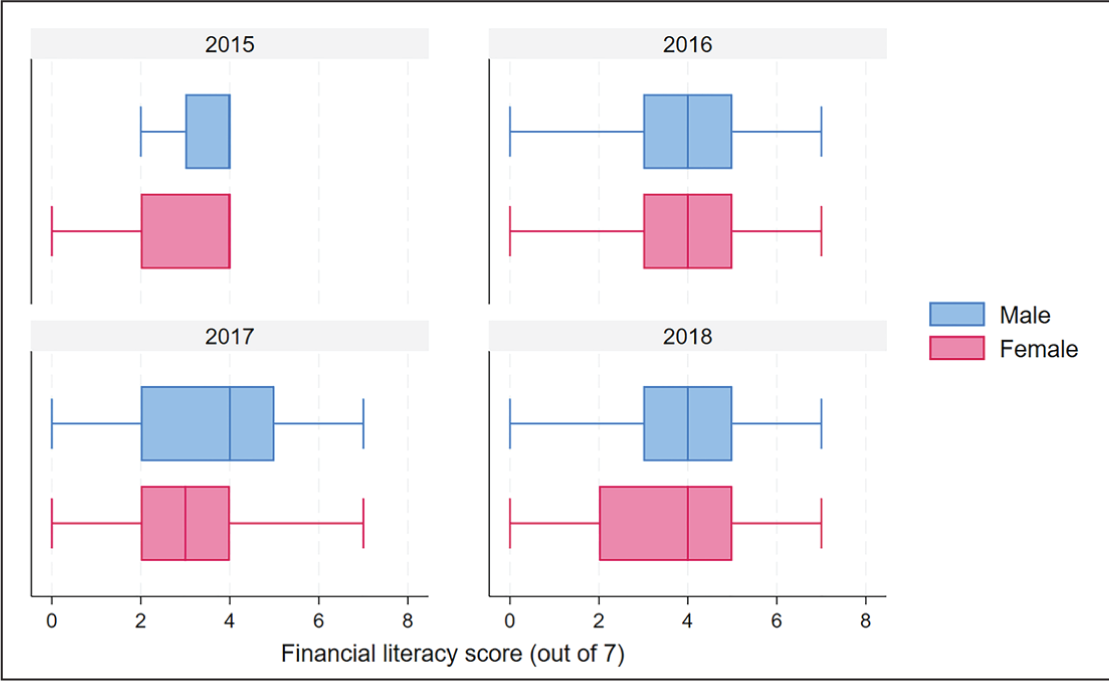
Table 1 presents summary statistics on key variables. On average, a respondent from a household is able to correctly answer at least three questions on FL, and this is statistically significantly different at the 1% level contingent on FI. On average, households in both groups reside no more than half an hour away from the nearest financial institution or automated teller machine (ATM). The average household owns about half of the consumer durables consistently identified across waves. A total 53.7% of the individuals who did not have bank accounts were female, and those with bank accounts are on average about 4 years older than those without bank accounts. In terms of education, nearly 41% of those owning bank accounts reported having at least studied till grade 10, which is compared to around 30% for those without bank accounts, suggesting that educational levels systematically differ between these two groups. On average (across bank account ownership status), we find that 58% have reported mobile phone ownership, which is much higher in the FI group (64.8%). Nearly a third of the sample is engaged in agricultural work, and approximately 85% of our sample identifies as Hindu, and nearly 11% as Muslim. On average, about 68% of the sample is classified as poor as per the $2.5/day poverty line under the Progress out of Poverty Index (PPI). 3
Summary Statistics.
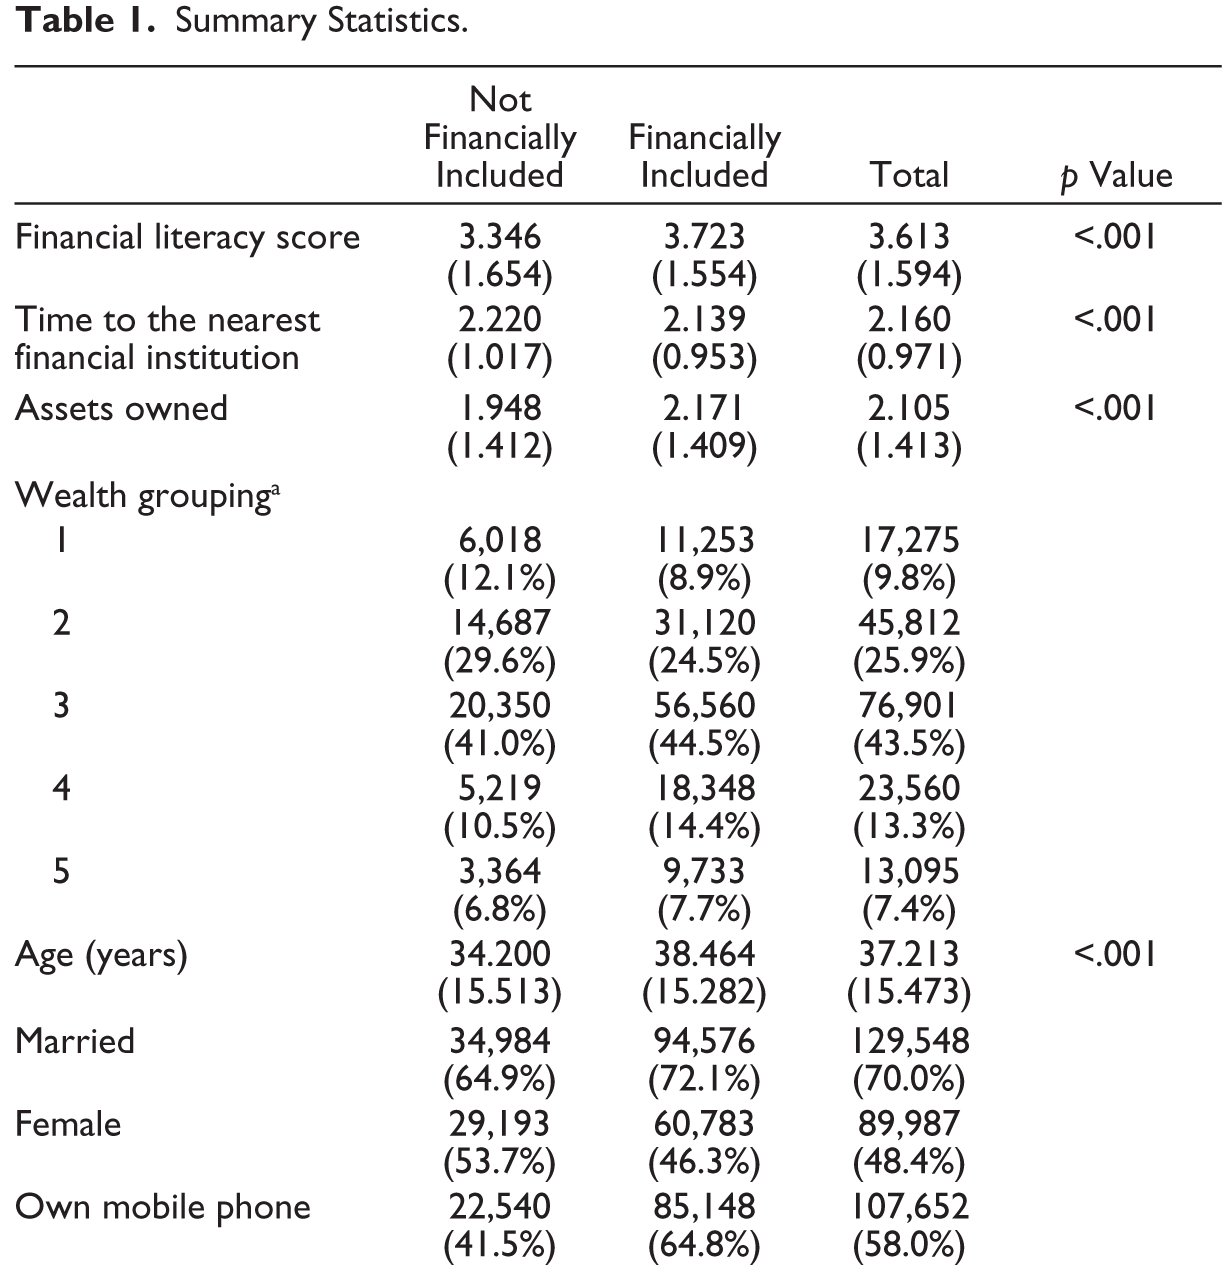
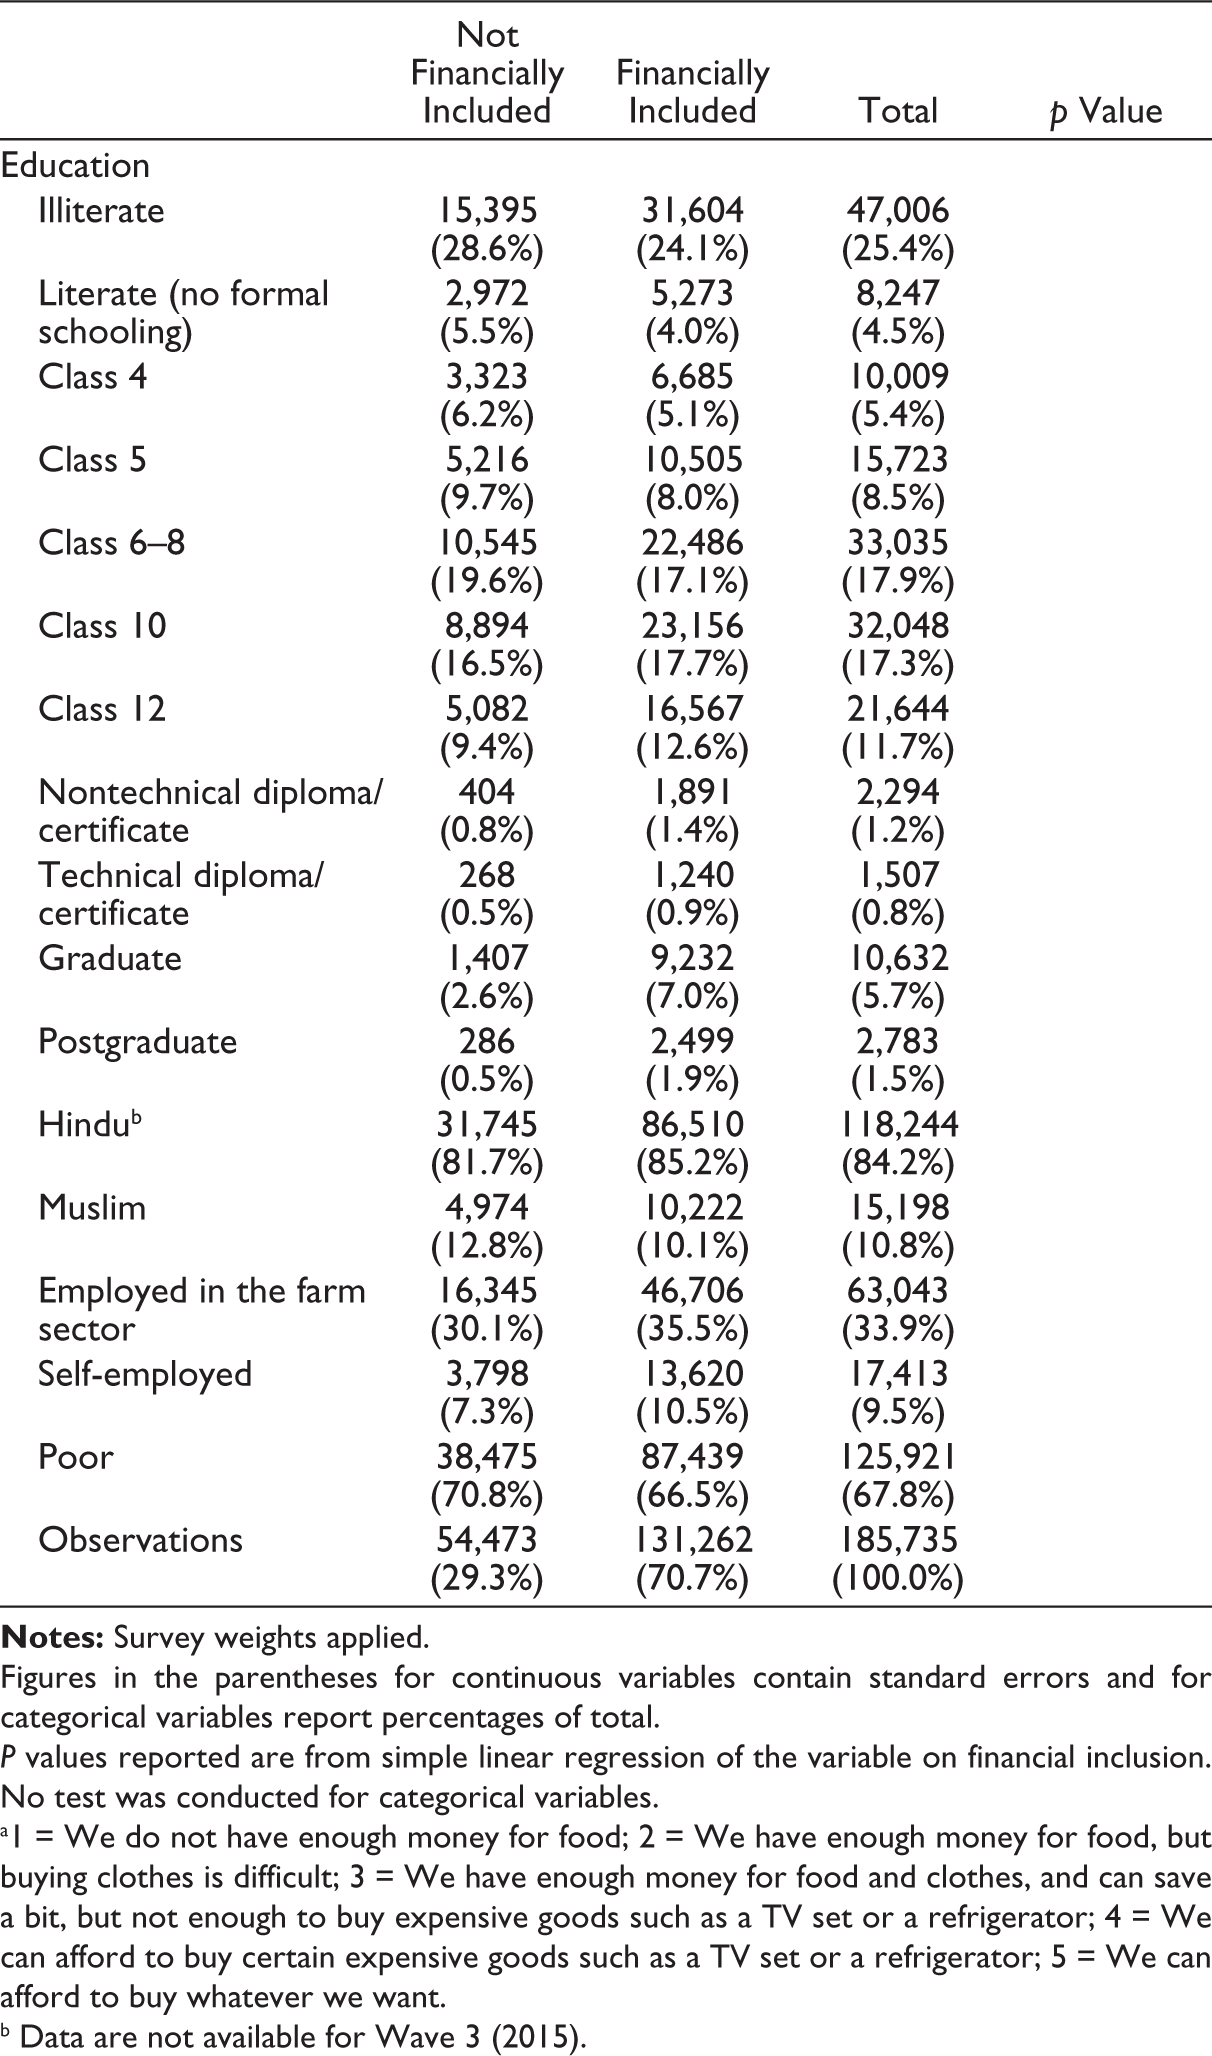
Figures in the parentheses for continuous variables contain standard errors and for categorical variables report percentages of total.
P values reported are from simple linear regression of the variable on financial inclusion. No test was conducted for categorical variables.
a1 = We do not have enough money for food; 2 = We have enough money for food, but buying clothes is difficult; 3 = We have enough money for food and clothes, and can save a bit, but not enough to buy expensive goods such as a TV set or a refrigerator; 4 = We can afford to buy certain expensive goods such as a TV set or a refrigerator; 5 = We can afford to buy whatever we want.
b Data are not available for Wave 3 (2015).
4. Empirical Framework
In order to isolate the relationship between FL and FI, we need to hold constant a range of other factors that could affect FI simultaneously. For instance, there could be systematic changes in FI with age in that older individuals may be more likely to have a bank account regardless of their level of FL. In order to account for this, we use a fixed-effects approach using district fixed effects to unobservable district-level heterogeneities. Furthermore, we conducted a series of diagnostic checks to ensure that our model is valid and robust to test this relationship. In the statistically consistent (without fixed-effects) model, the Bruesch–Pagan/Cook–Weisberg test for heteroskedasticity suggests that heteroskedasticity is present (test statistics = 6236.01, p < .001). To overcome this, we deploy a fixed-effects model with robust standard errors clustered at the level of the household. This ensures that the estimator is efficient and consistent and provides unbiased estimates. Second, we test for multicollinearity in the model using the variance inflation factors. We find that there are only two variables that exhibit high multicollinearity: age and squared age. Since these are correlated by design, we retain them in the model to allow for a test of any nonlinear correlations between age and FI. Finally, the R2 in our full model is 0.104, which is much higher than the R2 of 0.07 in the consistent (but not efficient) model. Thus, in what follows, we outline the approach to estimating a district fixed-effects model with robust standard errors clustered at the level of the household.
We develop and test a regression specification in line with (Günther & Ghosh, 2018) to understand the relationship between the FI (our dependent variable) and FL scores (our focal independent variable), access to financial institutions (measured by time taken to the nearest financial institution), wealth, age, marital status, gender, level of education, employment in agriculture, self-employment, and demonetization. The model is as presented in Equation (1):

where FI ist is a dummy variable that takes the value 1 if the respondent from household i residing in the sth state has a bank account to their name at time t, otherwise taking the value 0; FL ist is the standardized FL score for the respondent from household i residing in the sth state at time t; Tim ist is the average of the relative proximity to the nearest bank, ATM, mobile money agent/kiosk, or community group offering banking services (measured as a continuous variable but with discrete groups; see Table A1 for more information); Xist is a vector of household and individual control variables, including household wealth, employment status, marital status, gender, and education. This is meant to capture some of the socioeconomic determinants of FI and savings in India (Rampal & Biswas, 2022). Finally, Demonetization it is a dummy variable that takes a value of 0 prior to 2016 and 1 after, and PMJDY st captures the number of new accounts opened under PMJDY in the sth state at time t, capturing a broad indicator of PMJDY rollout across states and over time
To specifically explore the role of female FL, we conduct a heterogeneity analysis separately for years in which respondents to the survey identified as female, and compare it to those in which respondents identified as male. Additionally, we consider heterogeneity analysis by poverty status, region, 4 and wealth to check for variations in the FL–FI relationship between the subsamples.
Equation (1) is run using a fixed-effects regression, with fixed effects for districts, to control for unobservables that may differ across districts that are not being captured in the model. Specifically, we use the -reghdfe- command (Correia, 2019) in Stata 18 with clustered standard errors at the district level. Survey weights provided in the dataset were applied.
It is important to emphasize here that we are unable to ascertain causality or attribute changes to FI that are explained solely by FL. There could be various other factors that could shift FI levels at the district level. For example, the rollout of the PMJDY coincides with the data collected in this period, but we do not have supply side data at the district level with regard to PMJDY and instead use state-level variations in accounts opened to account for any state-level variations in FI policies. Note that using the PMJDY data at the state level means that we cannot use district fixed effects. We therefore restrict our main findings to the estimation with PMJDY, and the heterogeneous analyses do not include the PMJDY accounts variable.
5. Results
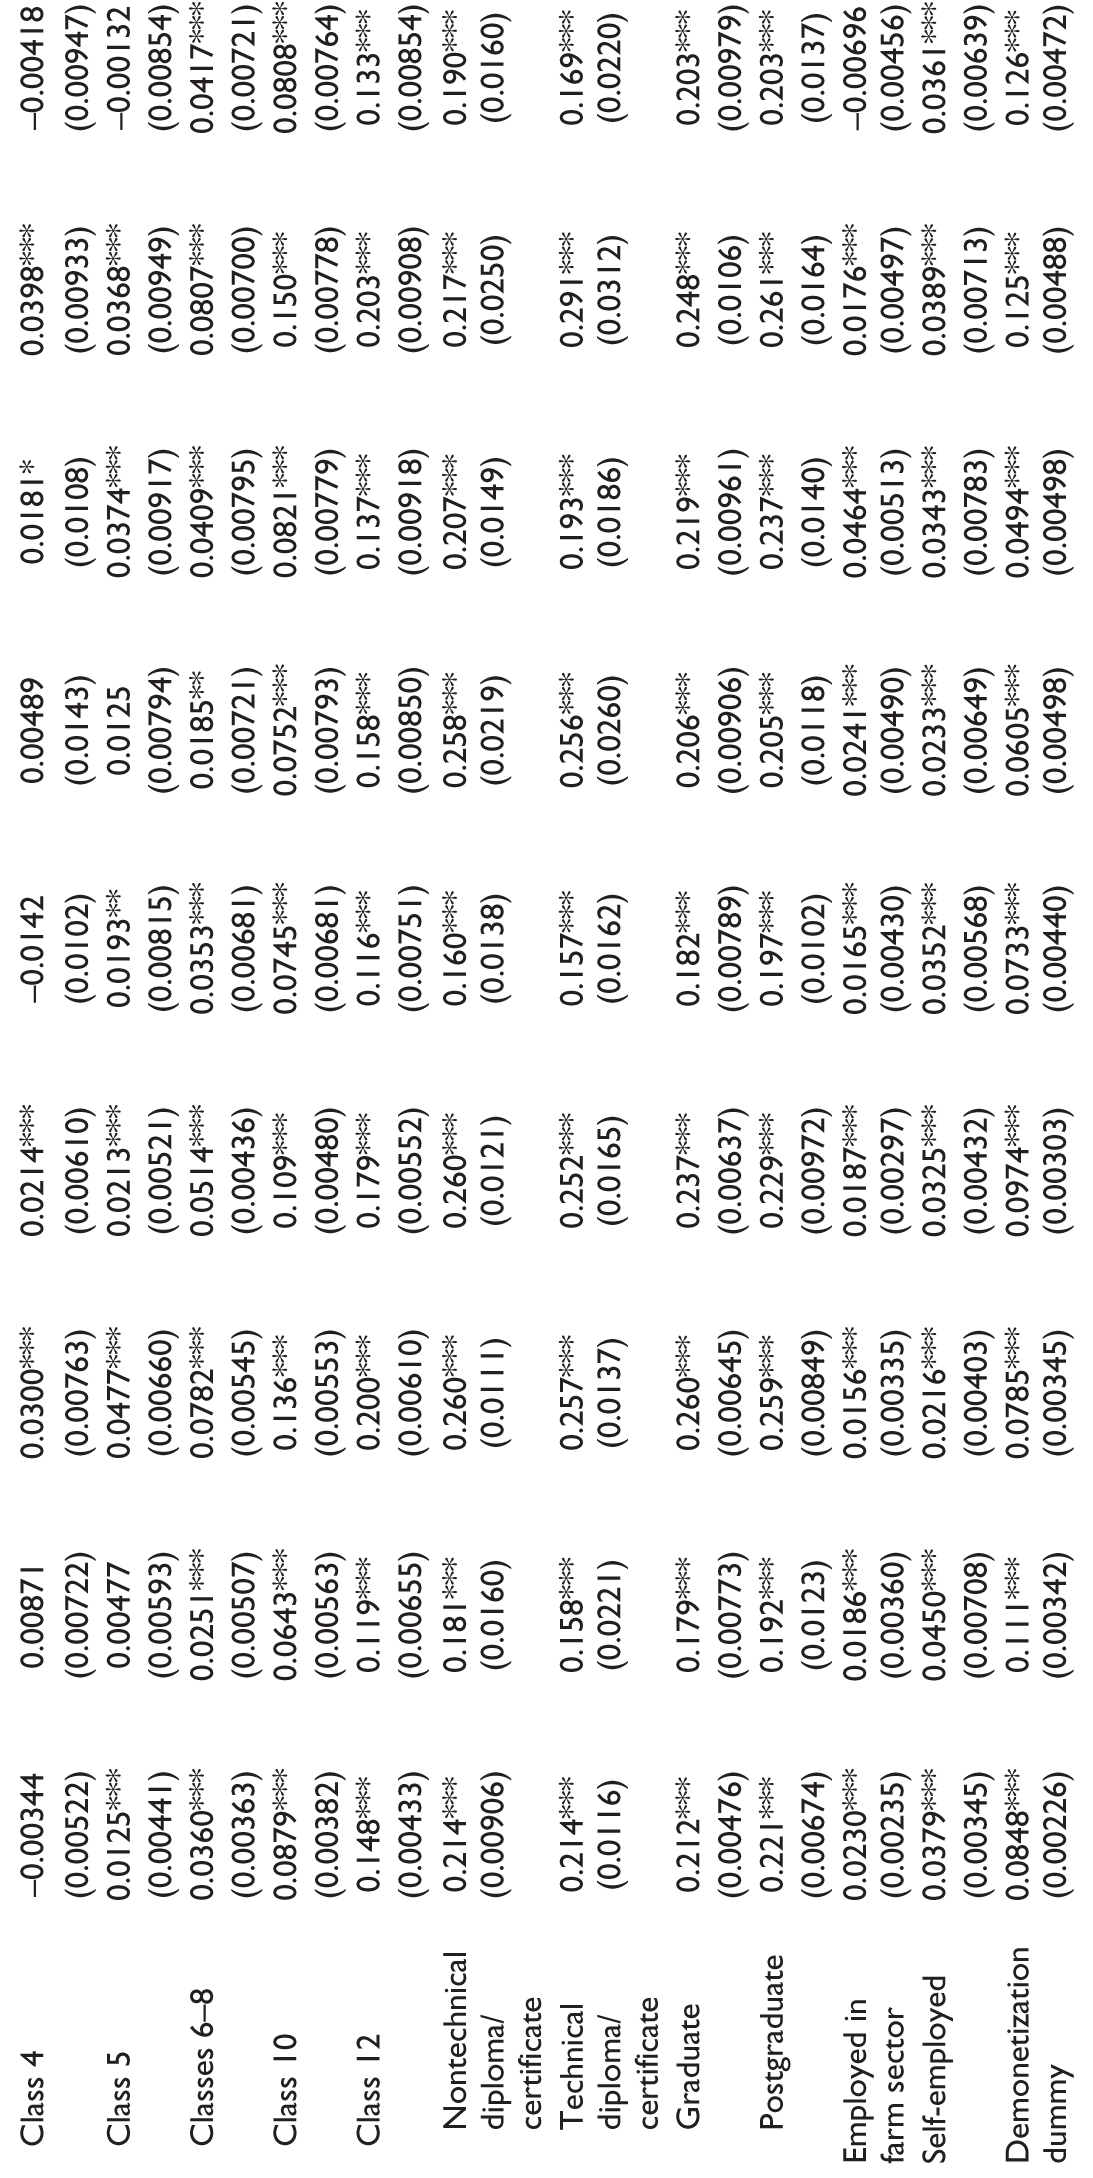
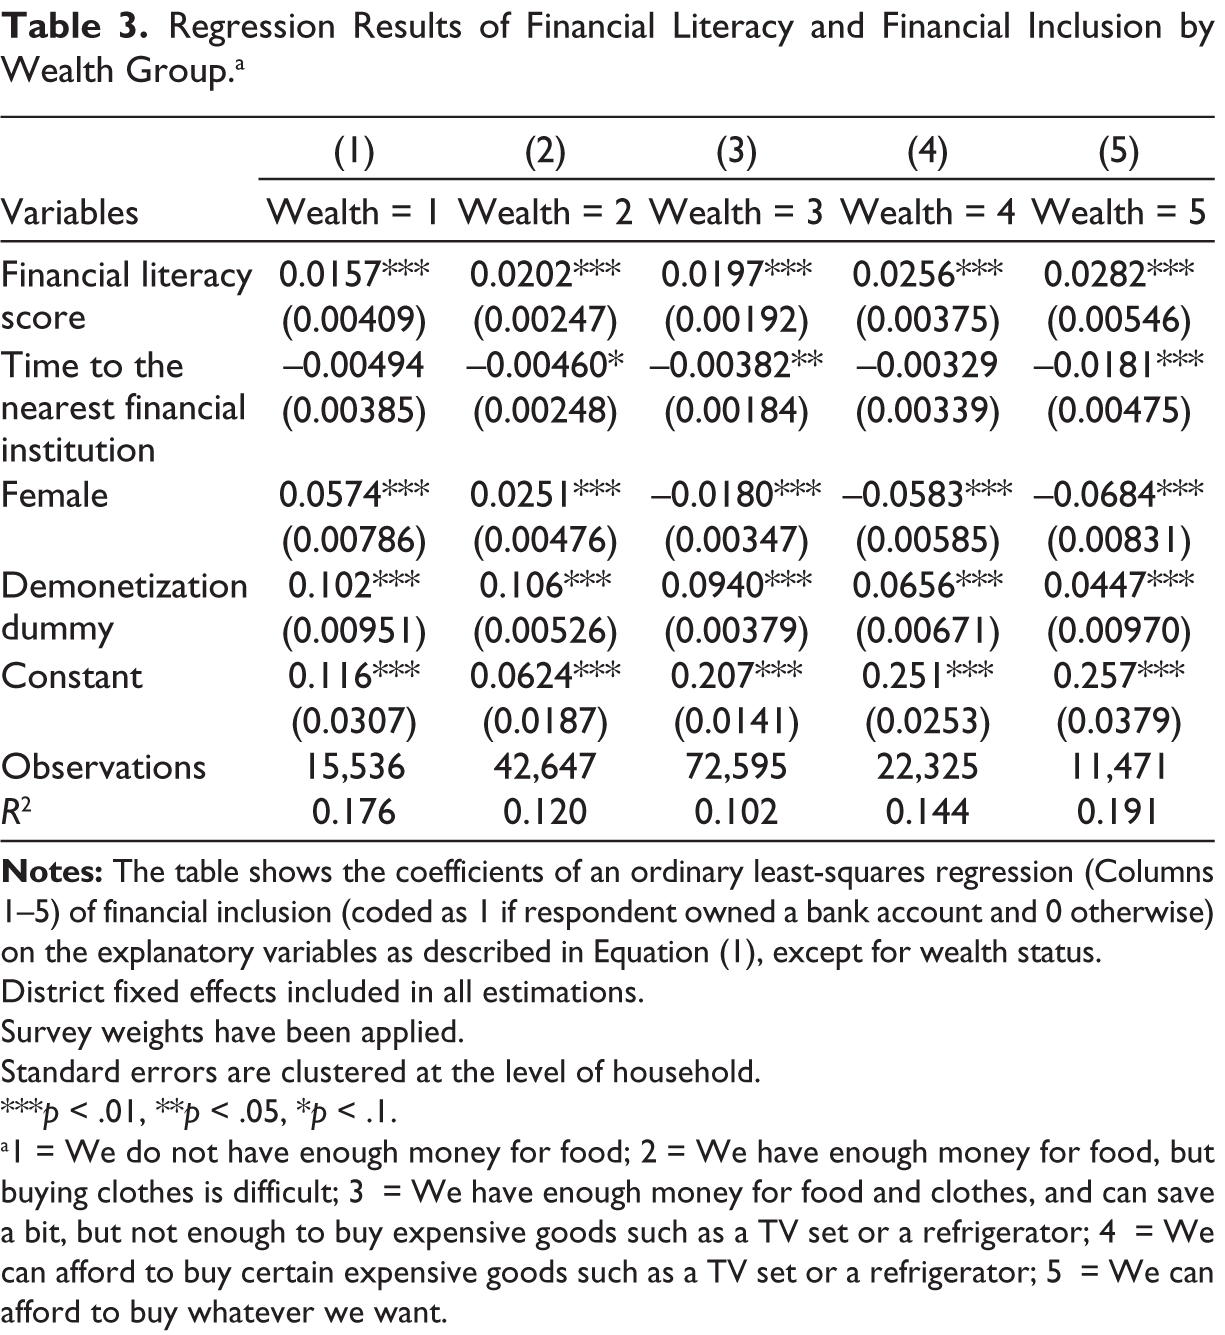
The results of the main specification are displayed in Table 2. Column 1 contains the pooled estimates including PMJDY and no district fixed effects, and the remaining columns contain district fixed effects without PMJDY. Notably, the standardized FL scores are positively associated with FI, with a standard deviation increase in the FL scores being associated with a 2.2 percentage point increase in FI. This does nominally reflect findings in other papers in various country contexts (Adetunji & David-West, 2019; Grohmann et al., 2018; Kodongo, 2018; Koomson et al., 2020; Morgan & Long, 2020), though we are able to report similar results even when defining FI in a narrow manner.
Regression Results of Financial Literacy on Financial Inclusion.
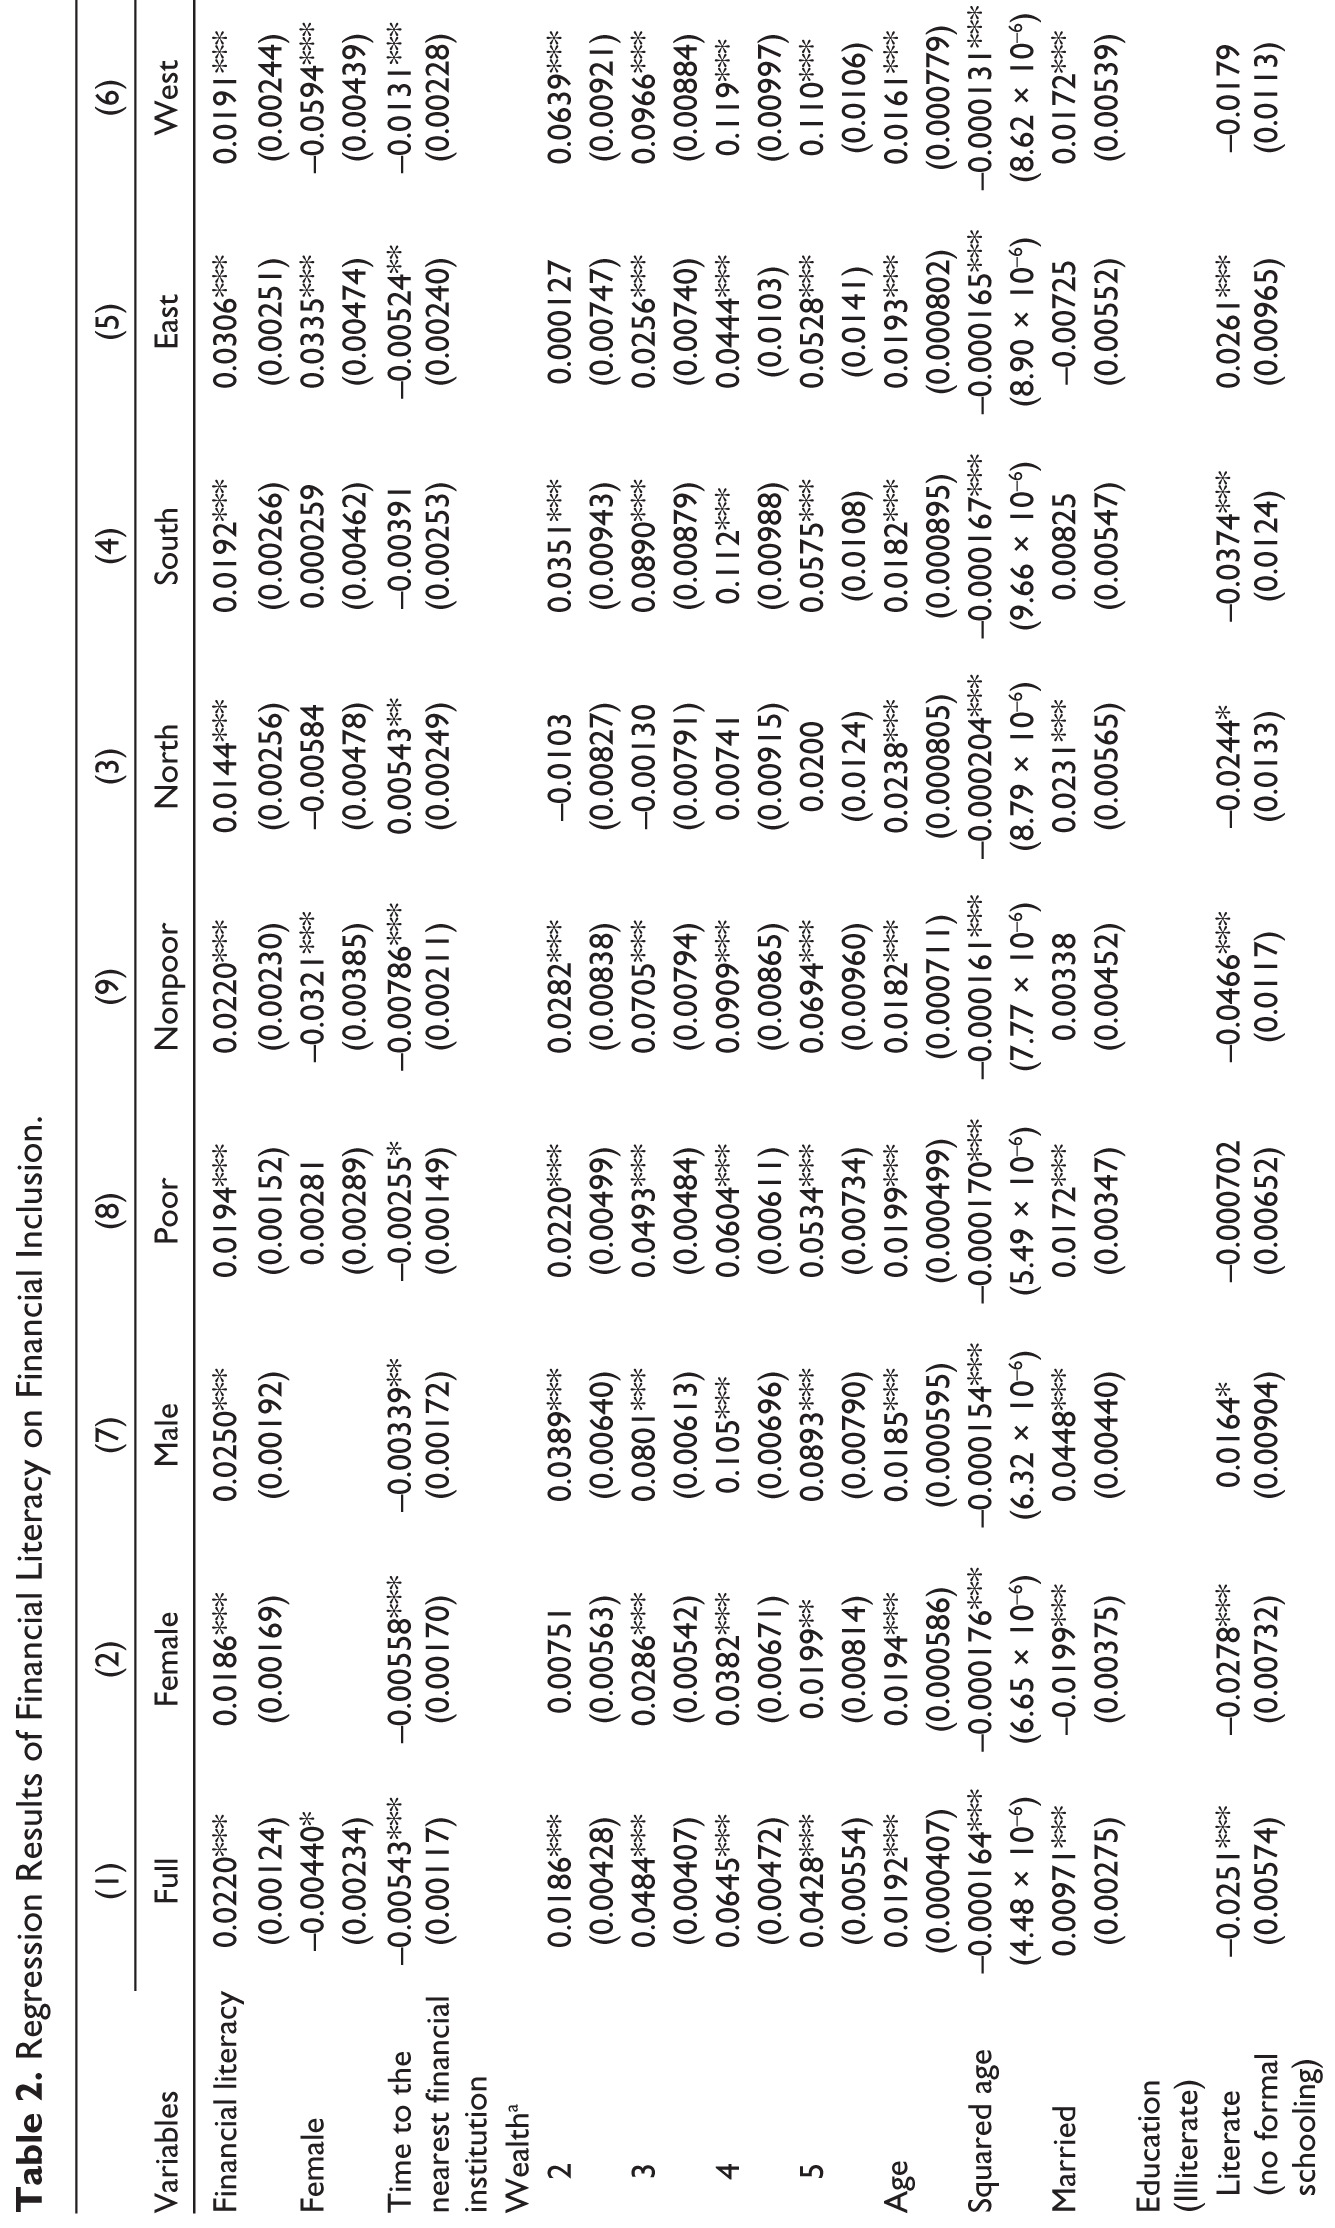
District fixed effects included in all estimations.
Survey weights have been applied.
Standard errors are clustered at the level of household.
***p < .01, **p < .05, *p < .1.
1We do not have enough money for food; 2 = We have enough money for food, but buying clothes is difficult; 3 = We have enough money for food and clothes, and can save a bit, but not enough to buy expensive goods such as a TV set or a refrigerator; 4 = We can afford to buy certain expensive goods such as a TV set or a refrigerator; 5 = We can afford to buy whatever we want.
All of the variables included in the main estimation show some level of statistical significance, though it is to be noted that time to financial institutions and female are negatively related, suggesting accessibility and gender-based impediments in FI. Age of an individual is positively related to FL, and its squared counterpart has a negative coefficient, suggesting nonlinearities in associations. Higher levels of education appear to have a large positive and statistically significant association with the probability of FI of nearly 20–22 percentage points at the highest levels.
With regard to the policy of demonetization, we find a small but significant increase in the probability of FI (8.5 percentage points) in the model without round fixed effects. This reflects the contribution of demonetization, in the short run, to push households to own and operate bank accounts as well as transact using noncash alternatives. There is evidence from Lahiri (2020) that demonetization was a short-run shock to the economy, and given that our data only extend to 2018, we cannot explore any longer term impacts of the policy. Similarly, PMJDY rollout (as captured by the accounts opened at the state level under the scheme) was positively associated with FI (Column 1). On average, we find a 1.5 percentage point increase in the likelihood of owning a bank account associated with PMJDY. There has been relatively little evidence thus far on the positive links between PMJDY and account ownership, although the positive push toward FI via the program has been documented elsewhere (Singh et al., 2021).
Looking at heterogeneity results by gender, the association between FL and FI continues to hold; in fact, it holds across all subsample analyses. For women, the impact of FL on FI is at a smaller probability relative to men (1.8 percentage points for women versus 2.5 percentage points for men).
These results contrast to those from papers that have conducted similar heterogeneity analysis on country-level data (Grohmann et al., 2018) or by approaching the study as an RCT (Koomson et al., 2020). It can be argued that RCTs capture effects from FL that women would have otherwise not received (thus leading to higher FI), while country-level data might have embedded country-wise differences in gender-based opportunities in acquiring FL. In a study of urban women in Punjab, Bhatia and Singh (2019) find that schemes such as PMJDY have promoted more financial autonomy for women and led to their inclusion. Thus, looking at household data with adequate controls might represent what effect FL, that men or women can naturally access, has on FI.
Turning to results with district fixed effects (and without the PMJDY variable), we conduct a series of heterogeneous analyses to check variations in the FL–FI relationship. At 1.9 percentage points, FL has a marginally smaller probability of increasing the probability of FI among those defined as poor, relative to those who are not. Demonetization is also associated with a relatively large probability for FI among the poor than the nonpoor (9.7 percentage points versus 7.3 percentage points).
Looking at heterogeneity analysis by region, as mentioned before, the association between FI and FL continues to hold across regions, with the East region having a slightly higher probability (3 percentage points) than other regions. The impact of demonetization on FI is felt stronger in the East (12.5 percentage points) and West (12.6 percentage points) regions than other regions in terms of the main estimation. This may be explained by the fact that time taken to access the nearest banking facilities in these regions was higher than the average of 30 min for the overall sample. Thus, lower financial system penetration (Yadav & Reddy, 2023) could explain the disproportionate impacts of demonetization on FI in these regions.
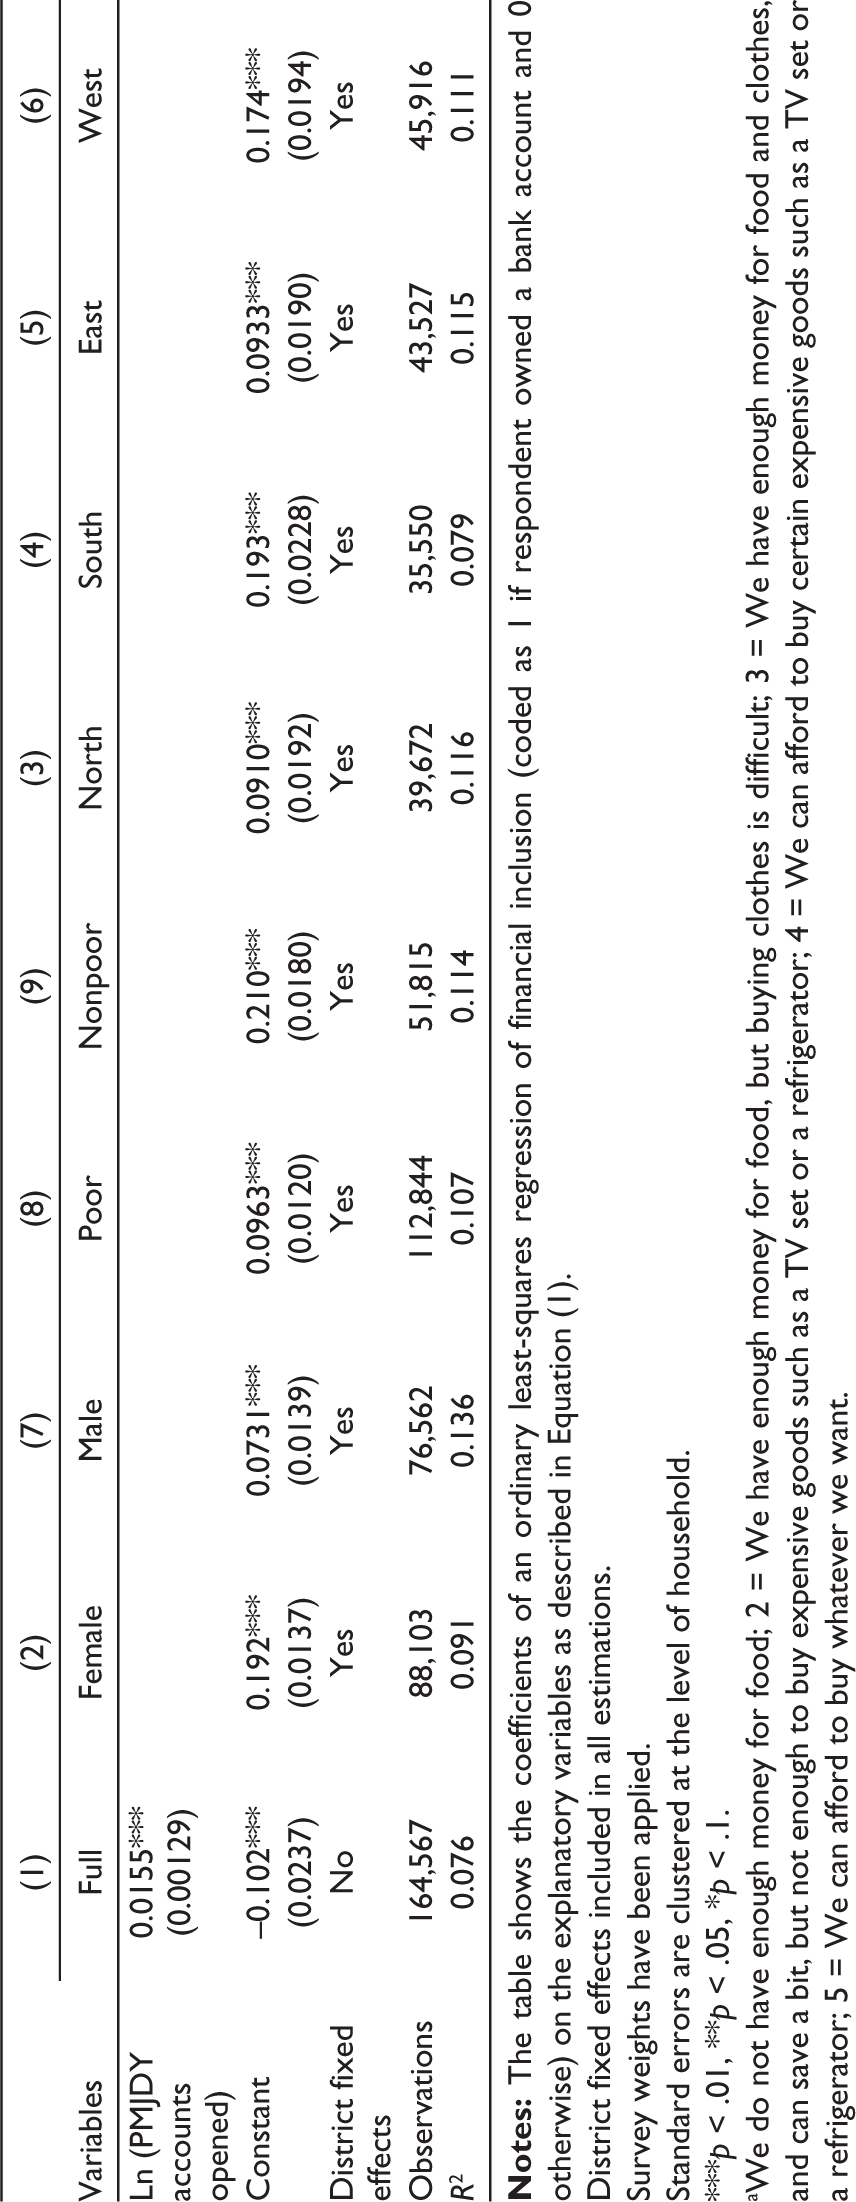
Looking at heterogeneity analysis by wealth (Table 3), the association between FL and FI continues to be positive and significant (around 1.5–2.8 percentage points). On the other hand, demonetization has had a bigger impact for those at the lower end of wealth than at the higher end (10.2 percentage points at the lowest end versus 4.4 percentage points at the higher end), providing support to the idea that demonetization as a policy brought those operating in the informal economy into the formal economy (Chodorow-Reich et al., 2020).
Regression Results of Financial Literacy and Financial Inclusion by Wealth Group.a
District fixed effects included in all estimations.
Survey weights have been applied.
Standard errors are clustered at the level of household.
***p < .01, **p < .05, *p < .1.
a1 = We do not have enough money for food; 2 = We have enough money for food, but buying clothes is difficult; 3 = We have enough money for food and clothes, and can save a bit, but not enough to buy expensive goods such as a TV set or a refrigerator; 4 = We can afford to buy certain expensive goods such as a TV set or a refrigerator; 5 = We can afford to buy whatever we want.
6. Conclusion and Implications for Policy
Our study has shown the association between FL and FI at the household level in India between 2015 and 2018. Given the strong and positive association between FL and FI, there are clear implications for ongoing policies in this domain. Other factors that matter for FI suggest that married women have a lower probability of FI, self-employed women have a higher probability of FI than their male counterparts, and higher levels of education being associated with higher probability of FI for women. In terms of policy correlates (a first test of these in the literature), we find that demonetization and PMJDY were both positively linked with FI. Heterogenous analyses indicate that the positive links between FL and FI are driven by males, nonpoor, and those households in the top two quintiles of the wealth distribution. In terms of regions, we find the link between FL and FI to be strongest for the Eastern region states, where banking system penetration remains somewhat low.
Thus, targeted literacy programs toward women may have substantial benefits in terms of improving reach of the formal financial system. There have been various randomized control trials that suggest similar findings, although literacy does not necessarily guarantee the inclusion and operation of bank accounts across the board (Clark et al., 2018; Dalla Pellegrina et al., 2019; Hastings et al., 2013; Kaiser & Menkhoff, 2017). Thus, targeted literacy training programs may be warranted in this regard.
This study relied on household-level analysis to determine the associations between financial literacy and financial inclusion. One of the key limitations of the current study is that we are unable to account explicitly for various other time- and district-variant factors that could also be associated with financial inclusion and resort to fixed effects to control for some of these. Furthermore, these districts are not necessarily nationally representative in any way, thus limiting the external validity of the findings. Future work can build on this by using the unit-level data and forming a longer term panel to study changes in the relationship between literacy and inclusion in India.
Footnotes
Acknowledgements
We are grateful to Dr. Parthajit Kayal and an anonymous referee for comments and suggestions. We acknowledge work by Ananya Acharya on an earlier version of this manuscript. We are grateful to Samuel Schueth and Financial Inclusion Insights for sharing their data for this project.
Authors’ Note
The data used in this article can be accessed upon request to the authors. All errors are solely attributable to the authors.
Declaration of Conflicting Interests
The authors declared no potential conflicts of interest concerning the research, authorship, and/or publication of this article.
Funding
The authors received no financial support for the research, authorship, and/or publication of this article.
Appendix A
Wave-wise Dataset Variables Used.
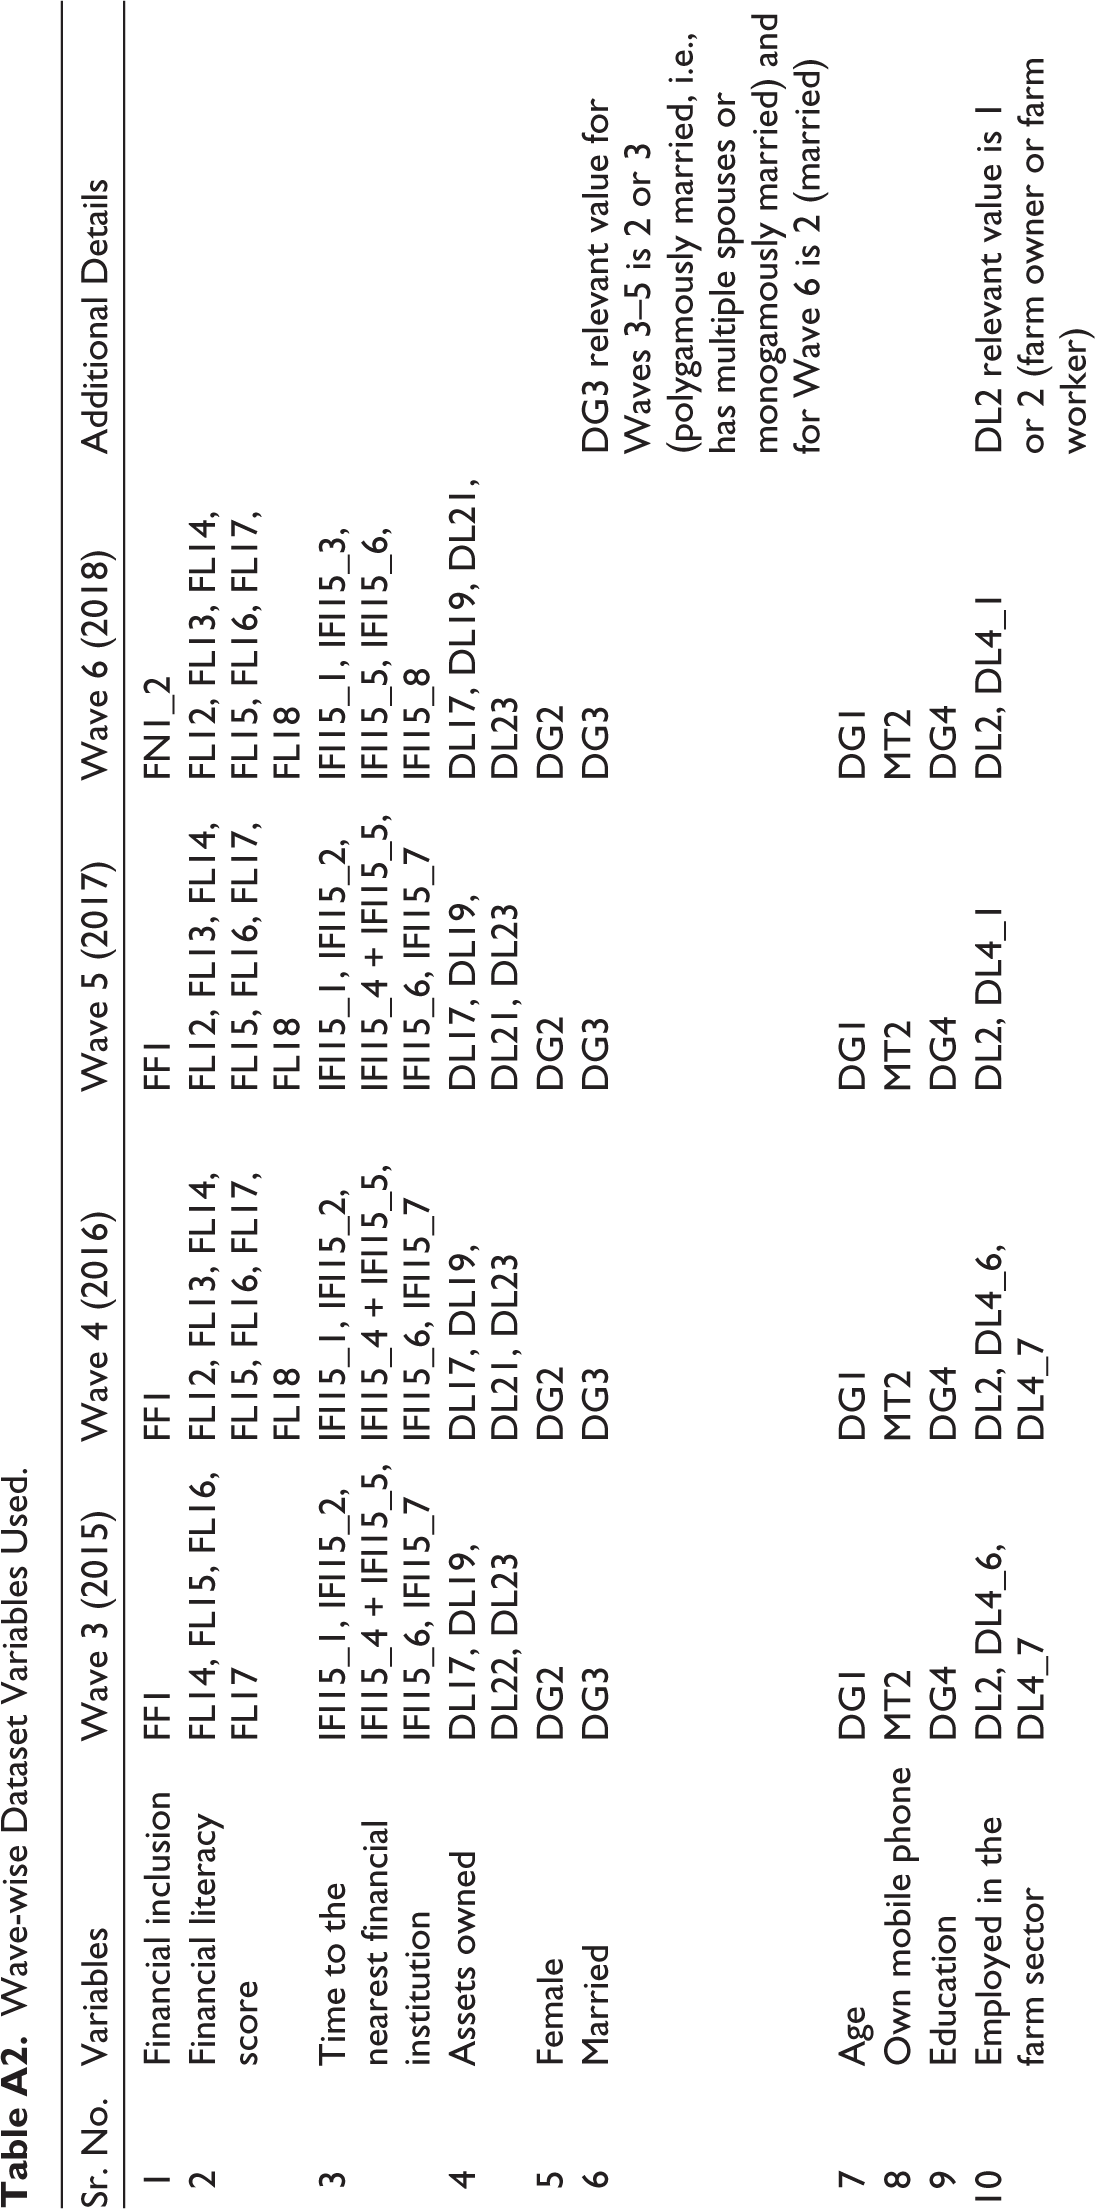
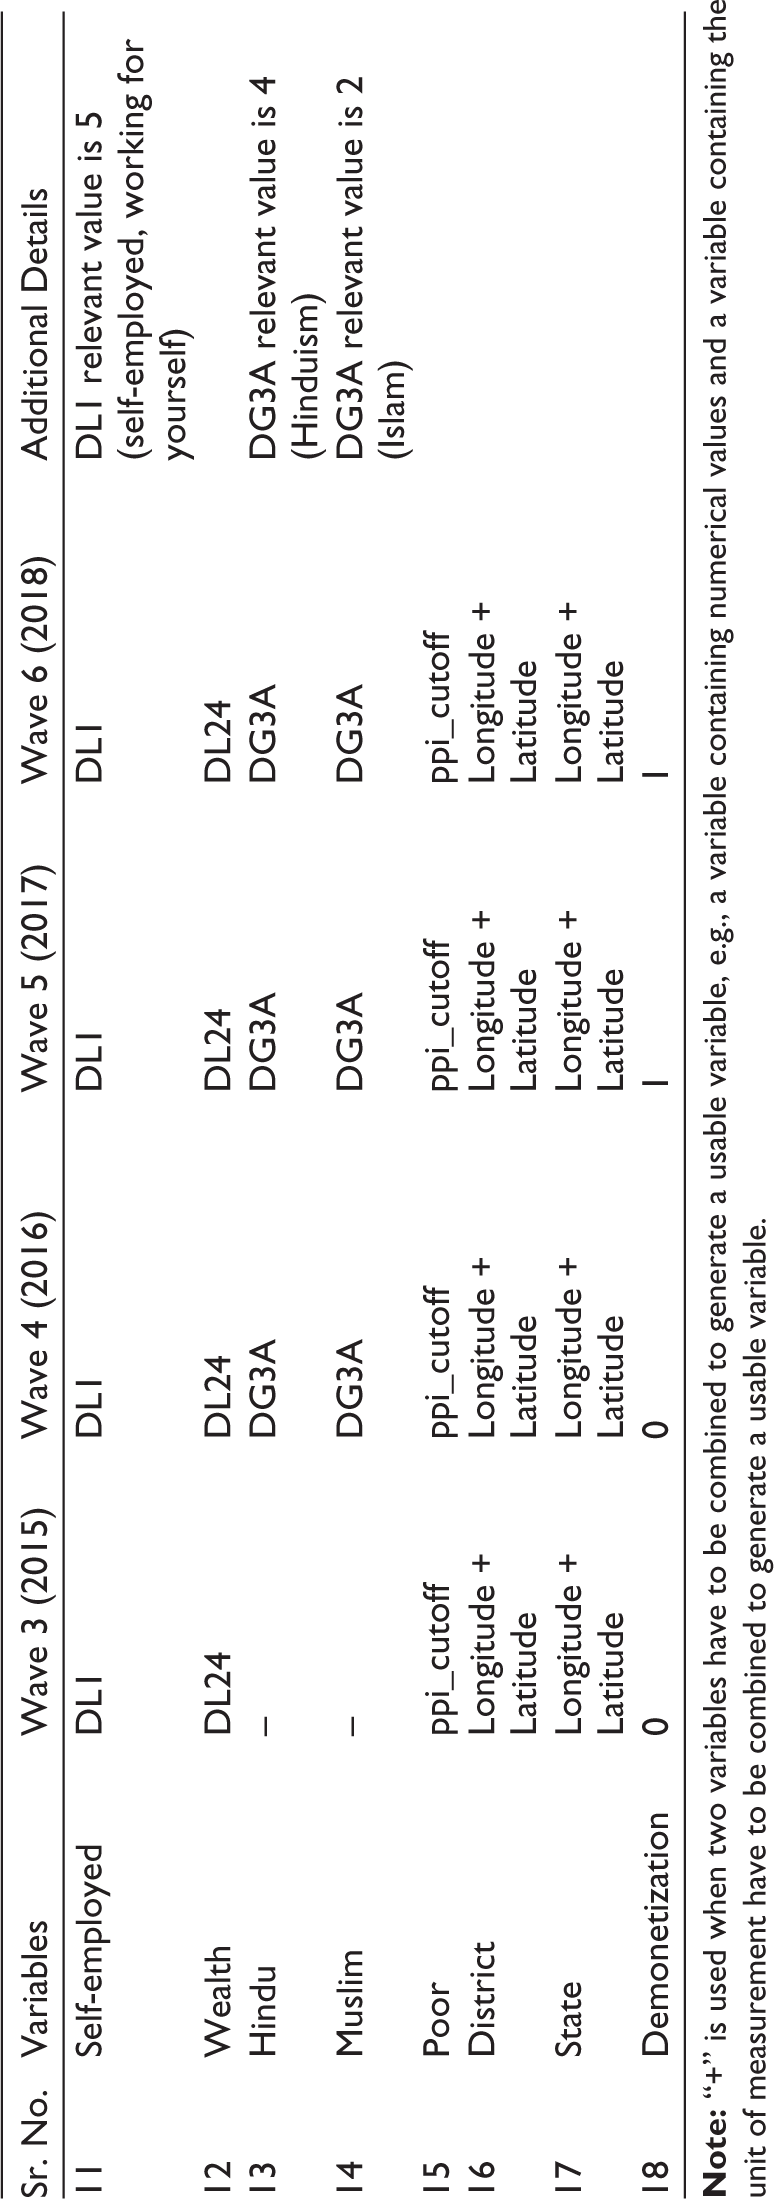
| Sr. No. | Variables | Wave 3 (2015) | Wave 4 (2016) | Wave 5 (2017) | Wave 6 (2018) | Additional Details |
| 1 | Financial inclusion | FF1 | FF1 | FF1 | FN1_2 | |
| 2 | Financial literacy score | FL14, FL15, FL16, FL17 | FL12, FL13, FL14, FL15, FL16, FL17, FL18 | FL12, FL13, FL14, FL15, FL16, FL17, FL18 | FL12, FL13, FL14, FL15, FL16, FL17, FL18 | |
| 3 | Time to the nearest financial institution | IFI15_1, IFI15_2, IFI15_4 + IFI15_5, IFI15_6, IFI15_7 | IFI15_1, IFI15_2, IFI15_4 + IFI15_5, IFI15_6, IFI15_7 | IFI15_1, IFI15_2, IFI15_4 + IFI15_5, IFI15_6, IFI15_7 | IFI15_1, IFI15_3, IFI15_5, IFI15_6, IFI15_8 | |
| 4 | Assets owned | DL17, DL19, DL22, DL23 | DL17, DL19, DL21, DL23 | DL17, DL19, DL21, DL23 | DL17, DL19, DL21, DL23 | |
| 5 | Female | DG2 | DG2 | DG2 | DG2 | |
| 6 | Married | DG3 | DG3 | DG3 | DG3 | DG3 relevant value for Waves 3–5 is 2 or 3 (polygamously married, i.e., has multiple spouses or monogamously married) and for Wave 6 is 2 (married) |
| 7 | Age | DG1 | DG1 | DG1 | DG1 | |
| 8 | Own mobile phone | MT2 | MT2 | MT2 | MT2 | |
| 9 | Education | DG4 | DG4 | DG4 | DG4 | |
| 10 | Employed in the farm sector | DL2, DL4_6, DL4_7 | DL2, DL4_6, DL4_7 | DL2, DL4_1 | DL2, DL4_1 | DL2 relevant value is 1 or 2 (farm owner or farm worker) |
| 11 | Self-employed | DL1 | DL1 | DL1 | DL1 | DL1 relevant value is 5 (self-employed, working for yourself) |
| 12 | Wealth | DL24 | DL24 | DL24 | DL24 | |
| 13 | Hindu | – | DG3A | DG3A | DG3A | DG3A relevant value is 4 (Hinduism) |
| 14 | Muslim | – | DG3A | DG3A | DG3A | DG3A relevant value is 2 (Islam) |
| 15 | Poor | ppi_cutoff | ppi_cutoff | ppi_cutoff | ppi_cutoff | |
| 16 | District | Longitude + Latitude | Longitude + Latitude | Longitude + Latitude | Longitude + Latitude | |
| 17 | State | Longitude + Latitude | Longitude + Latitude | Longitude + Latitude | Longitude + Latitude | |
| 18 | Demonetization | 0 | 0 | 1 | 1 |