
Abstract
This study analyses the impact of a weighted measure of public sentiment about firms on their stock price movement using a sample of 5.4 million tweets from the official Twitter handles of the 437 largest Indian firms. This article contributes to the literature by finding that general public discussion about firms and the resulting sentiment impact firms’ stock price movement in India. Moreover, the impact is greater during trading hours than off-market hours due to immediate action by traders in the former. It is also found that negative public sentiment has a more significant impact than positive sentiment on returns and volatility.
1. Introduction
Financial disclosures and analyst reports are the most frequently referred documents for information about stock markets (Barber & Odean, 2013). However, news propagation through mass and social media channels also provides valuable information to investors (Renault, 2017; Ryan & Taffler, 2004; Teti et al., 2019). Several researchers have studied the impact of news and firm-specific discussions obtained from various sources on stock prices. The most preferred sources are business newspapers and journals (e.g., Berry & Howe, 1994; Ryan & Taffler, 2004), Google search volume index (e.g., Da et al., 2011; Graham et al., 2019), and social media (e.g., Bollen et al., 2011; Dong & Gil-Bazo, 2020; Renault, 2017; Zhang et al., 2011).
With the World Wide Web availability to the masses, propagation, and discussion of news have become pervasive, resulting in an increased likelihood of contagions. Therefore, analysis of public sentiment toward firms through social media activities has gained prominence in explaining the impact of the sentiments on stock prices (e.g., Sul et al., 2017). Public sentiment analysis shows how information is propagated, validated, and finally assimilated into stock prices (Kundu & Banerjee, 2021).
Twitter is a popular social media platform that the public can use for open discussions about firms based on news and speculation. Unlike previous studies focusing on microblogs or social media platforms hosted for discussing stock prices (e.g., Deng et al., 2018), this article considers the impact of broader public sentiment conveyed through Twitter activities on stock returns and volatility in the Indian context. Few earlier studies in the Indian context were conducted either at the index level or with small samples of firms (e.g., Nayak et al., 2016; Ranjan et al., 2018). In an index-based study, stock-specific idiosyncrasies are not accounted for because it captures only systematic risk. Emotions associated with various stocks greatly vary (Baker & Wurgler, 2007) and cannot be proxied by an aggregated emotion toward an index. Hence, this study analyses a large cross-section of stocks rather than an index.
This study uses a sample of 437 firms to analyse whether firm- specific public sentiment proxied by Twitter activity, precisely a weighted measure of positive and negative “sentiment strengths,” can explain the movement of stock prices at trading and non-trading periods of the day.
The Indian stock market, with many low-liquidity stocks (Naik et al., 2020), differs from developed markets and can be a proxy for similar developing markets. India is a unique emerging market with free capital flows, advanced trading and settlement mechanisms, and the second-largest social media user base. 1 Thus, any findings in the Indian context relate to a larger global audience. Further, with the third-largest 1 Twitter user base, India has the largest user base among developing nations. However, it is a market with less depth in terms of liquidity, like many developing countries. Hence, findings from India can also provide a comprehensive outlook for all developing countries. Thus, a comprehensive study of the impact of Twitter sentiment on the Indian market adds value to the literature.
Literature is also sparse about whether public sentiment prevailing during market hours and accumulating during off-market hours impacts stock prices differently. Thus, the sample has been divided into off-market and market hours to analyse any difference in the impact of public sentiment on stock prices in these two periods. The overall impact of Twitter activities on day-to-day stock price movements is also analysed. This approach and the resultant findings of this article are novel and add value to the extant literature.
This article employs panel data methodology on a large sample of over 5.4 million tweets about listed Indian firms. The panel data are analysed using the system generalized methods of moments (GMM) estimator (Blundell & Bond, 1998) to account for the autocorrelation in stock returns and volatility.
Results suggest that public sentiment significantly impacts stock returns and volatility after controlling for the benchmark stock index returns and volatility. The impact is found to be greater during trading hours than off-market hours. Negative public sentiment has a greater impact on stock returns and volatility in all periods. This article adds to the still-nascent literature on this topic. This article is the first extensive study in the Indian setting that analyses stock-specific sentiment at the firm level. The results are substantial for managers, investors, and society.
Section 2 of this article briefly discusses the extant literature. Section 3 builds the theoretical background and forms the hypotheses of the study. Section 4 describes the data and methodology for empirical analysis. Section 5 presents the findings, and a discussion of their implications is presented in Section 6. Finally, Section 7 presents the study’s conclusion and the scope for future research.
2. Review of Literature
Publicly available information is long known to be the key driver of stock prices because news affects investors’ sentiment, influencing their buy/sell decision in the stock market. Researchers (e.g., Berry & Howe, 1994) found that news and media information significantly impacted stock price movement in both intraday and extended periods. Ryan and Taffler (2004) found that corporate news announcements and analyst opinions impact stock prices. Perez-Liston et al. (2018) found that investor sentiment strongly predicts stock price movements.
Rubin and Rubin (2010) explain that the Internet is the most inexpensive medium for information dispersal. Thus, greater public involvement in information gathering about a firm results in more accurate analyst forecasts. Researchers (Da et al., 2011; Graham et al., 2019; Swamy & Dharani, 2019) use Google search volume index (GSVI) data on firms in developed and emerging markets like India and reveal that investors’ search behavior regarding a certain stock or index can help predict excess returns and volatility with greater accuracy. Some researchers (e.g., Chaudhuri & Kayal, 2022) have rejected GSVI as a reliable predictor of stock price movements.
Researchers have analysed the relationship between social media discussions and stock price movements. Deng et al. (2018) used user comments posted on the StockTwits website between 2010 and 2014 to study the impact of investor sentiment on the Dow Jones Industrial Average (DJIA) index. Several researchers have used the Sina Weibo social media platform (Dong & Gil-Bazo, 2020; Sun et al., 2020) to examine the impact of public sentiment on stock prices in the Chinese stock markets. Dong and Gil-Bazo (2020) used stock-specific chats between 2013 and 2014 on Sina Weibo to analyse the impact of public sentiment on abnormal stock returns and found that positive sentiment conveyed by social media has a greater impact on stock returns. Sun et al. (2020) extracted chats on real estate stocks from Sina Weibo for the last quarter of 2015 and revealed that social media activity helps in information propagation about stocks.
Twitter is a prominent social media platform that researchers use to gather data about investor sentiment on social media. Zhang et al. (2011) found that emotions expressed by Twitter users regarding stock markets significantly affected various stock indices in the United States on the following day. Another study by Bollen et al. (2011) reveals that analysing the “public mood” through Twitter activities can increase stock index prediction accuracy.
Yang et al. (2015) found that analysing the tweets of financial communities within Twitter makes it possible to get a more robust prediction of stock market movements. Stock microblogs (Sprenger et al., 2014) devoted to discussing news about stocks indicate investors’ sentiment toward those stocks. Similarly, Renault (2017) found that investor sentiment conveyed by investors’ Twitter activities helps predict intraday index returns (S&P 500). On the contrary, Behrendt and Schmidt (2018) found that the sentiment conveyed by Twitter may not have sufficient predictive power in the intraday stock markets.
In the Indian context, a few papers have tried machine learning (ML)-based sentiment analysis with data from Twitter and some stock market blogs to predict the movement of stock prices of banks (Ranjan et al., 2018) and stock indices like NIFTY and Sensex (Bhardwaj et al., 2015), as well as a few chosen companies from different sectors (Nayak et al., 2016). However, for an extensive cross-section of stocks, the dependence of stock returns on Twitter activity is still not established in the Indian context. This study uses available social media information in the form of Twitter activity to explore the possible impact of the volume of social media interactions on the price movement of a large sample of stocks in the Indian context.
3. Theoretical Background and Formation of Hypotheses
Important information about a firm will likely be tweeted, liked, and retweeted more often. Public tweets about a firm and their sentiments may mirror the public sentiment about the firm. The following theoretical derivation helps to explain the role of information in the movement of stock prices:
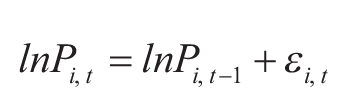
Equation (1) is a simple random walk model, where the log of the stock price of a firm i for the period t (ln Pi, t) is determined by the log of the stock price in the last period (ln Pi, t – 1) and an innovation component (εi, t). The innovation component is further determined by the information arriving in the market at that time (t). Information can be classified into pervasive market-wide information (Im, t) and idiosyncratic stock-specific information (Ii, t). The total innovation (εi, t) can thus be partially explained by Equation (2).
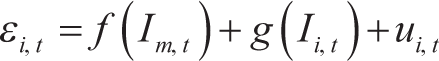
where ui, t is the random error component. Thus, Equation (1) can be expanded as follows:

where Ri, t is the log return of stock i on day t.
Returns from a well-diversified stock index (Rt) proxy for market-wide information. The second information set that affects individual stock prices is idiosyncratic stock-related factors. If measures of Twitter activity (Ai, t) are efficient proxies for stock-specific information, then Equation (3) can be re-written as
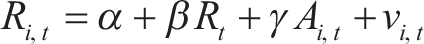
Here, vi, t is the error term of the equation that may account for unobserved firm-specific or time-specific factors. α, β, and γ are the parameters that define the relationship in Equation (4).
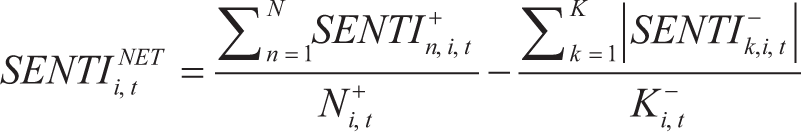
Since negative emotions conveyed through Twitter have a greater impact on stock returns and volatility (Deng et al., 2018; Yang et al., 2015), three public sentiment measures (scores) proxied by Twitter activity are used in this study: positive sentiment score (SENTI+ i,t ), negative sentiment score (SENTI– i,t ), and net sentiment score (SENTI+ i,t – SENTI– i,t ), which are further discussed in the section on data and methodology.
Since tweets convey positive or negative sentiments, their impact can be measured separately to analyse asymmetries. The measure of Twitter activities Ai, t used in Equation (4) can thus be segregated by the emotions they represent, as shown below:

By combining positive and negative sentiments, a net measure is obtained. This net measure can be used to explain the overall impact of the net sentiment contained in Twitter discussions on stock prices. This relationship is expressed formally in Equations (6) and (7):


where SENTINET i,t = SENTI+ i,t – SENTI– i,t measures the net sentiment with the coefficient γ0.
Since information dissemination through Twitter happens throughout the day and stock markets remain active only for a certain period, testing the relationships hypothesized above for three periods is prudent.
The trading or market hours are the times when stock markets are open. Information arriving during this period is disseminated through mass media and social networks like Twitter. It can be hypothesized that public sentiment about firms is reflected in stock prices during trading hours.
The off-market hours are the times when trading does not happen. If new information is disseminated, traders can only act upon it the next trading day. Thus, it may be hypothesized that the accumulated sentiment will impact the opening prices the next trading day by impacting the pre-opening auction, causing a price jump.
The investor sentiment of the market and off-market hours can be combined to obtain the overall sentiment from one trading day to the next. This sentiment measure can explain the daily stock price movement compared to the previous day’s prices.
Thus, based on the assumptions made above, the first set of testable hypotheses are:
H1: Positive (negative) public sentiment measured by Twitter activities has a significantly positive (negative) relationship with day-to-day stock returns. H2: Positive (negative) public sentiment measured by Twitter activities during market hours has a significantly positive (negative) relationship with stock returns during market hours. H3: Positive (negative) public sentiment measured by Twitter activities during off-market hours has a significant positive (negative) relationship with stock returns during off-market hours (overnight price jump).
These hypotheses are tested by validating the significance of γ0 in three distinct cases using Equations (5)–(7).
The existing literature shows that Twitter activity impacts stock volatility significantly. Since public sentiment, aided by information, moves stock prices, examining the impact of sentiment on volatility is necessary. Thus, this article also examines volatility as another outcome variable. Thus, all the hypotheses above can be tested with stock price volatility as the outcome variable. Formally, the second set of hypotheses can be stated as,
H4: Public sentiment measured by Twitter activities has a significant positive impact on day-to-day stock returns volatility. H5: Public sentiment measured by Twitter activities during market hours has a significant positive impact on stock returns volatility during market hours. H6: Public sentiment measured by Twitter activities during off-market hours has a significant positive impact on stock returns volatility during off-market hours (overnight price jump).
The following section on data and methodology discusses how the variables of stock returns, stock volatility, and public sentiment are measured.
4. Data and Methodology
Twitter
2
and stock price data have been collected from March 5, 2019 to January 9, 2020. After removing non-trading days, the final sample consists of Twitter activity data of 207 days for 437 Indian firms listed on the Bombay Stock Exchange (BSE), providing a balanced panel of 90,459 firm days. The market index considered is the S&P BSE 500 Index of BSE. The daily open-high-low-close (OHLC) data for the firms in the sample and BSE 500 is collected from the PROWESS database hosted by the Center for Monitoring Indian Economy (CMIE). The total Twitter activity on a day-to-day basis (16:00 of the previous day to 16:00 of the current day) consists of the entire sample, which is bifurcated into two different periods for a more detailed analysis as follows:
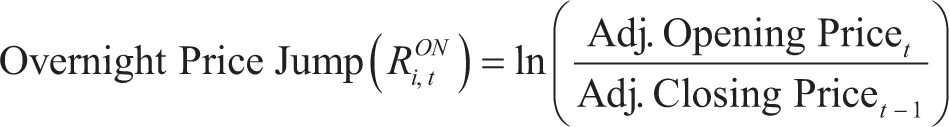
The first period consists of off-market-hour Twitter activities from the closing of the market on the previous day at 16:00 to the current day’s opening at 09:00. The overnight price jump is computed from the previous day’s adjusted closing price and the current day’s adjusted opening price. It also includes weekends and market holidays.
where the superscript ON refers to the “overnight” or off-market-hour period. The second period consists of Twitter activities during market hours, from the opening at 09:00 to the closing at 16:00. The stock return for this period is computed from the day’s adjusted opening and closing prices, as shown in Equation (9).
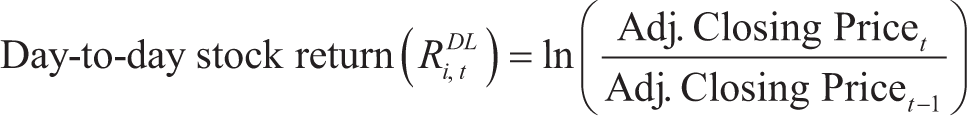
where the superscript MH refers to the market hour period. For the day-to-day sample, the stock returns are computed from the adjusted closing prices of the previous and current trading days, as shown in Equation (10).
where the superscript DL refers to the day-to-day period.

Since the study controls for market (benchmark stock market index) returns, the BSE 500 index returns (MRONi,t, MRMHi,t, and MRDLi,t) are computed similarly for all three measurement periods.
The volatility for each day for the three measurement periods is estimated with range-based volatility estimators. Specifically,
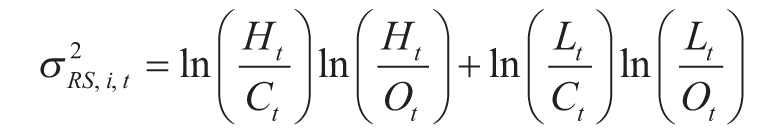
The market-hour volatility is estimated with the Roger–Satchell (RS) volatility estimator (Roger & Satchell, 1991). The following equation is used for estimating RS volatility:
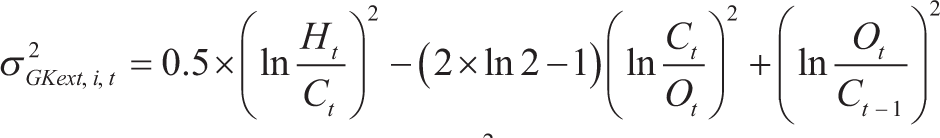
where Ot, Ht, Lt, and Ct are the opening, high, low, and closing prices, respectively, for trading day t. The same notations are carried on in further discussions. The day-to-day volatility estimate is obtained from the extension of the Garman–Klass (GK) volatility estimator (Garman & Klass, 1980). A discussion about including overnight price jumps in the GK estimator is provided by Molnár (2012). The extended GK estimator is
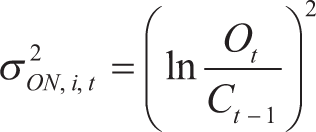
where the last term The off-market-hour/overnight volatility is difficult to ascertain since there are only two data points between the previous day’s closing and the current day’s opening prices. However, using these two price points, a simple approximation of off-market-hour volatility can be obtained. The overnight volatility estimator uses the last term of the GK extended estimator from Equation (12).
S&P BSE 500 volatilities (,
4.1. Estimation of Sentiment Scores
The data extracted from Twitter are analysed using the Java version of SentiStrength (Thelwall et al., 2010). The SentiStrength application segregates text strings with positive or negative sentiments (Abbasi et al., 2014; Deng et al., 2018). However, the default library was updated to adapt SentiStrength to increase its efficiency in segregating Tweets from predominantly Indian users. The entire sample of 5.4 million tweets was mined. The most frequent words were obtained using R’s text mining (“tm”) package. The words representing strong positive or negative emotions were manually checked in the library, and the missing words were updated. A limitation of the sentiment scores is the sole dependence on words and idioms, which cannot comprehend the context of a statement. Despite the limitation, SentiStrength provides scores that have been validated by prior researchers and found to have an accuracy of a minimum of 70% (e.g., Deng et al., 2018).
SentiStrength provides an option for binary sentiment scores for positive (1 to 5) and negative (–1 to –5) words and phrases in each tweet. The trinary (negative, positive, and neutral) scoring option is available in SentiStrength, but it was not used in this study. The sum of the positive and negative scores is that tweet’s “net” score. If the net score is positive (negative), then the particular tweet conveys a positive (negative) sentiment. The higher the absolute value of the score, the stronger the sentiment.
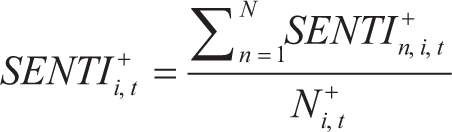
The sentiment score obtained for each tweet for a given firm during each period (market hours, off-market hours, and day-to-day) is used to obtain three weighted sentiment measures as follows:
The weighted positive sentiment score for the day (SENTI+
i,t
): The sum of the scores of all positive tweets is scaled by the number of positive tweets per measurement period.
where N +
i,t
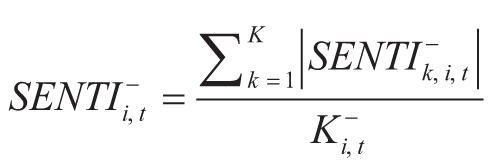
is the number of positive tweets per day. Similarly, the weighted negative sentiment score (SENTI–
i,t
) is the sum of the absolute value of all negative scores scaled by the number of negative tweets. Since SentiStrength provides negative scores for the negative sentiment words and phrases, they are taken as absolute values for analysing the magnitude of sentiments’ impact.
where K +
i,t
is the number of negative tweets per measurement period for each firm. A net sentiment score for the given period can be obtained by combining the above two measures.
The three measures of sentiment are used for each measurement period to examine the impact of public sentiment on stock returns and volatility.
4.2. System GMM Estimation
The dependent variables in the regression equations are returns and volatilities for three different periods. An initial Breusch–Pagan LM test (Breusch & Pagan, 1980) suggests the presence of cross-sectional correlations in the stock-return series. The application of ordinary least squares (OLS) with fixed effects (FE) and random effects (RE) also shows the presence of cross-section dependence in residuals with the Breusch–Pagan LM test. Therefore, dynamic panel data (DPD) models are adopted to account for cross-sectional stock return dependence. Since realized stock price volatility exhibits autocorrelation (Andersen et al., 2001), estimating models with volatility as a dependent variable requires DPD models.
The two most commonly used DPD models are the GMM-based Arellano–Bond (AB-GMM) method (see Arellano & Bond, 1991) and the system GMM method (see Blundell & Bond, 1998). The AB-GMM method uses lagged levels of the dependent variables to construct an instrument matrix that improves the estimator’s efficiency.
The efficiency of a GMM estimator is tested using two specification tests. For one- and two-step GMM models without corrections in standard errors, the Sargan test (Sargan, 1980) of overidentifying restrictions is used. For models with robust estimates of standard errors (Windmeijer, 2005), the Arellano–Bond (AB) test for no second-order correlation in the residual terms is used since the Sargan test cannot be estimated.
The specification tests for the AB-GMM estimator show that the estimator is not efficient for the sample data. Therefore, the system GMM estimator (Blundell & Bond, 1998) was used. The system GMM model uses the lags of the differences between the dependent variables (and endogenous variables) and the lagged levels of the dependent (and endogenous) variables as instruments. The extra instruments in the system GMM help improve the GMM models’ efficiency. A two-step system GMM was used with Windmeijer’s (2005) error correction. Hence, the AB specification test is used to test the validity of the models. In the system GMM models, time-fixed effects are controlled using the variable λt.
Three sets of models are used for estimating the impact of public sentiment on stock returns, and another three sets of models are used for the same stock price volatility.
The models used for estimating the impact of sentiment on stock returns during three measurement periods are expressed below:
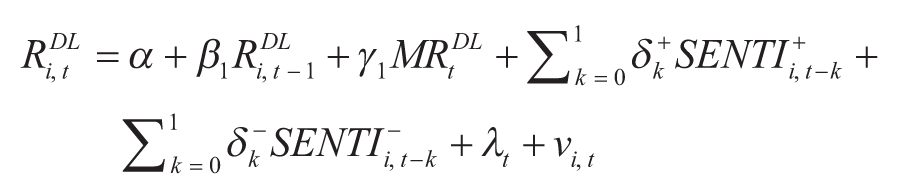
Regression models with day-to-day stock returns (RDLi,t) as the dependent variable:
In Equation (17) (and in subsequent models), the variables SENTI+
i,t – k
and SENTI–
i,t – k
cannot assume non-zero values simultaneously; hence, they are used together to emulate the notion of piece-wise linear regression and are not used individually. Equations (17) (and subsequent models) use the piece-wise linear regression form to study the asymmetric effect of positive and negative sentiments. However, the net effect of positive and negative sentiment is measured through Equation (18) and similarly in subsequent models. Regression models with market-hour stock returns (RMHi,t) as the dependent variable:
Regression models with off-market-hour stock returns (RONi,t) as the dependent variable:

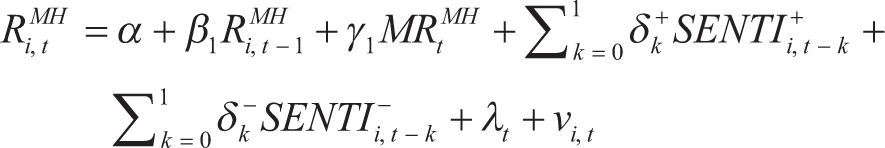
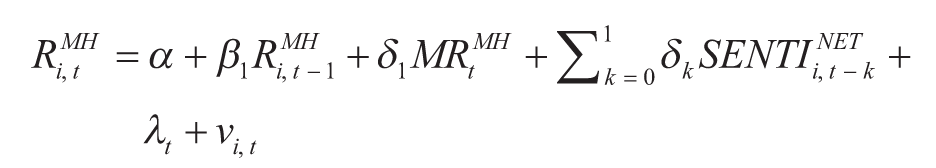
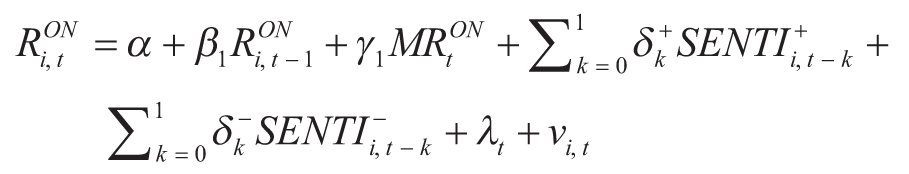
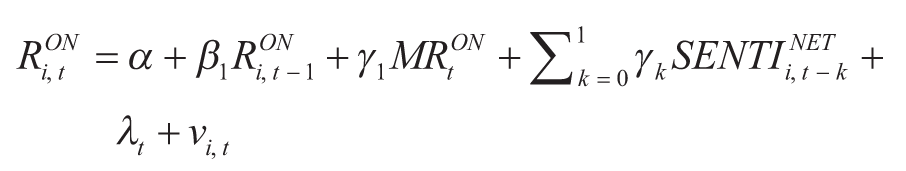
In all models, (17) through (22), the return on the BSE 500 index (MR) is identified in the equations as an “endogenous” variable. Since information about market returns is already incorporated into stock returns (Campbell & Mei, 1993; Sharpe, 1964), this specification was a logical choice. The lag specifications of the SENTI variables specify the number of lags of the sentiment scores included in the equation.
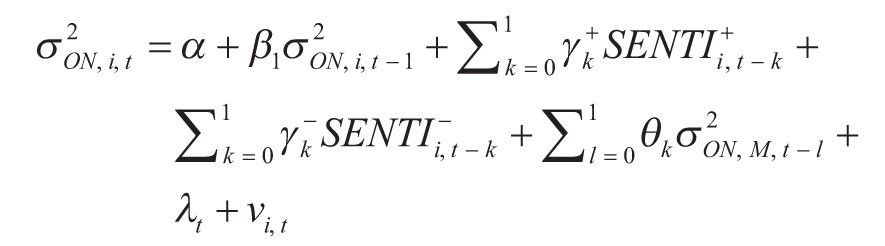
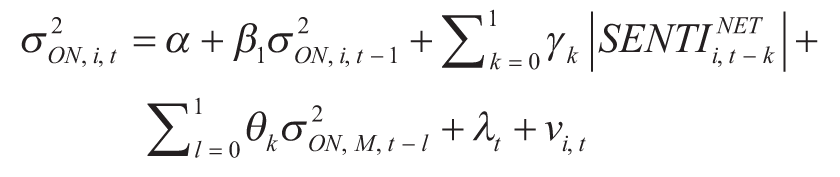
The regression models used for estimating the impact of sentiment on stock price volatility are expressed below:
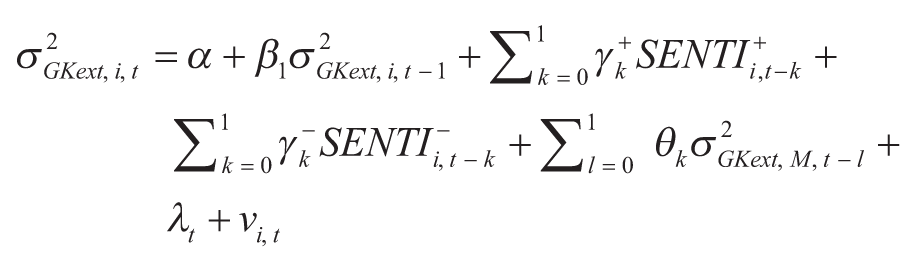
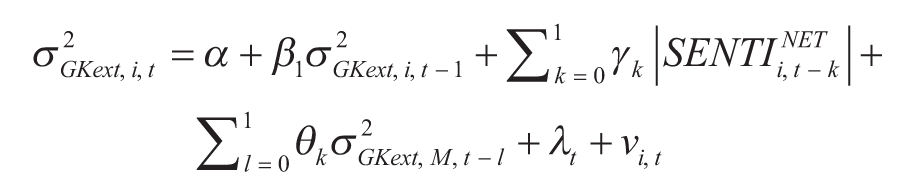
Regression models with GK extended stock volatility (for the day-to-day period) as the dependent variable:
Heteroscedasticity and volatility clustering are stylized facts of financial return data (Cont, 2001). Hence, the lagged values of market volatility (the specific volatility measure used for each period) are included as control variables in Equations (23), (24), and all subsequent models involving volatility. Since the volatility estimates are always positive while the net sentiment scores can assume positive or negative values, the effect of stronger sentiment in either direction on volatility can be measured using absolute sentiment values. Thus, the absolute values of the net-weighted sentiment scores (
|
SENTINET
i,t – k|
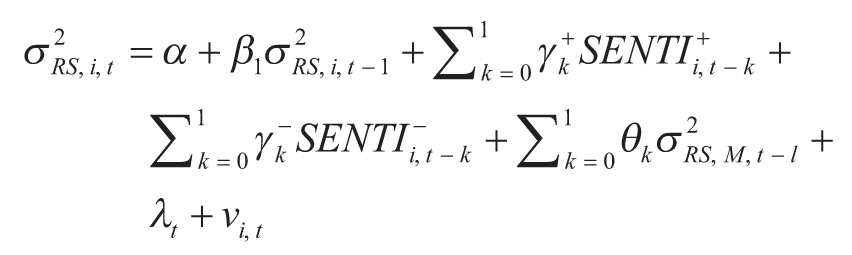
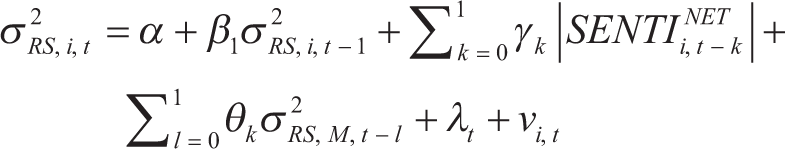
) have been used as the regressor in Equation (24) (and subsequently). Regression models with RS stock volatility (for the market-hour period) as the dependent variable:
Regression models with overnight stock volatility (for off-market-hour volatility) as the dependent variable:
Models (23) through (28) do not have any endogenous variables specified. There is no clear evidence from model specification tests (AB tests) that market-wide volatility information is endogenous to stock-specific volatility. Hence, no a priori assumption on endogeneity is made. The following section presents the results and relevant discussion.
5. Results
The descriptive statistics for the volume of Twitter activity and the sentiment scores computed from tweets are provided in Tables 1A and 1B. Though it is impossible to give a detailed account of Twitter activity across the 437 firms here, some general observations can be made. The descriptive statistics of Twitter activity volume in Table 1A suggest that most Twitter activities occur during off-market hours. Also, when computed separately across firms and days, the average tweet count standard deviation suggests that Twitter activities vary more across firms than across days (see Table 1C). Some firms see a higher volume of Twitter activity across the sample period due to their social media handling and interactions with the general public and customers. On the other hand, some firms have very few tweets in a day.
Descriptive Statistic of Twitter Activity Volume.
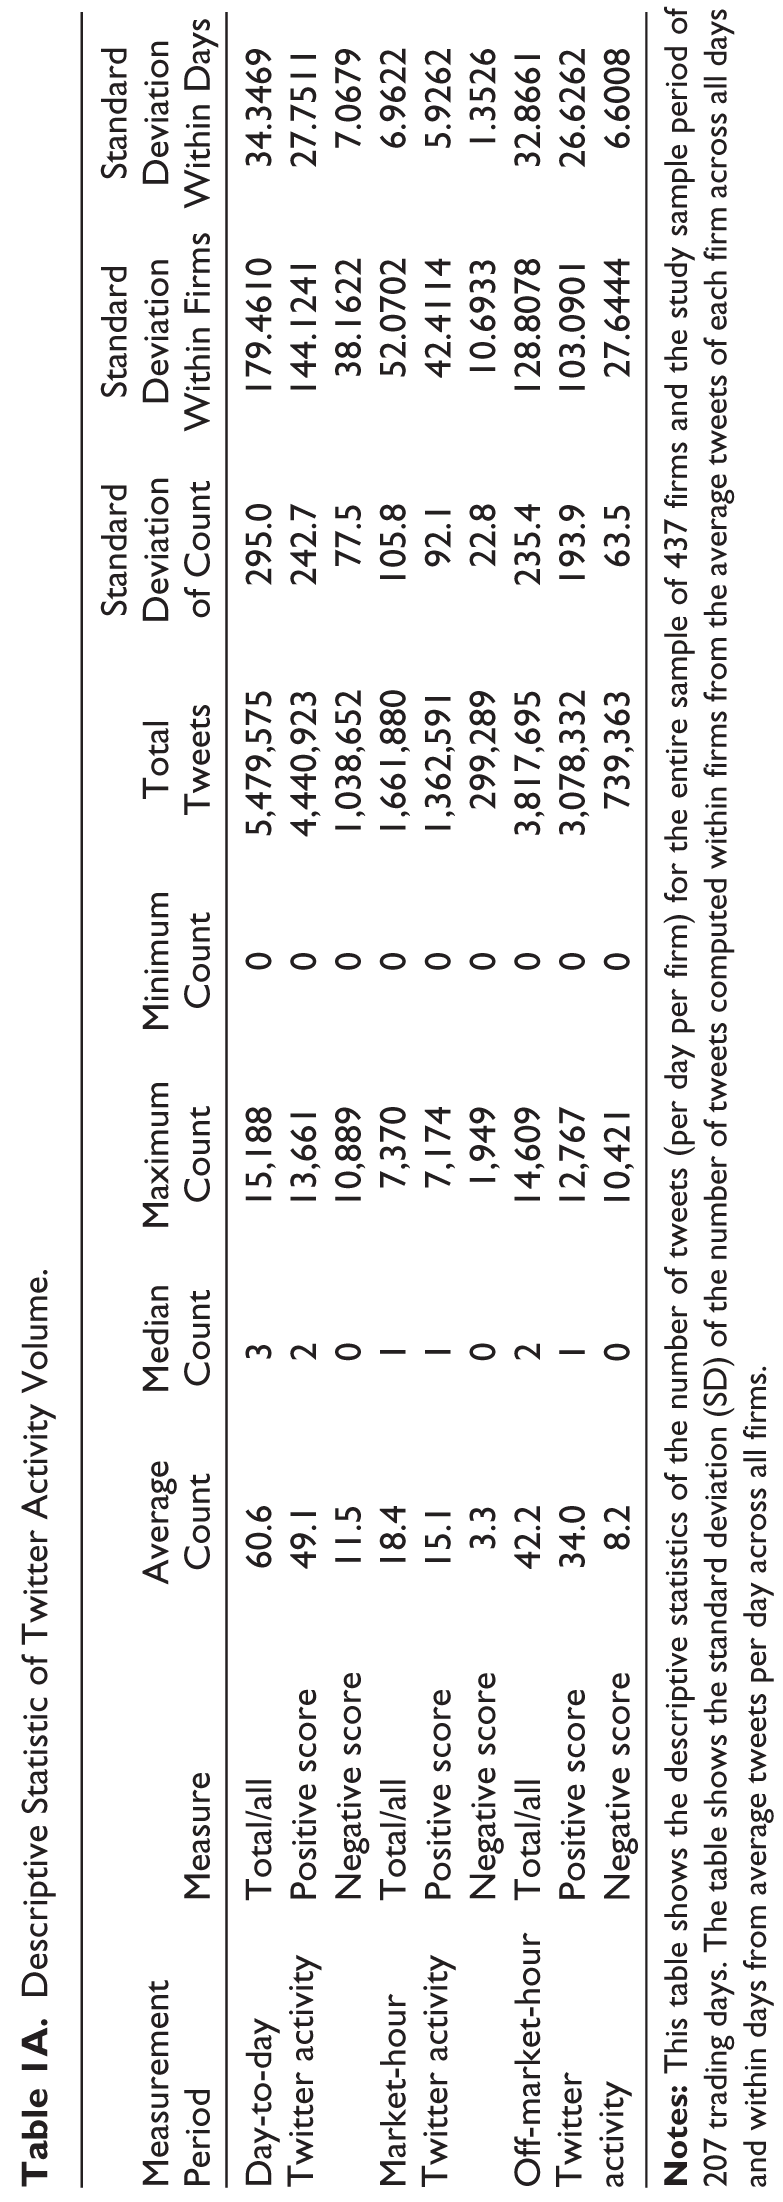
Table 1B shows the descriptive statistics of weighted net sentiment scores and their positive and negative components. Consistently, negative scores have a higher standard deviation than positive scores. It shows that positive sentiment is more systemic than negative, that is, when the prevailing sentiment is positive, it is felt across the market. On the other hand, negative sentiment is more idiosyncratic across firms and days.
Descriptive Statistic of Sentiment Measure.
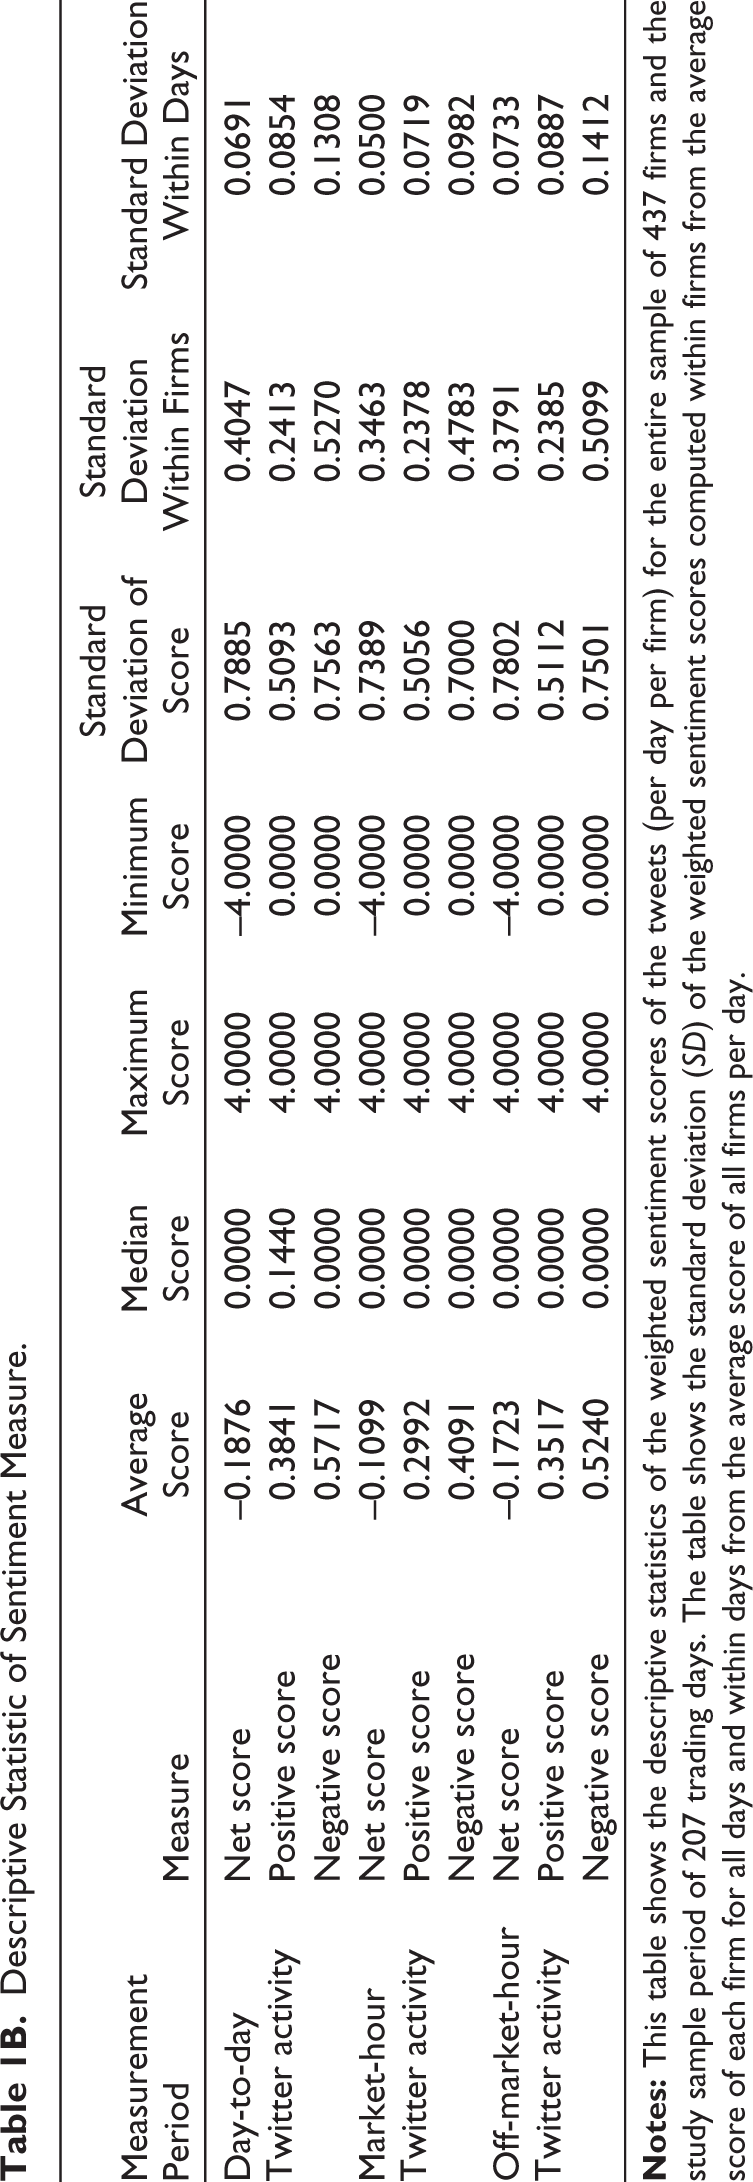
The last two columns of Tables 1A and 1B provide further insight into the variation of tweets and weighted sentiment across firms and days. The standard deviation of Twitter activity is higher across firms than across days. The standard deviation of weighted sentiment scores is also higher across firms than across days. Also, there is more volatility in Twitter activity during off-market hours. There is a lower negative tweet count variation than a positive tweet count. In contrast, there is a higher variation in negative-weighted sentiment across firms and days for all observation periods.
Table 2 presents the regression estimation results for models depicted in Equations (17) through (22), with stock returns as the dependent variable. The autoregressive terms have highly significant (at a 1% level) positive coefficients in all models, implying an AR-1 memory process in the returns.
Impact of Twitter Sentiment on Stock Returns (Total, MktHr, and Off-MkHr).
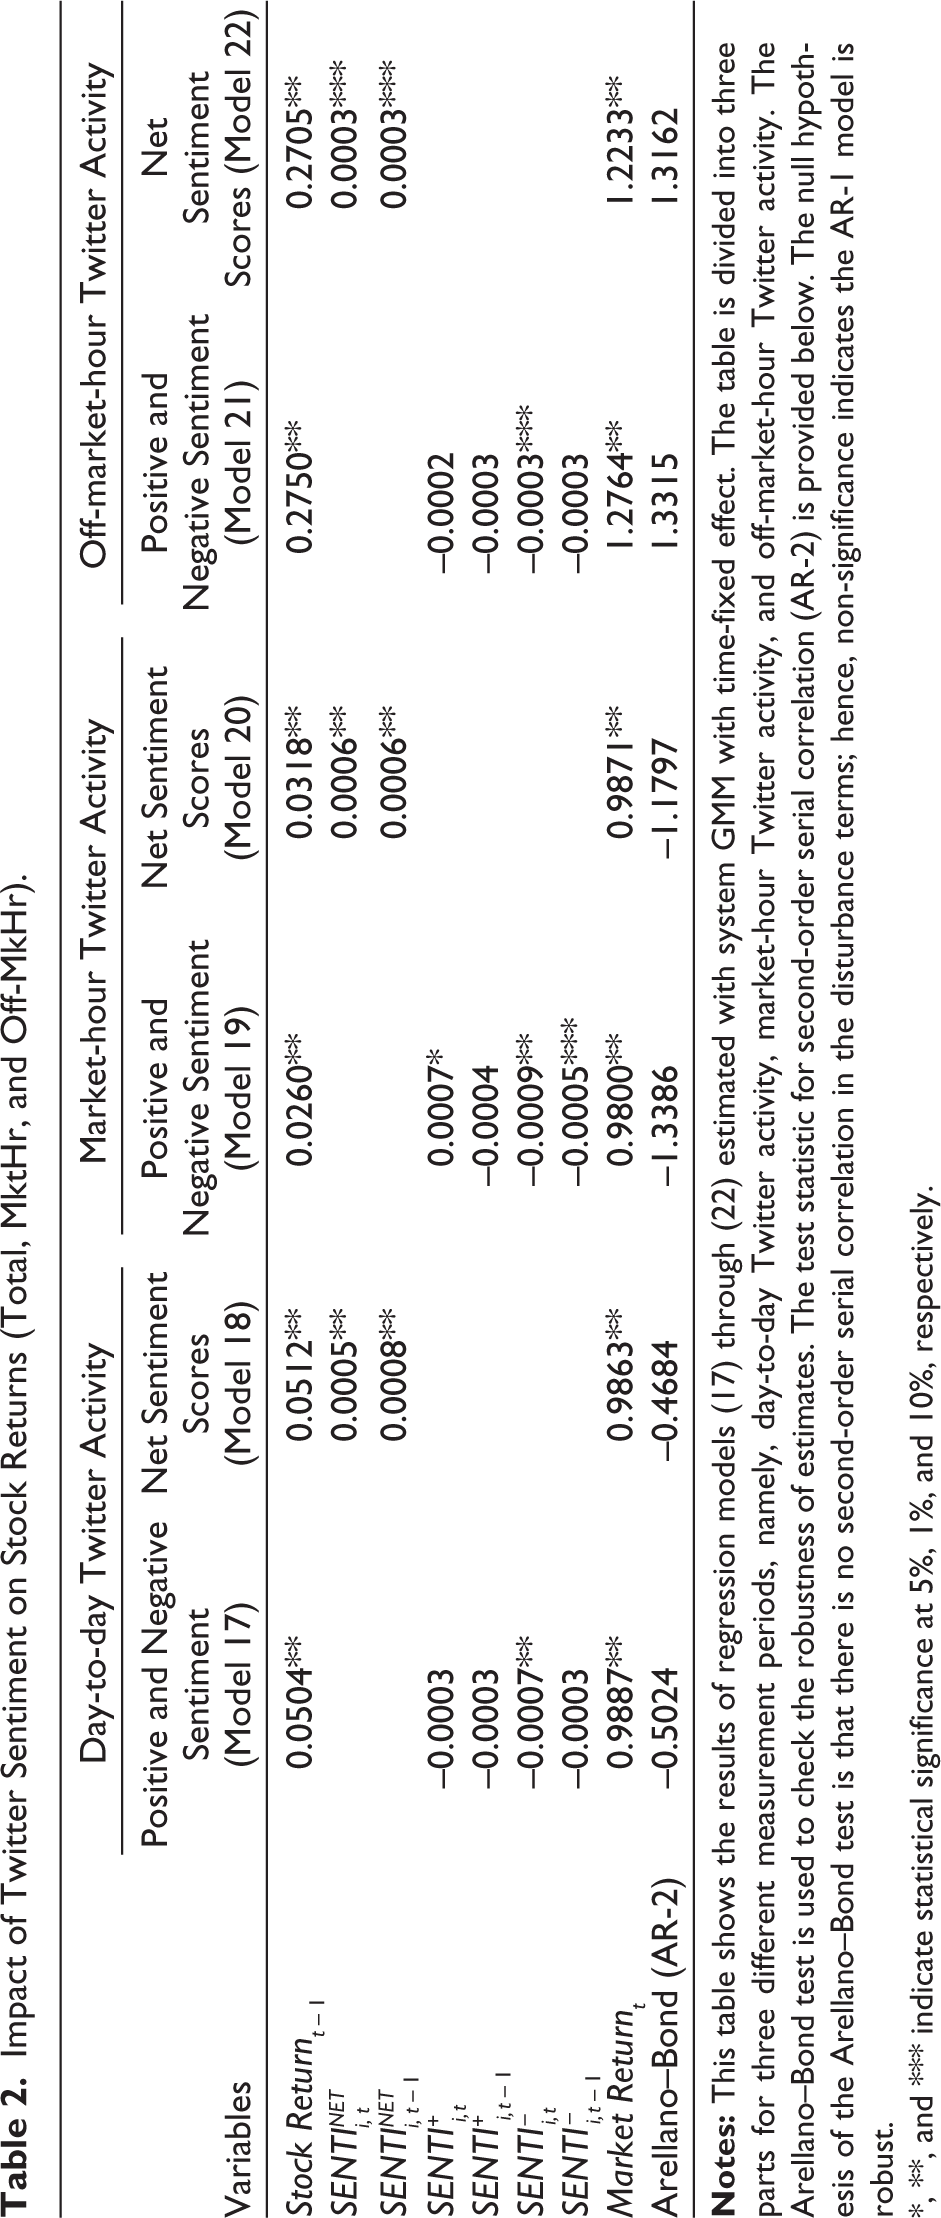
*, **, and *** indicate statistical significance at 5%, 1%, and 10%, respectively.
Table 2 also shows that an increase in the net sentiment score on the current or previous day increases stock returns in all three measurement periods. Coefficients of the net sentiment score and its first lag are positive and significant (at a 1% level) for day-to-day and market-hour measurement periods. However, the coefficients of current and prior periods’ net sentiment scores have marginal significance (at a 10% level) for the off-market-hour period (overnight price jump). It suggests that the overall impact of off-market-hour sentiment on price jumps is less than that of day-to-day and market hour sentiments. Although negative overnight sentiment impacts the overnight price jump negatively, positive overnight sentiment does not impact the opening price jump of the following trading day. Results present partial evidence in favor of H3.
In the day-to-day period, the negative sentiment (SENTI– i,t ) has a negative and significant (at a 1% level) relationship with the stock returns. Thus, negative sentiment about a firm (SENTI– i,t – 1) does not affect its stock returns the following day. Positive sentiments (SENTI+ i,t – 1 and SENTI+ i,t – 1) have no impact on stock returns on a day-to-day basis. Thus, there is partial evidence in favor of H1.
The results from the market-hour sample show that the coefficients of a negative sentiment of both the current (SENTI– i,t ) and previous trading periods (SENTI– i,t – 1) are negative and significant (at 1% and 10% levels, respectively). Thus, the impact of negative sentiment persists for two days, and the results support H2. On the other hand, the positive sentiment generated during the same day (SENTI+ i,t ) has a positive but moderately significant (at a 5% level) impact on stock returns, while that of the previous day (SENTI+ i,t – 1) has no impact. The authors argue that the negative sentiment elicits a stronger reaction from the traders than the positive sentiment.
The market return has a significant (at a 1% level) and positive relationship with stock returns in all models. The AB test statistic is insignificant for second-order autocorrelation in all models presented in Table 2, suggesting that the instruments are robust.
Table 3 presents the results of regression estimates with stock price volatility as the dependent variable for all three measurement periods. The autoregressive volatility components are positive and significant (at varying levels of significance) in all the models, which controls for the autoregressive nature of heteroscedasticity. In all the models, the overall market volatility of that day and the previous day is controlled for. While the same-day market volatility is highly significant (at a 1% level), that of the previous day is not.
Impact of Twitter on Stock Price Volatility (Total, MktHr, and OffMktHr).
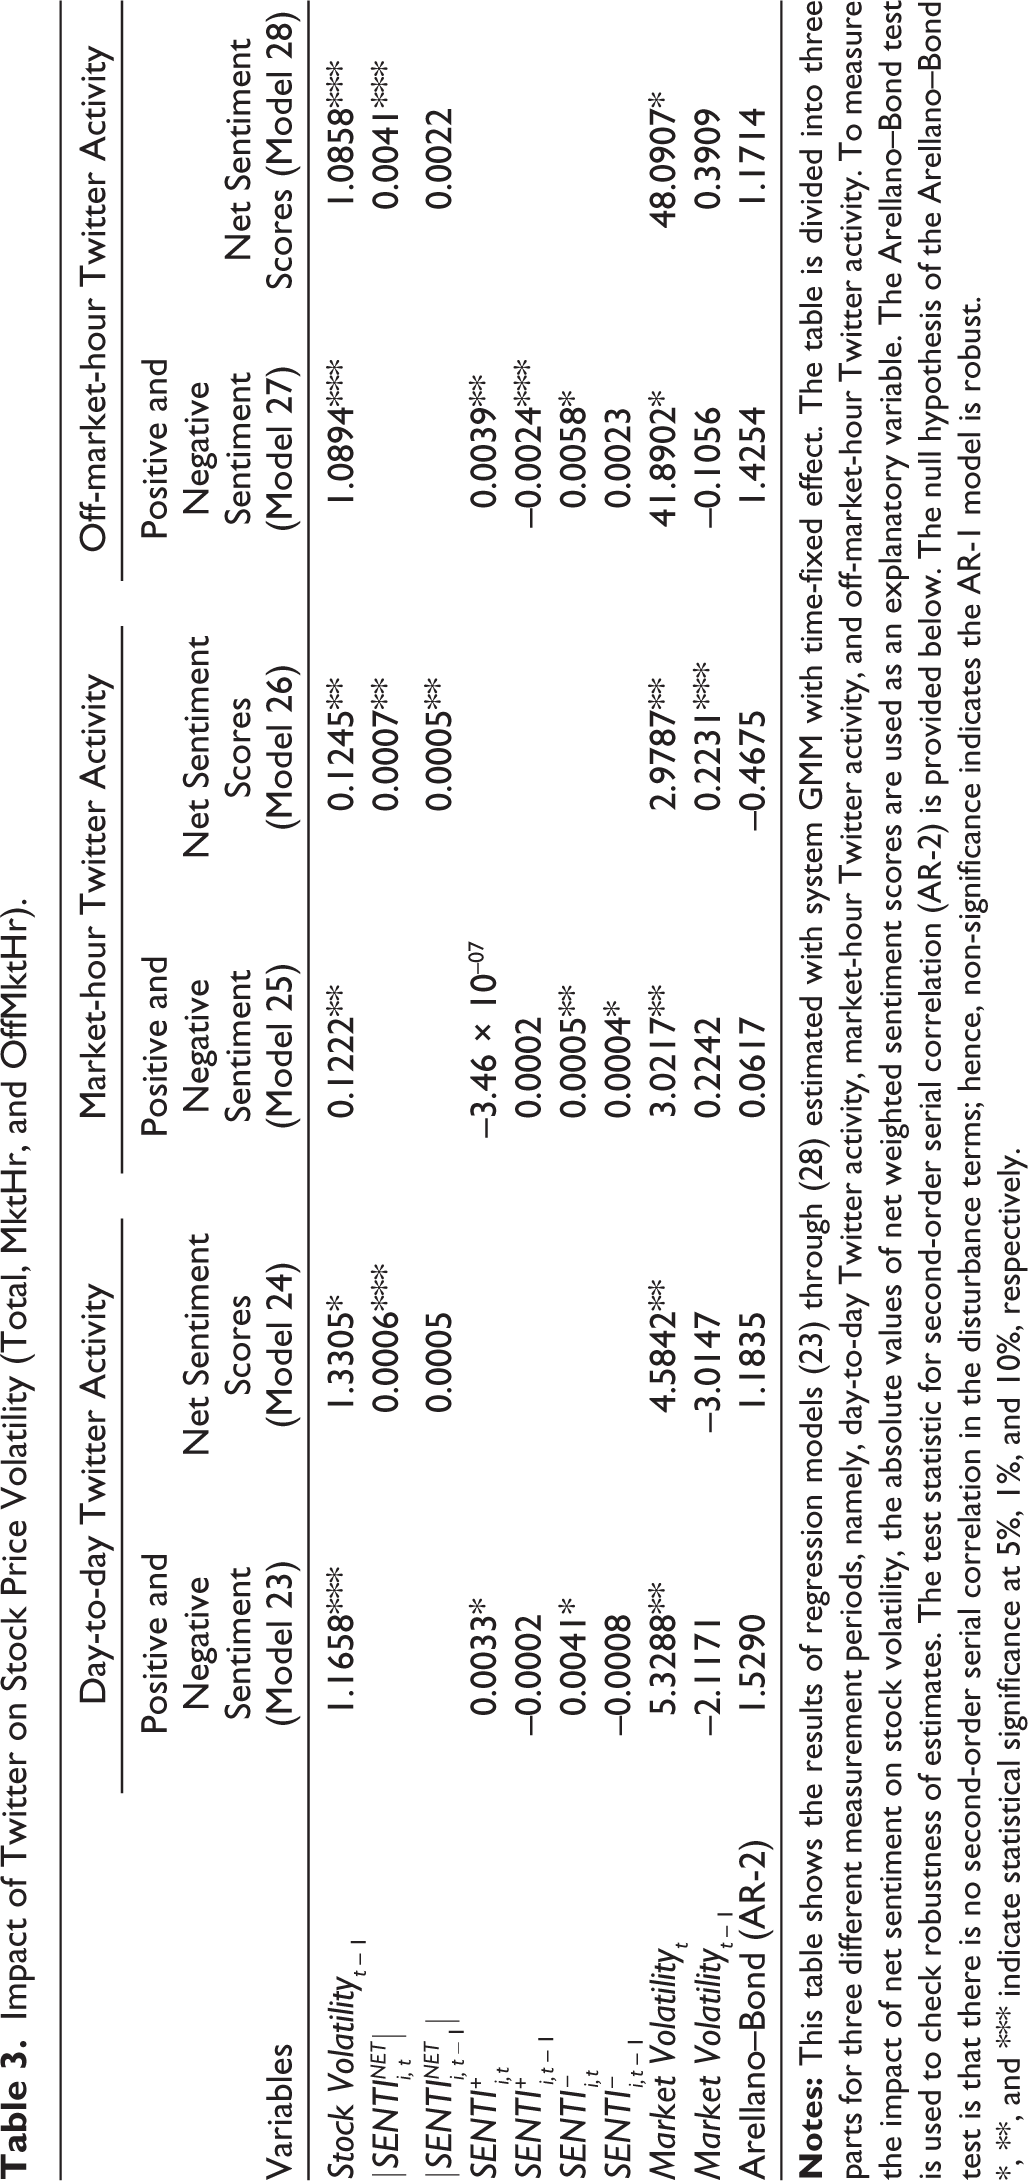
*, **, and *** indicate statistical significance at 5%, 1%, and 10%, respectively.
On a day-to-day basis, an increase in either positive or negative sentiment about a stock increases stock volatility significantly (at a 5% level) on the same day, but the lagged sentiment has no effect. The impact of the absolute net sentiment of the same day is weakly significant (at a 10% level), but that of the previous day is not. Thus, the results support the fourth hypothesis (H4).
For the market hour period, coefficients of the current and previous days’ negative sentiments are positive and significant (at a 1% level), suggesting that negative sentiment increases volatility on the current and next trading days. However, positive sentiments do not affect volatility during market hours. The coefficients of the current and previous days’ absolute net sentiment scores are positive and significant (at a 1% level). It suggests that though the overall strength of sentiment in the market hour period leads to a significant increase in volatility, it is due to the strong impact of negative sentiments. Therefore, there is strong evidence in favor of H5.
For the off-market-hour period, an increase in positive overnight sentiment causes a positive and significant (at a 1% level) jump in the overnight volatility (σ 2 ON,i,t ). However, increasing positive sentiment at a one-day lag reduces volatility (significant at the 10% level). Since the negative sentiment at lag (t – 1) has already been factored into the contemporaneous volatility of the day (t – 1), which in turn is also a regressor for day t volatility, the sentiment of the day (t – 1) has a weakly significant but negative impact. An increase in negative overnight sentiment also causes a positive and significant (at a 5% level) jump in overnight volatility (σ 2 ON,i,t ), while the lag of the negative sentiment score does not have any impact. The absolute net sentiment of overnight tweets has a positive and significant (at a 10% level) impact on the volatility of the overnight price jump, while its lag is insignificant. Thus, H5 is supported for the off-market-hour period.
Finally, the instruments specified in the models are robust, as suggested by the insignificant test statistic in the AB test for second-order autocorrelation.
6. Discussion and Implications
Based on the results described in the previous section, it can be said that sentiments conveyed by Twitter activities are a significant factor in stock price movement in the Indian stock market. Not all firms have the same volume of Twitter activity under normal circumstances. Some firms manage their social media handles better than others. The discussion is not always centered around the stock prices of firms. However, customers’ and public’s criticism or praise convey the public sentiment about a company. Thus, this article uses a weighted measure of sentiment that normalizes sentiments by the volume of Twitter activities.
The strength of the net sentiment conveyed by Twitter discussions has a significant and positive impact on returns, implying that the stronger the positive (or negative) sentiment conveyed by Twitter activities, the more (or less) the return. Further, the higher the magnitude of the net sentiment of Twitter discussions during market hours, the higher the volatility in the stock returns. Results also suggest that the effect of net sentiment lasts for more than one day. However, the net sentiment of Twitter activities during off-market hours has a comparatively lesser impact on the overnight price jumps. Results imply that the information disseminated through Twitter activity is readily reflected in prices during trading hours, increasing the volatility. However, investors get sufficient time to absorb and validate the information arriving during the off-market hours. Hence, the sentiment associated with it has a lesser impact on the volatility of overnight price jumps. It is an important contribution to this article that has implications for practitioners and academicians alike.
The article found that stock returns and volatility are generally more reactive toward negative sentiment. In market hours, off-market hours, and day-to-day periods, negative sentiment reduces stock returns more than positive sentiment increases them (Table 2). The probable reason is the bias (fear) in investors’ minds that compels them to weigh negative sentiment more heavily, resulting in selling pressure on stock prices. Negative sentiment also increases volatility during market hours, off-market hours, and day-to-day periods more than positive sentiment does (Table 3).
Since official handles are platforms where many stakeholders (e.g., investors, consumers, employees, and other stakeholders) express their opinions, they reflect the real-world perception of the firms in their eyes. Thus, the results point toward information transmission through Twitter and put forward substantial evidence in favor of the argument of this article that the public sentiment measured by social media like Twitter can be a reasonable proxy for measuring stock markets’ sentiment.
6.1. Managerial Implications
The literature on this topic is still nascent, and extensive studies are rare. This article conducts the first extensive study in an Indian setting using 437 stocks. It has profound implications for managers, investors, society, and valuation philosophy.
The implications of the results are pretty significant for firm managers. Since maximizing firms’ value is a principal goal of managers, efficiently managing social media handles may help achieve it. Firms with active social media handles attract more social media activity from the public. Customers and stakeholders often discuss their experiences with a firm’s products and services on its social media handle. For managers, paying attention to social media activities may be an early warning signal for steering their decision-making process.
For investors, paying attention to public discussion about a firm may give them foresight about its future stock price movement. With the advancement in artificial intelligence (AI) and ML, there are several opportunities for investors and traders to design trading algorithms based on public sentiment expressed through Twitter activities.
The findings have broad social implications too. Classical financial theories focus on stockholders’ wealth maximization; however, the modern approach looks at the welfare of all firm stakeholders. Twitter or other social media discussions could be included in valuation models. In that case, it may signify a paradigm shift from the narrower classical approach toward a more inclusive approach to stock valuation, where active investors and traders listen to the opinions of the public and calibrate their valuation estimates accordingly.
7. Conclusion
This essay analyses the impact of stock-specific public sentiment, proxied by Twitter activity, on listed Indian firms’ stock returns. This article tests whether sentiment proxied by Twitter activity is a significant price mover. Day-to-day price movement and price movements in two sub-periods, the off-market and market hours, are considered separately for the analysis.
Results suggest that weighted net sentiment scores significantly increase stock returns and volatility. The impact of public sentiment on stock returns is very pronounced during the market hour period. Summarily, results show that negative sentiment has a more substantial impact on both stock returns and volatility, while the impact of positive sentiment is somewhat muted in contrast.
This study presents some statistically significant evidence to suggest that public sentiment estimated from Twitter activity can be used to explain stock price movement in the Indian market. However, as discussed earlier, this is an emerging field of research; hence, there is scope for the same to be repeated in other developed and developing markets. A related course of future study could be analysing the effect of Twitter activities on trading volumes. Information from other social media platforms (e.g., GSVI, investor-specific microblogs, and so on) may be used in conjunction with those from Twitter to increase regression models’ efficiency. One of the limitations of this study is that it does not include sarcasm and context-based analysis. Researchers intend to address this issue in future studies using context-based analysis. This study does not look at the impact of public sentiment on intraday trading. It may be helpful to analyse the impact of ongoing Twitter activities on a granular scale. Thus, future research could focus on the impact of public sentiment proxied by Twitter (and other platforms) on intraday stock returns and volatility.
Footnotes
Acknowledgements
The infrastructural support provided by the FORE School of Management, New Delhi, and International Management Institute Kolkata, in completing this paper is gratefully acknowledged.
Declaration of Conflicting Interests
The authors declared no potential conflicts of interest with respect to the research, authorship, and/or publication of this article.
Funding
The authors received no financial support for the research, authorship, and/or publication of this article.