
Abstract
This study examines the valuation effects of the magnitude and frequency of share repurchases for 181 Bombay Stock Exchange–listed stocks from 2000 to 2021. We investigate the valuation effect of share repurchases by calculating the sample companies’ average abnormal returns (AARs) and average cumulative abnormal returns (CARs) using the market model of event-study methodology. The findings show that the magnitude of share repurchases impacts the stock prices of the sample companies, regardless of the size of the repurchases concerning the total number of ordinary shares outstanding. Furthermore, when compared to single-time repurchasing companies, frequent repurchasing companies experience abnormal returns. This study contributes to the scant literature on the frequency and magnitude of share repurchases across the world.
Introduction
Share repurchases, also known as stock buybacks, are frequent corporate events in which companies purchase previously issued stock to distribute cash to shareholders. Share buybacks began in the 1950s in the United States and have since grown to be a substantial and global practice (Grullon & Ikenberry, 2000). The past few decades have seen a substantial increase in share buybacks around the world. S&P 500 companies in the United States have returned $4.3 trillion in value to shareholders by buying back their shares in the past decade (Lazonick et al., 2020). This year, US corporations have acquired a record number of shares. According to statistics provided by the Financial Times from Goldman Sachs, firms spent USD 319 billion on share repurchases in 2022, up from USD 267 billion in the same time the previous year. According to AJ Bell data, 14 FTSE 100 companies have initiated share repurchase programmes totalling £14 billion in the 2021 fiscal year. There has also been a repurchase boom in Asia, with companies such as Alibaba, HSBC, JD Health, Toyota, and AIA announcing buybacks.
There has been a considerable amount of literature on share repurchases in the past, covering a variety of motives, such as capital restructuring, dividend substitution, surplus cash flow, managing earnings per share (EPS), increasing shareholder wealth, and deterring takeovers. EPS improvements are a primary corporate driver of stock repurchases, according to Cao et al. (2020), who found a positive correlation between earnings management strategies and stock repurchases in Vietnam. Jena et al. (2019) found that promoter holdings and earnings quality are negatively correlated, and Indian companies engage in opportunistic earnings management before buybacks. According to Xu and Taylor (2017), firms use stock repurchases to control earnings. CFOs generally cite “increasing EPS” as the most common reason for repurchasing stock, according to Badrinath et al. (2001). Hribar et al. (2006) report that the market discounts EPS increases attributable to stock repurchases. A study by Varma et al. (2018) indicates that for India’s open-market repurchases, capital structure correction and dividend substitution are the primary drivers, while tender-offer buybacks are more frequently used for capital structure correction. Dividends and share buybacks are considered alternatives by financial experts to share repurchases, which have been the preferred method of earning distribution for corporations over the past two decades (Dickson, 2018; Jiang et al., 2013; Kulchania, 2013). Busch and Obernberger (2016) conclude that corporations with lots of cash often engage in share repurchase programmes. Firms with free cash flow streams can boost shareholder value by repurchasing shares (Yook & Gangopadhyay, 2010). Share repurchases are a flexible tool for sharing surplus cash flows, reducing risks, and minimizing agency costs (Oswald & Young, 2004). One typical reason for share repurchasing is to deter hostile takeovers. Billett and Xue (2007) discovered a substantial positive link between open-market share repurchase announcements and the likelihood of a takeover. Doan et al. (2011) emphasize that if a company feels a significant takeover danger, it will boost its on-market share buyback activity. The notion that share repurchase acts as a price support and signalling mechanism to encourage more efficient stock pricing has been supported by Chee et al. (2021). Undervaluation is the primary reason for going for share repurchases. Rajagopalan and Shankar (2012) concluded that the buybacks had information content to signal the undervaluation of shares.
However, multiple studies have already assessed share repurchase motivations for numerous countries. This paper contributes to the repurchase literature by investigating the valuation effect of share repurchases while taking into account two critical aspects of a share repurchase programme: the magnitude of the disclosed buyback programme in relation to the company’s market capitalization and the frequency of the buyback plans. Few experts, on the other hand, have discovered a correlation between the number of shares purchased and the stock’s success in the US market (Grullon & Michaely, 2002; Zhang, 2005). It is also critical to evaluate the impact of the proportion of shares repurchased on the stock performance of the firm. Because the scale of repurchases varies per firm, it is uncertain if the effect of share buybacks is consistent across industries.
In the Indian context, repurchasing firms’ frequency of repurchasing programmes varies; few companies repurchase shares frequently, primarily Indian IT companies (Wipro, TCS, Infosys, etc.) while others launch repurchase programmes infrequently. As a result, we are quite interested in measuring the valuation implications of share repurchases in proportion to their frequency of repurchases. In various respects, our research contributes to the finance literature. First, this study examines the valuation implications of share repurchase programmes (both tender offers and open buybacks) in terms of frequency and magnitude using a large data set of 181 Indian enterprises. In the past, the majority of studies compared the value of tender offers and open-market buybacks separately. Second, there are no studies in India that examine the impact of the size and frequency of share repurchases on stock prices. Third, the study period has been set to be rather long, allowing us to thoroughly investigate share repurchase programmes with great precision.
Literature Review
The share repurchasing period began not too long ago. Until 1998, companies in India were not allowed to buy back their shares. Several studies have been conducted since then to examine various facets of share buybacks globally. A multitude of empirical and theoretical research works have addressed the reasons and consequences of share buybacks, providing a varied perspective on the motivations driving share buybacks as well as the causes of the market’s response to the repurchase news. There is a lack of literature about the global impact of share buyback frequency and volume.
Frequency of Stock Repurchases
Gupta and Wagner (2018) found that the announcement effect is significantly lower for companies that announce buybacks regularly (potentially substituting yearly dividend payments). Using 274 observations of Malaysian actual share repurchase events from 2006 to 2010, Latif et al. (2016) studied whether the attributes of the chief executive officer (CEO) play a significant effect on the frequency of share repurchase in Malaysian non-financial enterprises. It was discovered that firms routinely repurchase shares to smooth out earnings reporting. The frequency of share repurchase transactions can be strongly influenced by CEO duality, CEO expertise, and CEO duration. Sabarani (2014) investigates the association between share repurchase frequency and business financial characteristics in Malaysia. The outcomes of this study supported the signalling hypothesis by demonstrating that market-to-book value and EPS are the variables that have a substantial impact on share repurchase frequency. Taking a sample of 411 open-market repurchase programmes in Sweden from 2000 to 2012, Ridder (2014) found that using the four-factor model, firms with frequent programmes, i.e., those with three or more programmes, have returns that are 79 basis points per month higher than firms with infrequent programmes. Farrugia et al. (2011) discovered evidence that varied economic conditions had an impact on both frequent and infrequent Australian repurchase programmes. Furthermore, they show that companies that use frequent share repurchase programmes outperform companies that use infrequent or occasional share repurchase plans during all business cycles. In the year after the announcement, firms with infrequent and occasional programmes have higher raw returns than firms with frequent programmes. Yook (2010) discovered substantial evidence that US companies that announce repurchase programmes infrequently (no repurchase announcement in the three years after the announcement) have high long-term abnormal returns. However, the corresponding figure for frequent repurchase programmes was 2.4%, which was statistically insignificant. Lee et al. (2005) divided their sample firms into two groups: those with one programme and those with two or more and found that positive long-term impacts predominated in the first group, while negative effects predominated in the second. Jagannathan and Stephens (2003) examined the motivations and characteristics of companies that repurchase frequently versus companies that repurchase just periodically or infrequently. Firms frequently repurchasing shares are larger and have lower operating income volatility, lower market-to-book ratios, and higher dividend yields in comparison to infrequent or sometimes repurchasing firms. Infrequent repurchasers repurchase their shares when they believe the company is undervalued, while regular repurchasers repurchase shares to substitute dividend increases, according to them. Furthermore, rare repurchases are regarded with significantly more enthusiasm than more frequent repurchases.
Magnitude of Share Repurchases
In the United States, share repurchases can be used as a signalling tool and price support to help stock prices become more efficient, and share repurchases have no effect on stock prices in Malaysia (Chee et al., 2021). Jena et al. (2020) investigated the determinants of share buyback choice in India for 430 buybacks and found that tender-offer and open-market buybacks are not close substitutes for one another that these two widely used methods serve different purposes for companies in India, and that companies should choose the repurchase method based on the buyback’s purpose. EPS and operating income have a considerable beneficial effect on share repurchase, according to Aris et al. (2020). After researching companies in the BSE 500 Index industry-wise, Pradhan and Kasilingam (2019) found that buyback announcements have no impact on shareholders’ wealth. Bhullar et al. (2018) attempted to determine if share buybacks have an effect on firm value and discovered a statistically significant difference between pre-buyback and post-buyback firm valuations. The magnitude and drivers of the share price reaction to the announcement were studied by Gupta and Wagner (2018), who discovered a positive average abnormal return (AAR) on the announcement day and 41 days around the event window.
Research Objectives and Methodology
Objectives
To examine the effect of magnitude of a share repurchase programme on stock prices.
To examine the effect of frequency of a share repurchase programme on stock prices.
Hypotheses
Research Methodology
Sample: We focused on share repurchase announcements for companies listed on the S&P BSE 500 Index from 2000 to 2021. The S&P BSE 500 was chosen as an index because it provides a broad picture of the Indian market, with 500 companies listed on the BSE and covering all of the crucial industries in the Indian economy. Our initial sample included 235 repurchase announcements, but we ended up with 181 companies in the final sample.
The research’s vital data come from the CMIE Prowess IQ database and the SEBI and BSE websites.
Methodology: All companies that declared share repurchases during 2000–2021 are identified from the Prowess IQ database. For all these companies listed on the BSE 500 Index, 15 days pre-and 15 days post-repurchase data are obtained in order to establish a relationship between the magnitude, frequency, and stock price reaction around event windows for repurchase announcement.
We use the traditional event-study methodology using the market model as a benchmark to evaluate the short-term abnormal returns (ARs) following repurchase announcements in this study. In order to assess the abnormal price changes for the sample repurchases, we developed a 120-day estimation window (t − 136 to t − 16). We established a 31-day event window (t − 15 to t + 15) to quantify the total impact of share repurchases frequency and magnitude on stock prices. The relationship between firm-specific events and the company’s value or share price has been investigated through event studies (Binder, 1998). The event study has been most successfully applied in the field of corporate finance, according to Campbell et al. (2004) and Binder (1998).
Source: The list of corporations that repurchased shares throughout the research period was compiled using corporate SEBI filings. The “Draft Letter of Offer” and “Post Buyback public announcement” forms are used to manually collect the date for each firm’s share repurchases. The announcement date was confirmed via company websites based on the board’s decision date. The SEBI website was also used to collect information on share buyback characteristics such as whether it was a tender offer, an open-market repurchase, the premium paid, the period of the buyback, the frequency and magnitude, and so on. The associated financial and stock market data came from the Prowess Database of the Centre for Monitoring Indian Economy.
Estimation period and event window: We utilize an estimating period, which in our instance is 120 days, to calculate the typical returns for the sample firms. To calculate the abnormal price fluctuations for the sample stock, an event window is employed. We have a 31-trading-day event window (−15, +15). Here, + stands for the days following the split announcement, and − for the days before the announcement of the split.
The following formulas have been used to calculate daily stock return and market return figures:
(Current day closing price – Previous day closing price) Previous day closing price
The ordinary least square regression model is used to determine the alpha (α) and beta (β).
The following formula is used to determine a stock’s expected return.
Expected return = α×β×Market return
The following formula is used to determine excess or ARs:
Abnormal return = (Actual return – Expected return)
The ARs of the sample firms for each day of the event period are averaged to get the AARs.
During the event window, the AARs for each day are added together to form the cumulative abnormal returns (CARs).

The t test is used to determine whether or not the ARs over the course of the event window across all trading days inside the event window are significant.
The following is how the t-statistics for AAR are calculated:
Empirical Results
Frequency of Share Repurchases for Sample Companies
Table 1 categorizes the corporations based on how often they repurchase. Corporations with a single share repurchase fall into the first group, whereas companies with multiple share repurchases fall into the second. Although 42 firms made several buyback announcements, each with a different offer price and quantity, they are considered distinct sample units. Out of our total sample of 181 companies, 72 companies fall in the first category, and 41 companies with a total of 109 repurchase announcements fall in the second category. Eclerx Services Limited has repurchased shares six times, while Balrampur Chini Mills Limited has done so five times. These two companies have the greatest frequency of repurchases.
Categorization of Companies According to Their Buyback Frequency.
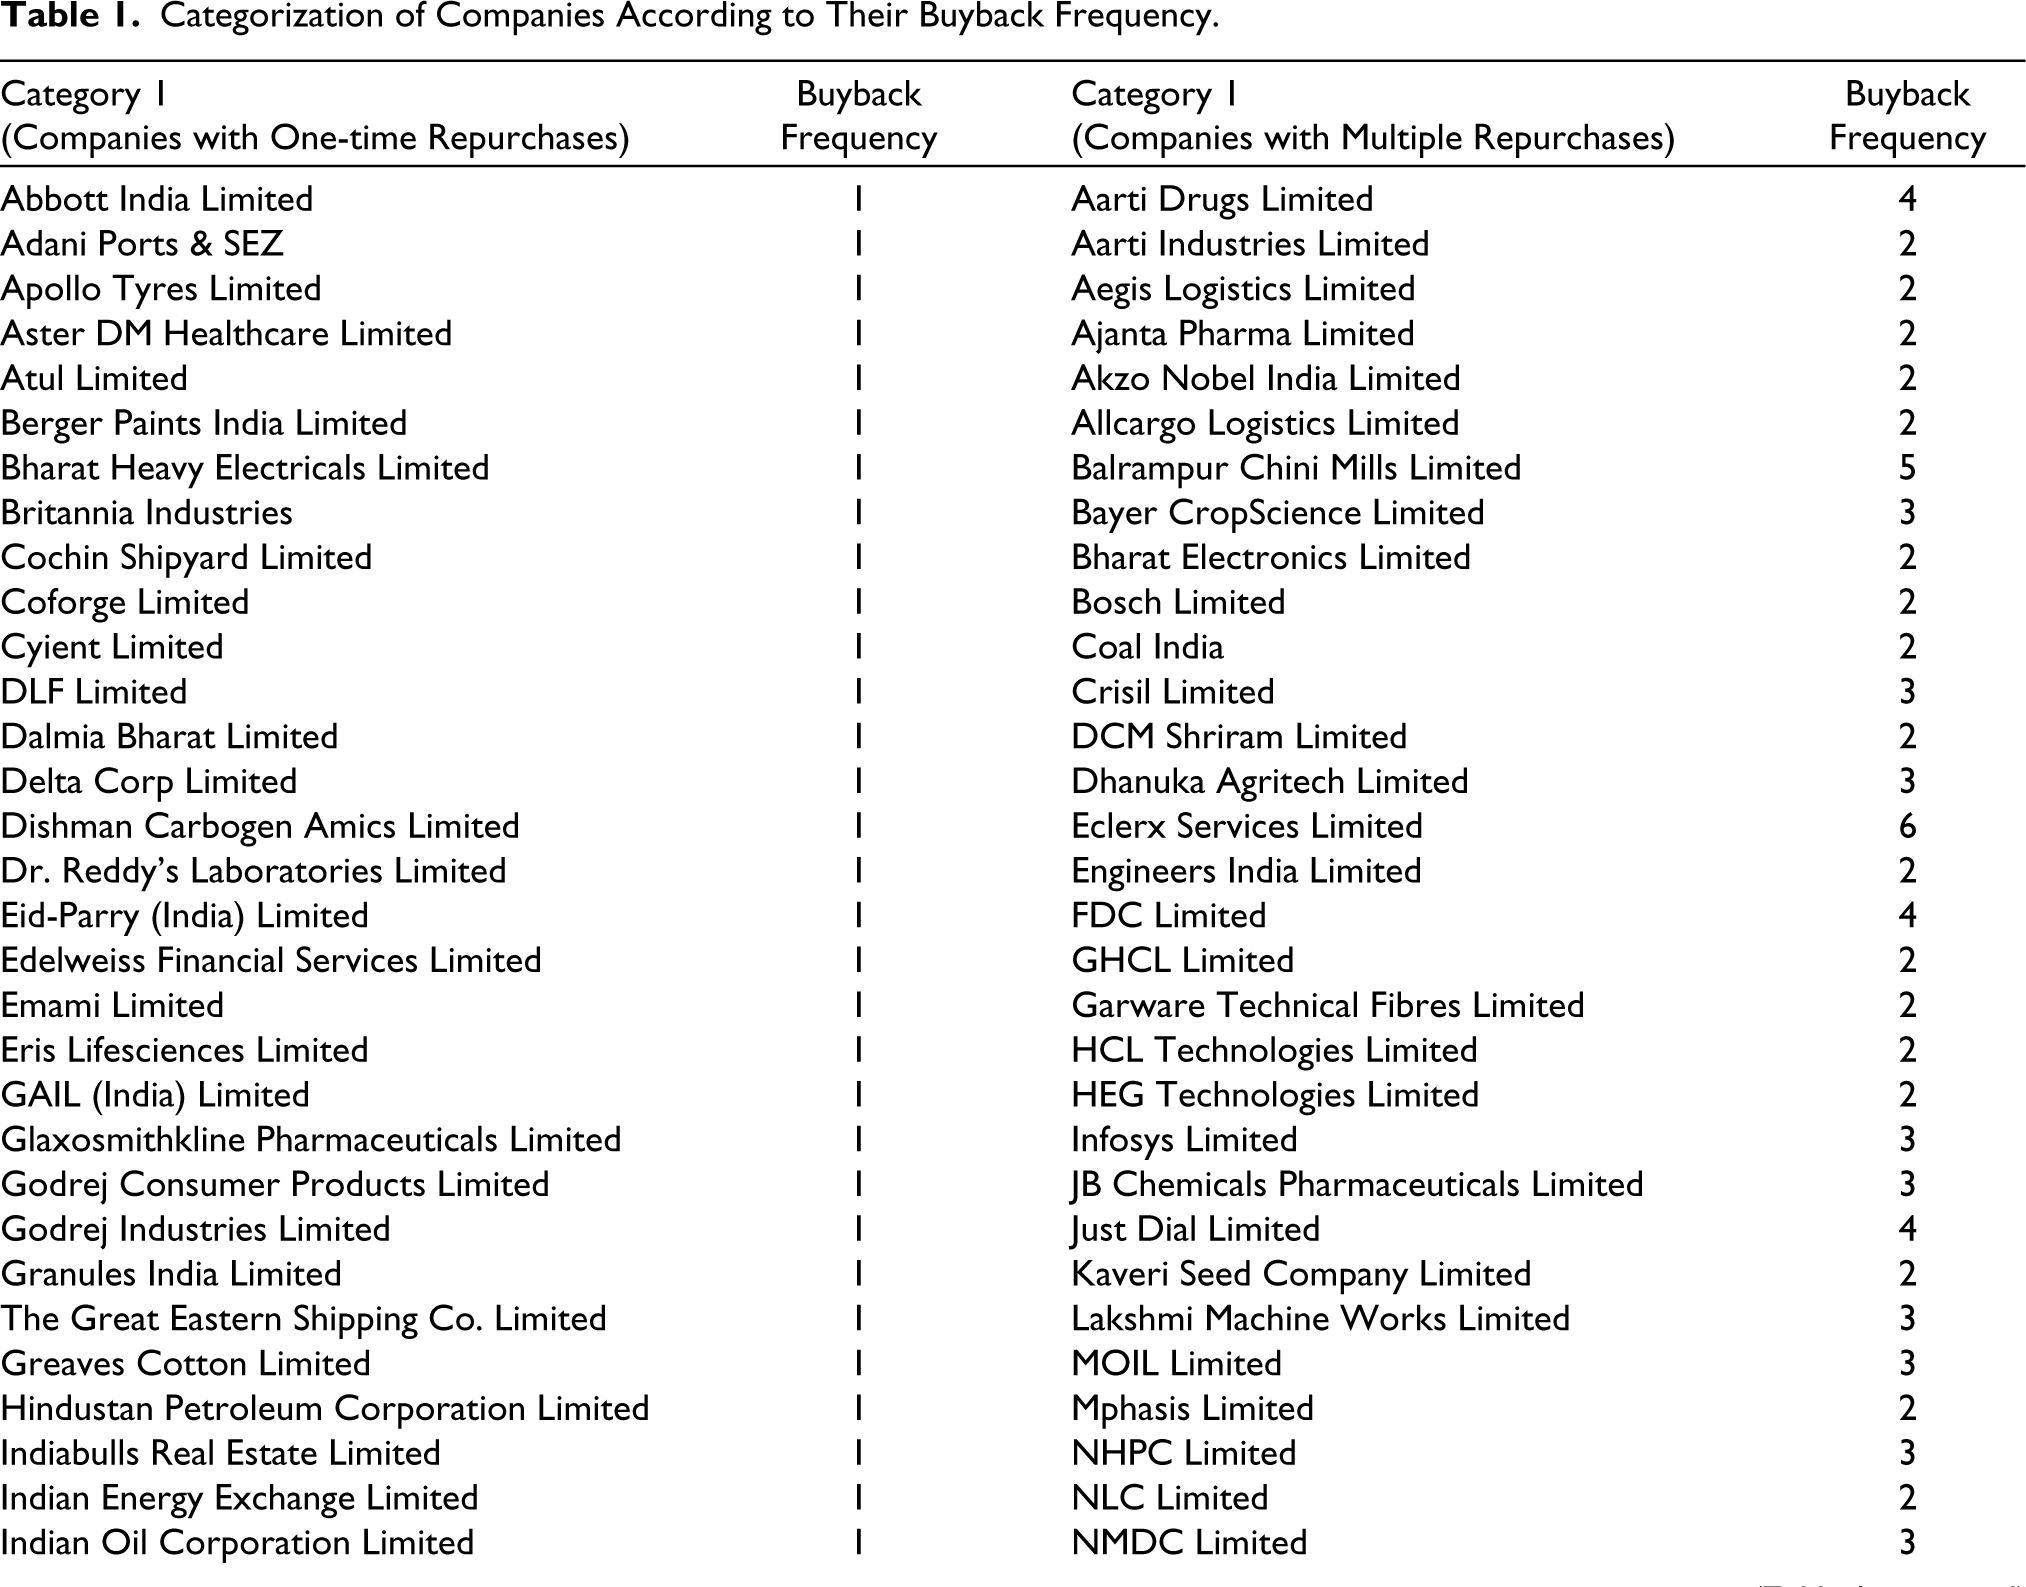
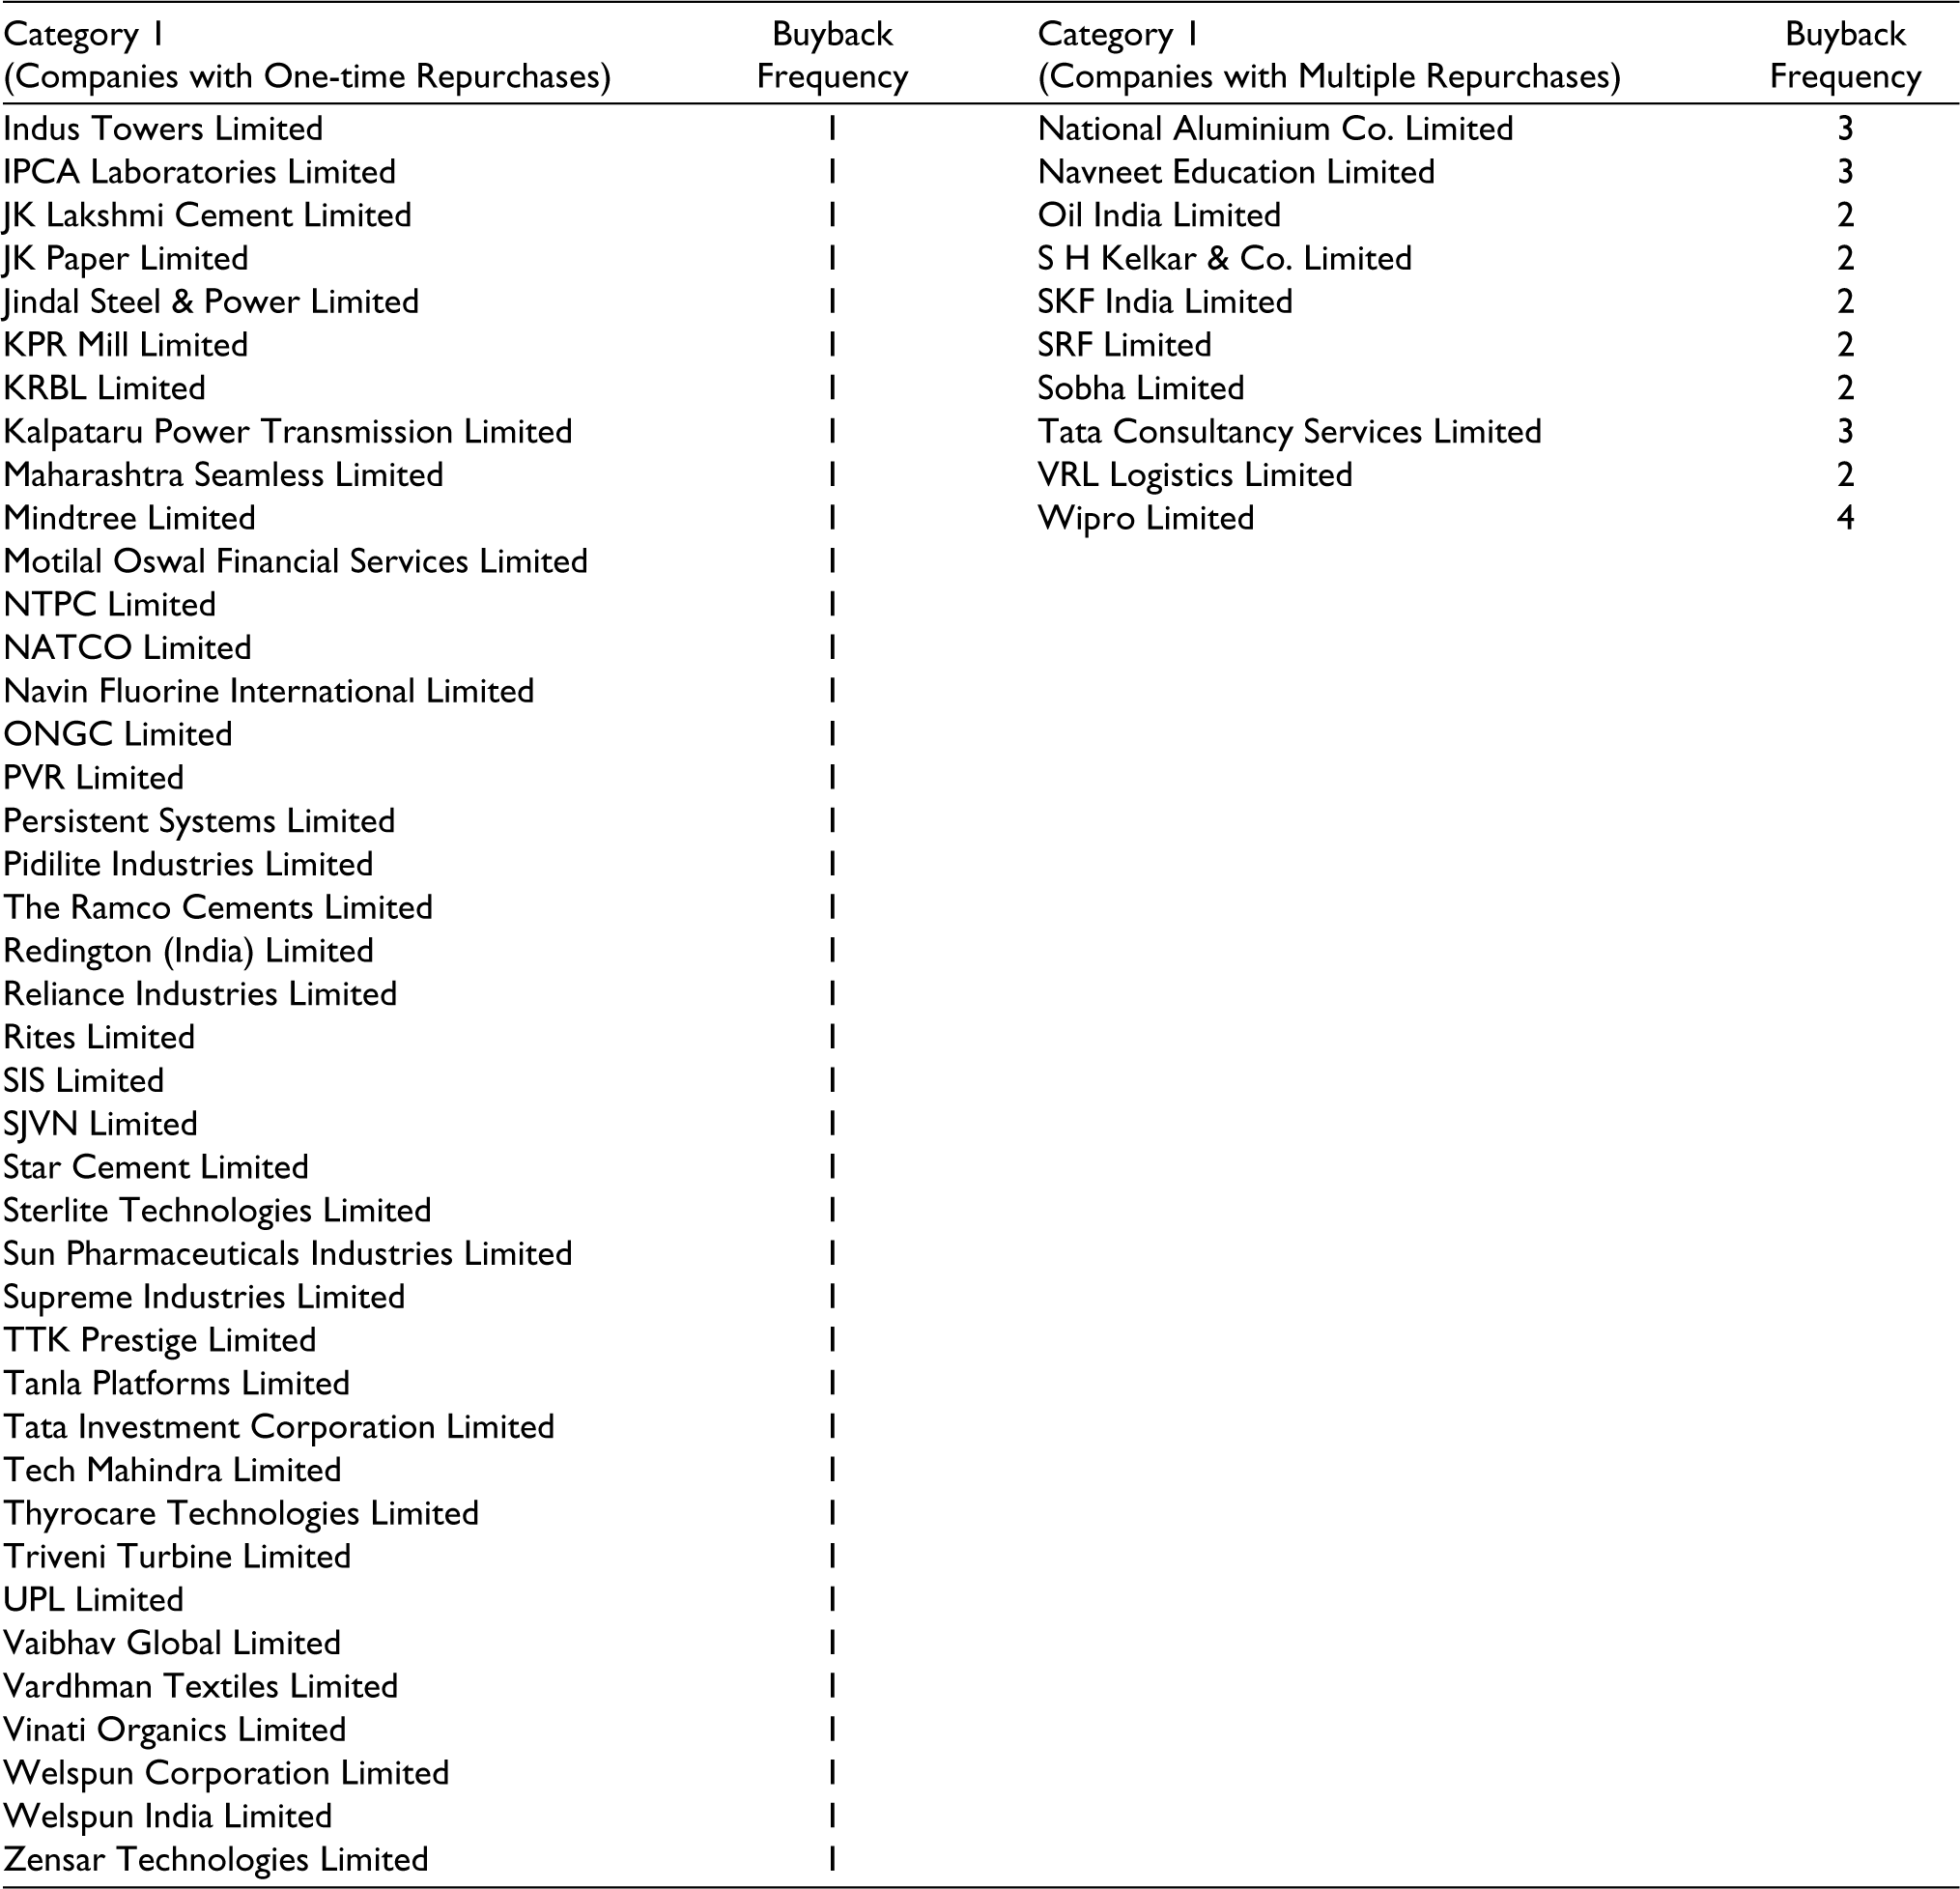
Table 2 illustrates the daily AARs and t-statistics for companies that have repurchased less than 5% of their common shares outstanding. The AARs and t-statistic results are statistically significant and positive on t − 4 and t − 2 for the entire 31 event days. The results are not statistically significant and are negative on the announcement day. The t-statistic results appear to be statistically significant on t + 7, yet it is negative.
Daily AARs and t-Statistic as per Market Model (Companies with a CSO > 5%).
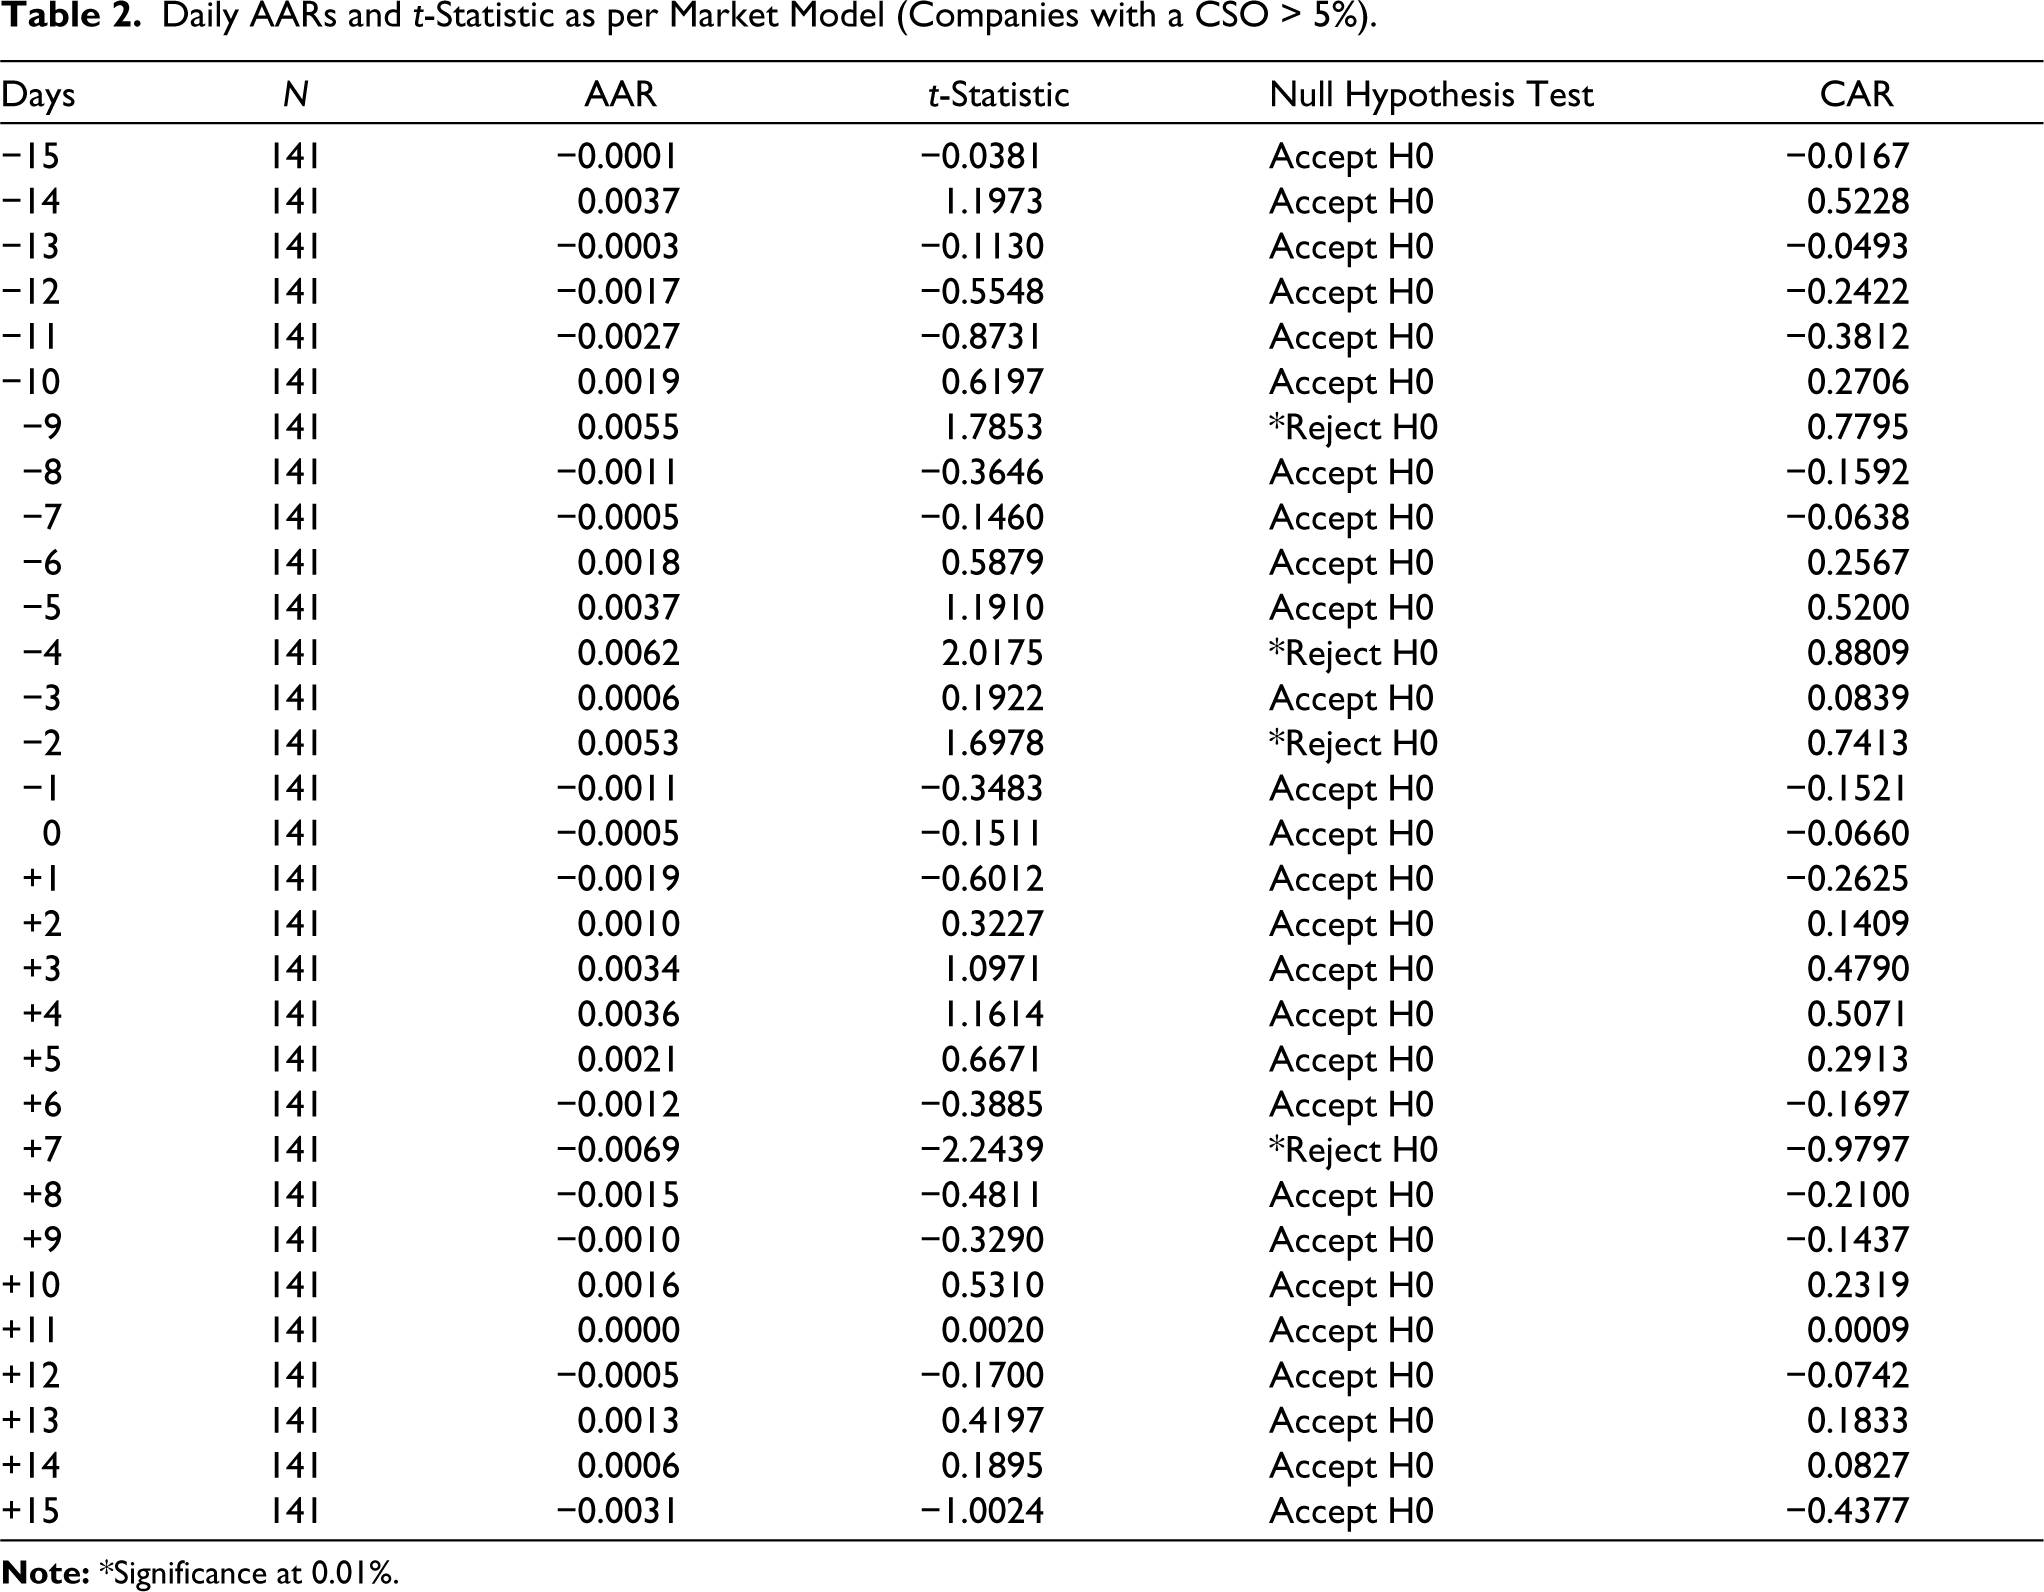
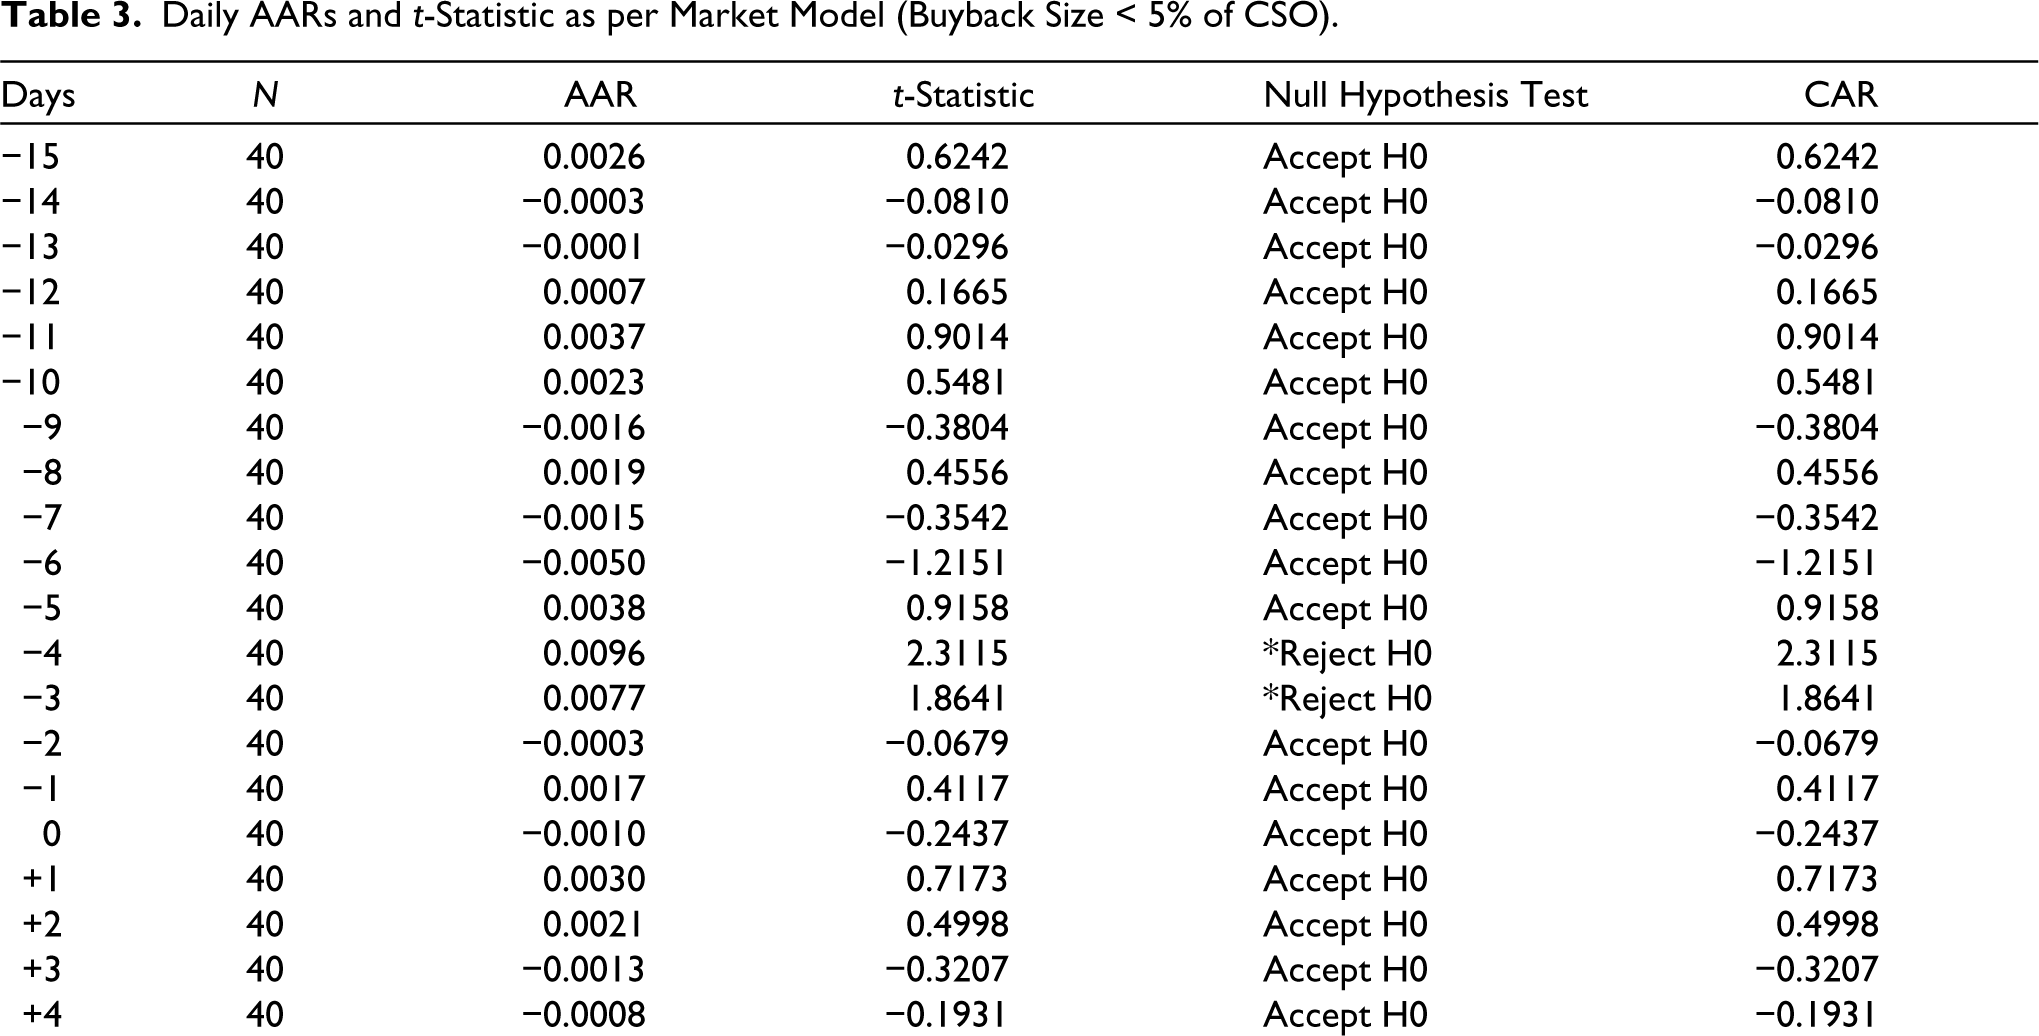
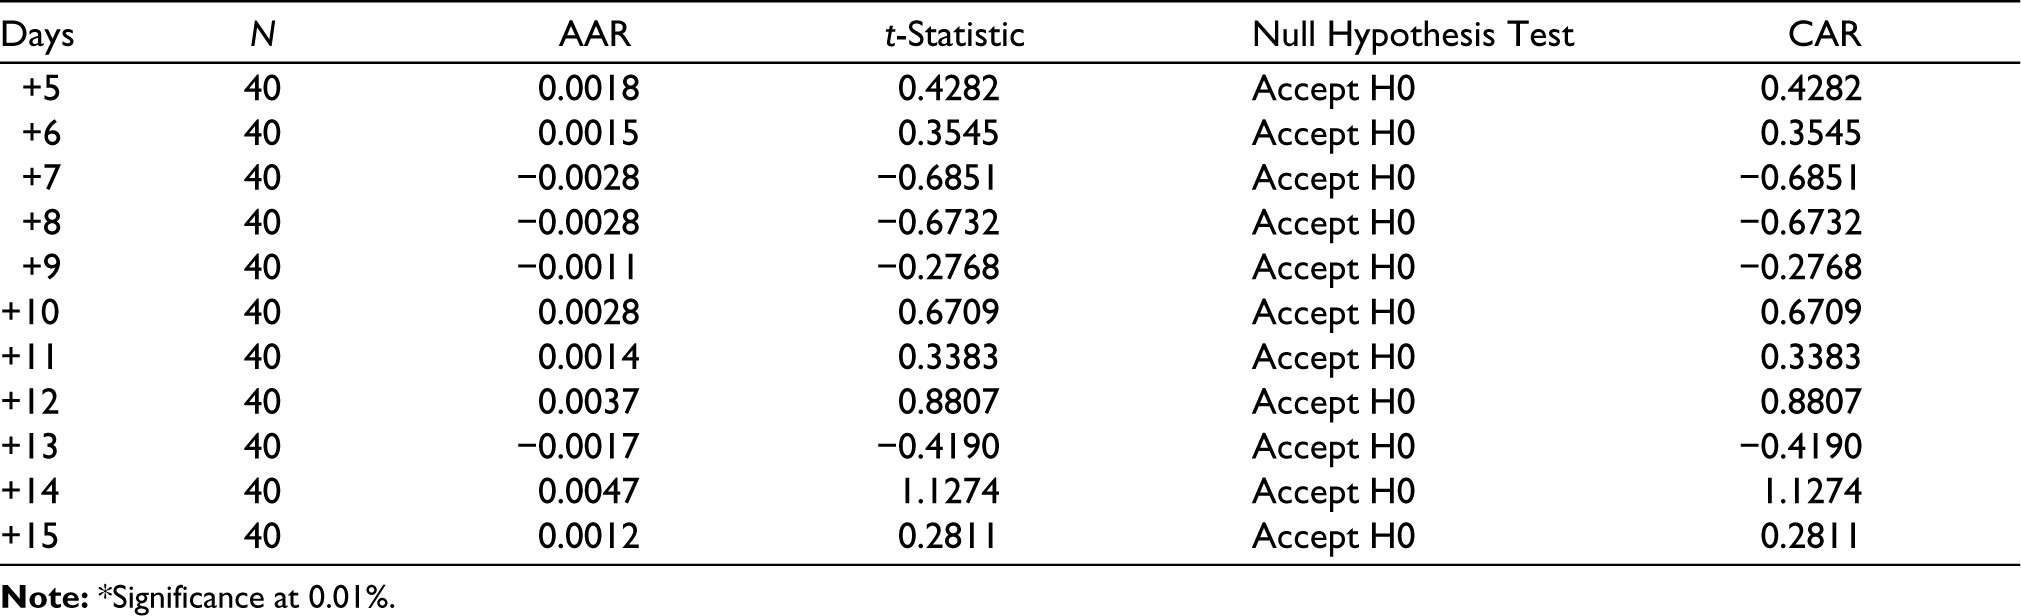
Table 3 shows the AARs and t-statistic for corporations that repurchase more than 5% of their stock. Only two trading days of t − 4 and t − 3 show positive and statistically significant results within the 31-day event window, according to the t-statistic data.
Daily AARs and t-Statistic as per Market Model (Buyback Size < 5% of CSO).
Share repurchases and frequency: We have discovered that a few corporations in the Indian market are frequent stock repurchasers, while others are not. The idea is to see how the frequency of share repurchases affects stock prices. We hypothesize that firms that repurchase frequently will have higher ARs than firms that repurchase infrequently. We have divided the sample companies into two groups: those that repurchase shares just once and those that repurchase shares multiple times (Lee et al., 2005).
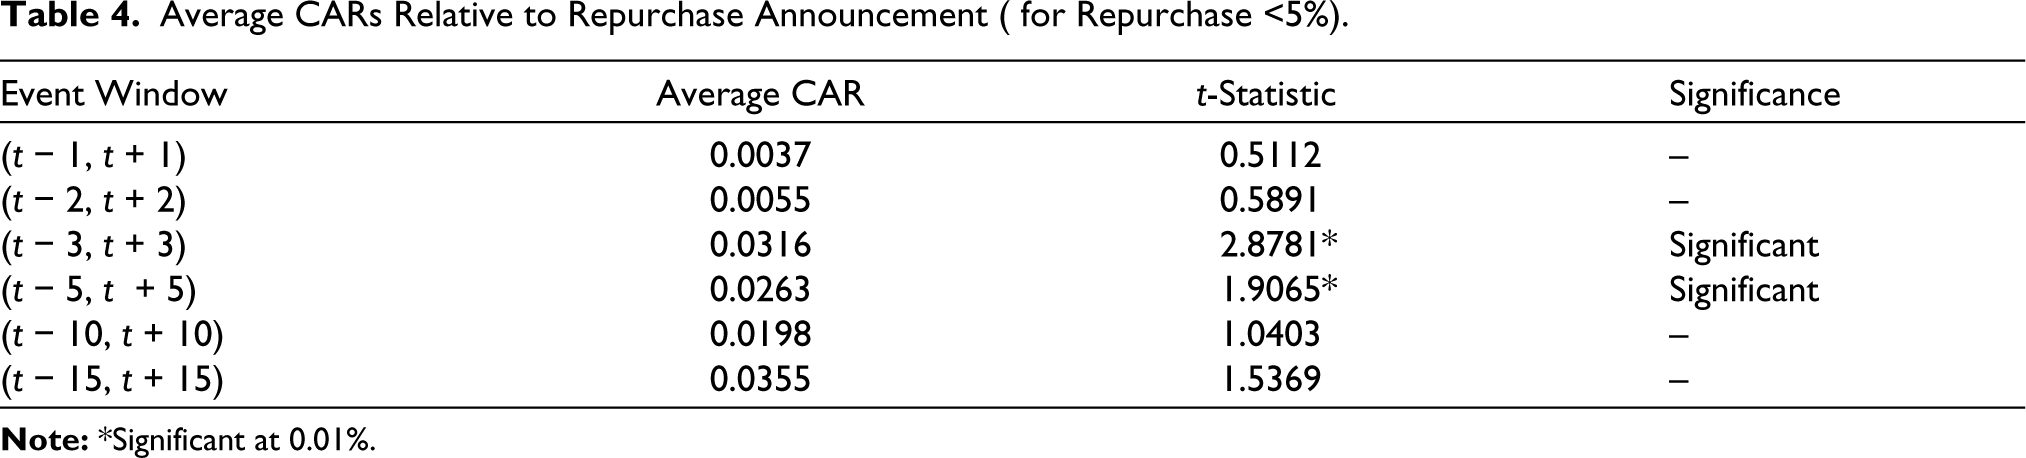
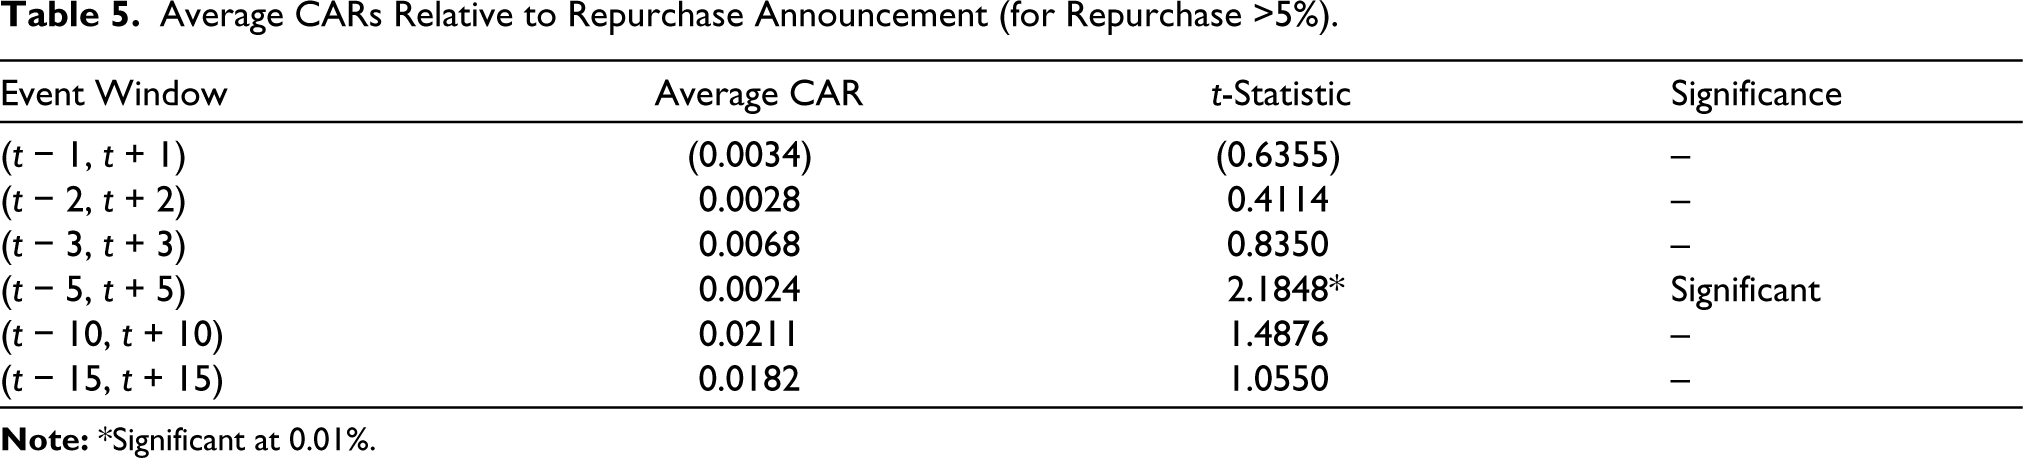
Table 4 shows the average CARs for companies that repurchase less than 5% of common share outstanding versus companies that repurchase more than 5% of common shares outstanding. For companies with a repurchase size of <5%, the average CAR appears to be statistically significant only for the (t − 3, t + 3) and (t − 5, t + 5) event windows, but not for the rest. The ARs in the pre-event window inspired us to further divide the event windows into small windows, especially in the pre-event period, to see if these short windows allow investors to achieve ARs. For companies with a repurchase size of >5%, the average CARs are statistically significant for the (t − 5, t + 5) event window.
The AAR and t-statistic results for companies with single repurchases, which is our initial category, are shown in Tables 5 and 6. During the entire 31-day event window, the companies generated no ARs on any of the days because the outcomes were not statistically significant. The results are positive but not statistically significant on the announcement day (t0).
Average CARs Relative to Repurchase Announcement ( for Repurchase <5%).
Average CARs Relative to Repurchase Announcement (for Repurchase >5%).
Daily AARs and t-Statistic as per Market Model (Companies with Single Repurchases).
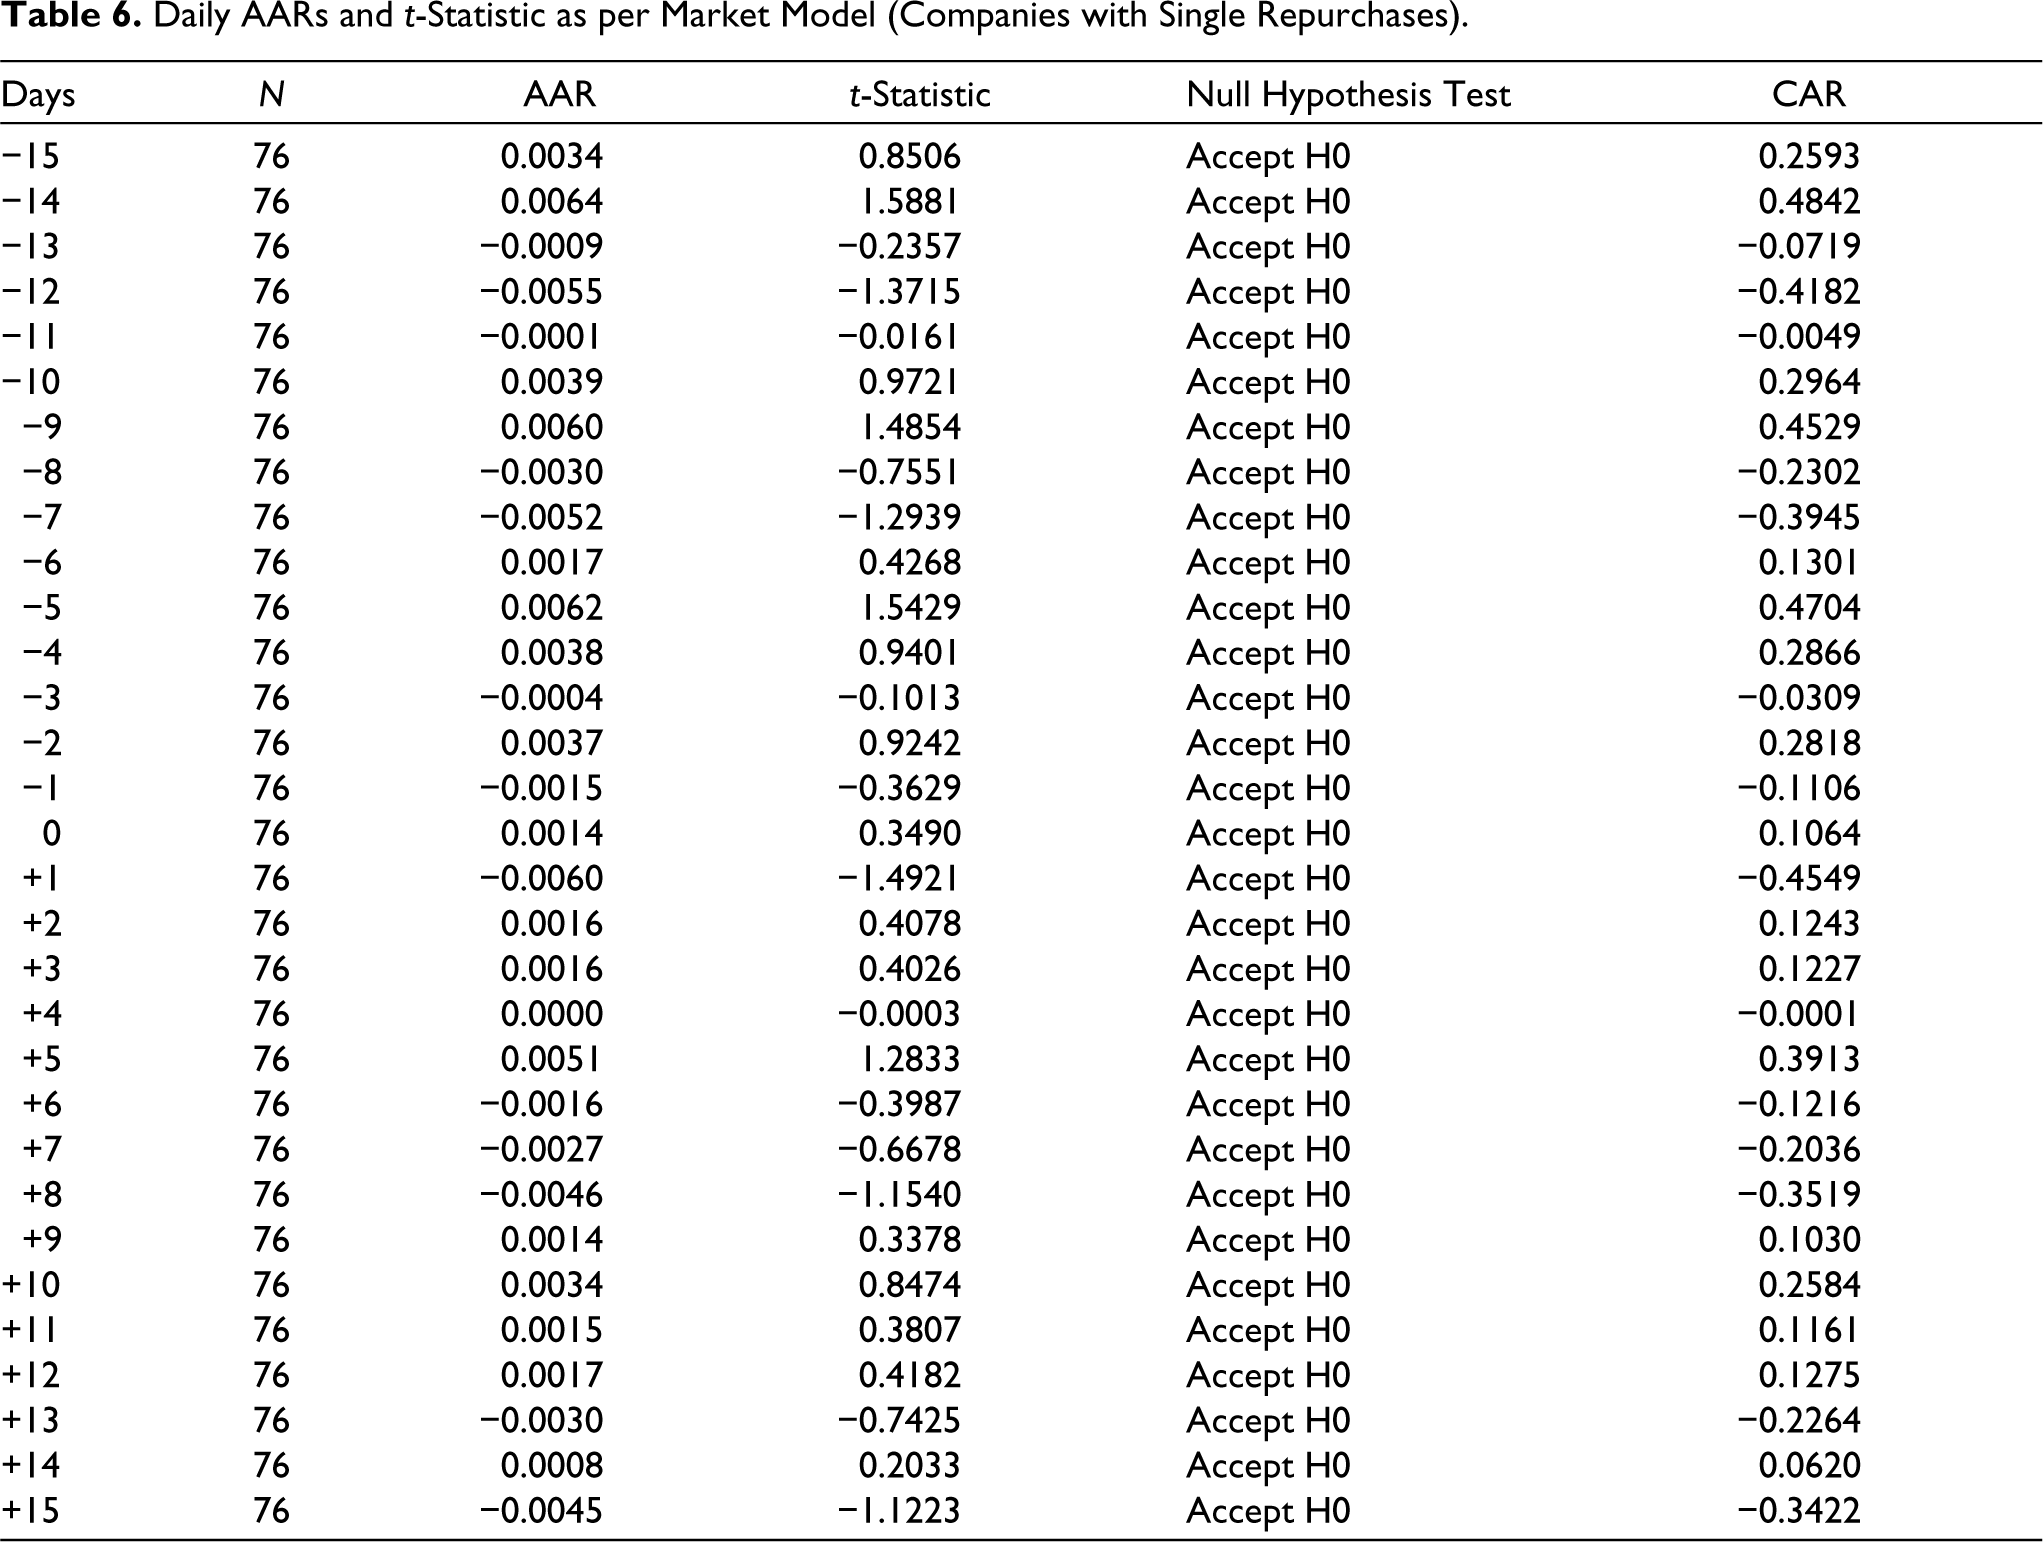
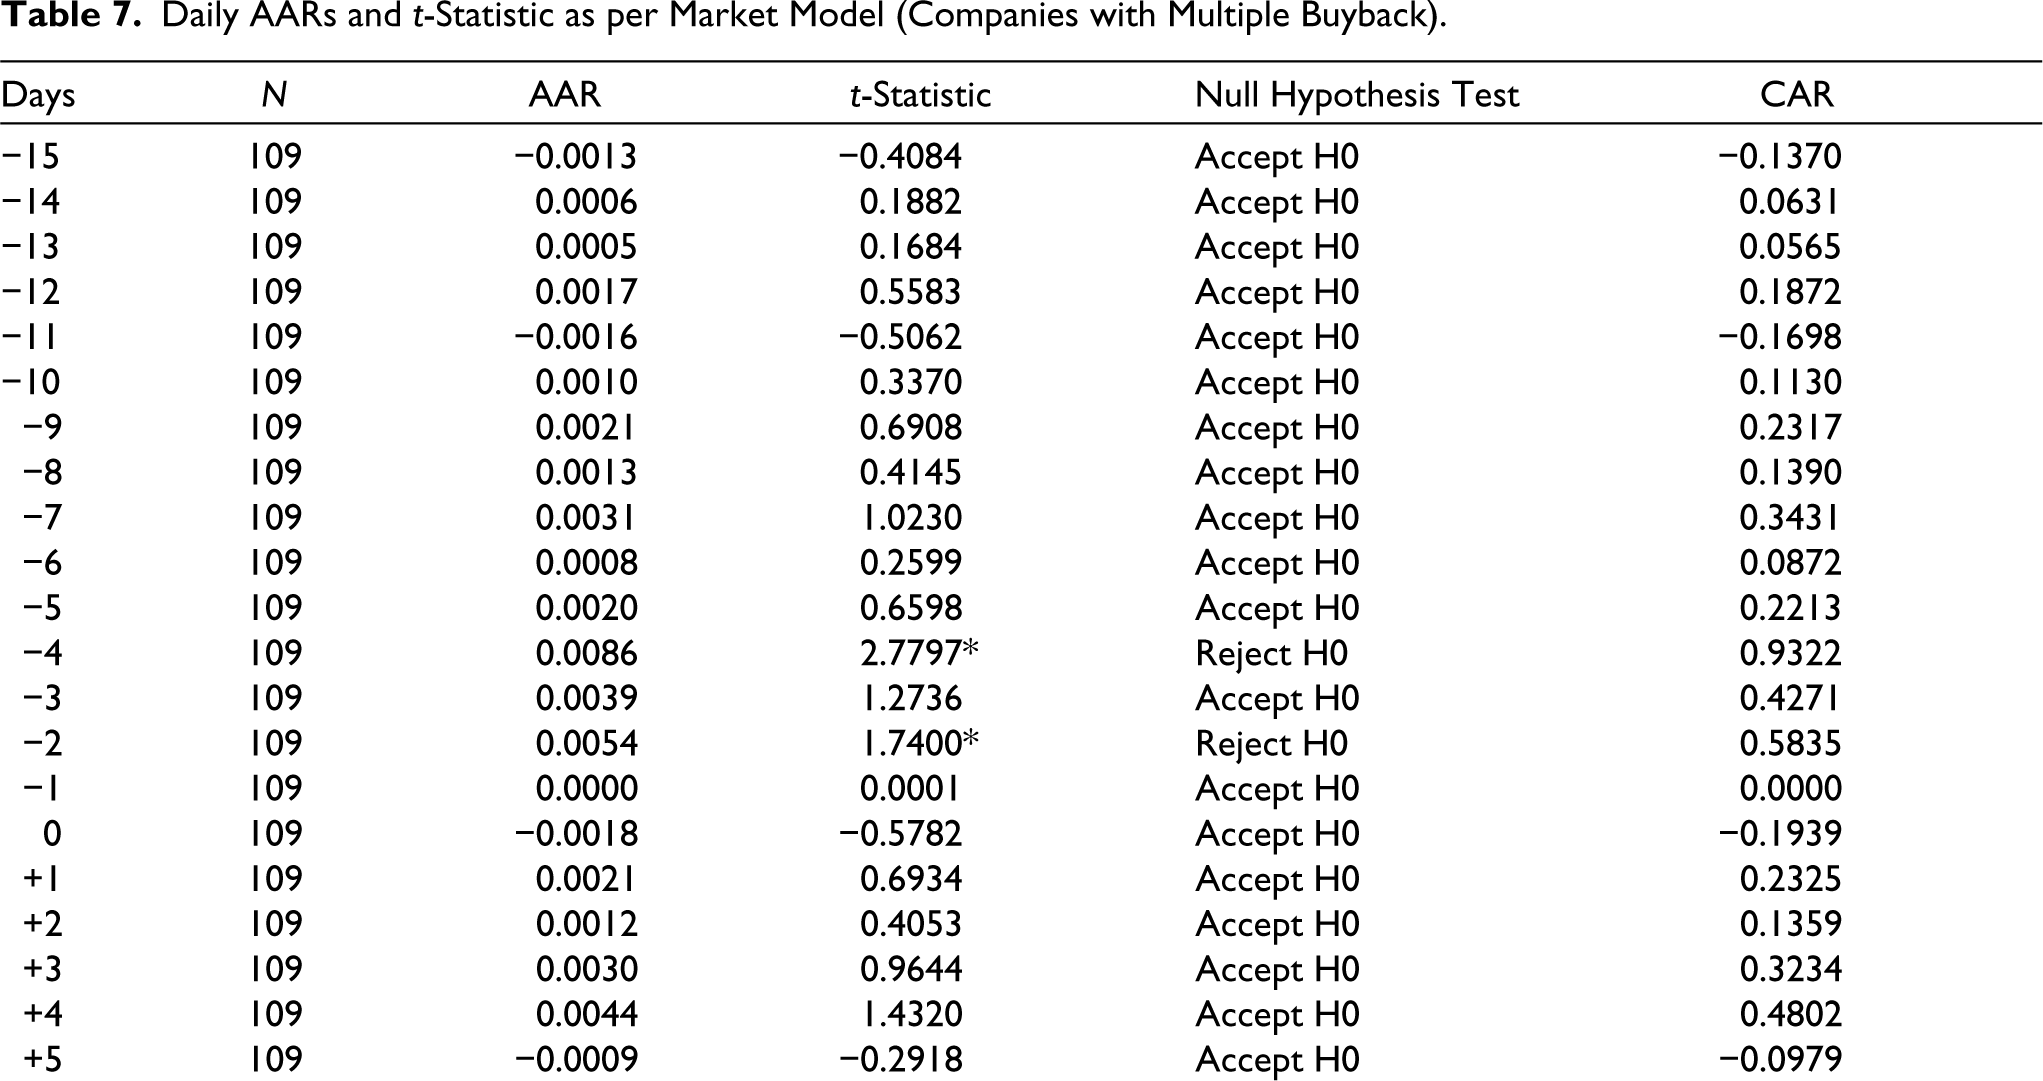
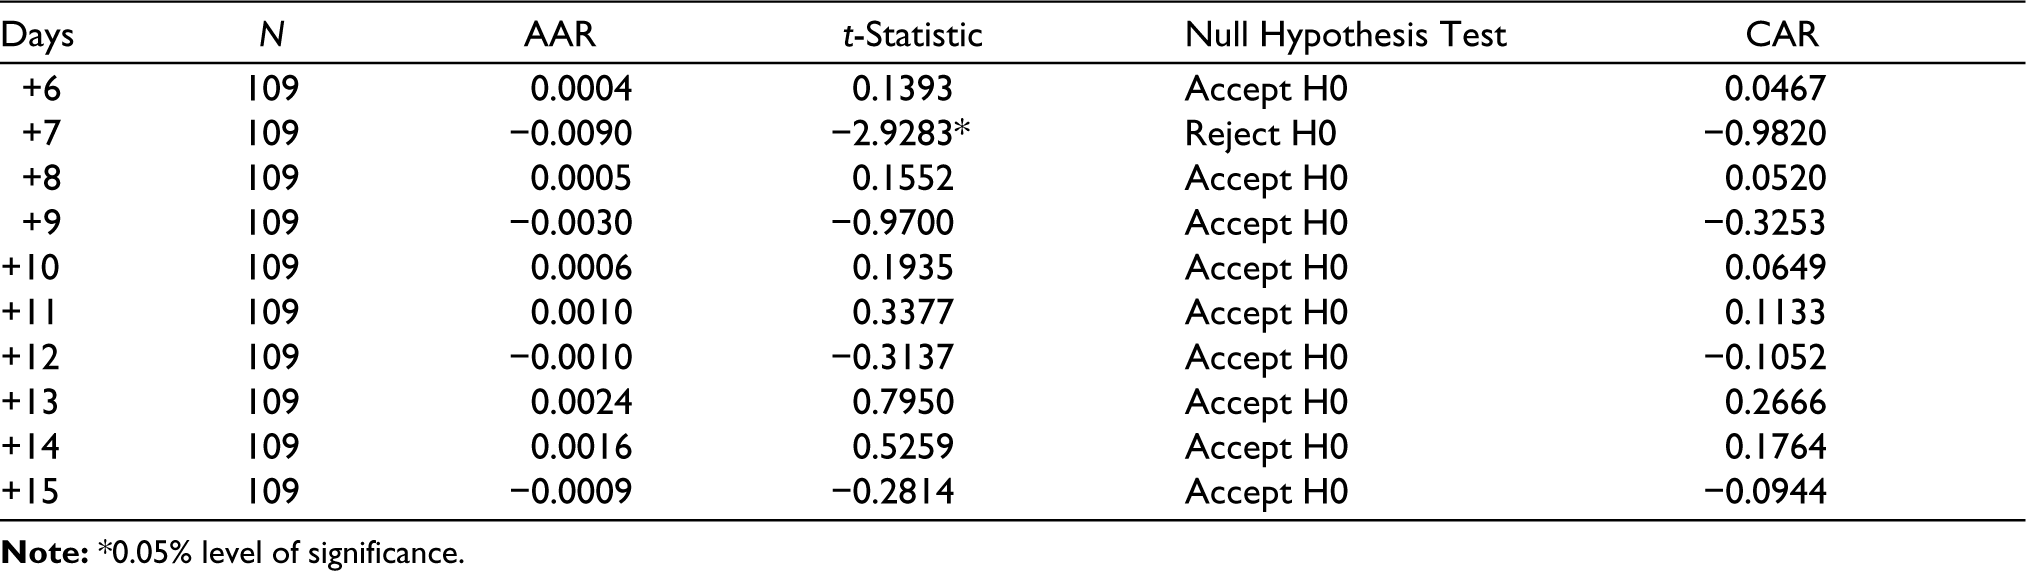
Table 7 displays the daily AARs and t-statistic for companies in the second category, comprising companies with frequent share repurchases. The results on t − 4 and t − 2 are positive and statistically significant within the 31-day event window, whereas the results on t + 7 day are statistically significant but negative. The data for the remaining event days are not statistically significant.
Daily AARs and t-Statistic as per Market Model (Companies with Multiple Buyback).
Conclusion
To strengthen the reliability of the current research, we focus on a larger sample of 181 repurchases and a longer time duration of 20 years. Additionally, our study is the first in India to look at how the magnitude (size) and frequency of share repurchase announcements affect the value of BSE 500 Index businesses. Based on the frequency of share repurchase announcements, we divided the sample companies into two groups. The AARs for the first category, which consists of companies making a single repurchase, have no ARs for the entire 31-day event window, whereas category 2, which comprises companies making multiple repurchases, has statistically significant results for the 31-day event window. Our findings are consistent with Farrugia et al. (2011) and Ridder (2014).
Comparing the share repurchases magnitude with share valuation, statistically significant results are seen for companies with repurchases of less than 5% of common shares outstanding. Surprisingly, companies that acquire more than 5% of their common shares outstanding also see statistically significant and favourable results. The market reacts with statistically significant positive returns before the repurchase announcement on announcement day (t0) the AARs are negative in companies with less than 5% common shares outstanding, more than 5% common shares outstanding, and for multiple repurchases. The AARs are favourable for companies with single repurchases on announcement day (t0).
The presence of statistically significant and positive returns for sample companies before the repurchase announcement calls attention to insider trading techniques in Indian corporations. Past studies on share repurchases have also emphasized the presence of insider trading in Indian markets (Pandey et al., 2020).
In conclusion, the research clearly shows that the frequency and size of share buybacks affect the sample firms’ valuation. According to our analysis, companies that engage in several buybacks have had statistically significant ARs. Thus, it asserts that corporations may generate larger profits by announcing repurchases more frequently. However, the size of share buybacks influences sample firms’ value in a way that ensures sample companies’ returns are statistically significant and positive regardless of the size of share repurchase. Therefore, magnitude has no bearing on a company’s valuation.
Contribution
Adding to the limited body of knowledge about the frequency and size of share repurchases worldwide is the primary contribution of the current study. Regarding stock valuation for India, the study is one of the first and most thorough attempts to investigate the impact of two important aspects of a share buyback programme on valuation: the size of the declared programme and the frequency of repurchases.
The results demonstrate that irrespective of the amount of the repurchases in proportion to the total number of outstanding ordinary shares, the size of the repurchases affects the stock prices of the sample businesses. Moreover, frequent repurchasing corporations have ARs in comparison to one-time repurchasing companies. For a variety of stakeholders, including investors, managers, and policymakers, the results have applications. Policymakers may enhance the many laws relevant to insider trading, managers can consider the findings before implementing corporate measures like share repurchases, and investors can shape their investing decisions and tactics appropriately.
Implications and Scope for Future Studies
With the increasing number of repurchases each year, share repurchases have become a fascinating topic for Indian markets. There are significant differences in the magnitude of shares bought back among repurchasing companies. In addition, few companies engage in repurchases on a year-to-year basis. This prompts the researchers to investigate the impact of the size and frequency of share repurchases on valuation.
The primary goal of this research is to add to the existing literature by offering more insights and empirical evidence on how the magnitude and frequency of repurchases affect the company’s value. According to our empirical findings, the size of the repurchase programme did not influence the stock prices of the sample companies. Regardless of the size of their repurchases, companies continue to see ARs. However, there appear to be differences in ARs between firms that repurchase frequently and those that repurchase infrequently. Statistically significant ARs are found for companies that repurchase shares frequently.
Various stakeholders, such as investors, managers, and policymakers, will benefit from the findings. Investors can frame their investment decisions and strategies accordingly, and managers can incorporate the findings before taking corporate actions like share repurchases. Our findings have policy implications since they indicate evidence of insider trading because statistically significant abnormal returns accrue to the sample companies before the announcement date of share repurchases.
Several other variables affect share repurchases of companies which are left for future assessment.
Footnotes
Declaration of Conflicting Interests
The author declared no potential conflicts of interest with respect to the research, authorship and/or publication of this article.
Funding
The author received no financial support for the research, authorship and/or publication of this article.