
Abstract
The political budget cycle (PBC) theory deals with increased spending or decreased revenue collection, or a combination of both, on the verge of an election by the incumbent government to retain office. Empirical verification of the PBC theory at the subnational local government level is scarce in the literature. Subnational local governments are more prominent in population and budget for a country like India. This study takes into account 34 municipal corporations in India to examine the PBC theory and find strong evidence of politically motivated cycles on the budget expenditure and revenue front. Notably, the more visible expenditure on welfare schemes shows increased spending during an election period. On the revenue side, this study also finds evidence in support of the PBC theory. Indian municipal corporations are creating ‘welfare’ and ‘infrastructure’ cycles during the election period to gain political profit and are validating the ‘visibility’ and ‘targetability’ hypotheses described in the literature. This study is the first attempt to trace the presence of the PBC at the subnational local government level in India.
Introduction
In the past four decades, the issue of political action of incumbents for re-election prospects has received much attention from researchers. Nordhaus (1975) 1 was the first to put forth an analytical framework to analyse the idea of private motives of a government to gain political profit rather than performing as a pure planner. Politicians, like anyone else, are motivated by their self-interests and profit motives. The political budget cycle (PBC) theory describes how the incumbent party resorts to action to retain power with fiscal profligacy on the verge of an election.
The etiquette of government as a social planner in public choice theory is grafted into politico-economic models with varying assumptions on the behaviour of economic agents, that is, government and voters. Such studies assumed ‘myopic’ and ‘rational’ voters with ‘office-motivated’ and ‘ideological’ incumbents and the manipulation of policy instruments and outcomes. Most of these studies were initially carried out for advanced industrialised economies and later on for less developed countries. Recent studies have concentrated on a temporary fiscal boost to captivate voters, which was referred to as ‘political budget cycles’ (Rogoff, 1987; Tufte, 1978), and electoral cycles with varying factors during the election period. The decentralisation of government power allows us to study the interaction between politics and economics at the subnational level.
Politico-economic models of Nordhaus type 2 deal with the strategic actions of office-motivated incumbents to retain power. In a world of rational economic agents, it is necessary to answer the question of a political cycle. After a decade, a budget issue called the PBC arises following a temporary information asymmetry in a world of rational incumbent and non-myopic voters. Information asymmetry between economic agents favours the government to appear as a competent player (Rogoff, 1990; Rogoff & Sibert, 1988). This competency refers to policymakers’ ability to keep inflation relatively low with a low unemployment rate. Rogoff (1990) envisaged the ‘visibility’ hypothesis, in which the government concentrates its action more on current spending than on capital spending as elections approach. Shifting resources to more visible factors such as pensions, social security and subsidies on the verge of elections is used as a trump card to please the voters.
In contrast to the visibility approach, the switching of budget resources to capital spending from current spending is called a ‘targetability’ hypothesis. Most of the funds are allocated to building schools and hospitals, constructing roads and bridges and so on. The principle behind this approach is that capital spending is used as the primary tool to target groups with special interests and focus on specific geographical areas. Recently, elections of legislative and executive bodies in Japan found a pre-electoral increase in capital spending weighing higher than total spending in both cases (Fukumoto et al., 2020).
This study examines these two hypotheses in the context of municipal corporations (MCs) in India. These MCs have welfare and development programmes for the urban poor, such as Swarna Jayanti Shahari Rozgar Yojana, Valmiki Ambedkar Awas Yojana and Atal Mission for Rejuvenation and Urban Transformation, and many other own programmes and grants the MCs with special consideration to the economically deprived section. 3 The concentration of funds on these welfare schemes during mayoral elections will identify the visibility hypothesis in India. Moreover, the municipal infrastructure in India has experienced prolonged fiscal underinvestment that spans several decades. This enduring pattern of underspending applies a constraint on the country’s capacity to achieve sustained growth and prosperity, as outlined in the report by the High-Powered Expert Committee (HPEC, 2011). The core of the present political cycle analysis is how Indian MCs look upon public infrastructure provision. The spending on the construction of roads, flyovers and bridges on the verge of elections is clearly evidence of the targetability hypothesis. This study explores these two hypotheses by taking into account the funds allotted to welfare and infrastructure heads as elections approach. The concentration of funds on these two expenditure heads will validate the incumbents’ visible and targetable strategies. Instead of looking into either welfare or infrastructure funds alone, this study brings to the fore these two major spendings to study the effect of elections on budgetary resources.
The rest of the article is structured as follows: The theoretical models of PBCs with a brief review of relevant literature are presented, followed by the background and institutional structure of MCs in India. Data description and empirical methodology adopted in this study are provided in the section that follows, while the penultimate section presents and discusses the results. The article concludes with some policy implications.
Literature
In general, economic theorists consider the government’s actions as a social planner to achieve social welfare despite the profound significance of governmental decisions in all aspects of economic activity. They treat these actions as exogenous in the general equilibrium theory. The nexus between politics and economy has become a captivating area of research and recognised the motives of those who run the government beyond their mere social planner character. Anthony Downs (1957, p. 137) stated that ‘in a democracy, the government always acts so as to maximise the number of votes it will receive. In effect, it is an entrepreneur selling policies for votes instead of products for money’.
Early Politico-economic Models: Pre- and Post-rational Expectations 4
The government’s political influence on economic policies has been a fascinating field for researchers from economics and politics. Economic theorists had treated the government as an interference rather than an intrinsic part of economic life (Downs, 1957). Politico-economic models were enthused after the groundbreaking contribution of Nordhaus (1975), termed the ‘political business cycle’, with office-motivated incumbents and voters with naive expectations. He used the short-run Phillips curve and found that the government manipulates the economy for political profit. According to Hibbs (1977), political ideology plays a role in the choice of economic policies. This ‘partisan theory’ differs from the former in the sense of ideology-based politicians and voters who were aware of these partisan differences. Hibbs argued that Democrats (or leftist parties in general) formulate policies to lower the unemployment rate with a higher price level than Republicans (or right-wing parties). Both these major contributions are criticised by the rational expectations revolution that they are heavily based on the short-run Phillips curve.
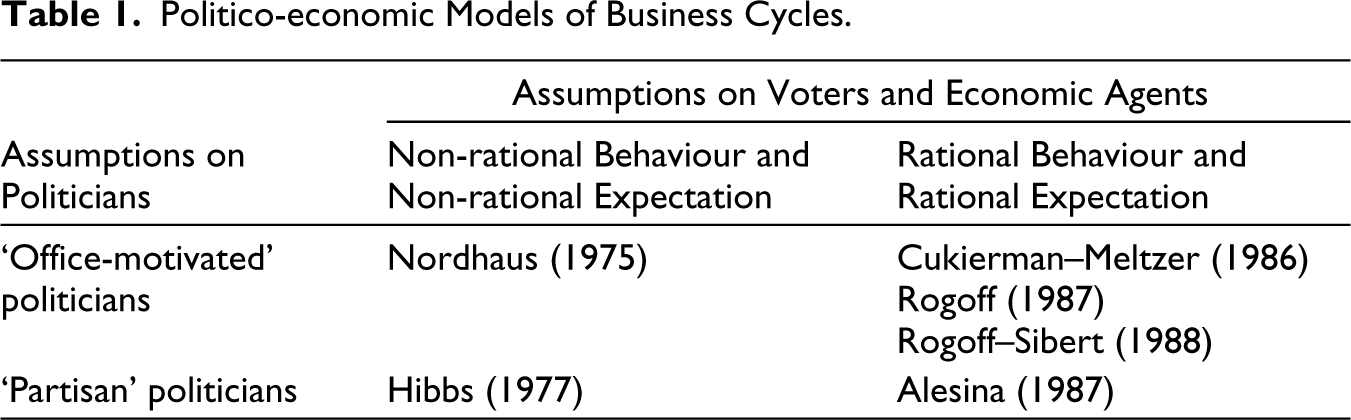
However, both the Nordhaus and Hibbs models were somewhat displaced during the rational expectations revolution that prevailed in the macroeconomic discourse from the mid- to late 1970s. In the mid-1980s, Cukierman and Meltzer (1986), Rogoff (1987) and Rogoff and Sibert (1988) added rationality to the office-motivated incumbents. Alesina (1987) put forth the rational partisan theory, stating a post-electoral cycle through contingent wage adjustment or labour contracts that deviate the real economic activity from its natural rate and its effect based on ideological differences of the party in power. Similarly, Rogoff (1987) and Rogoff and Sibert (1988) substituted voters’ irrationality with the information asymmetry between voters and incumbents to theorise it as a budgetary problem rather than an unemployment–inflation trade-off. The primary theoretical classification that explains politico-economic models of business cycles is presented in Table 1, as described by Alesina (1988).
Politico-economic Models of Business Cycles.
Political Budget Cycle: A Brief Story
The political business cycle gradually transmuted into the PBC in the early 1990s by the empirical literature. In the literature, the weak co-movement of real economic variables led studies to pay significant attention to fiscal policy instruments. Drazen (2001) found monetary surprises as an unconventional tool for political profits and insisted on a fiscal choice. Shi and Svensson (2006) studied this relationship between fiscal policies from a panel of democratic countries and elections. They found, on average, an increase in the government fiscal deficit at a par of 1% of GDP in election years. Brender and Drazen (2005) investigated new and old democracies and argued that the prevalence of political fiscal cycles is higher in newer democracies in which voters are inexperienced with electoral politics than in established democratic countries. Hanusch and Keefer (2014) extended this to more democratic countries on political credibility and reported a similar finding. From a microlevel study, Bojar (2017) identified that individuals’ propensity to vote for the ruling government, on average, tends to increase with pre-electoral deficits. The majority of the literature is concentrated on the application of the PBC theory in democratic countries. However, Shmuel (2020) hypothesised and empirically demonstrated its application to autocratic governments as well and found that the political cycle is weak in strong autocratic and democratic countries, while it is more evident in lesser autocratic and democratic countries.
Further, many studies found evidence for PBCs: for example, Block (2002) for Africa; Sieg and Batool (2012) for Pakistan; Sen and Vaidya (1996), Lalvani (1999), Saez and Sinha (2010) and Uppal (2011) for India. 5 Khemani (2004) found an electoral cycle on road infrastructure rather than overall fiscal spending during Indian state elections. To gain/maintain influence over Indian states with a significant number of swing voters, higher per capita transfers are channelled towards these states in election years and disproportionately to core states in non-election years as a strategy of the incumbent central government to earn votes (Ahmad, 2020).
On the other hand, some studies provide evidence against this theory and offer an alternative view. They found that fiscal profligacy does not influence voters who are vigilant towards the government’s actions. Schultz (1995) criticised the government’s transferring payments for votes and found that this action dampens the reputation, thus making the incumbent lose votes. An endogenous election period could create political surfing than an electoral cycle, in which politicians can call for an election when they are in a good state both economically and politically (Chowdhury, 1993). The argument here is that politicians look for positive economic cycles to place the elections for more political gains.
Knowing the local politics and tweaking policies to achieve electoral goals is a crucial aspect; as a consequence, local PBCs have received much attention in recent years. Coelho et al. (2006) studied all mainland Portuguese municipalities and found evidence of increases in local employment generation through pre-election expenditure during mayoral elections. Further, Veiga and Veiga (2007) found that the economic condition at the local level is improved by increased expenditure during mayoral elections in Portugal. Besley et al. (2004) found that more significant spillovers such as construction of roads and bridges are more visible during gram panchayat elections in India. Guo (2009) found that local Chinese politicians manipulate fiscal policies to gain a higher political position in their cadre system. Rather than looking for cycles on expenditure, some studies focused on the revenue part of the government, primarily on reduced tax for electoral gain, for example, Laopodis et al. (2016) for Greece and Foremny and Riedel (2014) for Germany.
Political Budget Cycle: Visibility and Targetable Hypotheses
Visibility Hypothesis
Rogoff (1990) argues that the perceptibility of public expenditure is significantly associated with current expenditure rather than with capital expenditure. His argument does not suggest an inherent visibility in current expenditure, but underscores their immediate visibility and, consequently, their more direct political efficacy, especially during the pre-election period. Conversely, capital investments often involve prolonged projects, and synchronising their completion with electoral timelines may pose challenges. Moreover, the increased probability of incomplete projects during elections carries political risks for incumbents, potentially casting them as incapable of delivering promised benefits (Block, 2002). The government reallocates budgetary allocations from capital expenditure, such as infrastructure construction (e.g., roads, schools and water plants), to current expenditure, encompassing social security, subsidies and wages. This shift is motivated by the higher visibility of the current expenditure to voters, which effectively communicates the incumbent’s competence. Empirical substantiation for this ‘visibility’ hypothesis is presented by Akhmedov and Zhuravskaya (2004), Katsimi and Sarantides (2012) and Vergne (2009).
Targetable Hypothesis
Traditional theories, as exemplified by Tufte (1978), anticipate that governments increase the total expenditure and reduce taxes just before an election, which is in contrast to their post-election behaviour. In contrast to the specific focus of PBCs, a more extensive body of public choice literature underscores the crucial role of organised interest groups that are capable of exerting political influence on legislators to endorse policies aligning with their interests (Bates, 1981; Buchanan & Tullock, 1962; Krueger, 1993; Olson, 1965). Grossman and Helpman (1996, 2002) employed a model that incorporates campaign funding and voter mobilisation to establish an association between the impact of special interests and the electoral competition process. Considering this perspective, it is logical to draw connections between the research on PBCs and the literature addressing special interest politics. Drazen and Eslava (2004, 2005) introduced an inaugural formal model that integrates special interest groups into an intertemporal framework of the political cycle with rational voters.
This model proposes the significance of differentiating between targeted and non-targeted categories of public expenditure. Although this categorisation is neither readily accessible nor uncomplicated, the existing literature widely asserts that capital spending for investment projects is notably ‘targetable’ among various spending categories (Bates, 1981; Ferejohn, 1974; Eslava, 2005; Keefer & Knack, 2002; Tanzi & Davoodi, 2001). The government modifies the configuration of the budget by shifting from current expenditure to capital expenditure, as proposed by Gonzalez (2002) and Schuknecht (2000). This adjustment is grounded in the premise that capital expenditure is more amenable to being targeted by special interest groups or specific geographical constituencies, thereby constituting a more efficacious strategy for the incumbents in securing electoral support. Empirical validation for this ‘targetability’ hypothesis is derived from research conducted by Drazen and Eslava (2010), Khemani (2004) and Schuknecht (2000).
The present study contributes to the literature by examining the PBC theory for India’s third-tier urban local government. To the best of our knowledge, this is the first study in this line of research.
Municipal Corporations in India
The historical background of Indian municipal governance can be traced back to 1687, when Madras received its municipal character. In 1882, Lord Ripon, Father of Local Self-Government, introduced a resolution to replace the autocratic administration system with democratic forms of local administration bodies. Constitutional foundations of urban local self-government came into force with the 74th Constitutional Amendment Act (CAA), 1992, which finds a place in Schedule IX-A of the Indian constitution.
6
The 74th CAA laid down the functions to be fulfilled by urban local bodies (ULBs), such as obligations to constitute ward committees in cities with a population of 300,000 or higher, periodic municipalities election [Article 243(K)] and devolution of funds, and operations of ULBs as per the recommendations of the state finance commissions (SFCs) (Basu, 2015). Further, Article 243(Q) prescribes the formation of urban local self-government institutions and its categorisation as follows:
transitional urban areas, that is, an area transformed into an urban area from a rural area, have nagar panchayats; municipal councils for smaller urban areas; and MCs for larger urban areas.
This study is focused on the larger urban municipalities, that is, MCs. Smaller municipalities, namely municipal councils and nagar panchayats, have limited fiscal autonomy compared with MCs in India. In addition, MCs contribute nearly 80% to total own revenue, and the remaining is generated by municipal councils and nagar panchayats (Ahluwalia et al., 2019). As the third tier of Indian federalism, ULBs have a lower fiscal position than central and state governments. SFCs are institutions that review ULBs’ financial situations and prescribe the devolution of funds, and by law, ULBs cannot have a budget deficit. Mohanty et al. (2007) analysed the revenue and expenditure of 35 major MCs and found that most of them are generating a revenue surplus and that inter-governmental transfers fill the gap in the provision of expenditure. Indian Municipalities are mandated by law to maintain budgetary balance, and any borrowing by these municipalities requires the state government’s approval (Ahluwalia et al., 2019). In the past decade, municipal revenues and expenditure in India have remained stagnant at approximately 1% of GDP. In contrast, Brazil and South Africa allocate 7.4% and 6% of GDP, respectively, to municipal revenues and expenditure (Ahluwalia et al., 2019; Reserve Bank of India, 2022). A recent study of municipal finances by the Reserve Bank of India (2022) provides a comprehensive overview of the fiscal positions of Indian MCs. 7 The primary objective of the present study is to scrutinise how Indian MCs, constrained by limited fiscal autonomy, navigate electoral dynamics and strategically adjust budgetary allocations in their pursuit of re-election.
Elections to municipalities are conducted by the state election commissions, appointed under Article 243(K), and usually take place quinquennially. In 2001, the Comptroller and Auditor General of India (CAG) established a task force to develop budget and accounting forms for ULBs in India, based on the recommendations of the Eleventh Finance Commission and guidelines published by the Ministry of Finance, Government of India. A report on Accounting and Budget Formats for Urban Local Governments was released by the CAG Task Force. In 2004, the Ministry of Urban Development of the Government of India developed the National Municipal Accounts Manual (NMAM) based on this report. The NMAM lays out in detail the accounting rules, procedures and guidelines that are in place to ensure accurate, complete and timely recording of municipal transactions and the production of accurate and relevant financial reports.
Data and Methodology
Data
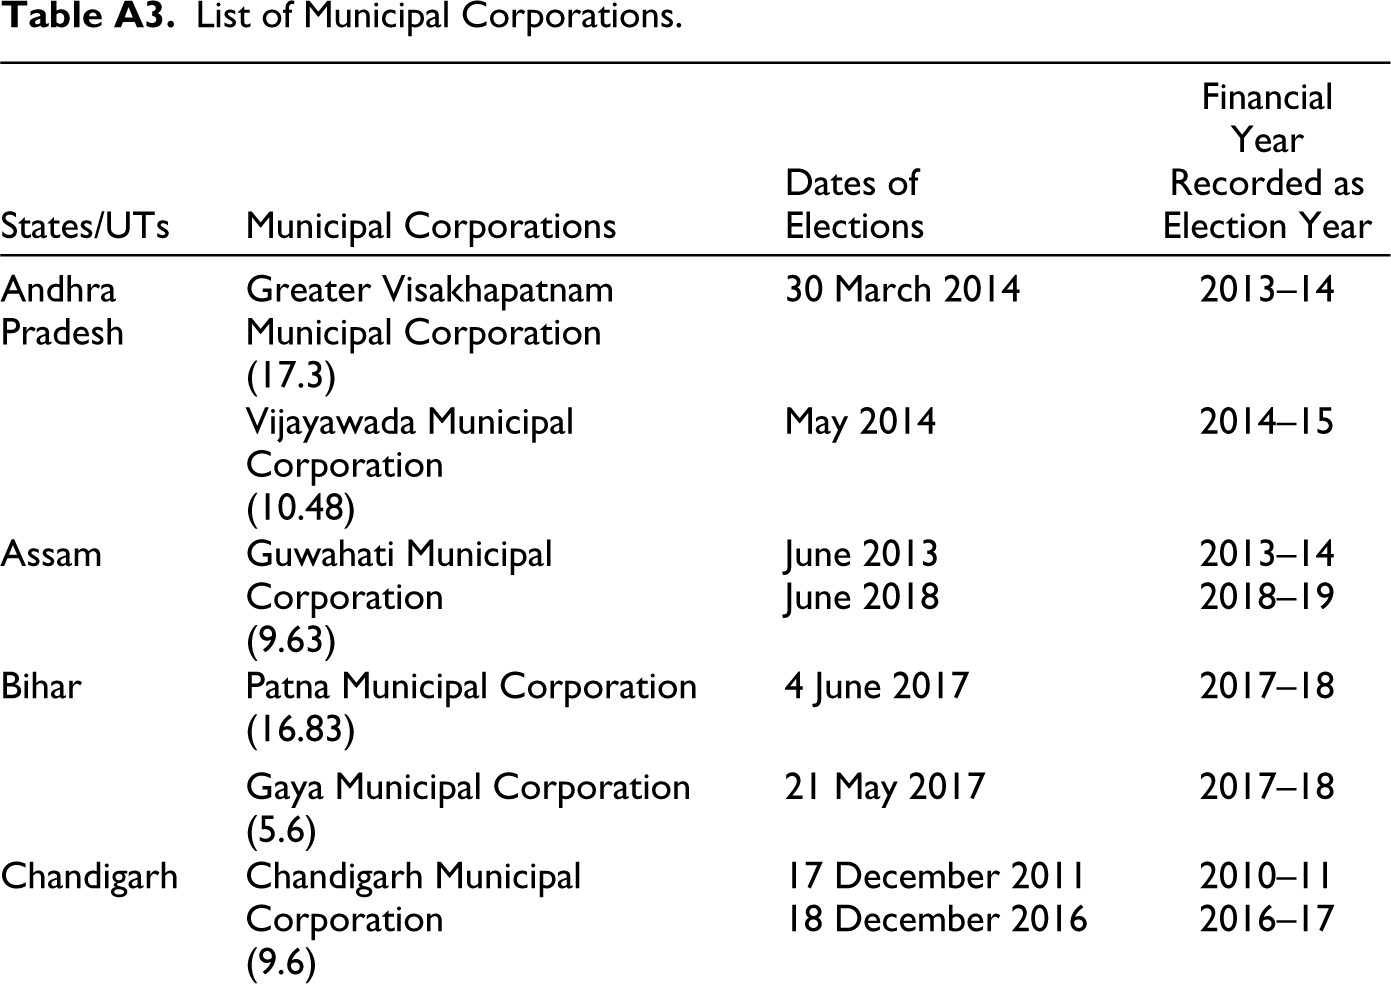
A panel of 34 MCs (see Table A3, Appendix), as per Census 2011, from each state/union territory were selected for the present study. 8 The selection criterion was the most populous MCs from each state or union territory based on the Census of India, 2011, with the aim of encompassing two MCs from each state or union territory. 9 It was an unbalanced panel data from 2005 through 2019. The fiscal variables used in this study were compiled from the budget data provided by the official websites of respective MCs. Data on district-wise population projections were taken from the Population Division, Department of Economic and Social Affairs, United Nations. According to the PBC theory, one should expect an increase in spending or a decrease in revenue or a combination of both, as the election approaches. For analysis, we included budget variables, namely (i) capital expenditure, (ii) revenue expenditure, (iii) capital receipts, (iv) revenue receipts and (v) tax revenue. 10
Capital expenditure refers to money spent on constructing physical assets such as roads, highways and dams and purchasing land, buildings, machinery and equipment, thus indicating public investment.
Revenue expenditure indicates the purchase of goods and services for immediate consumption that can be easily targeted to specific populations, and ruling parties can use revenue expenditure to boost their vote bank. It includes the fund for maintaining public works, administrative expenses, provision of grants and subsidies, and so on. According to the PBC theory, one should anticipate an increase in revenue expenditure as the election approaches and a reduction of the same in post-election years if the incumbent manipulates it for electoral gain.
Capital receipts cover specific grants and contributions from members of the legislative assembly and members of parliament funds, recommended funds from SFCs, and central government share. These transfers are a major resource for MCs in India for their functioning and fulfilment of projects ahead. SFCs that design the devolution formula for local government transfers use different criteria in different states. Support from SFCs on the devolution of shares to MCs is disconcerting and limits their capacity to implement programmes on time (Abiad et al., 2020).
Revenue receipts consist of MCs’ tax revenue sources, grants, loans and other income sources generated regularly. They include property tax, advertisement tax, professional tax, entertainment tax and so on. MCs have greater autonomy in their revenue receipts accounts, and these accounts are susceptible to manipulation for electoral gain.
Unlike central or state budget provisions, which are scrutinised and discussed widely in the media, people are not aware of the local bodies’ budgetary allocations. So instead of taking into account budget allocation, the actual values of each budget instrument are considered in this study.
This study also considers the funds allotted to construct roads and bridges, which are clubbed together as ‘infrastructure funds’, to capture targeted spending. Grants, programme expenses, and welfare schemes are considered as ‘welfare funds’ to capture the visible spending of incumbents to benefit the voters. The welfare account consists of providing funds for various programmes such as the upliftment of the urban poor, women, physically challenged people and transgender and old age schemes and comes as a subhead under the capital expenditure of MCs.
Data on election dates and years were taken from the official websites of the respective state election commissions. It is customary to speak of elections in terms of the calendar year. Policy variables are available for fiscal years, and it is necessary to slot each of the elections considered into the appropriate fiscal year (details in Table A3, Appendix).
Methodology
In this study, a methodological framework was adopted from the study of Brender and Drazen (2005) for the initial analysis of PBCs. Basic models of PBCs were of the following form:

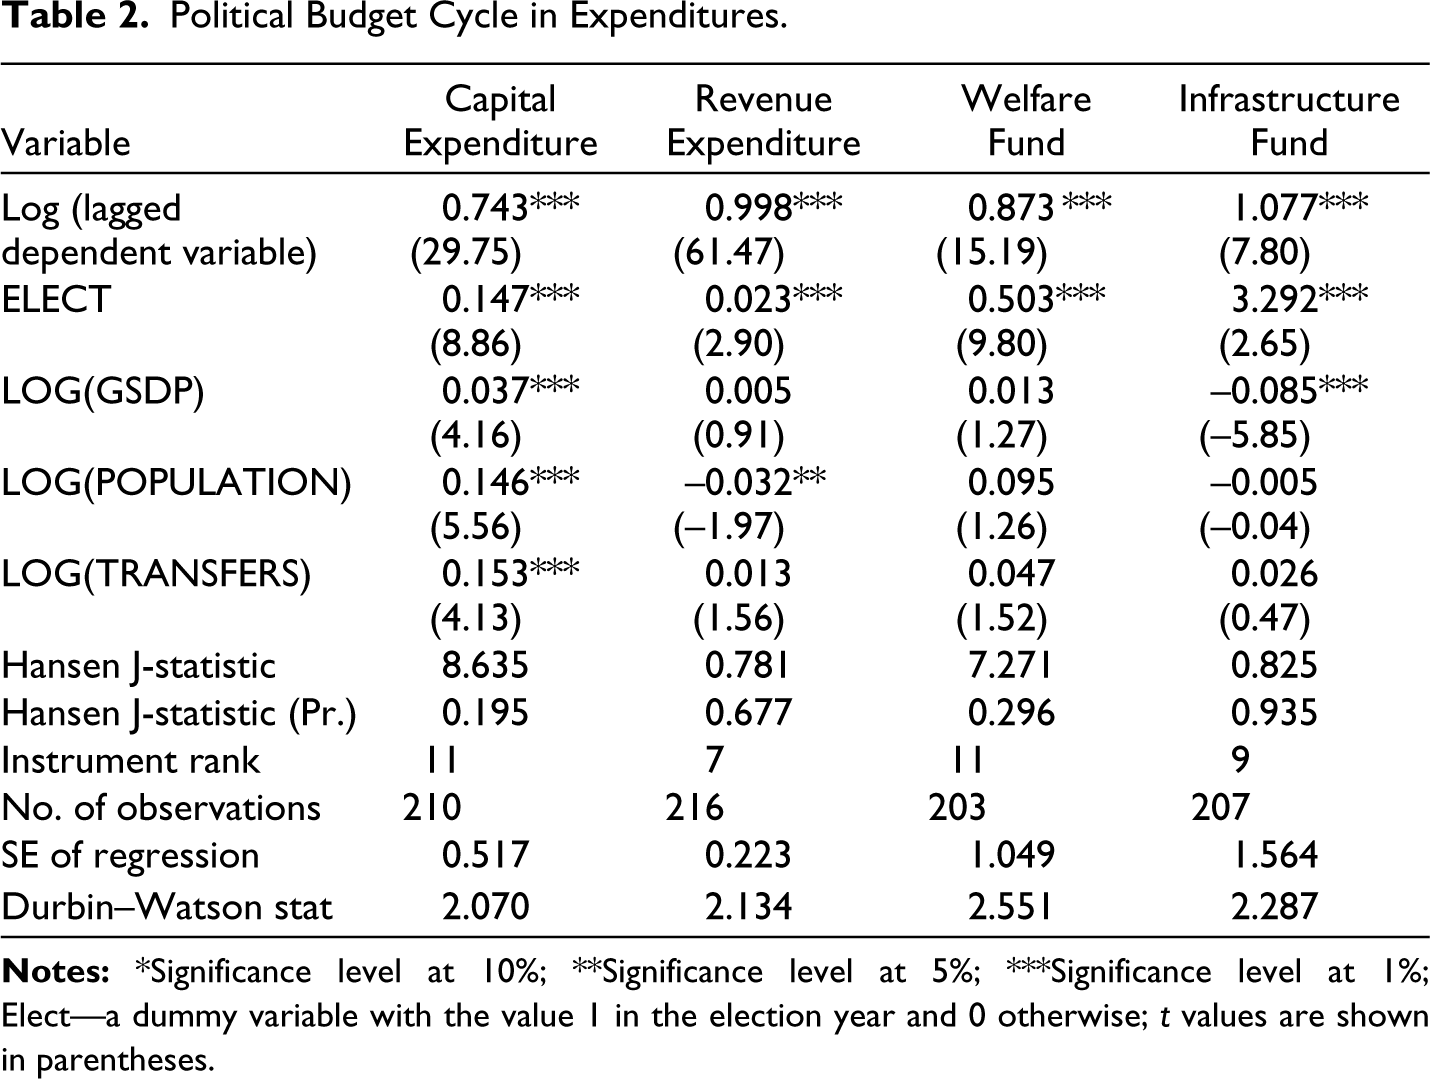
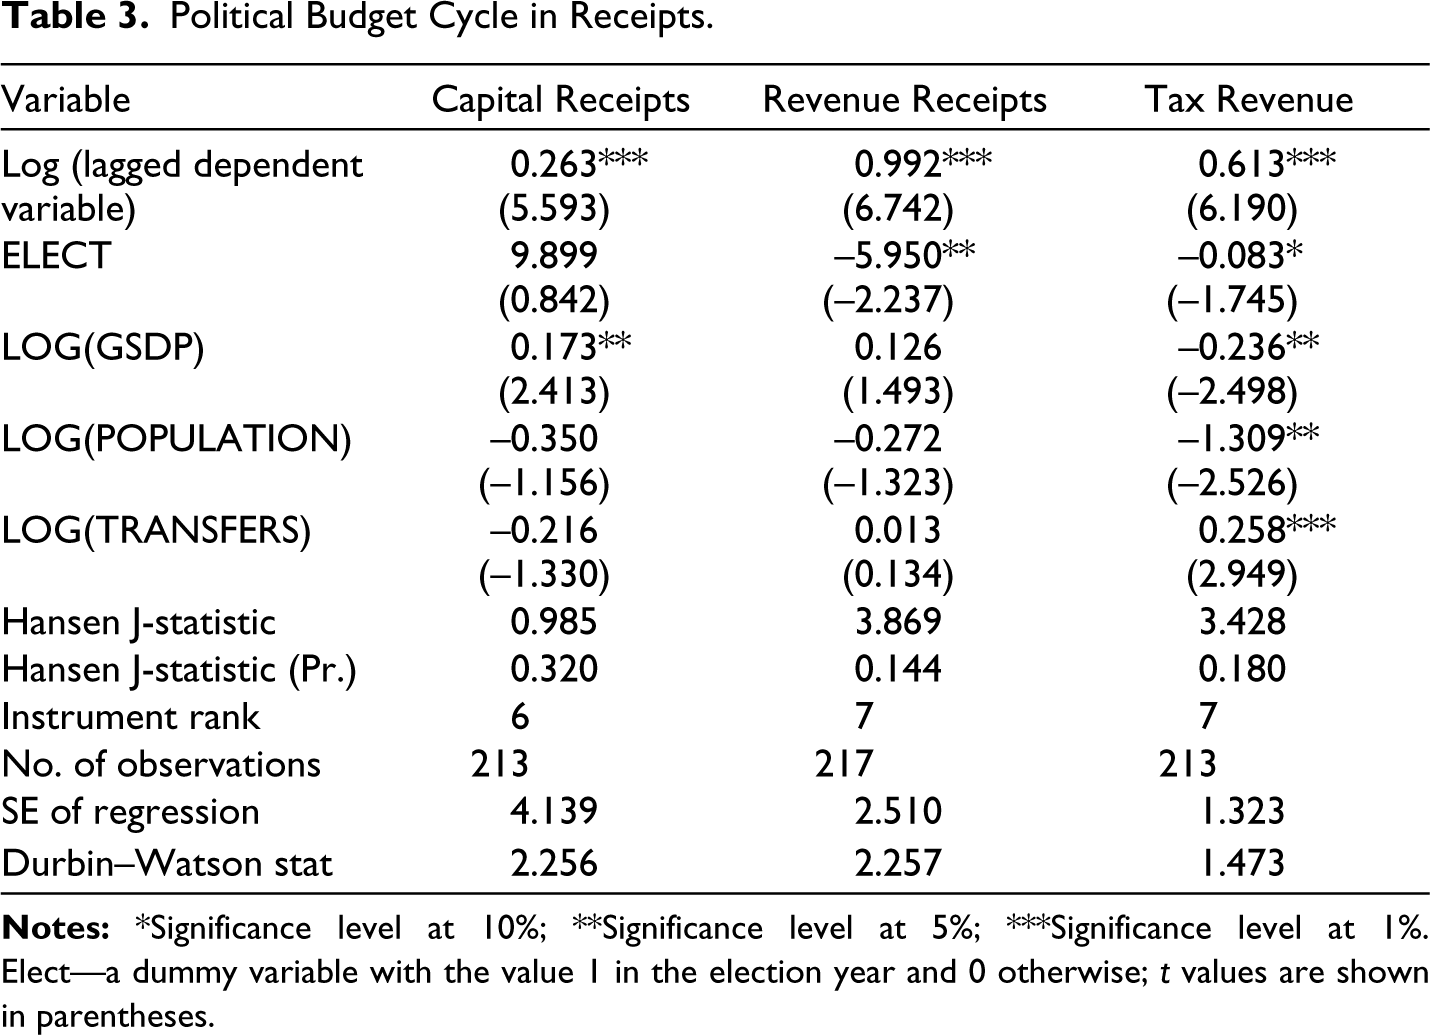
where fi,t is a fiscal indicator in MC i in year t; xi,t is a vector of control variables; ELECT is the dummy variable of interest that captures pre-electoral effects, with a value of 1 in an election year and 0 otherwise; and μi is an MC fixed effect. The results of the coefficient of the electoral variable are presented in Tables 2 and 3 to identify whether or not there is a potential political cycle. The following logarithmic form was considered for estimation.
Political Budget Cycle in Expenditures.
Political Budget Cycle in Receipts.

All variables used, including gross state domestic product, the population in MCs, and transfers as control variables, are in logarithmic form. Transfers are the sum of transfers from both central and state shares. The inclusion of lagged dependent variables and MC-specific effects results in the introduction of bias in the estimation of ordinary least squares. Fixed-effects estimators can eliminate corporation-specific effects. However, the bias caused by the incorporation of lagged dependent variables exists. Hence, in this study, the generalised method of moments (GMM) estimator developed for dynamic panel data by Arellano and Bond (1991) was used to prevent these problems because it controls the unobserved MC-specific effects and the bias caused by lagged dependent variables. In the GMM estimator, the relevance of a model is assessed by the Sargan test of overidentifying restrictions. Where the null hypothesis of the Sargan test is Ho: overidentifying restrictions are valid and the instruments are uncorrelated with residuals if p value is greater than 5% (0.05). This implies, in general, that we accept the Ho, and that all instruments are valid.
The Hansen–Juselius test, when employed within the context of the GMM, serves as a method of evaluating overidentifying restrictions in GMM models. The GMM technique is a versatile method of estimation that can be utilised to analyse a plethora of models, such as those involving dynamic models with lagged endogenous variables and those exhibiting sample selection bias. The null hypothesis of the Hansen–Juselius test asserts that all overidentifying restrictions in a GMM model are fulfilled. In other words, it examines the validity of the specified parameters of the model. The test statistic is derived from the dissimilarity between the GMM estimator and the least squares estimator, and the test asymptotically follows a chi-squared distribution. It is worth mentioning that there are alternative methods for evaluating overidentifying restrictions, such as the Sargan test and the Anderson–Rubin test, and it is essential to choose the appropriate test based on the characteristics of the model and data.
Empirical Results
Each variable of interest was estimated separately, and PBCs in the fiscal outcomes of Indian MCs were shown in baseline results. Tables 2 and 3 present the GMM regression results for each variable under study. A significantly positive effect of elections was observed on capital expenditure, revenue expenditure and expenditure on welfare and infrastructure funds. The GMM model controls for unobserved MC-specific effects and bias caused by the lagged dependent variable. The Hansen J-Test for overidentifying restrictions was presented, in which the null hypothesis is that instruments are jointly uncorrelated with residuals. A robust model like GMM does not take into consideration the R-squared value but should consider the instrument’s validity via the Hansen J-Test.
On average, results showed an increase in capital expenditure, revenue expenditure, welfare fund, and infrastructure fund allocations, which were 0.14, 0.023, 0.50 and 3.29 percentage points in an election year than in non-election years (Table 2). The excessive fund utilisation in welfare schemes on the verge of elections is clear-cut evidence of the incumbent’s visibility approach to earning votes. It is also evident from the results that the incumbent can also divert their funds to some specific pockets as a matter of targetable spending, such as constructing roads and bridges (infrastructure). Overall, the GMM results on expenditure heads prove the presence of politically motivated expenditure in terms of both ‘visibility’ and ‘targetable’ nature. The actual amount spent on the capital and revenue heads reveals PBCs in Indian MC elections. So Indian MCs posit creating welfare and infrastructure cycles for re-election benefits. Despite having limited financial autonomy, MCs exhibit a lower ratio of revenue expenditure to capital expenditure than central and state governments. The increased proportion of capital expenditure in MCs is predominantly due to the allocation of grants from central and state authorities (RBI, 2022).
PBCs can also be analysed through the revenue side with their declining characteristics. Results from the revenue heads of capital receipts, revenue receipts and tax revenue are presented in Table 3. These results show a significant decrease in revenues during elections. This study provides evidence to support a 5.95 and 0.083 percentage points decline in revenue receipts and tax revenue collection of Indian MCs, respectively. These negative coefficients of revenue receipts and tax revenue show the incumbent party’s manipulative action to retain power by reducing it in election years. For capital receipts, a coefficient of 9.89 percentage points was observed, which is not significant as well. Weak inter-governmental disbursement of funds to the local level is a long-debated issue. As explained in the Data and Methodology section, capital receipts of the Indian MCs involve funds from upper layers of the government. The control is not under the purview of MCs, and an increase in the same during elections will resemble the support from the top layers of government during municipal elections.
Conclusion and Policy Implications
In the research of politico-economic models, scholars have long investigated the pre-electoral manipulation of budgets for political profits at national and state levels. The attempts to explore, theoretically or empirically, the political options of local governments subject to PBCs are in their puberty. Using data from Indian MCs, this study contributes to the literature by providing empirical evidence of politically motivated spending by these MCs when they are statutorily not allowed to have deficits in the budget. More specifically, a significant increase in visible and targetable spending has been observed during election years. These results are consistent with the targetability hypothesis (Drazen & Eslava, 2010) and the visibility hypothesis (Rogoff, 1990). Indian MCs create ‘welfare’ and ‘infrastructure’ cycles to gain voters’ attention and manipulate expenditure instruments for electoral gains.
Incumbent’s actions with private motives during elections distort spending, and revenues for electoral purposes are the very essence of the PBC hypothesis. This study has intended to explore the evidence of politically motivated distortions in Indian local government budgets. Strategies followed by incumbents to approach an election cannot be pronounced as guilty of being an opportunist. Instead of looking at the cyclical movement of fiscal deficit on the verge of elections, this study analysed major expenditure and receipts heads to capture the focused and visible compositions of budgets.
This study reveals the manipulative actions of MCs to gain votes for their re-election. These findings imply that strict vigilance over the accounts of local bodies will curtail incumbent’s efforts entitled to political profit. Improper maintenance of accounts makes it difficult to monitor Indian ULBs (Ahluwalia et al., 2019). So, a standardised accounting system that is timely and audited is required. A transparent fiscal autonomy for revenue accumulation and a strict monitoring system over their budget make Indian MCs capable of bringing development strategies in time. The devolution of funds to local governments in the form of grants from upper governments should be transparent and timely for the smooth functioning of local governments.
These findings raise the question of whether political alignment between different layers of government affects the devolution of inter-governmental transfers. Another prospect for research involves quantifying PBCs of different levels of the government when there is a coincidence of elections for all these in the same year.
Footnotes
Declaration of Conflicting Interests
The authors declared no potential conflicts of interest with respect to the research, authorship and/or publication of this article.
Funding
The authors received no financial support for the research, authorship and/or publication of this article.
Appendix
List of Municipal Corporations.
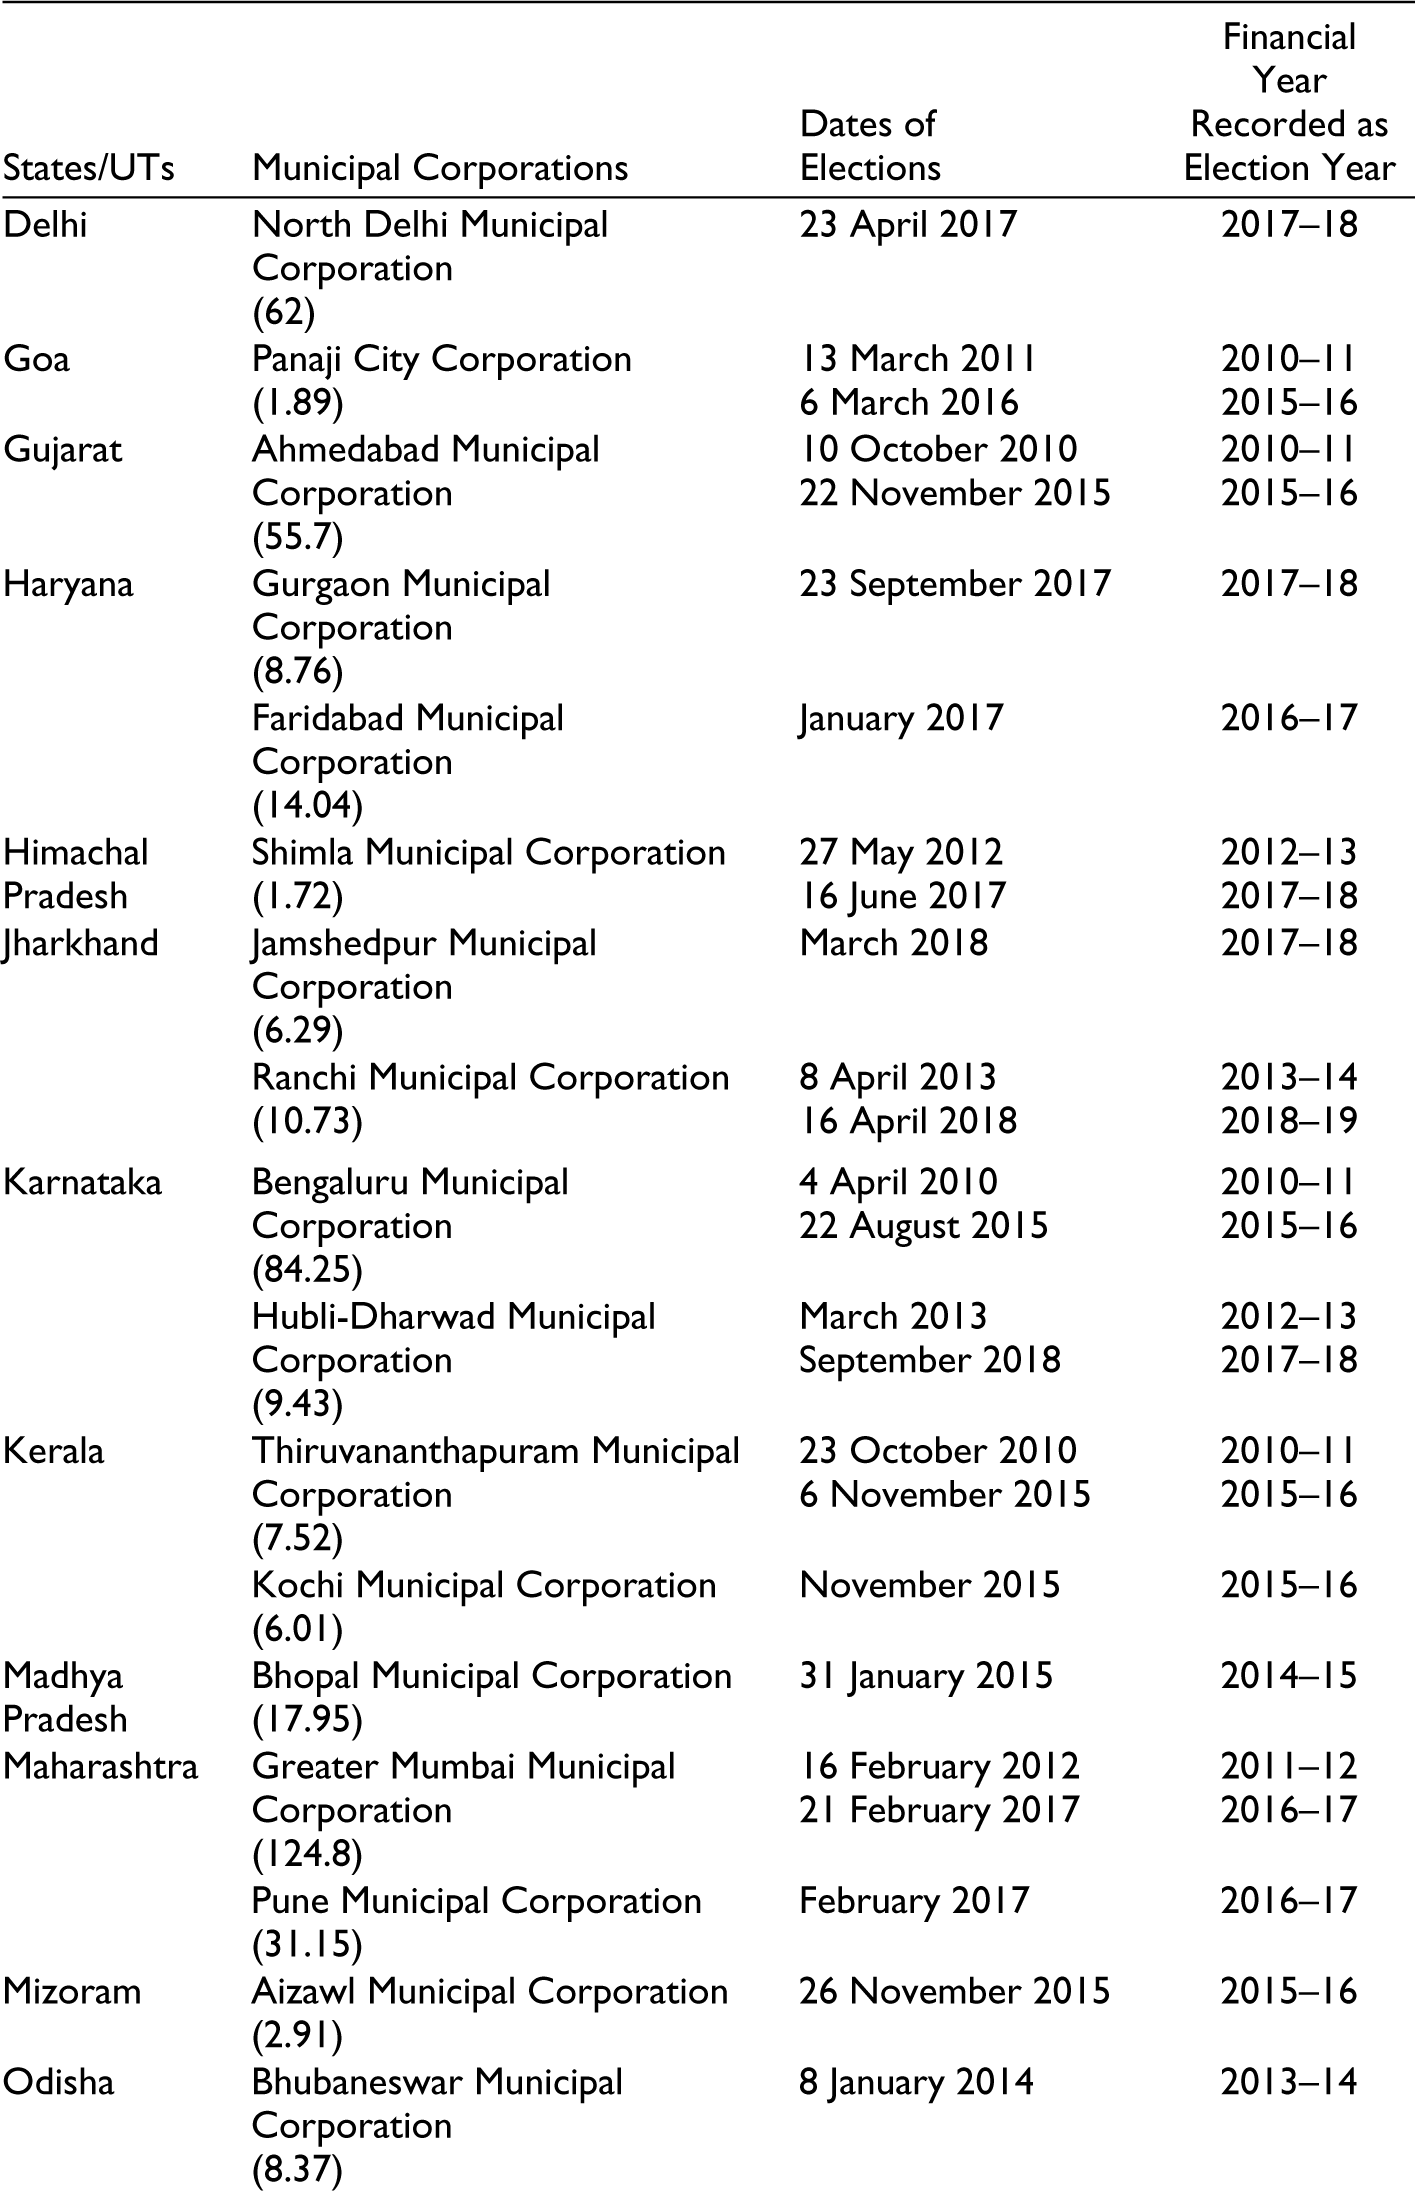
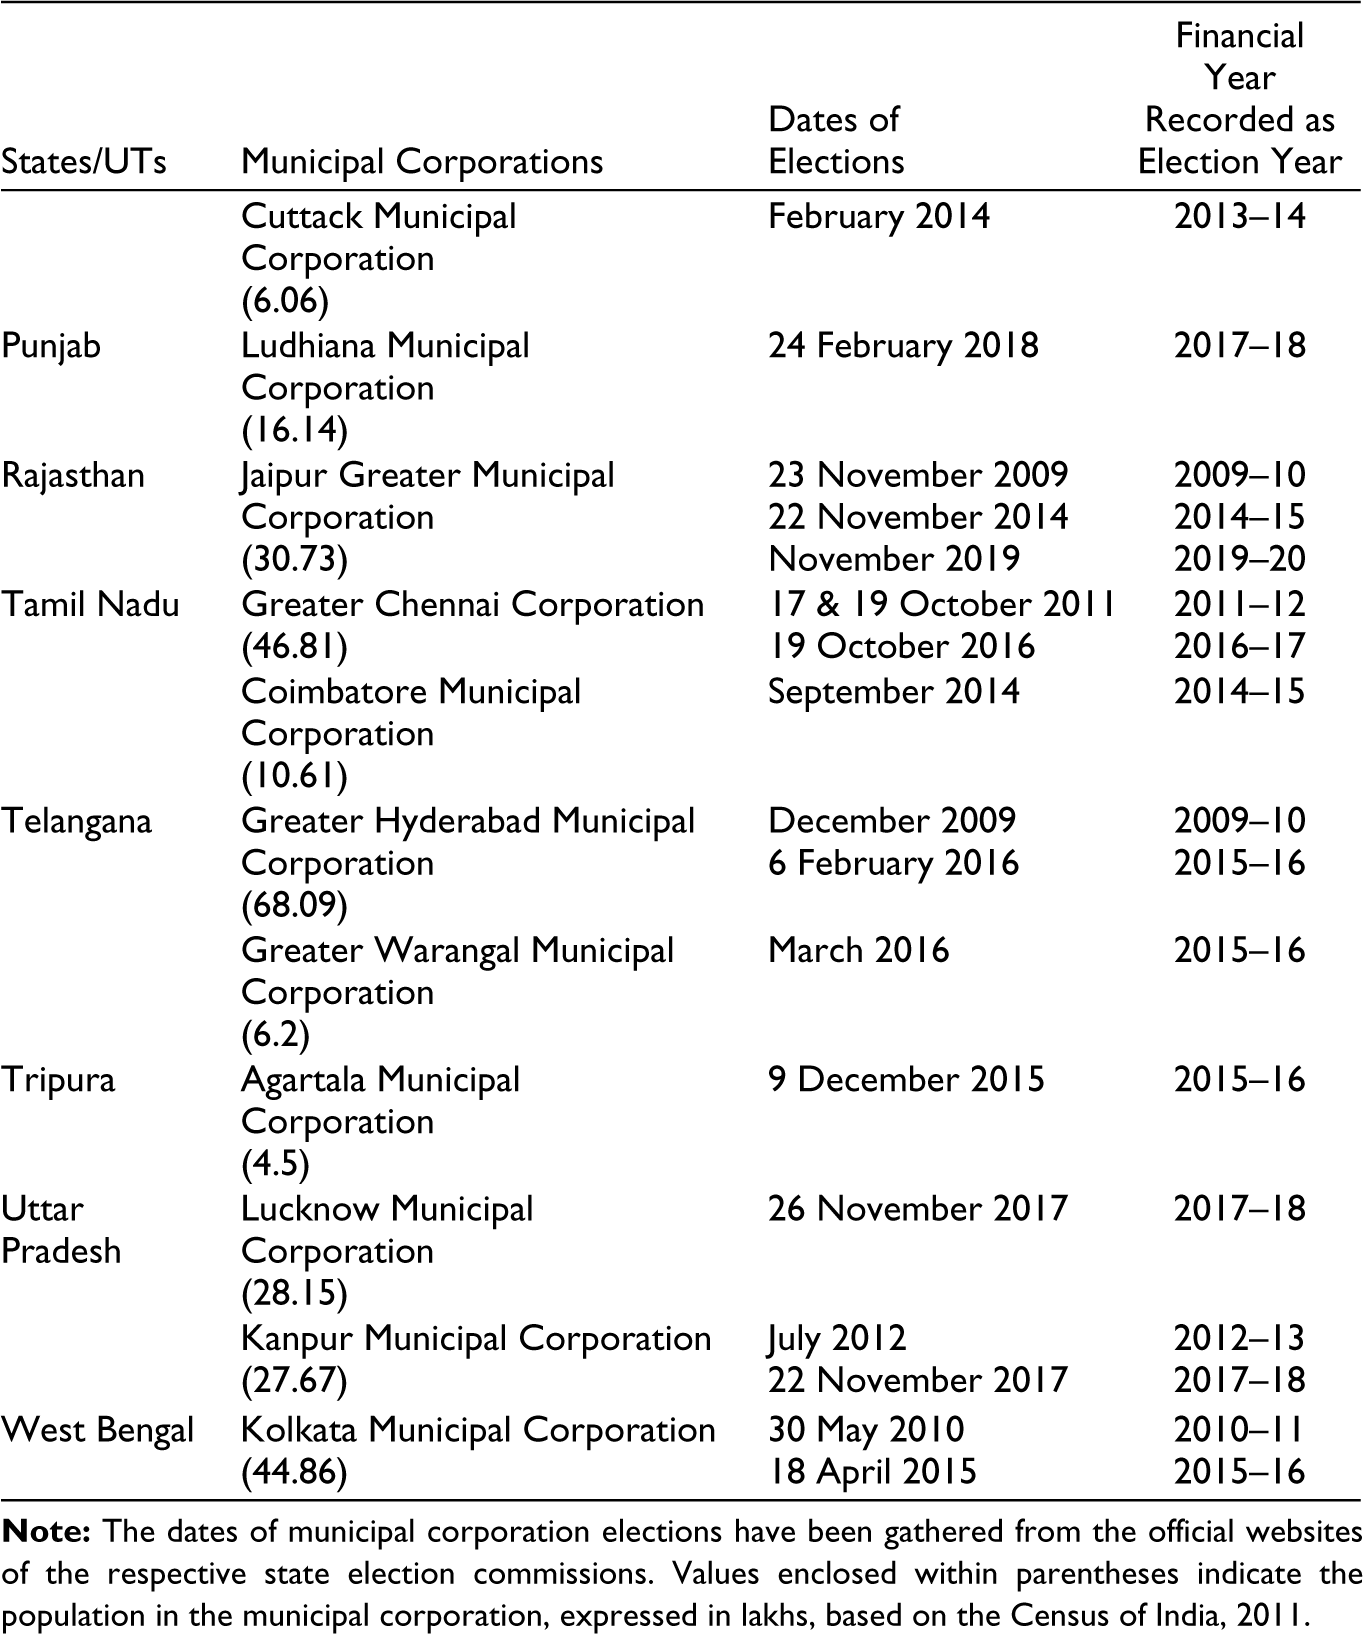
| States/UTs | Municipal Corporations | Dates of Elections | Financial Year Recorded as Election Year |
| Andhra Pradesh | Greater Visakhapatnam Municipal Corporation (17.3) |
30 March 2014 | 2013–14 |
| Vijayawada Municipal Corporation (10.48) |
May 2014 | 2014–15 | |
| Assam | Guwahati Municipal Corporation (9.63) |
June 2013 June 2018 |
2013–14 2018–19 |
| Bihar | Patna Municipal Corporation (16.83) |
4 June 2017 | 2017–18 |
| Gaya Municipal Corporation (5.6) |
21 May 2017 | 2017–18 | |
| Chandigarh | Chandigarh Municipal Corporation (9.6) |
17 December 2011 18 December 2016 |
2010–11 2016–17 |
| Delhi | North Delhi Municipal Corporation (62) |
23 April 2017 | 2017–18 |
| Goa | Panaji City Corporation (1.89) |
13 March 2011 6 March 2016 |
2010–11 2015–16 |
| Gujarat | Ahmedabad Municipal Corporation (55.7) |
10 October 2010 22 November 2015 |
2010–11 2015–16 |
| Haryana | Gurgaon Municipal Corporation (8.76) |
23 September 2017 | 2017–18 |
| Faridabad Municipal Corporation (14.04) |
January 2017 | 2016–17 | |
| Himachal Pradesh | Shimla Municipal Corporation (1.72) |
27 May 2012 16 June 2017 |
2012–13 2017–18 |
| Jharkhand | Jamshedpur Municipal Corporation (6.29) |
March 2018 | 2017–18 |
| Ranchi Municipal Corporation (10.73) |
8 April 2013 16 April 2018 |
2013–14 2018–19 |
|
| Karnataka | Bengaluru Municipal Corporation (84.25) |
4 April 2010 22 August 2015 |
2010–11 2015–16 |
| Hubli-Dharwad Municipal Corporation (9.43) |
March 2013 September 2018 |
2012–13 2017–18 |
|
| Kerala | Thiruvananthapuram Municipal Corporation (7.52) |
23 October 2010 6 November 2015 |
2010–11 2015–16 |
| Kochi Municipal Corporation (6.01) |
November 2015 | 2015–16 | |
| Madhya Pradesh | Bhopal Municipal Corporation (17.95) |
31 January 2015 | 2014–15 |
| Maharashtra | Greater Mumbai Municipal Corporation (124.8) |
16 February 2012 21 February 2017 |
2011–12 2016–17 |
| Pune Municipal Corporation (31.15) |
February 2017 | 2016–17 | |
| Mizoram | Aizawl Municipal Corporation (2.91) |
26 November 2015 | 2015–16 |
| Odisha | Bhubaneswar Municipal Corporation (8.37) |
8 January 2014 | 2013–14 |
| Cuttack Municipal Corporation (6.06) |
February 2014 | 2013–14 | |
| Punjab | Ludhiana Municipal Corporation (16.14) |
24 February 2018 | 2017–18 |
| Rajasthan | Jaipur Greater Municipal Corporation (30.73) |
23 November 2009 22 November 2014 November 2019 |
2009–10 2014–15 2019–20 |
| Tamil Nadu | Greater Chennai Corporation (46.81) |
17 & 19 October 2011 19 October 2016 |
2011–12 2016–17 |
| Coimbatore Municipal Corporation (10.61) |
September 2014 | 2014–15 | |
| Telangana | Greater Hyderabad Municipal Corporation (68.09) |
December 2009 6 February 2016 |
2009–10 2015–16 |
| Greater Warangal Municipal Corporation (6.2) |
March 2016 | 2015–16 | |
| Tripura | Agartala Municipal Corporation (4.5) |
9 December 2015 | 2015–16 |
| Uttar Pradesh | Lucknow Municipal Corporation (28.15) |
26 November 2017 | 2017–18 |
| Kanpur Municipal Corporation (27.67) |
July 2012 22 November 2017 |
2012–13 2017–18 |
|
| West Bengal | Kolkata Municipal Corporation (44.86) |
30 May 2010 18 April 2015 |
2010–11 2015–16 |