
Abstract
Globally, technology firms are characterized by high level of innovation, rapid obsolescence of technologies, high investment risk and unpredictability of future cash flows. All these make conventional discounted cash flow valuation methods inadequate for valuation of technology firms. This study aims to develop sector regression models for relative valuation of technology firms by evaluating firm-level determinants of price multiples. Results suggest that price to book is the most appropriate multiple for valuing developed market technological firms, whereas price to sales is the most apt multiple for emerging market firms. Variable selection by least absolute shrinkage and selection operator (lasso) validates that growth rate, research intensity and cash holding influence value of price multiples for both developed market and emerging market firms. Similarly, smaller firms tend to generate higher value of the multiples under both categories. Firms’ ESG practices is an important determinant of price multiples for developed market firms, however, it does not influence the multiples’ value for emerging market firms.
Keywords
Executive Summary
Globally technology firms are characterized by high level of innovation, rapid obsolescence of technologies, high investment risk and unpredictable cash flows. Additionally, accounting standards globally allow R&D expenses to be capitalized only in the development phase; therefore, lot of ambiguity is attached to the realization of these expenses. Revenue generation by intangible assets is contingent to the realization of R&D expenses. Since projection of cash flows is an uphill task in case of technology firms, use of discounted cash flow (DCF) method does not appear to be appropriate for their valuation. Technology firms generally enjoy better market value of equity relative to their counterparts in other industries. Higher market value of equity and associated intangible assets base get reflected in their balance sheets in the form of abnormally high cash holdings. Consequently, relative valuation based on price and enterprise value multiples has been frequently used for valuation of technology firms.
This study develops sector regression models for relative valuation of technology firms by evaluating firm-level determinants of price multiples. Since technology firms differ in terms of various firm-level characteristics such as firm size, cash holding and ESG practices, we have considered various firm-level control variables in the sector regression. In addition to the ordinary least squares (OLS) method, we have used a machine learning-based shrinkage algorithm, namely least absolute shrinkage and selection operator (lasso). Addition of every new determinant to the regression model makes the interpretation of the model increasingly complex. Shrinkage algorithm lasso helps in variable selection by eliminating less relevant determinants. Therefore, lasso does not just make the regression model easy to interpret, but it also corrects the problem of multicollinearity. Moreover, the resampling method of cross-validation, used to estimate the test error associated with the lasso, reduces the chances of model overfitting.
Results of OLS regression show that price-to-book multiple is the most appropriate multiple for valuing developed market technological firms, whereas price to sales is best suited for emerging market firms. Alternatively, lasso selects price-to-sales multiple as the most appropriate valuation multiple for both categories of firms, that is, developed market firms and emerging market firms. Variable selection by lasso validates that growth rate, research and development expenses and cash holding influence value of price multiples for both developed market and emerging market firms. Also, smaller firms tend to generate higher value of the multiples under both categories. Overall, results confirm that cash holding is one of the most important determinants of price multiples in both the markets which influence their value positively, and stocks offering higher dividend yield are considered as surrogate to the bond market instruments and, thus, attract lower valuation. Firms’ Environment, Social and Governance (ESG) practices is an important determinant of price multiples for developed market firms, however, it does not influence the multiples’ value for emerging market firms.
Introduction
Globally, technology firms are characterized by high level of innovativeness, enhanced international competition, rapid dissemination of technological innovations, premature obsolescence of technologies, higher investment risk and rapid asset devaluation. All these require greater capital expenditures and larger provisioning for research and development activities. Higher allocation of funds to research and development activities generates a vast intangible asset base for these firms, which they prefer to finance usually with equity funds. Networks that some of the technology companies establish increase disproportionately because of direct network effects. In many cases, even indirect network effects have a critical role in increasing the value of network. Predicting the future trends in technologies is extremely difficult; technological cycles are shortening; and obsolescence of technologies is a continuous, rapid and unpredictable process. All these differences and uncertainties make business cycles unpredictable and valuation of technological companies extremely complex. Valuation of technology companies is a challenge, given the uncertainty about the future (Festel et al., 2013). Since business cycle conditions impact the future profitability of firms, expectations about the business cycle will affect the firms’ present valuation (Sadorsky, 2003). For valuation of companies where stable business cycles are there, traditional methods of valuation like discounted cash flow (DCF) have been used, but in traditional DCF method, assumptions about the future uncertainty are ignored (Ashford, et al., 1988). Additionally, accounting standards globally allow R&D expenses to be capitalized only on the development phase; therefore, lot of ambiguity is attached to the realization of these expenses. Revenue generation by intangible assets is contingent to the realization of R&D expenses. DCF methods are applied for valuing technology firms in their early stages of life cycle, since idiosyncrasies related to their business models are high and no or few comparable firms are available to perform the relative valuation. In the later stages of their life cycle, technology firms generally enjoy better market value relative to their counterparts in other industries. Higher market value of equity and associated intangible assets base get reflected in their balance sheets in the form of abnormally high cash holdings.
For mature technologies firms listed on the global stock exchanges, relative valuation using multiples seems appropriate, primarily due to three main reasons. First of all, adequate information is available to support this methodology, as a multitude of analysts follow minutest details of these firms. Secondly, multiples are based on market prices and, thus, subscribe to the idea of fair value approach. Third, unlike DCF, while using relative valuation, estimation of future earnings, cash flows, growth rate or cost of capital is not required; therefore, less subjectivity is involved in this approach. Multiples-based valuation methods are more frequently used by practitioners such as equity analysts and investment bankers; however, this does not find sufficient coverage in academic literature. Several survey-based studies have suggested that analysts often use unsophisticated multiples-based valuation methods such as price to earnings (PE), dividend yield (DY) and price earnings to growth (PEG) in preference to the more elaborate and flexible DCF methods (Arnold & Moizer, 1984; Barker, 1999; Block, 1999; Pike et al., 1993).
Relative valuation is based on the tenets of arbitrage pricing theory, which states that similar assets shall be priced equally by the market; otherwise, a pure and riskless arbitrage profit is possible. Relative valuation method includes three steps—identification and selection of comparable assets, scaling the asset prices using common variables such as earnings or book value to produce analogous multiples and, finally, adjustments for differences in firm characteristics like size or growth opportunities while comparing their analogous multiples. Irrespective of how diligently comparable firms are selected, there always remains some scope of variation in their characteristics. Certain subjective adjustments such as dividing the value of a price multiple by firm-specific growth rate can be made to control the variations. However, these modest corrections do not serve their purpose when the relationship between multiples and their determinants is complex. To overcome these limitations, sector-specific regression analyses have commonly been used in practice. In sectoral regression analysis, values of price multiples of firms belonging to a particular sector are regressed on their key determinants to elucidate such variations. If these sectoral firms differ substantially in their financial and other characteristics like firm size or dividend yield, we can control for these characteristics by introducing them as control variables. The regression helps because when we are interpreting the relationship between price or value multiples and their respective determinants, we fix the value for control variables like firm size. The results of the sector regression provide a measure of relationship between the multiple and the explanatory variables being used.
Technology firms in developed countries differ substantially from their counterparts in emerging markets in terms of their product offerings. While innovation and product development are the forte of technology firms in developed markets, emerging market technology firms primarily deal in services and outsourcing processes. They also differ in terms of firm size, R&D intensity, ownership control, and environmental, social and governance practices.
In this study, we attempt to examine the key determinants of price multiples for global technology firms. Given the heightened complexity in the market, technology firms’ business models as well as the ecosystem in which they operate, several firm-level determinants such as size, ownership pattern, ESG practices and cash holding have attained descriptive power to explain the value of observed multiples. Therefore, beside the key determinants, we have applied several control variables in sectoral regression analysis. Then, we compare and contrast the results for technology firms from emerging markets with developed markets. To improve the interpretability of multiple regression models, we have used a shrinkage method-based algorithm called least absolute shrinkage and selection operator (lasso), which runs the regression using cross-validation method and performs the task of variable selection by shrinking the coefficients of the determinants to zero (James et al., 2013). Those determinants that have zero coefficients are, thus, eliminated from the model, which makes the interpretation of model relatively better.
Therefore, this article, focusing on the globally listed technology firms, investigates how price multiples can be effectively used in valuation of technology firms and contrasts the determinants of these multiples in developed and emerging markets.
Literature Review
Comparison of the relative practicality of ‘multiples based relative valuation methods’ and more sophisticated ‘DCF’ methods to analysts and investors has been the subject of significant empirical research. While financial theory emphasizes DCF as the basis for valuation, practitioners such as equity analysts, investment bankers and fund managers widely use market multiples to value companies (Arnold & Moizer, 1984; Barker, 1999; Block, 1999; Feltham & Ohlson, 1995; Penman, 1997, 2001; Pike et al., 1993). To explain why analysts prefer unsophisticated multiples-based valuation method, Barker (1999) focuses on the inherent uncertainty of forecasted data, whereby DCF methods are of limited practical use if analysts can generate reliable forecasts over a short horizon. This result finds support from the content analysis-based studies of Demirakos et al. (2004) and Bradshaw (2002) where they showed that analysts use simple valuation methods based on price-to-earnings and price/earnings-to-growth ratios. Theoretical insights of Miller and Modigliani (1961), Ohlson (1995), Penman (1997) and Ohlson and Juetter-Nauroth (2005) offer justification for practicality of price-based multiples such as price to earnings, price/earnings to growth and price to book. Lately, Imam et al. (2008) examined the use of valuation models by conducting semi-structured interviews with analysts from leading investment banks and asset management firms. They reported perceived limitations in the technical applicability of DCF, which cause analysts to rely, in practice, on valuation multiples and subjective judgement of whether the market price is justified.
Examining several firms belonging to the same industry, Boatsman and Baskin (1981) reported that valuation errors can be minimized by selecting comparable firms on the basis of their analogous historical earnings growth rates. Using three measures of earnings such as current earnings, last years’ average earnings and earnings on tangible and intangible assets, LeClair (1990) reported that average earnings act as the best predictor for the valuation model.
Alford (1992) studied the accuracy of price-to-earnings valuation method by selecting comparable firms based on three criteria, namely industry classification, risk and earnings growth rate. The accuracy of the price-to-earnings valuation method for each method of selected comparable firms was estimated by comparing each firm’s predicted stock price with its observed price. He found that besides industry classification, a variation in risk and earnings growth rate is effective in selection of comparable firms. He also suggested that adjusting value of PE multiple for variation in leverage results in reduced accuracy of prediction. Penman (1997) examined the combination of price-to-earnings and price-to-book multiples to use the information provided by both the multiples in stock price prediction. He conducted trials by allotting different weights to these multiples. He found the weights to be distributed nonlinearly over the amount of earnings and systematically over the time. Estimated weights were also suitable for out-of-sample forecasting. Tasker (1998) experimented with various industry-specific multiples and suggested suitability of diverse multiples for different industries. Baker and Ruback (1999) studied prediction accuracy of industry multiples using earnings before interest taxes epreciation and ammortization, earnings before interest and taxes and sales as denominators of the multiples. They found absolute valuation errors to be proportionate to the value of respective multiples.
Liu et al. (2002a) studied the efficacy of an extensive list of determinants to assess their suitability for stock price prediction. They also examined industrywise and time varying discrepancies in performance of multiples by using their alternative definitions-based historical, forward and current earnings. Authors found multiples based on forward earnings to be the best performers in terms of prediction accuracy. Moreover, prediction accuracy of multiples created on forward earnings enhances with the length of forecast period. They also described that while using historical earnings to define the multiples, value drivers of earnings perform the best, followed by book value and cash flows. The worst performance was recorded for sales-based multiples. Liu et al. (2002b) extended their study to examine the prediction accuracy of industry multiples using cross-countries data. Authors validated earlier findings for multi-country data as well. Theoretically, operating cash flows-based multiples shall provide a better summary measures of value in comparison to the multiples based on reported earnings. Liu et al. (2007) examined this proposition by comparing prediction accuracy of these two sets of multiples and found that reported earnings predict stock price better than estimated cash flows.
Huang et al. (2007) examined the price-to-earnings multiple by differentiating it into fundamental and residual components. They found that firm-specific as well as macroeconomic factors explain the value of the multiple. Expected growth rate, payout ratio and firm size impact the value of the multiple positively, whereas stock beta (β) and prevailing yields on risk-free securities impact its value negatively.
Sehgal and Pandey (2010) examined the prediction accuracy of alternative price multiples by generating price forecasts of various value drivers using OLS regression for stock prices for firms trading in Indian market. They reported that price-to-earnings multiple provides the best price forecast compared to the other multiples based on book value, cash flows and sales. Additionally, they found the value driver combination of book value and sales to be the most efficient in terms of minimized root mean square error. Nonetheless, price-to-earnings multiple performed better in price forecast in comparison to all other standalone multiples as well as various combinations of value drivers. Bagna and Ramusino (2017) investigated how multiples can be used in the valuation of cyclical companies, and they evaluated the accuracy of multiples in terms of their performance to value cyclical companies. Tremolizzo (2009) investigated the use of multiples for valuing cyclical firms and reported that applying multiples leads to greater valuation error in comparison to non-cyclical firms. Technology firms are fairly similar to cyclical firms in terms of their cash flow uncertainty and volatility of shares prices, which makes the use of DCF method for their valuation even more difficult. The primary issue with using multiples for valuing cyclical and technology firms is that their earnings and cash flows at a given point in time do not represent the average condition of the firm. Joshi and Chauhan (2020) investigated determinants of price multiples and their prediction accuracy for non-finance and non-banking firms from South East Asian markets. Firm size, cash holding, strategic holding and firms’ engagement in ESG activities are found to be the key determinants of price multiples, besides growth rate and payout.
The valuation of technology firms is an even less investigated research topic, despite their significant contribution to the economic growth and global market capitalization. The present study examines the determinants of global technology firms’ valuation using three price multiples, namely price to earnings, price to book and price to sales. Determinants are categorized into two groups: fundamental value determinants and firm-level control variables. Fundamental value determinants for price-to-earnings multiple are expected growth rate, payout and risk. For price to book and price to sales, one additional determinant each has been added, namely return on equity and net profit margin, respectively. Therefore, this study investigates how price multiples can be effectively used in valuation of technology firms and contrasts the determinants of these multiples in developed and emerging markets using shrinkage algorithm to eliminate the irrelevant determinants.
Theoretical Framework and Hypotheses Development
Theoretically, value of price-to-earnings multiple depends upon the firm’s dividend policy, expected growth in earnings and cost of equity capital. Firm’s cost of equity capital is measured using capital asset pricing model; therefore, firm’s stock β represents the measure of systematic risk. In addition to the above fundamental determinants, value of price-to-book multiple depends on one additional determinant, namely return on equity. Similarly, beside three fundamental determinants, that is, payout, growth rate and risk, the value of price-to-sales multiple depends on an additional determinant, namely net profit margin.
Firm-level control variables used in this study are either identified from literature or hypothesized by the authors. It is well documented in the literature that smaller firms outperform markets in terms of generation of returns (Fama & French, 1992). Therefore, the present study includes firm size as an additional control variable capable of explaining all the three price multiples. We hypothesize that firm size shall have positive coefficients for all the three multiples. Since technology firms allocate substantially higher amount of funds for the research and development activities, a control variable, namely R&D intensity (research and development expense to total asset ratio), has been added in the list of control variables. We anticipate that firms with higher provisioning of funds for R&D activities are likely to attract better valuation in terms of higher price multiples. Certain stocks that pay regular high dividends and substantial part of their expected returns comes from dividend yields are considered as substitute to the bond market investments. Typically, these stocks belong to mature industries like utilities or telecommunication. However, some well-established technology stocks also have quite significant dividend yield. On one hand, higher dividend yield depicts comfortable cash flow position of the firms, while it shows a lack of positive net present value projects on the other. Going by the rationale of surrogacy of high dividend stocks for bond market, in a way, dividend yield may also serve as a proxy for risk-free rate in the cross-section data. Leverage has regularly been used as a control variable in extant finance literature. However, in our sample of technology firms, most of the firms are zero debt firms. Moreover, one of the fundamental determinants, that is, risk (regression β), which is computed as slope of regression coefficient for firm’s stock return on market return reflects the level of firm leverage. Firm’s regression β can be expressed as follows: βL = βu × (1 + (1 – T) D/E) where βL denotes the levered β used in our study as the fundamental determinant, which depends on asset β of the βu, corporate tax rate T providing tax shield, and D/E, the firm’s leverage. While β of the stock denotes its systematic risk, stock price volatility measures its unsystematic risk. It is expected that technology stocks with high stock price volatility will have lower values of multiples.
With higher proportion of intangible assets along with higher market value of their equity, technology firms tend to hold larger amounts of cash in their balance sheet. Higher cash holdings guard technology firms against uncertain cash flows scenarios arising from rapid obsolescence of their product and services. Using a sample of large Indonesian firms, Joshi (2019) found that firms that have greater noncash liquid assets maintain moderate cash holdings; on the contrary, cash holding is the most relevant factor for high growth technology firms. Robust cash holdings also provide competitive edge to these firms. For the largest 500 firms listed on National Stock Exchange of India (NSE), Joshi (2021) reported that high growth firms placed relatively more emphasis on net debt. Net debt is calculated by subtracting firm’s cash holdings from its total debt outstanding. Since most of the sample firms listed in the present study have zero debt, cash holding has been considered in control variables. It has been hypothesized that stronger cash holdings may yield higher values of multiples. Ownership structure of technology firms varies substantially from developed markets to emerging markets. Generally, in developed markets, technology firms are owned by a large number of institutional investors and have relatively small promoters’ holdings. On the contrary, in emerging markets, technology firms are a part of large family-owned conglomerate structures. Therefore, strategic ownership is expected to be high in emerging markets than in the developed markets. It will be interesting to see how strategic holding would impact firms’ valuation in terms of price multiples.
Return on capital employed is the measure of firm’s profitability in terms of profit earned by the firm using long-term capital. More profitable firms are likely to generate higher valuation multiples. Technology firms generally have better records on the environmental front; however, their governance and social practices differ considerably across the firms. Firms in developed markets stick to prudent governance and social practices partly on account of stringent compliance requirements by the regulators and partly because of the close monitoring by the institutional investors. On the other hand, in emerging markets, technology firms embrace good governance and social practices as a matter of self-discipline. Since we are using a relatively large data set for the study, a large number of firms in our sample do not have ESG score. Therefore, to capture the impact of ESG practices on firm valuation, a dummy variable for ESG has been added in the control variables. It is expected that firms engaged in ESG practices should command higher value of price multiples. Also, coefficient of ESG dummy variable in the regression analysis is likely to vary between developed and emerging markets.
Data and Methodology
Sample
The basis for sample selection was the universal data set for global technological firms available on Thomson Reuters’ Eikon database. The initial data selection started with three dependent variables, namely price-to-earnings, price-to-book and price-to-sales multiples and their fundamental determinants. We considered a large number of control variables identified from the extant literature in finance. Thereof, the sample was restricted to those firms for which the complete data relating to all the three dependent variables, determinants and the control variables were available.
Transformation of these data was carried out by limiting extreme values in the data to reduce the effect of spurious outliers. Hence, as a part of data preparation, to reduce the influence of outliers, winsorization was conducted. A 90% winsorization was used whereby all data below the 5th percentile were set to 5th percentile and all data above the 95th percentile were set to 95th percentile.
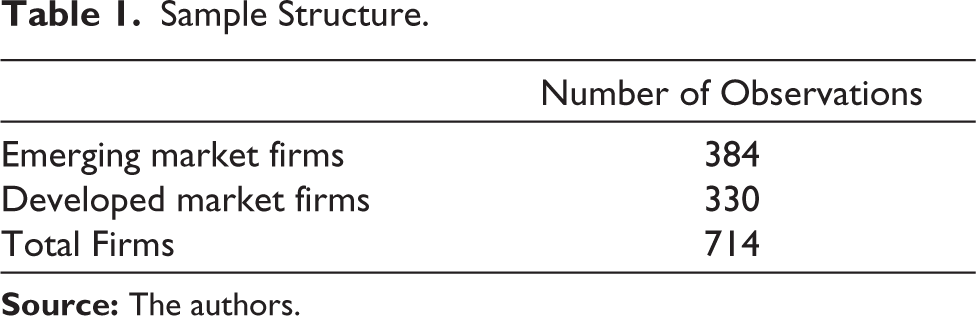
After winsorization, the data set was reduced to 714 technology sector firms, out of which 384 firms represented the sample for developed market and 330 firms represented the sample for emerging market. Moreover, winsorization moderates the skewness of the data set. The technology sector includes firms from the following industries: communication and networking, computer hardware, electronics equipment and parts, household electronics, information technology services and consulting, office equipment, online services, phones and handhold devices, semiconductor equipment and testing, semiconductor and software. The sample structure is presented in Table 1.
Sample Structure
Model Specification
Multiple regression analyses have been conducted for price multiples and their respective fundamental determinants using OLS method. A number of variables defining firms’ characteristics have been used as control variables. A dummy variable has been used to examine whether the firm is involved in environmental, social and governance practices or not. This dummy variable assumes value of 1 if the ESG score for a concerned firm is reported in the Thomson Reuters’ Eikon Database; otherwise, it takes value of 0.

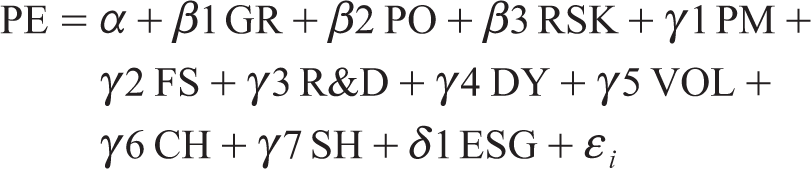
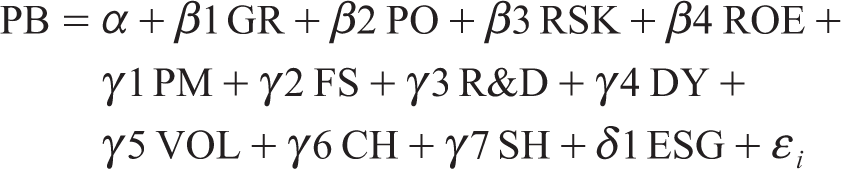
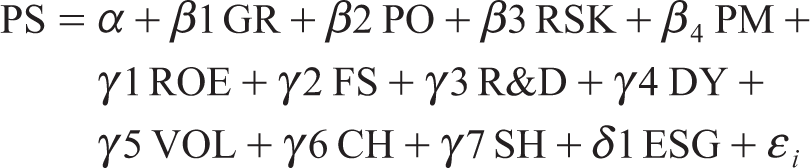
The data presented in the study are cross-sectional, therefore, i indexes firms. The dependent variable Yi denotes the value of price multiple used in regression equation. Three multiples used in the regression analysis are price to earnings, price to book value and price to sales. Explanatory variable Di represents the fundamental determinant for the respective price multiples. The fundamental determinants for price-to-earnings multiple are expected growth rate, payout ratio and risk. One additional fundamental determinant each, namely return on equity and net profit margin, has been applied for price-to-book multiple and price-to-sales multiple, respectively. β denotes the coefficient of fundamental determinants.
Ci denotes firm-level control variable. Firms’ characteristics such as size, dividend yield, stock price volatility, cash holdings, R&D intensity and strategic holding are used as control variables in the regression equation. γ represents the coefficient of control variables. Ei represents a dummy variable for firms’ environmental, social and governance engagement. δ denotes the coefficient of dummy variable. Term εi denotes the regression error term. Description of key determinants and control variables has been presented in Table 2.
Description of Price Multiples, Fundamental Determinants and Control Variables

The regression equations for price-to-earnings, price-to-book and price-to-sales multiples are as follows:
Lasso is an advancement of linear regression which has its origins in the recent past in 1986 (Santosa & Symes, 1986) and the seminal work conducted in mid-1990s (Tibshirani, 1996). To improve model predictability and model interpretation of linear regression, there are various methods such as subset selection, shrinkage methods and dimension reduction, and lasso is a significant shrinkage method among these. Shrinkage methods inherently constrain or regularize the coefficient estimates of independent variables such that some of the coefficient estimates are shrunk towards zero (i.e., ridge regression) or some of the coefficient estimates might be shrunk to zero (lasso regression). Shrinking of the estimated coefficients can reduce the variability of predictions, albeit at the cost of minor increase in bias. Alternatively, low training error does not guarantee low test error, and lasso aims at low test error at the expense of training error. In case of lasso regression, since some of the estimated coefficients are actually shrunk to zero, it leads to a substantial increase in model interpretability. To that extent, variable selection or feature selection is performed by lasso regression (Hastie et al., 2009; James et al., 2013). Since the number of independent variables reduces, the problems associated with collinearity of independent variables are also reduced to some extent.
The lasso coefficient βLʎ minimizes the quantity:
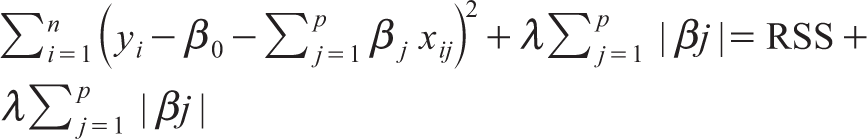
In OLS regression, only the residual sum of squares (RSS) is minimized, but in case of lasso regression, there is an additional penalty, namely the lasso penalty, that has to be minimized. λ is the tuning parameter and the value of the same is found using cross-validation method. Since some of the coefficients can actually be shrunk to zero, in case of lasso regression, lasso yields sparse models (James et al., 2013). Lasso regression has been applied using 10-fold cross-validation, which moderates the impact of skewness of the data set.
Findings and Discussion
Table 3 provides the summary statistics of the data concerning technology firms from emerging markets and developed markets. Examination of three price multiples for emerging market firms and developed market firms reveals that mean is consistently higher than the median, demonstrating the fact that these price multiples can have a high positive value but cannot be less than zero. This distribution asymmetry can be observed in the skewness values. There is a noticeable difference in the skewness for price-to-book multiple for developed market and emerging market, where the former has considerably high skewness than the later. Likewise, price-to-earnings data for developed market is more skewed compared to the same for emerging market, however, price-to-sales data for emerging market has higher skewness compared to the same data for developed market.
Descriptive Statistics of the Sample Data for Technology Firms from Emerging and Developed Market
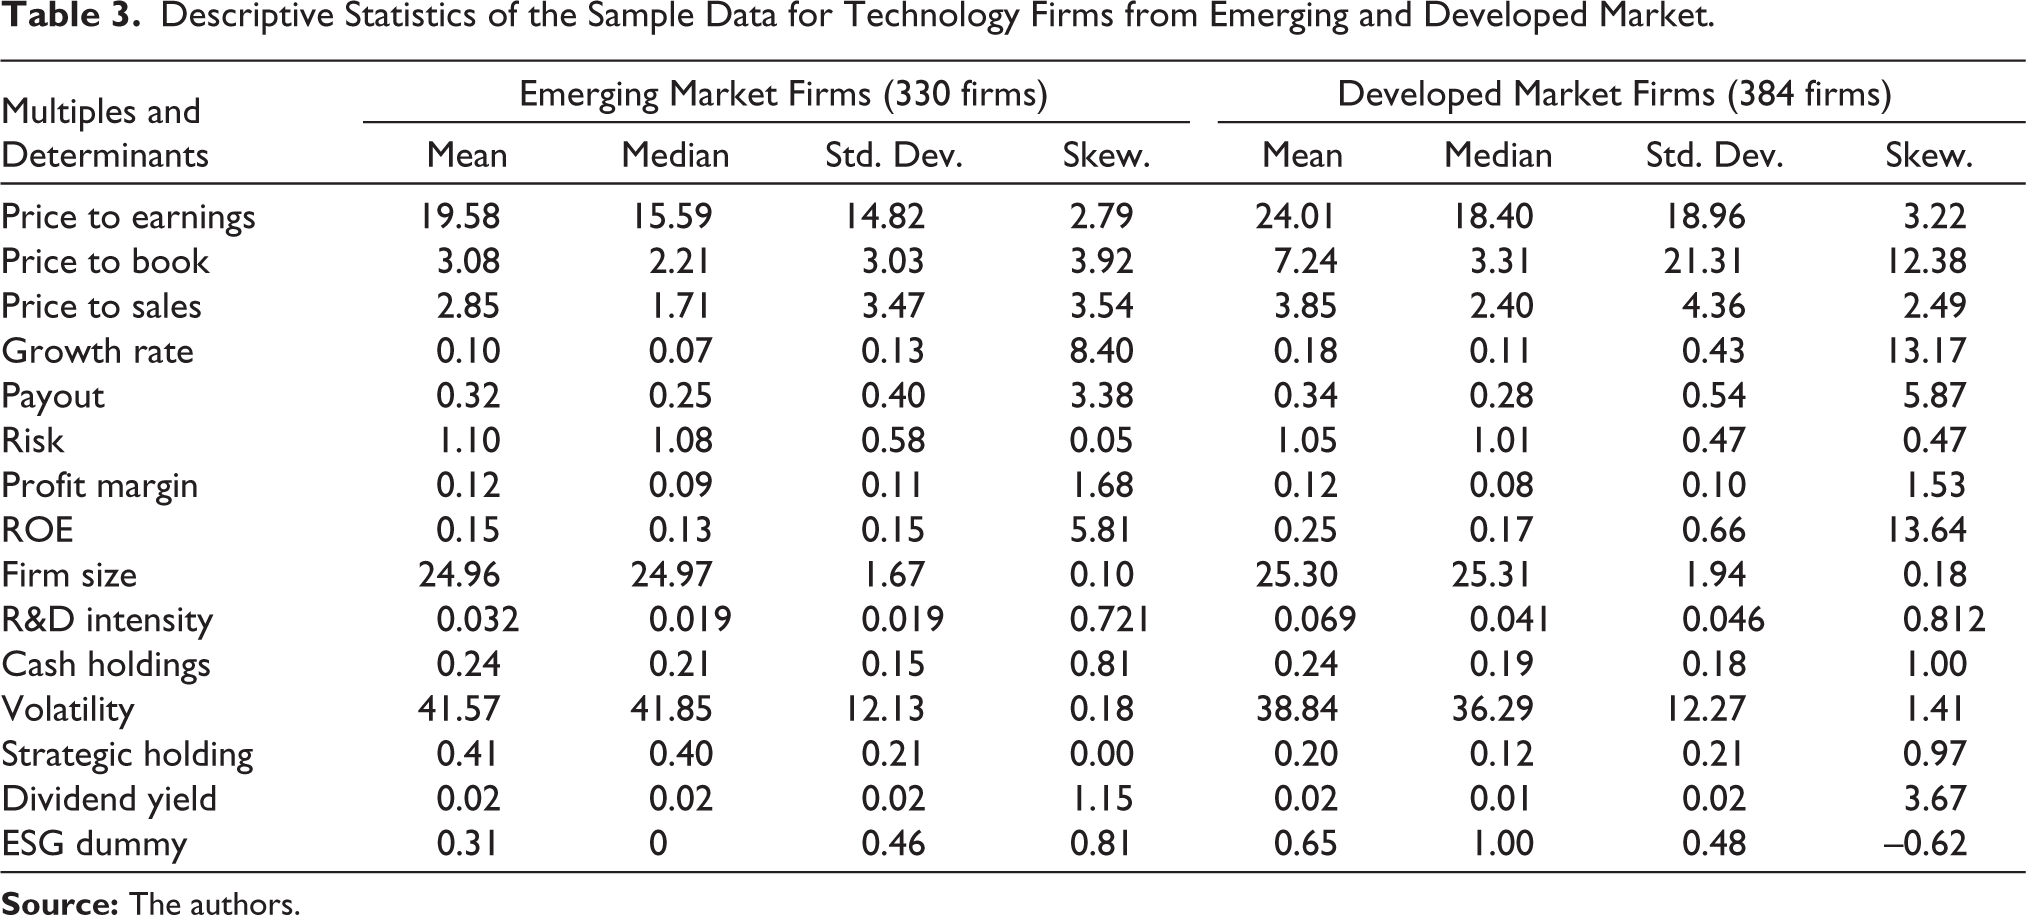
Overall, all the three multiples have higher values for developed market firms in comparison to the emerging market firms. Out of the fundamental determinants, growth rate is significantly higher for developed market firms, while payout ratio is marginally better in developed market; on the other hand, risk is higher for emerging market firms. In terms of profitability, firms from emerging market as well as developed market seem to be placed equally. They are also quite similar in terms of firm size, cash holdings and dividend yield. However, these firms are significantly dissimilar in terms of R&D intensity, strategic holding and volatility. While developed market firms tend to have greater propensity for research and development endeavours, emerging market firms are more volatile. Strategic or promoters’ holding is considerably greater in emerging market firms than the developed market firms.
Table 4 presents the results of OLS regression for price multiples for emerging market technology firms. Columns 1, 3 and 5 of Table 4 provide results of regression for price multiples using their fundamental determinants only, whereas columns 2, 4 and 6 provide results with added control variables. Price-to-sales multiple with control variables has the best explanatory power, whereas model for price-to-book multiple has considerably lower explanatory power both with and without control variables. Price-to-earnings multiple is explained by two fundamental determinants, namely growth rate and payout and a small number of control variables, that is, dividend yield, cash holdings and strategic holding. Fundamental determinants of growth rate, return on equity and payout explain the value of price-to-book multiple. Additionally, control variables, namely net profit margin, dividend yield and cash holdings impact their value significantly. Likewise, price-to-sales multiple has been described by fundamental determinants of growth rate, payout and net profit margin, and some of the control variables, namely firm size, R&D intensity, dividend yield and cash holdings.
Regression Results for Price Multiples for Technology Firms: Emerging Market
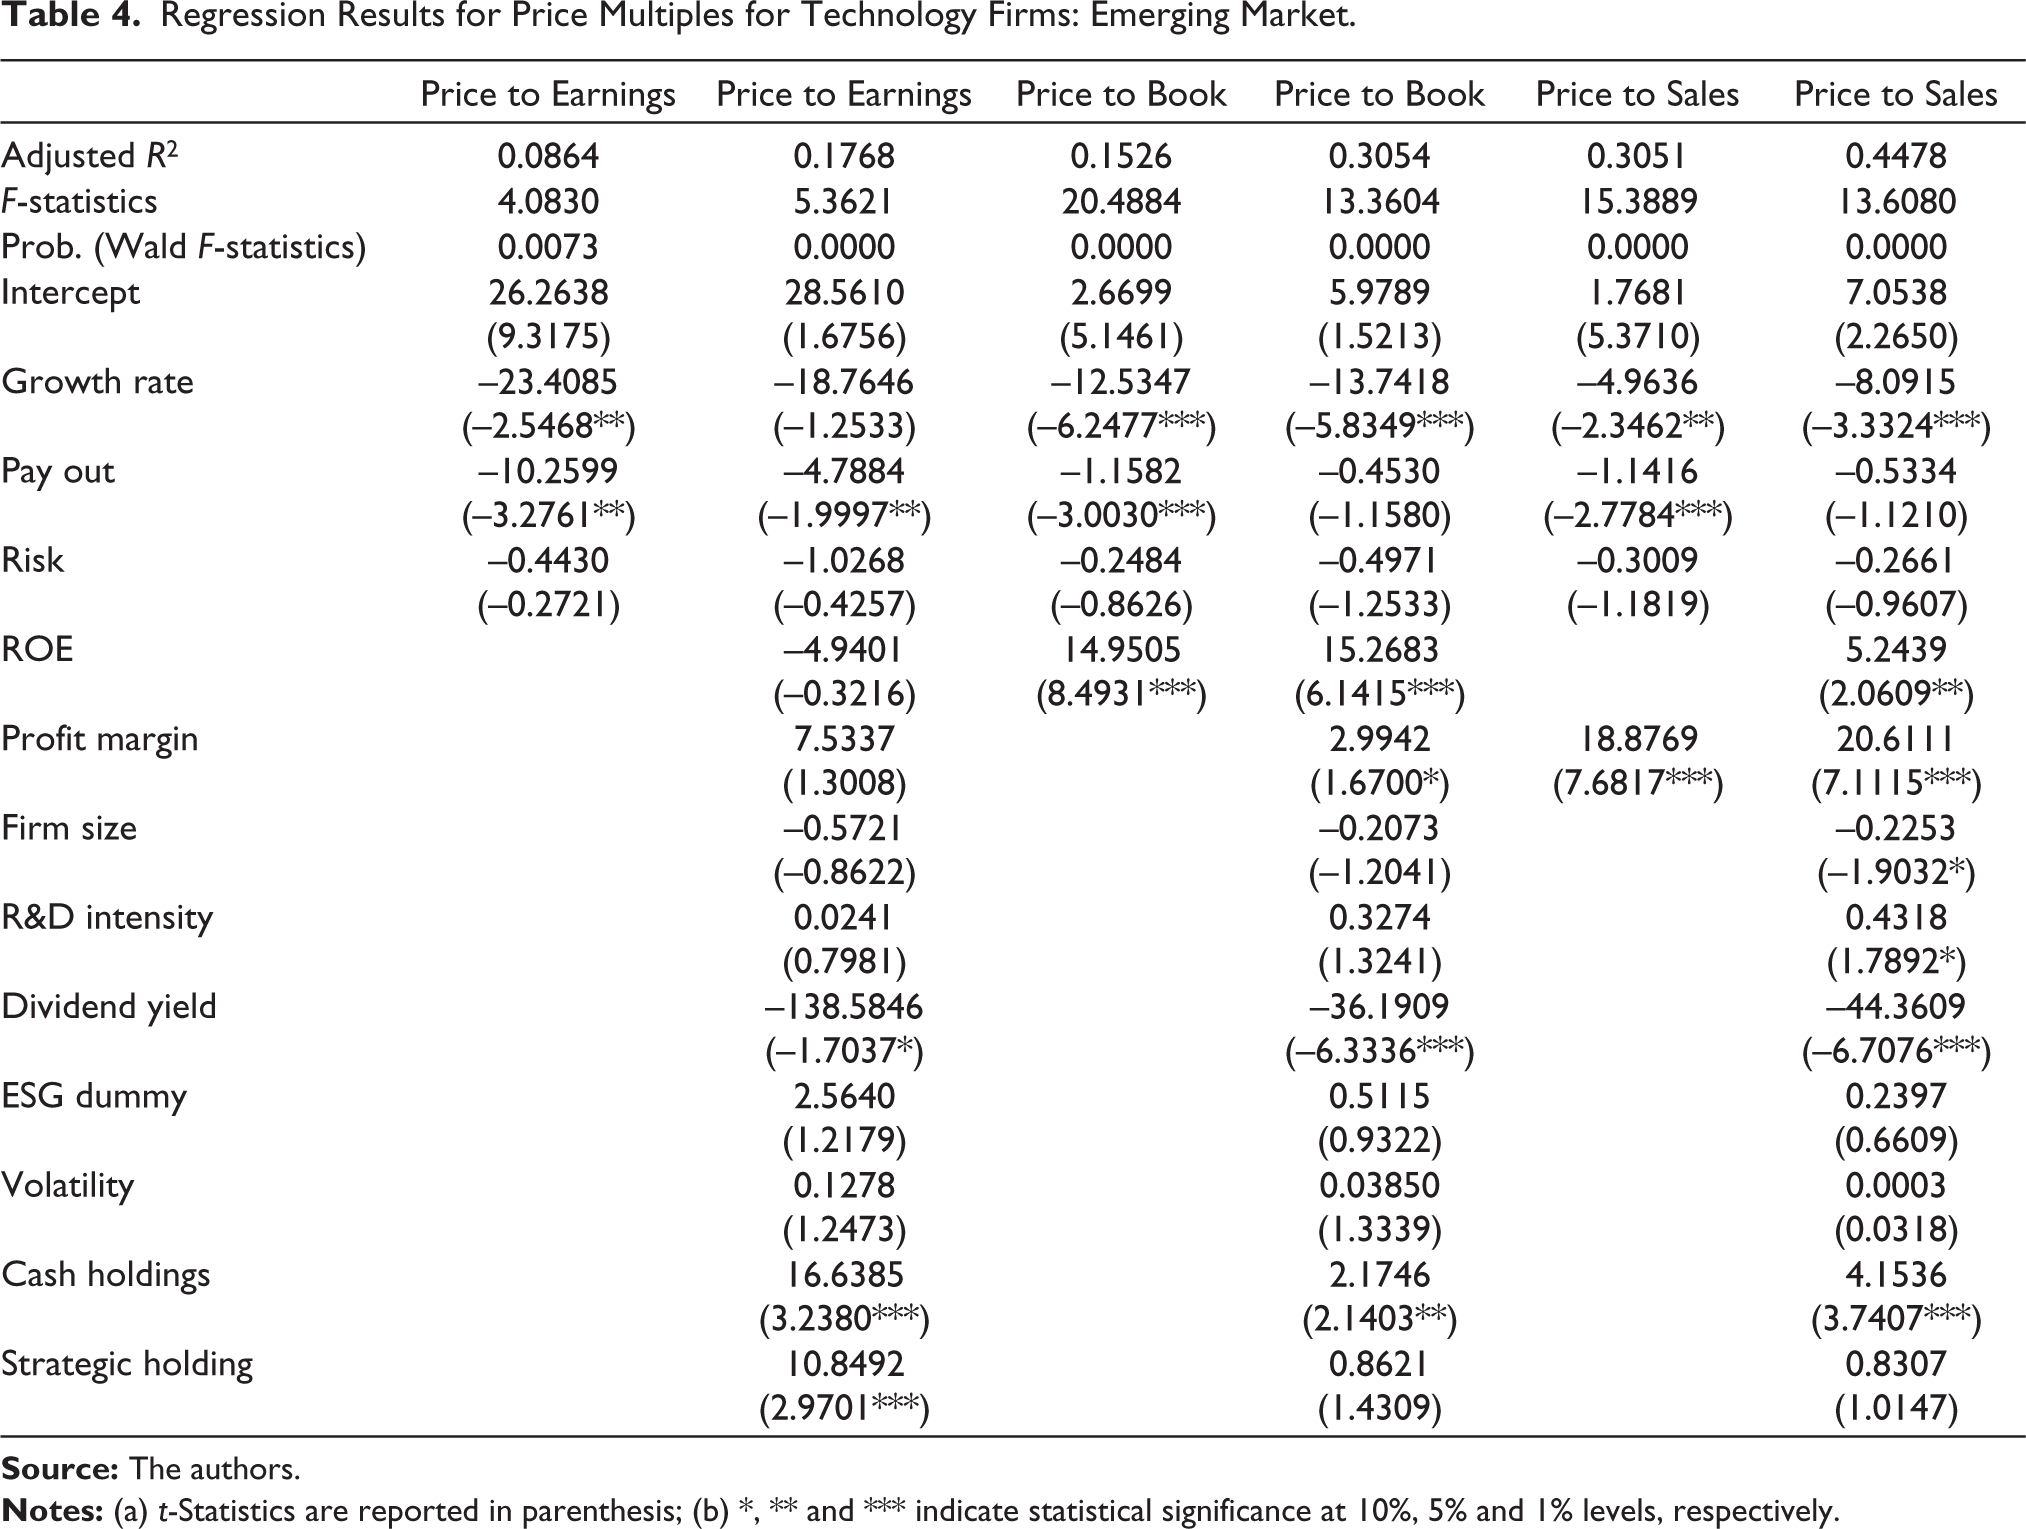
Table 5 presents the result of regression analysis of price multiples for developed market technology firms. Price-to-earnings multiple with fundamental determinants holds the least explanatory power, which improves considerably on inclusion of control variables. In sharp contrast to the emerging market firms, price-to-book multiple enjoys the best explanatory power with fundamental determinants, which improves further on inclusion of control variables in the regression model. Explanatory power of price-to-sales multiple for developed market firms is rather similar to the explanatory power of the multiple for emerging market firms.
Regression Results for Price Multiples for Technology Firms: Developed Market
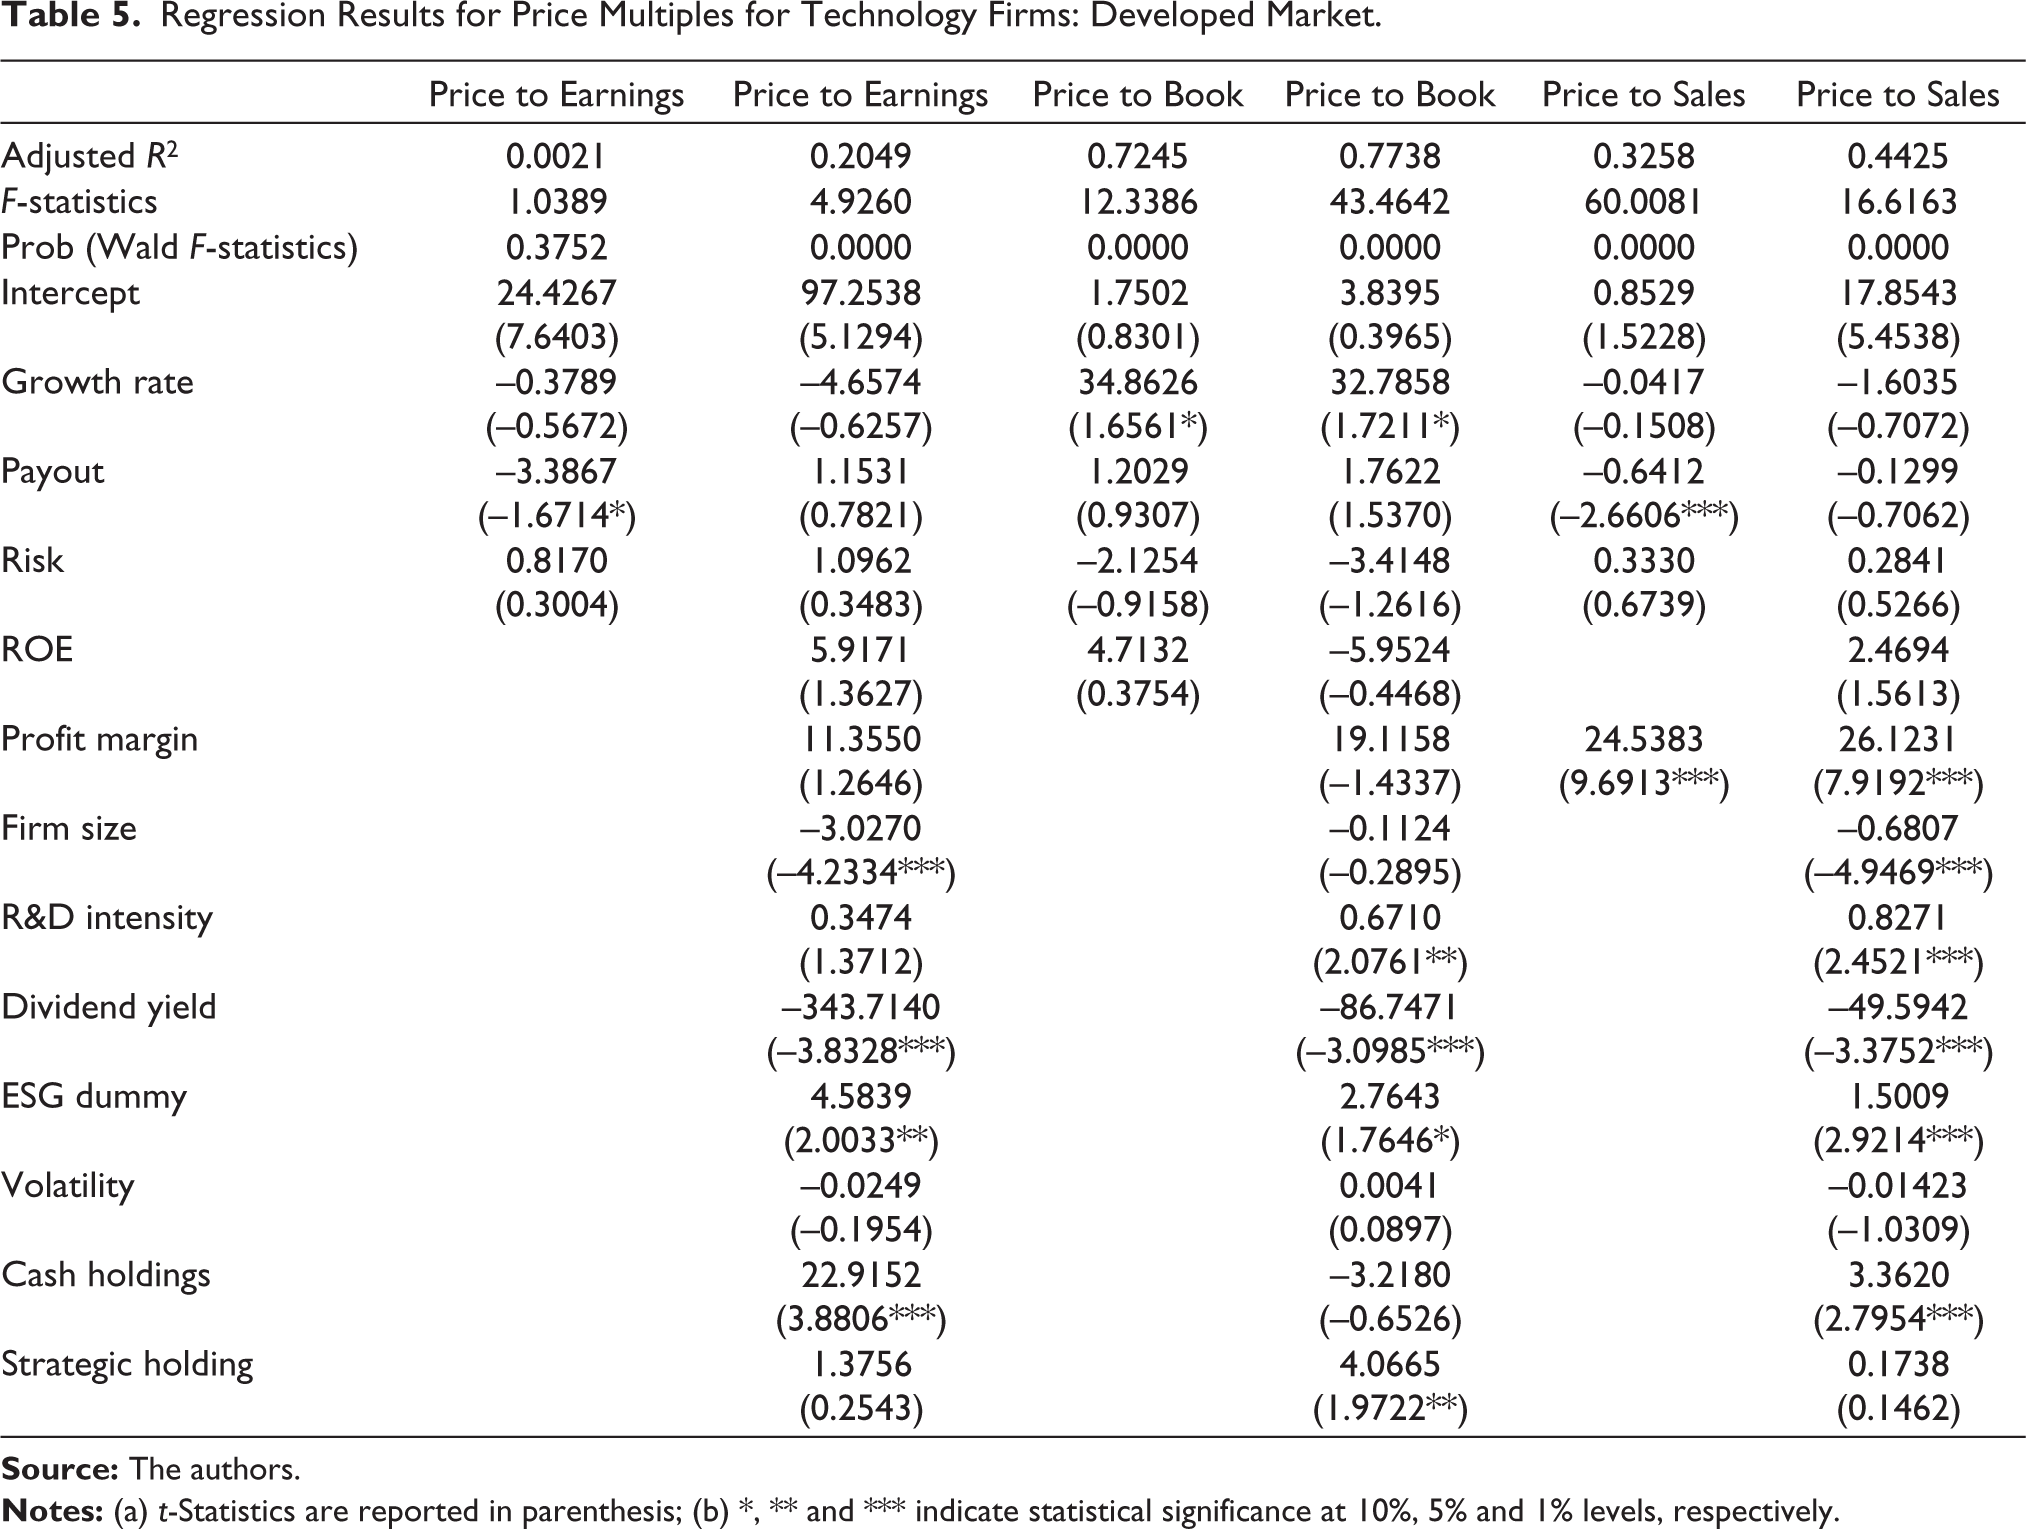
For price-to-earnings multiple, only one of the key determinants, that is, dividend payout, is found to be statistically significant. In addition to that, cash holdings, firm size, dividend yield and ESG dummy have statistically significant coefficients. For price-to-book multiple, fundamental determinant of growth rate and several control variables such as R&D intensity, dividend yield, ESG dummy and strategic holding are found to be statistically significant. R&D intensity, ESG practices and strategic holding impact the multiple’s value positively, whereas dividend yield impacts it negatively. Two fundamental determinants, that is, payout and net profit margin, are found to be statistically significant for price-to-sale multiple. Additionally, R&D intensity, dividend yield, ESG dummy and cash holing are also found to be statistically significant. Payout and dividend yield impact the multiple negatively, whereas net profit margin, R&D intensity, ESG dummy and cash holdings have a positive influence on the value of the multiple.
Figure 1 provides the comparison of significant determinants of price multiples for developed and emerging market firms.
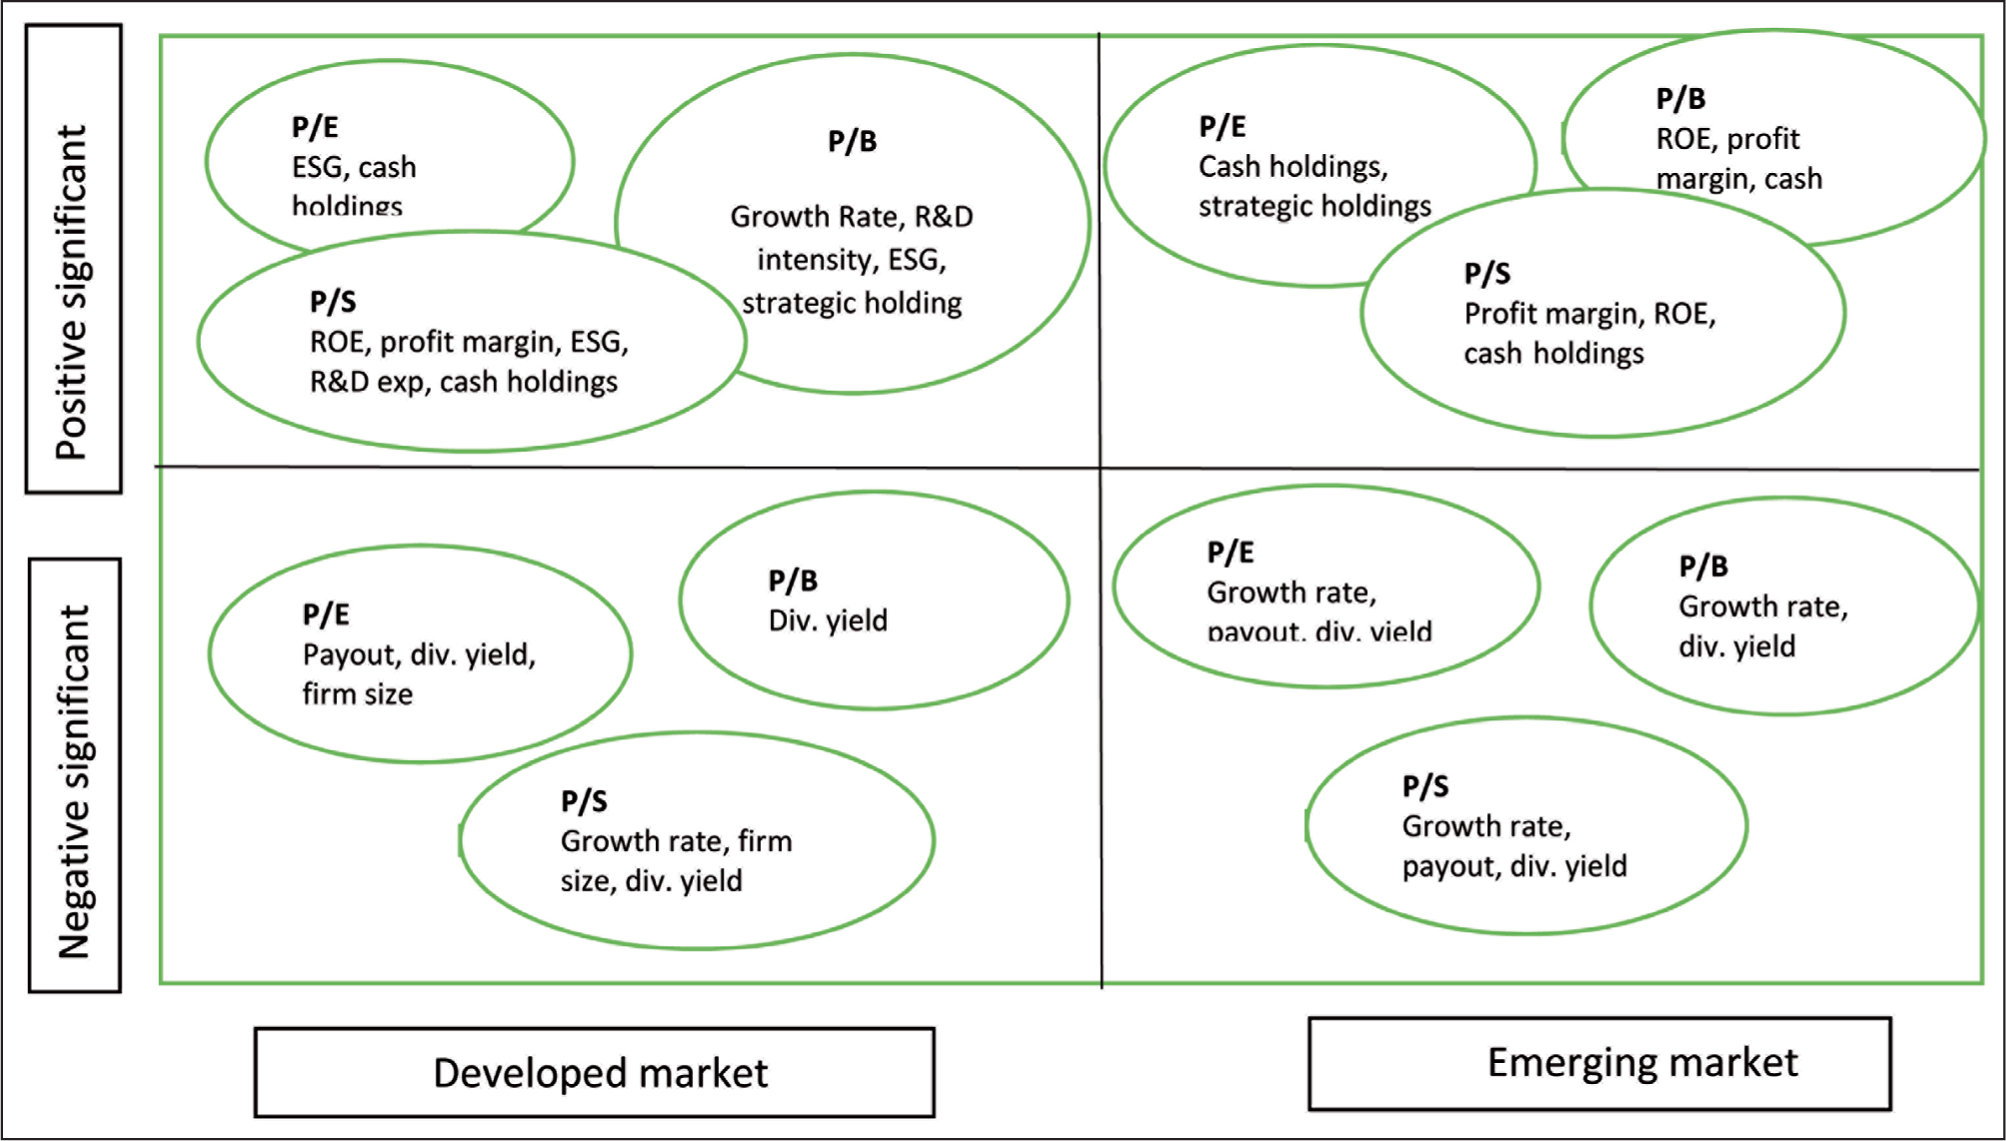
Firms’ cash holdings impact the price-to-earnings and price-to-sales multiples positively for developed and emerging market firms alike. It also impacts price-to-book multiple positively for emerging market firms but not the developed market. This pattern of positive association of cash holdings with all the price multiples points towards the product market power that comes with huge cash holdings. On the other hand, higher dividend yield has an adverse impact on the values of all the three multiples for both developed and emerging market firms. Generally, technology firms do not offer higher dividend yield as these firms have abundant positive net present value projects and they prefer to retain cash to invest in such high value projects. From the investors’ perspective, firms offering higher dividend yield are treated as a substitute to the fixed income market, and therefore, their price multiples have lower value than their counterparts offering lower dividend yields.
Firm’s engagement in better environmental, social and governance practices, which is being captured by a dummy variable called ESG dummy, has a very positive impact on all the three price multiples for developed market firms, but it does not impact multiples for the emerging market firms. This shows that investors in the developed and mature markets appreciate firm’s engagements in ESG practices and bid up the stock price of such firms. Conversely, in the emerging markets, investors focus primarily on firms’ profitability and return generated for the stockholders. Price-to-book multiple is most suitable multiple for the valuation of developed market firms, whereas price to sales is apparently the most suitable multiple for the valuation of emerging market firms. The regression model based on price-to-earnings multiple does not have substantial goodness of fit for firms from either markets. For developed market firms, price-to-book multiple has been determined positively by fundamental determinant of growth rate and control variables of R&D intensity, ESG and strategic holding, whereas payout, dividend yield and firm size impact the value of multiple negatively. These results are in line with the existing literature, which states that high growth firms which pay lesser dividends attract better value in the market. Also, firms with higher strategic holding involved in research projects and better ESG practices command higher value, while technology firms offering higher dividend yield are treated as no-growth firms and do not attract superior valuation. For emerging market firms, price-to-sales multiple has been described by fundamental determinants of net profit margin (positively), and growth rate and payout (both negatively). Control variables that explain price-to-sales multiple positively are return on equity and cash holdings, while the control variable influencing the multiple negatively is dividend yield. Therefore, in emerging markets, firm’s profitability and its cash holding are the key determinants of firm valuation.
Table 6 presents the results of lasso for price multiple regression models for developed and emerging market firms.
Results of Lasso Regression for Price Multiples of Developed and Emerging Market Firms
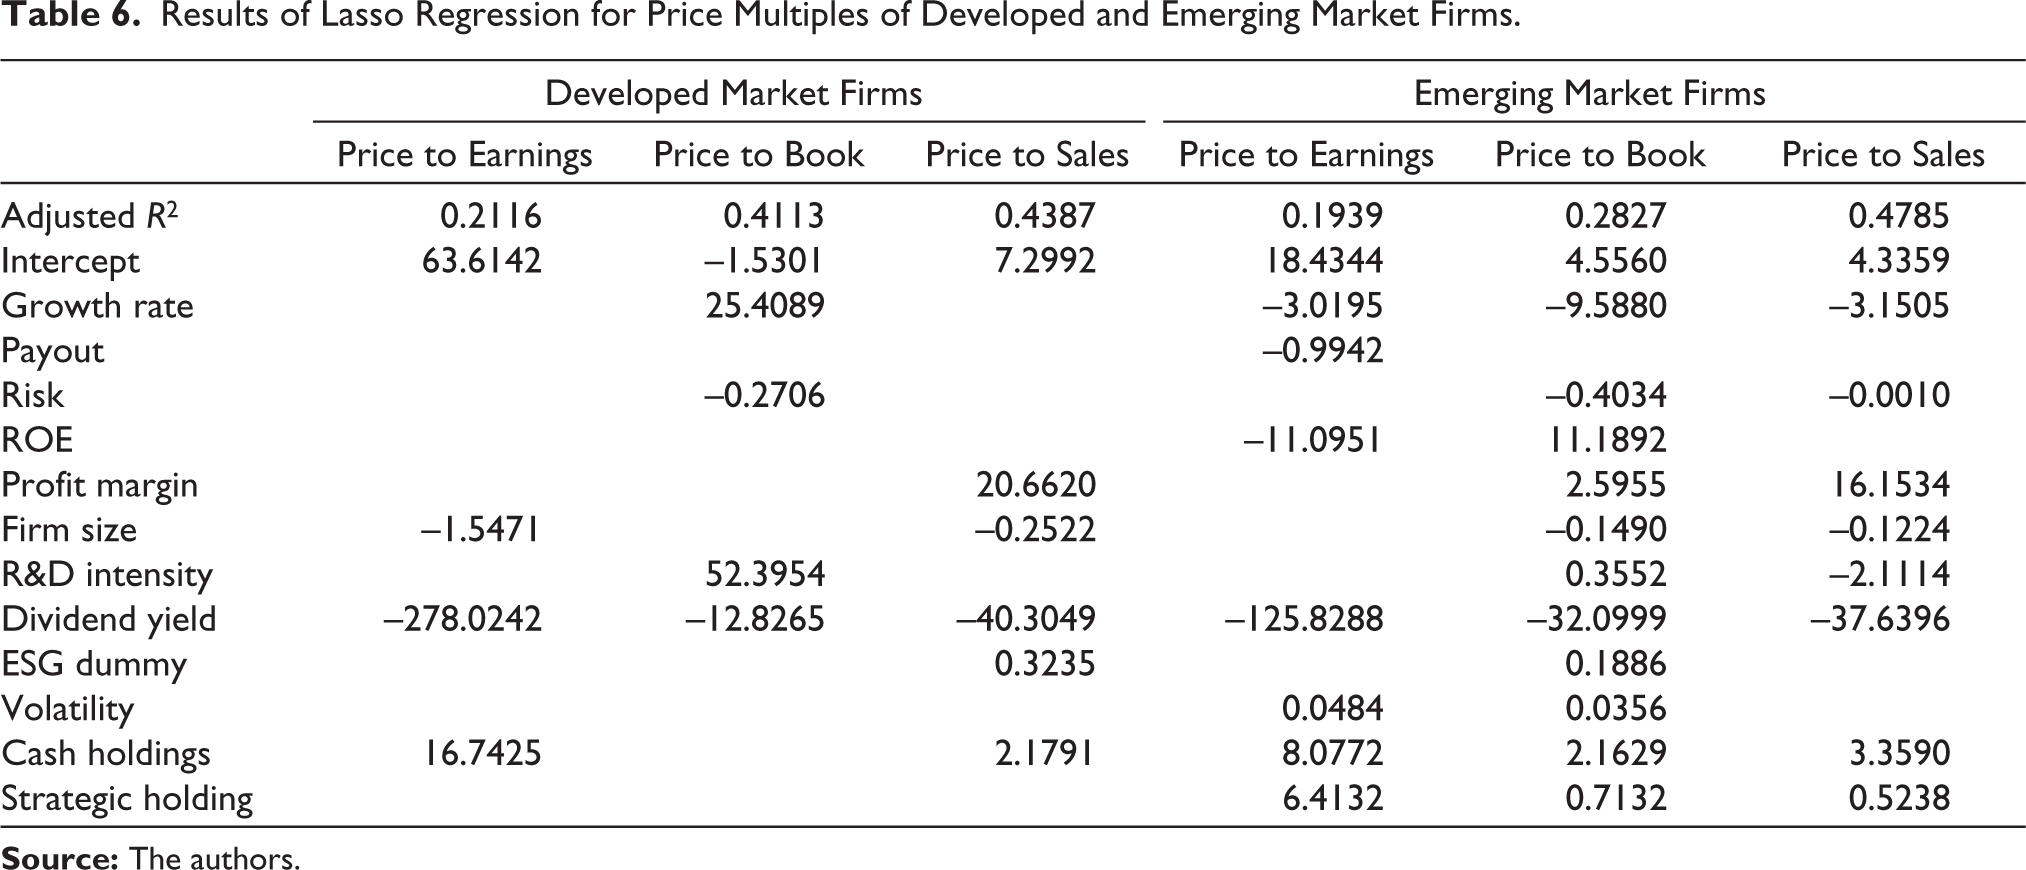
In contrast to the results of OLS method, price to sales emerges out as the most appropriate multiple under the lasso method for both developed market firms and emerging market firms. Price-to-sales multiple has the highest value of adjusted R2 for all the firms, whereas price-to-earnings multiple has the lowest adjusted R2. Similar to the results of OLS regression for developed market firms, adjusted R2 is highest for price-to-book multiple.
For developed market technology firms, significant determinants of price-to-sales multiple are profit margin, size of the firm, dividend yield, ESG dummy and cash holdings. These firm’s value improves significantly with their cash holdings and ESG practices. For emerging market technology firms, significant determinants of price-to-sales multiple are growth rate, risk, profit margin, firm size, R&D intensity, dividend yield, cash holdings and strategic holding. Coefficient of growth rate is negative for emerging market firms, which indicates that firms growing at a fast rate generate higher sales by compromising on their earnings and profitability, resulting in lower price-to-sales multiple. This is not the case with developed market firms, as growth rate has been eliminated by lasso for price-to-sales multiple. For developed market firms, growth rate is one of the critical determinants for price-to-book multiple, and it carries a very large positive coefficient, indicating that investors prefer high growth firms in that market.
Cash holding is a very important determinant of price multiples for developed as well as emerging market firms. Positive coefficient of cash holding indicates that firms withholding more cash attract better valuation. Another interesting determinant is strategic holding, which has a positive impact on the value of all the three price multiples for the emerging market firms, but it has been eliminated by lasso for the developed markets’ multiples. Thus, for emerging markets firms, strategic holding generates a higher value of the price multiples by reducing agency cost. Dividend yield is the only determinant which has been retained by lasso for all the price multiples for developed as well as emerging market firms. Analogous to the results of OLS regression, the negative coefficient of dividend yield demonstrates lower valuation of high dividend firms. Volatility has been retained by lasso for price-to-earnings and price-to-book multiples for emerging market firms but not for the developed market firms. Positive coefficient of volatility directs towards high volatility of high value firms. On the other hand, risk has negative coefficients for price-to-book multiple of the developed market firms and price-to-book and price-to-sales multiples of the emerging market firms. As the risk has been calculated using 5-year monthly β of the stock returns, high β firms are less likely to attract better valuation.
Conclusion
Results of the OLS regression on price multiples suggest that price to book is the most appropriate multiple for valuing developed market technological firms, whereas price to sales is the most appropriate multiple for emerging market firms. Determinants such as growth rate, R&D intensity, ESG practices and strategic holding influence the value of the price-to-book multiple positively for developed market firms, while value of price-to-sales multiple for emerging market firms depends on growth rate, return on equity, profitability, research activities, ESG practices and cash holdings. Dividend yield is a common determinant for all the price multiples impacting their values negatively, both for developed market firms and emerging market firms. Machine learning-based shrinkage method lasso has eliminated several variables from the price multiples’ regression models by applying cross-validation method. Results of lasso algorithm show that price to sales is the most appropriate multiple for both developed and emerging markets firms. Firms’ profitability and cash holdings influence price-to-sales multiple positively for both categories of firms. Also, smaller firms tend to generate higher value of the multiple under both categories. Firms’ ESG practices is an important determinant of its price-to-sales multiple for developed market firms, however, it does not influence the multiples’ value for emerging market firms. Value investors and analysts can give preference to the price-to-book multiple while evaluating equity investment in technology firms from developed markets, whereas they may prefer to apply price-to-sales multiple in case of emerging market technology firms. Besides the fundamental determinants of the explicit multiple, analysts and investors can consider R&D intensity, cash holdings and strategic holdings as key determinants for emerging market technology firms. For developed market technology firms, R&D intensity and ESG are critical additional determinants of the price multiples.
Footnotes
Acknowledgements
The infrastructural support provided by FORE School of Management, New Delhi in completing this paper is gratefully acknowledged. The author is thankful to the editor and referees for their valuable inputs and feedback.
Declaration of Conflicting Interests
The authors declared no potential conflicts of interest with respect to the research, authorship and/or publication of this article.
Funding
The authors received no financial support for the research, authorship and/or publication of this article.