
Abstract
Do people show fads and fashions in their attention searches? With the Google online search data during COVID-19, particularly from January to May 2020 for the socio-economic keywords, this study examines if online searches show short-run and long-run attention dynamics leading to fads and fashions in attention to the NSE Nifty and BSE Sensex indices. This study employs the methodology of cointegrating relationship with autoregressive distributed lag (ARDL) model and explains investors’ attention search dynamics at the ‘NSE Nifty Index’ and ‘BSE Sensex Index’ caused by socio-economic attention searches. It also examines if the dynamics of attention coordination are parsimonious in nature and it explores the same with the generalized autoregressive conditional heteroskedastic (GARCH-X) model. With the ARDL models, this study finds robust and unbiased cointegrating impacts of socio-economic attention searches on the attention search for the NSE Nifty index but these are not the best linear unbiased and efficient (BLUE) ones, while the same on the BSE Sensex Index are BLUE. For the NSE Nifty index, the attention dynamics at the GARCH-X specification are BLUE while for the BSE Sensex index, the GARCH-X specification also has some additional information in terms of the ARCH effect only.
When society suddenly becomes unpredictable, we know we have entered a danger zone. Much of what is missed by traditional economics—people’s motivations, desires and moods, their cognitive resources of memory and attention, the speed of their mental reactions, their cultural codes and values, their aesthetic tastes and so on, which have hitherto been seen as aspects of the psyche and hence the province of social psychology, now come within the purview of the New Economics.
Introduction
Given the unprecedented public attention to COVID-19, our society at present belongs to the new normal of economic life. Does investors’ attention to stock markets reveals the new normal of trading interests? Does this new normal cause fads, fashions, or bubbles in the stock markets? The answers are affirmative since stock-trading is a socio-economic activity and traders’ changing sentiments, fads, fashions, and bubbles govern the stock markets (Shiller, 1988; Shiller et al., 1984).
The fads, fashions, customs and cultural changes in the stock markets can be explained by informational cascade (Bikhchandani et al., 1992). Investors follow their predecessors’ behaviour(s) and disregard their own information. Banerjee (1992) has called this sequential behaviour(s) as herd behaviour(s). Both information cascade and herd behaviour appear at interpersonal communication of information (Shiller, 1995). Shiller (2000) uses ‘cascade’ for media attention (economic information) leading to herding effect of media news (economic news). Firms’ managers show herd behaviour in investment choices (Scharfstein & Stein, 1990). In Keynes (1936)’s beauty contest, nonetheless, investors more passionately pay attention to others’ insights than their self-insights about assets’ future prices.
At the origin of fads and fashions, Hayek (1945) has viewed herd behaviour as markets’ coordination motive aggregating private information into prices. Public signal and public noise creep into investors’ demand function, induce implicit coordination motives, and result into disproportionate roles (Morris & Shin, 2002). Investors’ private coordination motive makes assets’ prices highly sensitive to public news about assets’ true fundamentals, while their transparency in public communications diminishes incentives to private signals. At imperfect information coordination, stocks’ prices aggregate the dispersed private signals as public noise, bring in multiple equilibria, and result in herd behaviours (Angeletos & Werning, 2006). Less information coordination dampens the information aggregation process and amplifies public noise (Angeletos & Pavan, 2007), and these induce information cascades and herd behaviours in the markets endogenously.
Nonetheless, noise in private signal is refined by noise in public signal and the market participants’ beliefs about the others’ beliefs are reflected in assets’ prices (Allen et al., 2006). Higher-order differences in investors’ opinions induce heterogeneous beliefs and generate sudden drifts in stocks’ prices (Banerjee et al., 2009). Changes in the traders’ heterogeneous prior beliefs also exhibit differential wealth effects, and result in short-term momentum effects and long-run price reversals (Ottaviani & Sørensen, 2015). Therefore, a modest difference in their higher-order beliefs, that is, the difference in the wisdom of the crowd can prompt large price effects (Banerjee, 2011; Dindo & Massari, 2020; Han & Kyle, 2017; Verardo, 2009).
But, the wisdom of the crowd is a perceptive psychological phenomenon and it should be viewed along with perspective information contents. There is little empirical research in this direction. The new normal of COVID-19 provides for such an opportunity towards the said direction and thereby, it motivates the author to explore the influence of investors’ information coordination on the stock markets—if the fads and fashions and public confidence induce investors’ attention cascades. We propose that investors’ attention is central to their general perceptions about the stocks’ market sentiments, and these cause fads, fashions, or bubbles. We hypothesise that investors’ socio-economic attention contributes to their belief formation and this develops the fads and fashions in the stock markets. Towards this particular objective, we examine if investors’ online socio-economic attention search-intensity influences their attention to the NSE Nifty Index and BSE Sensex Index in India.
We flow the literature review in the next section, data and methodology in the third section and results and findings in the fourth section. We conclude in the last section.
Literature Review
The literature on the fads, fashions or bubbles in stock markets shows both the perspectives of financial economists and behavioural psychologists. The financial economists view their research agenda from the neoclassical rational fundamentals of decision choices while the behavioural psychologists pursue the behavioural psychological paths. Since investors are neither the fully rational experts nor the emotional subjects, their decision choices rather involve a clubbing of both the perspectives (Mitra, 2019; Zeiler, 2019). Investors perceive their decision-making with both the perspectives either jointly or in combinations of their different aspects (Angner, 2019).
Until researchers pay their attention to the said joint perspectives, the literature on the fads, fashions or bubbles in the stock markets looks as if the researches have been developed in the stacked order. For example, in The Theory of Moral Sentiments, Adam Smith has argued that people’s passion and emotion drive their decisions and desires (Ashraf et al., 2005). DeBondt (1989) has found anomalies to the neoclassical hypothesises describing the extreme seasonality of ‘price corrections’ and the asymmetry in response to ‘good’ or ‘bad’ news, the presence of normatively ‘excessive’ risk premia contributing to non-rational expectations of the future cash flows, and investors’ overreaction to trades. Camerer (1989) has identified that the rational growing bubbles, fads and informational bubbles cause stocks’ prices to deviate from their intrinsic values. Investors invest in the assets’ common characteristic, called a style, and assets in the same style comove highly (Barberis & Shleifer, 2003). The heterogeneity in the rational arbitrageurs’ opinion, information and beliefs, and their departures from the common knowledge—these all fuel the bubbles to persist for longer periods in the stock markets (Abreu & Brunnermeier, 2003).
Besides, investors’ attention perspectives also influence their decision choices. Merton (1987) has linked investors’ limited ‘know about’ to search interest or attention level as it is the ‘shadow cost’ resulting in an alpha in the security market line. The shadow cost depends on traders’ selection of securities at a given information and it varies at the investors’ lacks of information (Merton, 1987). Hirshleifer et al. (2011) show that investors’ attention is a scarce and costly resource and investors are inattentive to earning announcements or its components in the market equilibrium. Investors’ attention cost can also explain the stocks’ underreactions (overreactions) to earnings surprises (operating accruals). But the above stated studies have not explored the effects of investors’ information search on their formation and choice of active portfolios, passive portfolios, and market index as well. In a distant but relevant research, Peng and Xiong (2006) have showed that investors’ limited attention leads to their category-based learning and processing more market-related and sector-wide information than the firm-specific ones. Their category-based learning shows presence of returns’ co-movements and overconfidence. At noise traders’ distraction to sensational news on the financial markets, a recent study of Peress and Schmidt (2020) finds presence of less degrees in the stocks’ trading activity, liquidity, volatility and price reversal among the stocks predominantly owned by the noise traders.
Again, investors’ limited attention needs feedback effects and attention coordination as well. In exploring investors’ feedback effect on the assets’ prices, Ozdenoren and Yuan (2008) find a ‘vicious effect’ between the assets’ prices and their fundamental values as caused by investors’ coordination motive and self-fulfilling beliefs. Such vicious effects result in the presence of multiple equilibria and excess volatility in the prices. Seasholes and Wu (2007) show that stocks’ hitting of upper price limits attracts retail traders to buy stocks not owned earlier. At inattentive investors’ stochastic presence in stocks’ pricing dynamics, Hendershott et al. (2010) identified long-lived pricing errors for the New York stock Exchange (NYSE) stocks contributing to a standard deviation of about 3% involving a half-life of 3 weeks and 27% (19) of the daily (monthly) idiosyncratic return variances. The pre-IPO media coverage of lead-IPO underwriters can attract greater investors’ attention to IPO underwritings, and this results in better after-market valuations and larger price reversals as well (Bajo et al., 2016). With both aggregate and house-hold trade data for the NYSE market, Yuan (2015) documented that public attention-grabbing events aggravate selling pressure and result into the negative price impact and market crushes.
The impacts of investors’ attention dynamics on stocks’ prices also differ at their levels of exposures to the different information media or platforms. Deng and Liu (2018) depict that in China, traders’ attention to the popular search engines (i.e., Baidu and 360) and professional financial information platform(s) (i.e., Hexun) both have significantly positive corelationships with the stocks’ weekdays trading volume, while their heterogeneity in time differs in short-run return predictions. Liu and Ye (2016) discovered that self-initiated (news-driven) search volume generates buy (or sell) pressure, while the media coverage moderates the impact of search volume on stocks’ prices negatively. According to Bali et al. (2014), investors’ inattention and the market’s liquidity contribute to underreaction at liquidity shocks, both are visible in the short-run return predictability but investors’ inattention is more robust in the long-run.
The researches in behavioural finance are presently exploring persistency of investors’ attention impacts on the stock markets viz., attention co-movement and stocks’ returns, stocks’ search clustering and market returns, and their dynamics. For example, investors’ attention co-movement is nontrivial for the average firms and the same is related to firms’ characteristics while it is positively associated with excess stock return co-movements (Drake et al., 2017). Leung et al. (2017) exhibited that search clusters of stocks in the Russell 3000 stocks at different time reveal returns’ comove and investment preferences. Han et al. (2018) manifested non-linear multiple relationships between investors’ attention and the exchange rate returns and they found short-lived lag-effect of attention on current currency returns. Vozlyublennaia (2014) also showcased interaction effects between the stocks’ lagged-returns and search attention while investors’ increased attention level diminishes the stocks’ return predictability.
Furthermore, the burst of the internet of things and its versatile uses have made investors’ attention spectrum well-rich but too much noisy (Calic et al., 2019). The development of ultra-high-speed data links, arrays of relevant contents and social media, investors’ attention allocation, information selection, and frequency of attempts thereto are all vital critical decision issues in ‘attention economics’ (Da et al., 2011, 2015; Dolgin, 2012;). The literature of attention economics also shows presence of investors’ local-bias and under-diversified portfolios (Mondria & Wu, 2010; Nieuwerburgh & Veldkamp, 2009). Information and attention cascades are also triggered by behavioural biases like investors’ media bias, hindsight bias, familiarity bias, personal experience bias, local bias, confirmation bias, overconfidence, etc. (Bailey et al., 2011; Biais & Weber, 2009; Hirshleifer & Teoh, 2009; Li et al., 2014; Seguin, 2016).
In the present scenario of COVID-19, investors’ cultural codes, levels of democracy in a country, investors’ fear, their depressed mood, and demotivated desires across the stocks are becoming the prime attention drivers in the stock markets (Fernandez-Perez et al., 2021; Shen & Zhang, 2020). These have also given a few instances of abnormal gains in the major global stock markets in the USA, UK, Russia, France, Germany, Japan, Taiwan, Shanghai, Hong Kong, Canada, Singapore, India, etc. (Liu et al., 2020). With emphasis on investors’ online attention searches in the following research hypothesis, the present study is going to be vital in exploring the nature of attention dynamics in India during COVID-19.
Proposition
At public signals and beliefs of the market participants about the socio-economic variables during COVID-19, the intensity of investors’ online attention searches at the Google and their attention coordinations as well influence the markets’ attention sentiments in the NSE Nifty and BSE Sensex stock markets in India.
Data and Methodology
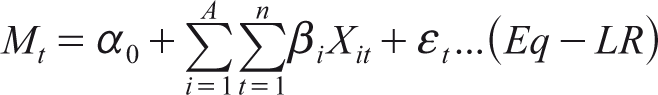
Let us now introduce a simple long-run empirical model with the equation Eq-LR for our anonymous investors’ attention coordination dynamics. The investors use online Google searches to get different socio-economic information (Xit) and thereby, they develop their decision introspection about the attention spectrum (Mit) for their relevant stock market indices. This long-run attention equilibrium is instant and idealistic in nature as well. It shows no lags in investors’ attention decision process.
If investors now update their introspections about the different socio-economic aspects (ΔXit) and the stock market indices (ΔMit) as well, we need a revision in the above model. We assume that these two sets of introspections of attention spectrum viz., AI: {Xit, ΔXit} and DI: {Mit, ΔMit} are entangled with each other such that the elements in AI are felt relevant at their decision input elements in DI. The both attention spectrum AI and DI, together, influence investors’ psychological decision-making process to buy, sell, or hold a stock in the stock markets such that DI is co-integrated with AI. Again, since their past attention spectrums Xit–1 and Mit–1 are updated with new incremental inputs ΔXit and ΔMit respectively, we assume that the present attention coordination between Xit and Mit has short-run and long-run attention impacts. In the following, we frame the dynamic models for attention coordination.
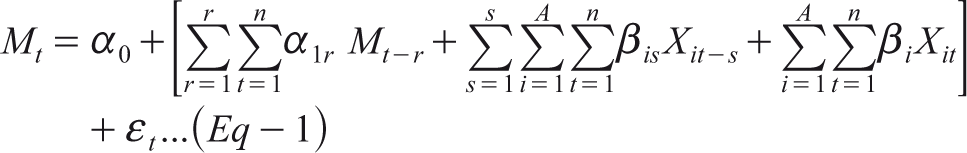
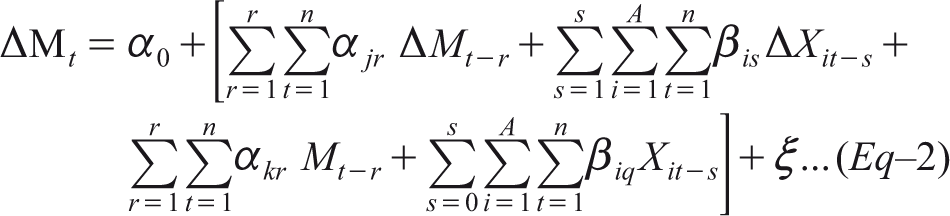
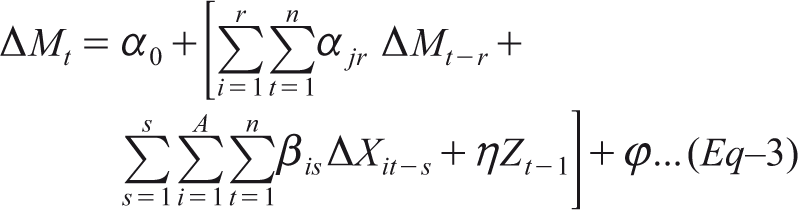
In exploring this cointegration effects amongst the variables, there are two regression models: the Johansen cointegration model and the autoregressive distributed lag (ARDL) model structure. Since the Google search volume index (SVI) data are of mixed stationarity, we avoid using the former model and use the ARDL model setup. Its unrestricted short-run form (SRF) is given in Equation (1), the conditional long-run form (LRF) is given in Equation (2), and the conditional error-correction form (ECF) is in Equation (3). The unrestricted SRF of the ARDL model (also read as ‘unrestricted ARDL’) is also revised to develop the parsimonious generalized autoregressive conditional heteroskedastic (GARCH)-X model in Equation (4). We now proceed to use the SVI data in EViews 10 with these three ARDL models and one GARCH-X model.
In the ARDL specifications in Equations (1)–(3), α0 represents the intercept and εt, ξt, and φt are the residual error terms. The regressand ΔMt in Equations (2) and (3) is the first difference of the regressand Mt in Equations (1) and (4). It represents the SVI data for attention to keywords ‘NSE Nifty index’ and ‘BSE Sensex index’ alternatively. We use Mt as the general notation and regress their respective SVI data separately. The regressor ΔXit is used to denote the first difference of the regressor Xit, and Xit is the ith attention variable over the array A for the attention keywords.
In Equation (1), the regressors within brackets include the endogenous variable at r lags, independent variables at s lags, and the independent regressors at the current time t. In Equation (2), the regressors within brackets include the endogenous first difference variable at r lags, independent first difference attention variables at s lags, the endogenous variable at r lags, and the level data of independent variables at lags of s ≥ 0. Here, the first difference variables represent short-run effects while the rest two show long-run effects. In Equation (3), the first difference variables also show short-run effects while Zt–1 is the cointegrating equation factor at first lag. The regression system derives Zt–1 as the error correction factor at their levels’ specification of the SVI data towards regressing Mt.
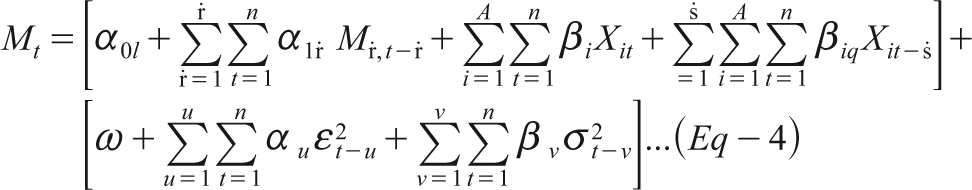
Now, the attention noise εt at investors’ attention coordination may appear at the effects of fixed noise, at its own autoregressive echo with lags, and at attention volatility for decision inputs Mit. In Equation (4), therefore, we have the factors as those are in Equation (1) and the error component εt is replaced with the GARCH (v, u) specification, where it has the GARCH constant ω, ARCH (–u) impact(s) αu, and the GARCH (–v) impact(s) βv.
With the above four empirical regression models, we use twenty-eight socio-economic Google search keywords for investors’ attention search interests. Since fads (fashions) in the stock markets suggest for the presence of short (long) duration bull or bear market rallies, the stated proposition suggests for influences of the bull or bear sentiments on the NSE Nifty and BSE Sensex markets. Investors’ attention searches are likely to be in tune to their attention coordination and beliefs, and these are expected to influence their attention to the stock markets. Now, we explore if the Google’s SVI data for the socio-economic keywords explain investors’ short-run and long-run dynamics of attention coordination for the NSE Nifty and BSE Sensex indices.
Data and Variables
We use the daily SVI data to proxy for investors’ attention search interests from 1 January 2020 to 30 May 2020, and we collected the data at
Appropriate Lag Selection
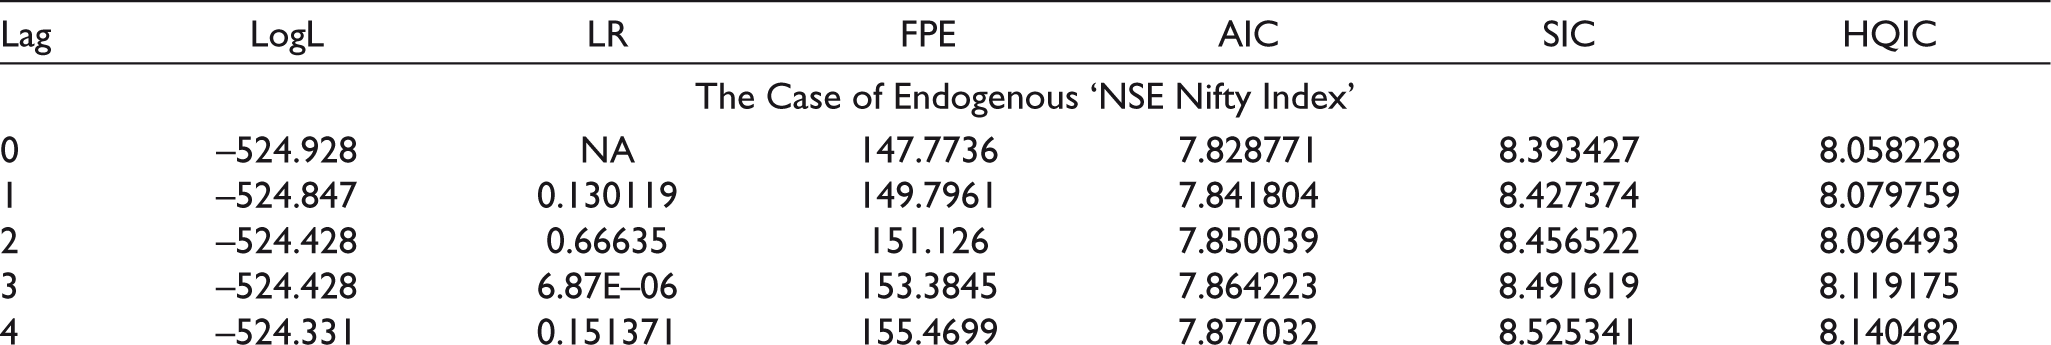
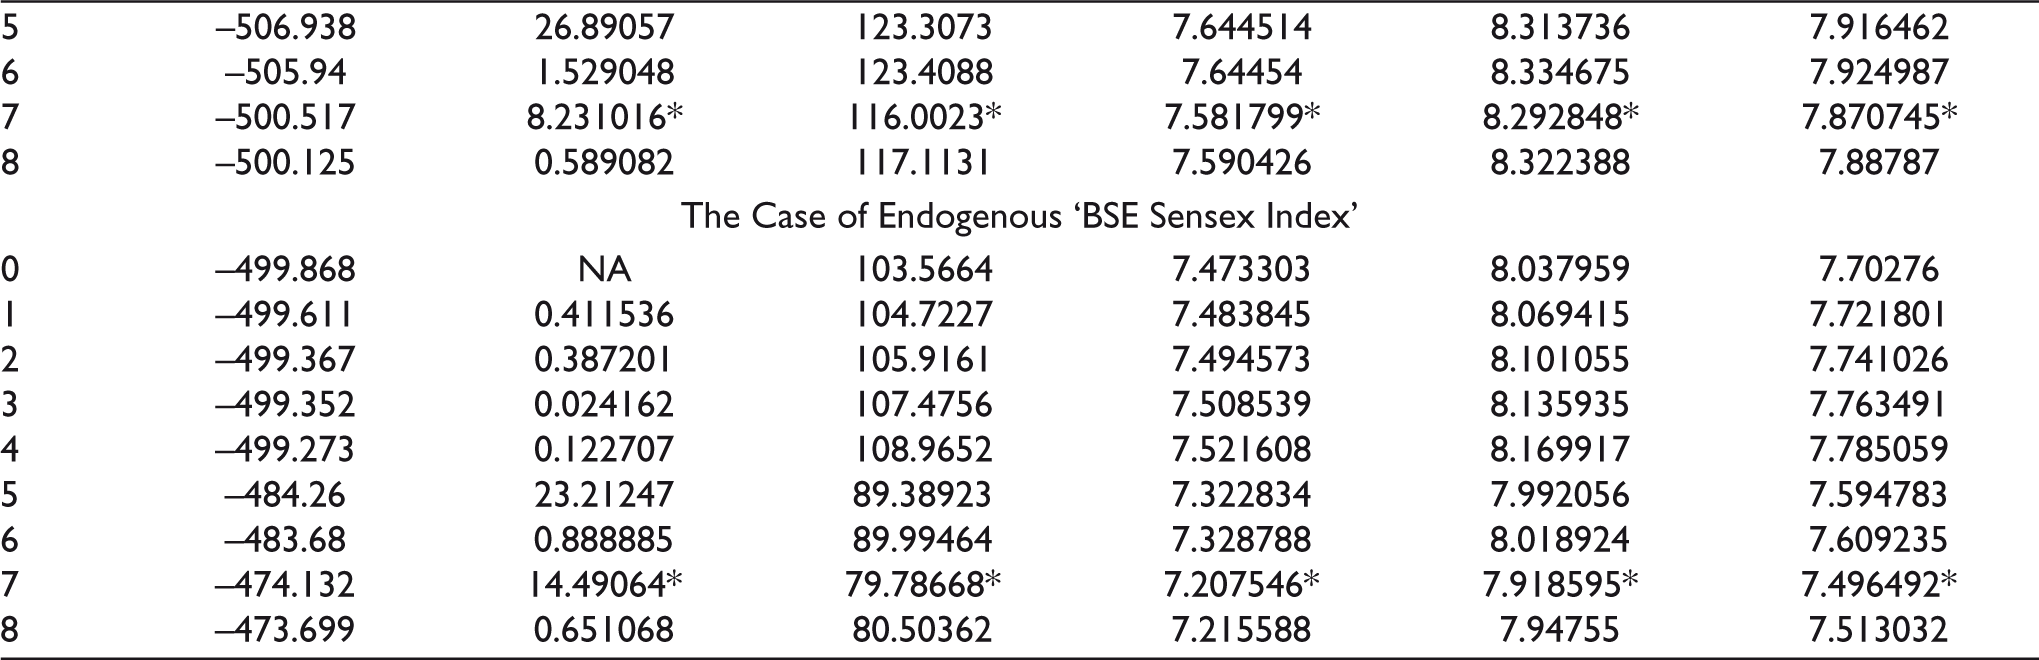
The Augmented Dicky Fuller tests of the unit roots for these variables with SVI data show mixed stationarity at their level data. These are mostly I(0), some are I(1), but none is I(2). Hence, in exploring investors’ attention cointegration with the ARDL model set-up, we need to identify the appropriate lag lengths (r, s) for the variables in the regression models. At Var Estimation with the SVI data for the endogenous market index variable(s) and the twenty-six regressor variables, we found that the methods of ‘LR’, ‘FPE’, ‘AIC’, ‘SC’ and ‘HQ’ suggest for use of seven lags (Table A2). In EViews, we set automatic lag selection for the variables if it increases the explanatory power in the regression model(s).
Empirical Procedure
Since our SVI data are of mixed stationarity, we cannot apply Johansen Cointegration test and Granger causality test to explore cointegration amongst the variables. Here, the bound-test approach along with the ARDL models is the appropriate methodology (Pesaran et al., 2001). In examining the short-run and long-run attention coordination dynamics, we follow a three-step procedure.
In Step 1, we use the ARDL (r, s) setup with the SVI data for the NSE Nifty index (or BSE Sensex index) at its maximum lag-length of r and that of the independent variable/s at s (r ≤ 7; s = 1). Since the SVI data sets are stretched over five months’ time length, in identifying the significant F-bound test statistics, we use the constant option, avoid the trend, and include variables at α ≤ 0.50 only. We use the automatic specification at the AIC method for lag-lengths (r, s) if its adj. R2 value is greater than that at fixed specification for r ≤ 7 and s = 1 but with its significant long-distant endogenous lag effect(s).
In Step 2, we run the coefficient diagnosis tests and identify a parsimonious model. We use the Wald test and remove the weak regressors at α ≥ 0.50 but resist if its lag variable is significant at α ≤ 0.50. We revise the ARDL model in detailed linear specification and enhance its adj. R2 values. We report the parsimonious ARDL model. If we identify residual heteroskedasticity, we move to Step 3.
In Step 3, we use the GARCH (v,u) model with ARCH (u) and GARCH (v) effects. We derive the final results at (1,1) or at higher orders.
Empirical Hypotheses
With the sets of SVI data for the independent and dependent attention search keywords, we put forward the following two null hypotheses H01 and H02 against the alternative hypotheses H11 and H12 respectively for the ‘NSE Nifty market index’ and ‘BSE Sensex market index’.
Investors’ attention to the socio-economic search has no relationship with their search attention to ‘NSE Nifty index’.
Investors’ attention to the socio-economic search has impacts of dynamic attention cointegration with their search attention to ‘NSE Nifty index’.
Investors’ attention to the socio-economic search has no relationship with their search attention to ‘BSE Sensex index’.
Investors’ attention to the socio-economic search has impacts of dynamic attention cointegration with their search attention to ‘BSE Sensex index’.
Results and Findings
This section depicts the socio-economic attention impacts in the unrestricted SRF of the ARDL model, in the conditional LRF, in the conditional ECF, and the parsimonious GARCH model, respectively in Tables 1–4 and in Tables 5–8 with the ‘NSE Nifty index’ and ‘BSE Sensex index’, firstly the former one and then, the later one. Before we report the findings, let us stepwise elaborate the critical diagnostic tests involved in the Tables to make the findings reader friendly. It follows the methodological steps mentioned in the earlier section.
Step 1: In the unrestricted SRF of the ARDL model, we look into the values of the regression R2 and adj. R2, the F-statistic and its probability, and the DW statistics respectively to know the model’s explanatory power, its goodness of fit, and the randomness of its residual errors. The ARDL model is set to choose the best model based on the minimum value for AIC. The system uses the parameters of SER and SSR for generating the model’s F-statistics value. The statistics of LogL, MDV, SDDV, SIC and HQIC are the additional information for the readers. Besides, the CUSUM of residuals and CUSUM of square residuals show the stability diagnosis of the ARDL model. We diagnose the residual normality with the residual kurtosis value along with the Jarque–Bera normality test statistic along with its level of significance.
Step 2: In the conditional LRF of the ARDL model, we have the F-bound F-test for the presence of long-run cointegration at different levels of significance.
Step 3: In the conditional ECF of the ARDL model, we have the F-bound F-test along with the summary statistics as mentioned in Steps 2 and 1, respectively.
Step 4: We diagnose the presence of heteroskedasticity and serial correlation respectively with the Breusch-Pagan-Godfrey heteroskedasticity test and the Breusch-Godfrey Serial Correlation LM test at both first and second lags for the ARDL model.
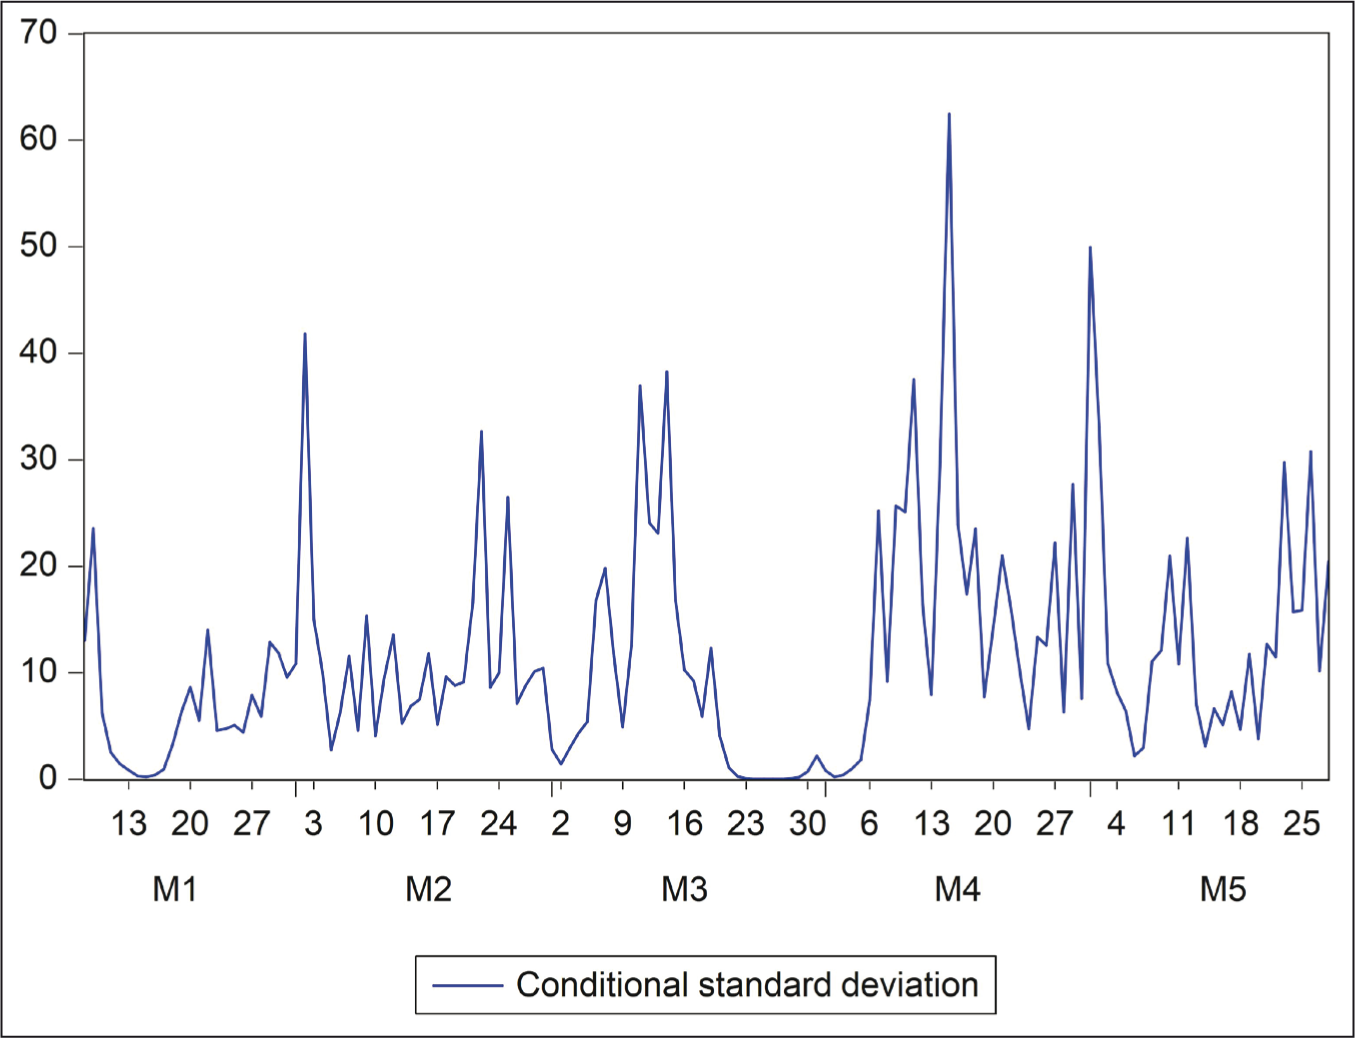
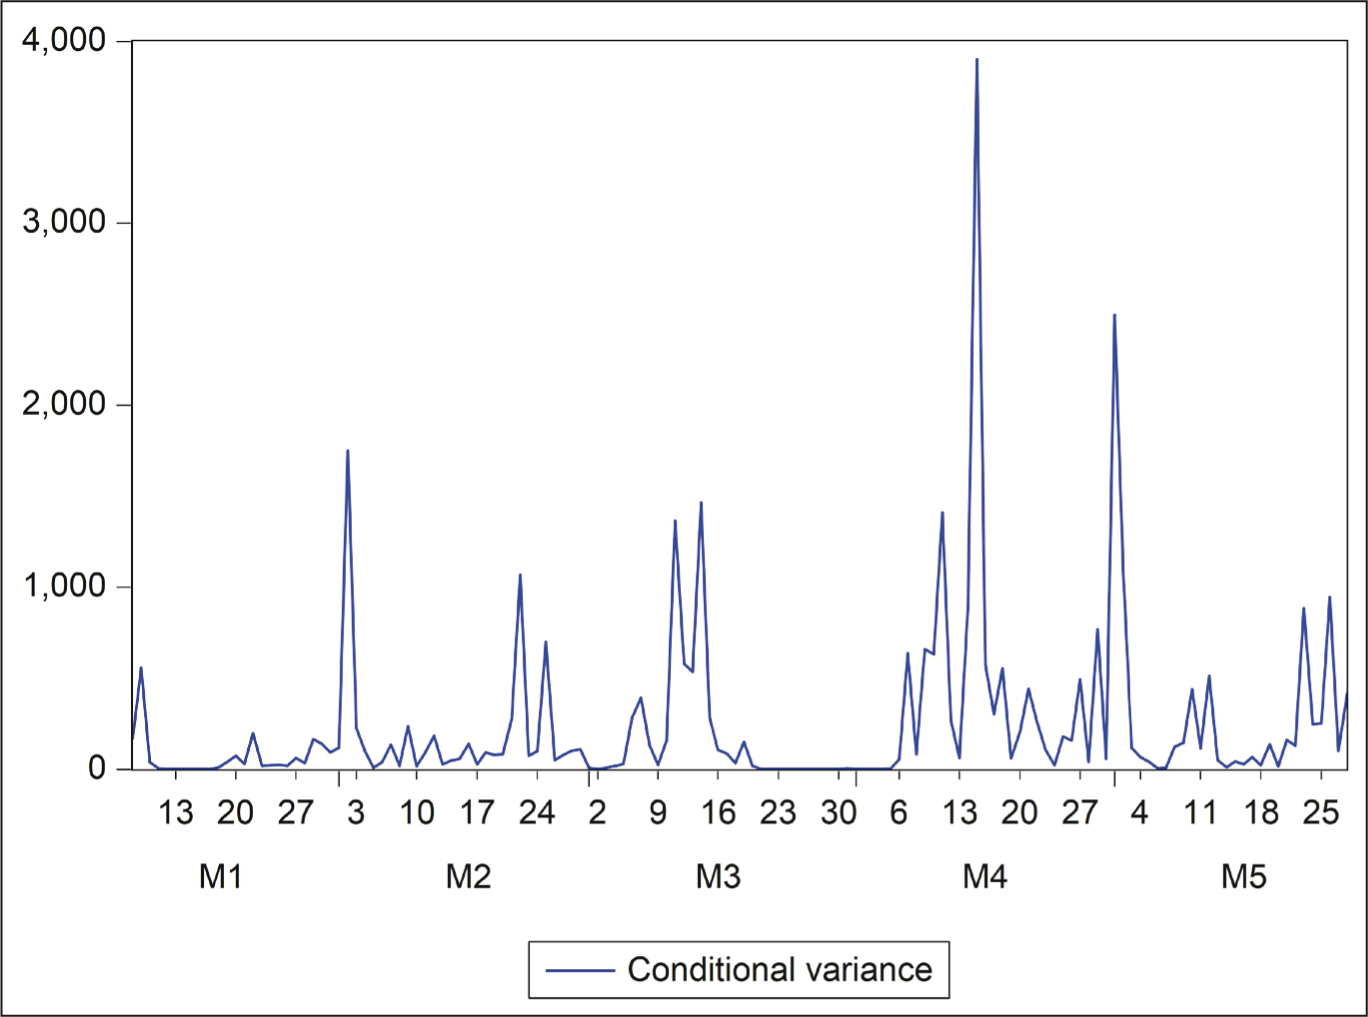
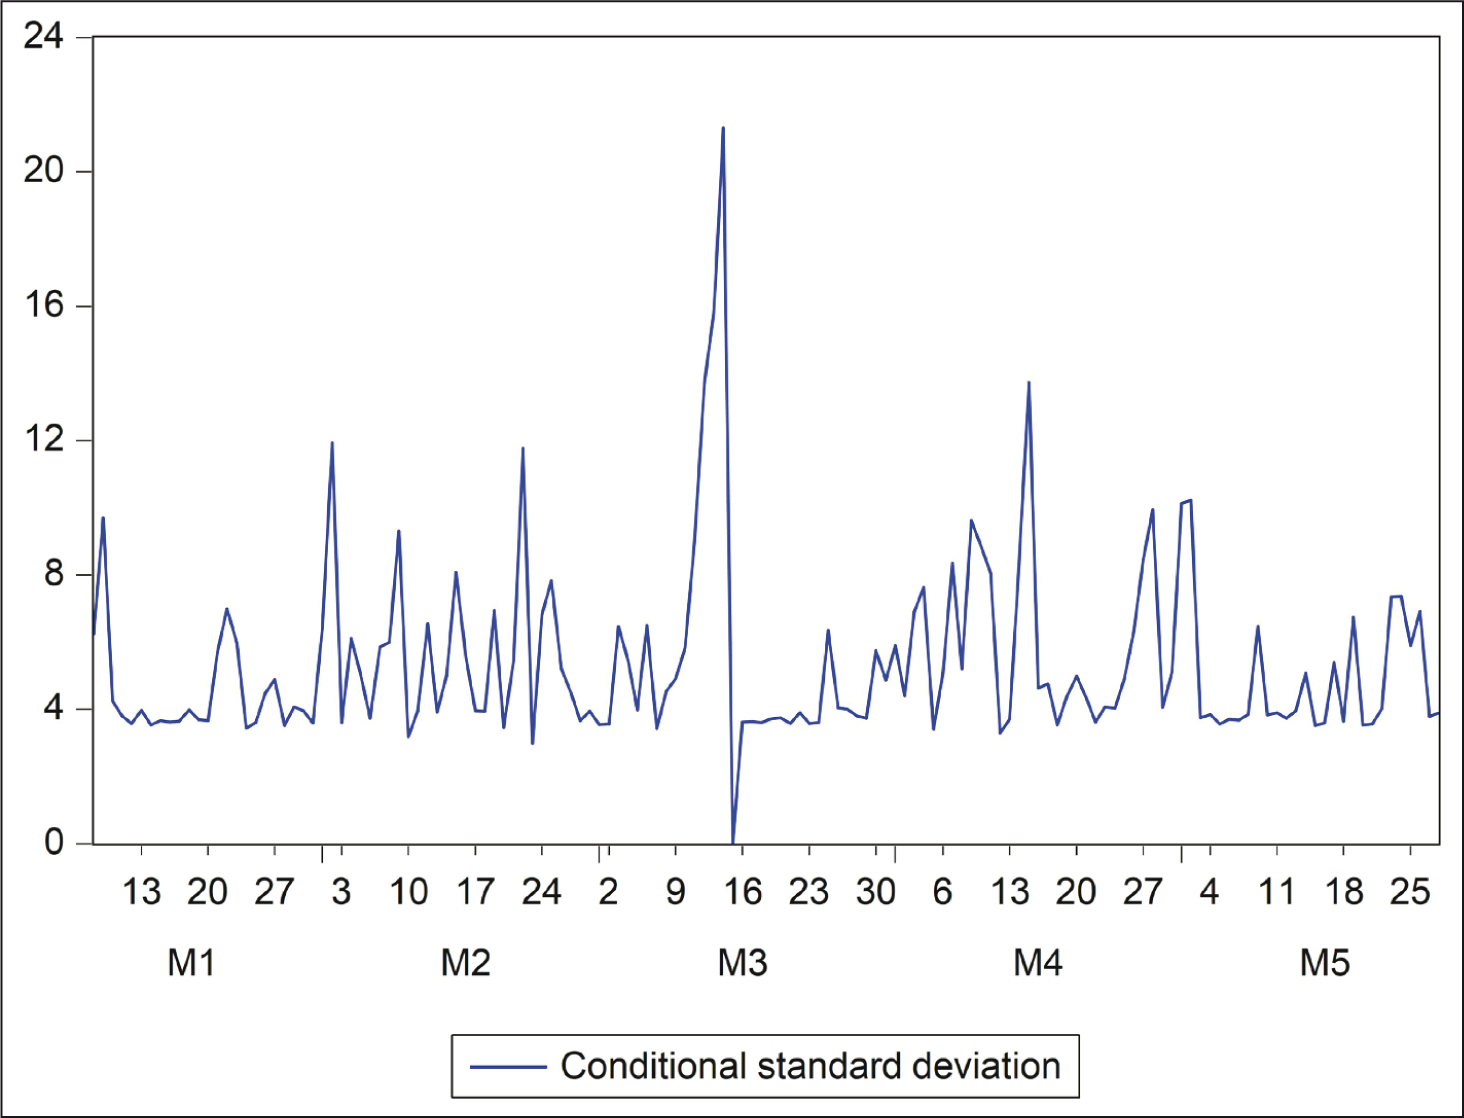
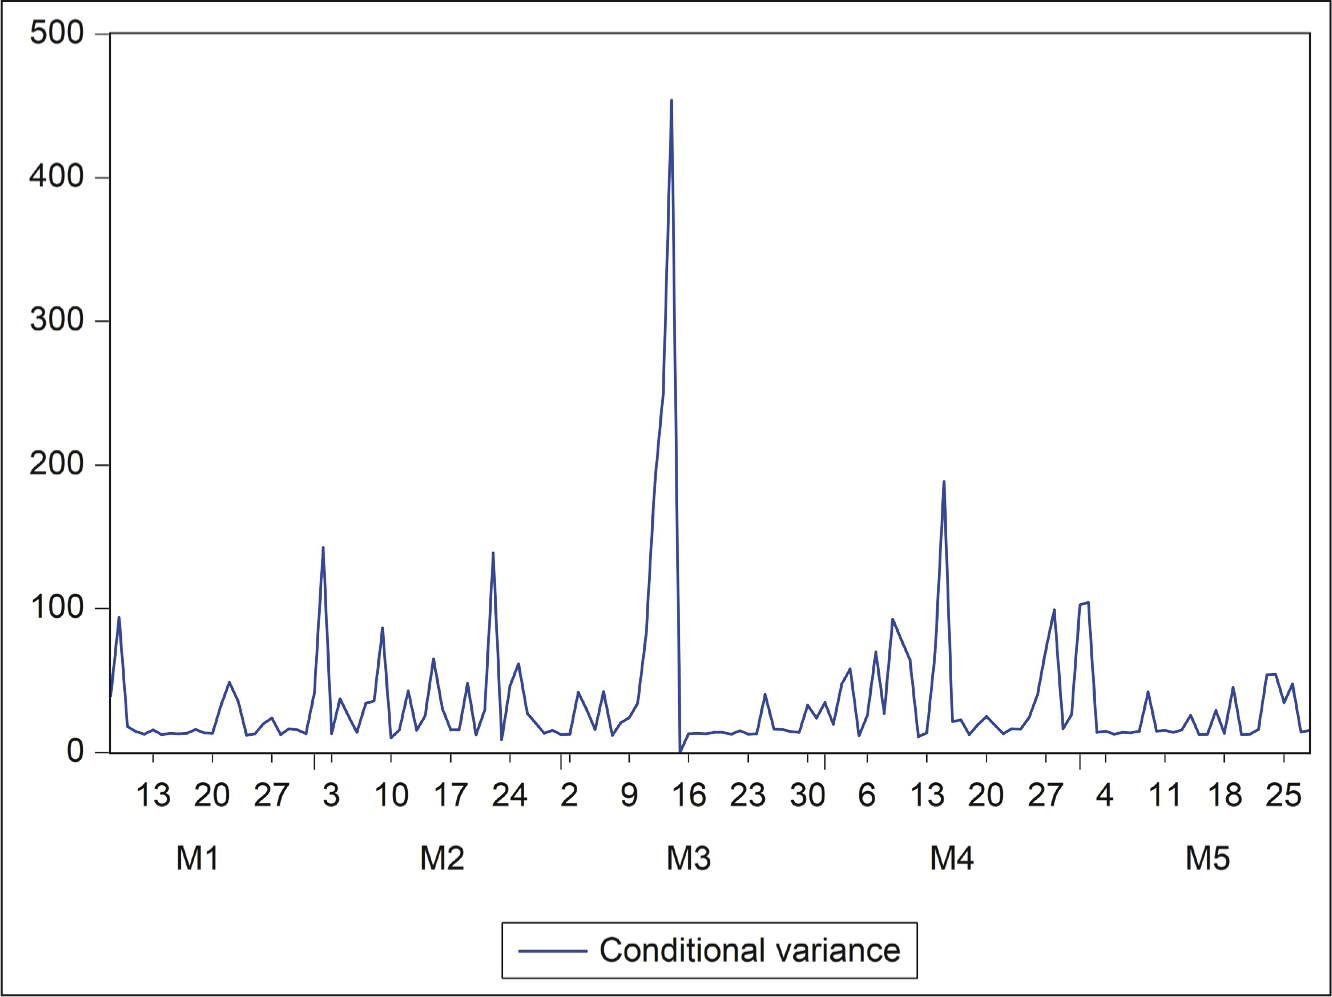
Step 5: In the GARCH-X augmentation of the ARDL model, we have the summary statistics as in Step 1. We diagnose the ARCH and GARCH effects with the variance equation. We show the GARCH effects with the graphs for conditional standard deviation and conditional variance of the GARCH-X model. We diagnose the residual normality with the residual kurtosis value and the Jarque–Bera normality test. We diagnose heteroskedasticity with the ARCH LM heteroskedasticity test at both first and second lags.
Attention Coordination at NSE
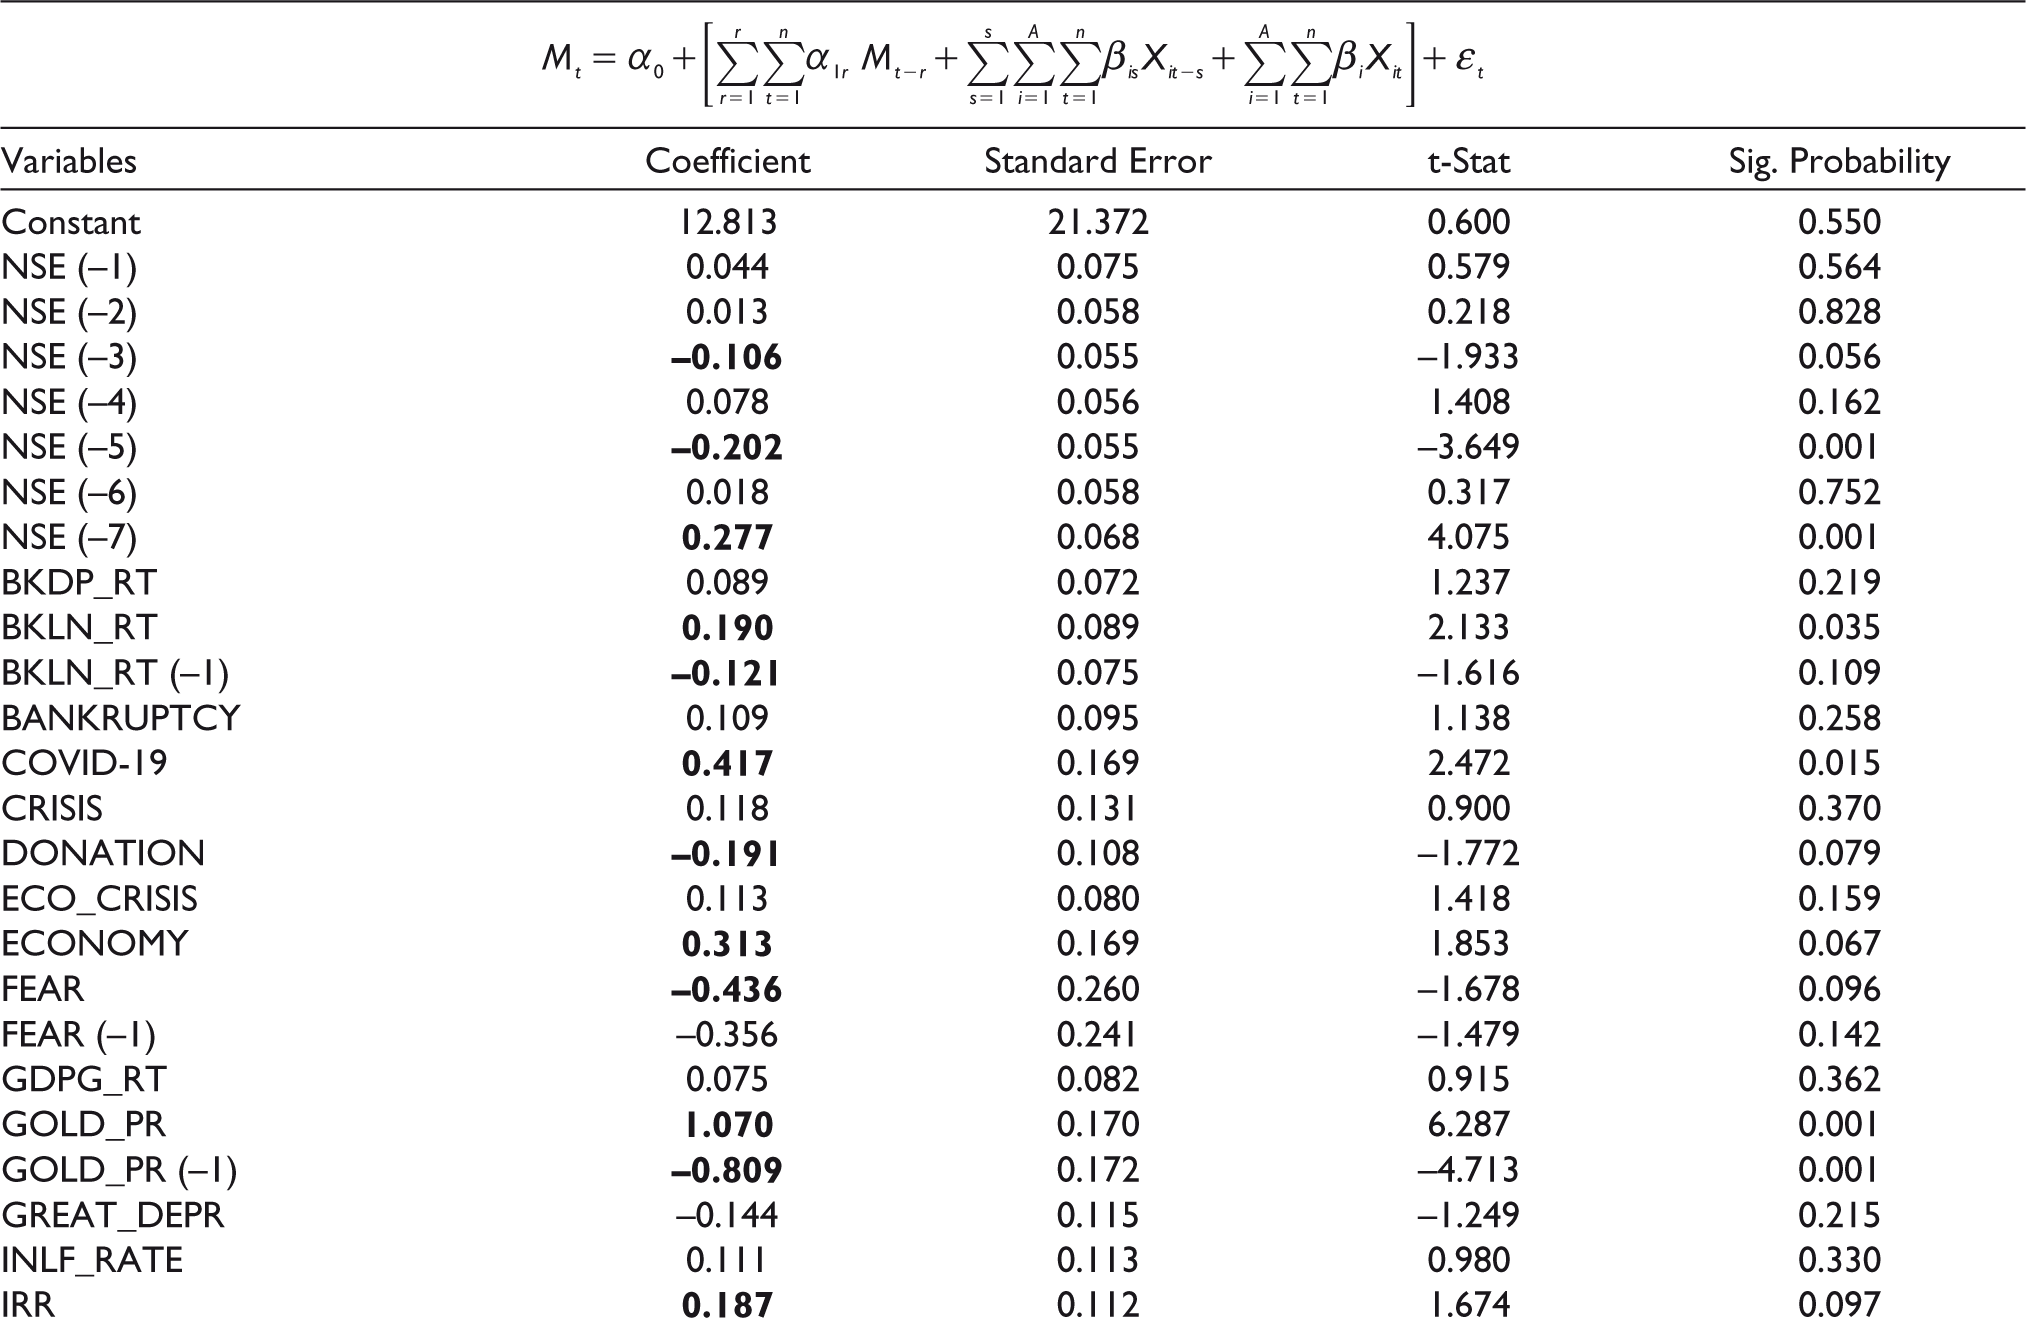
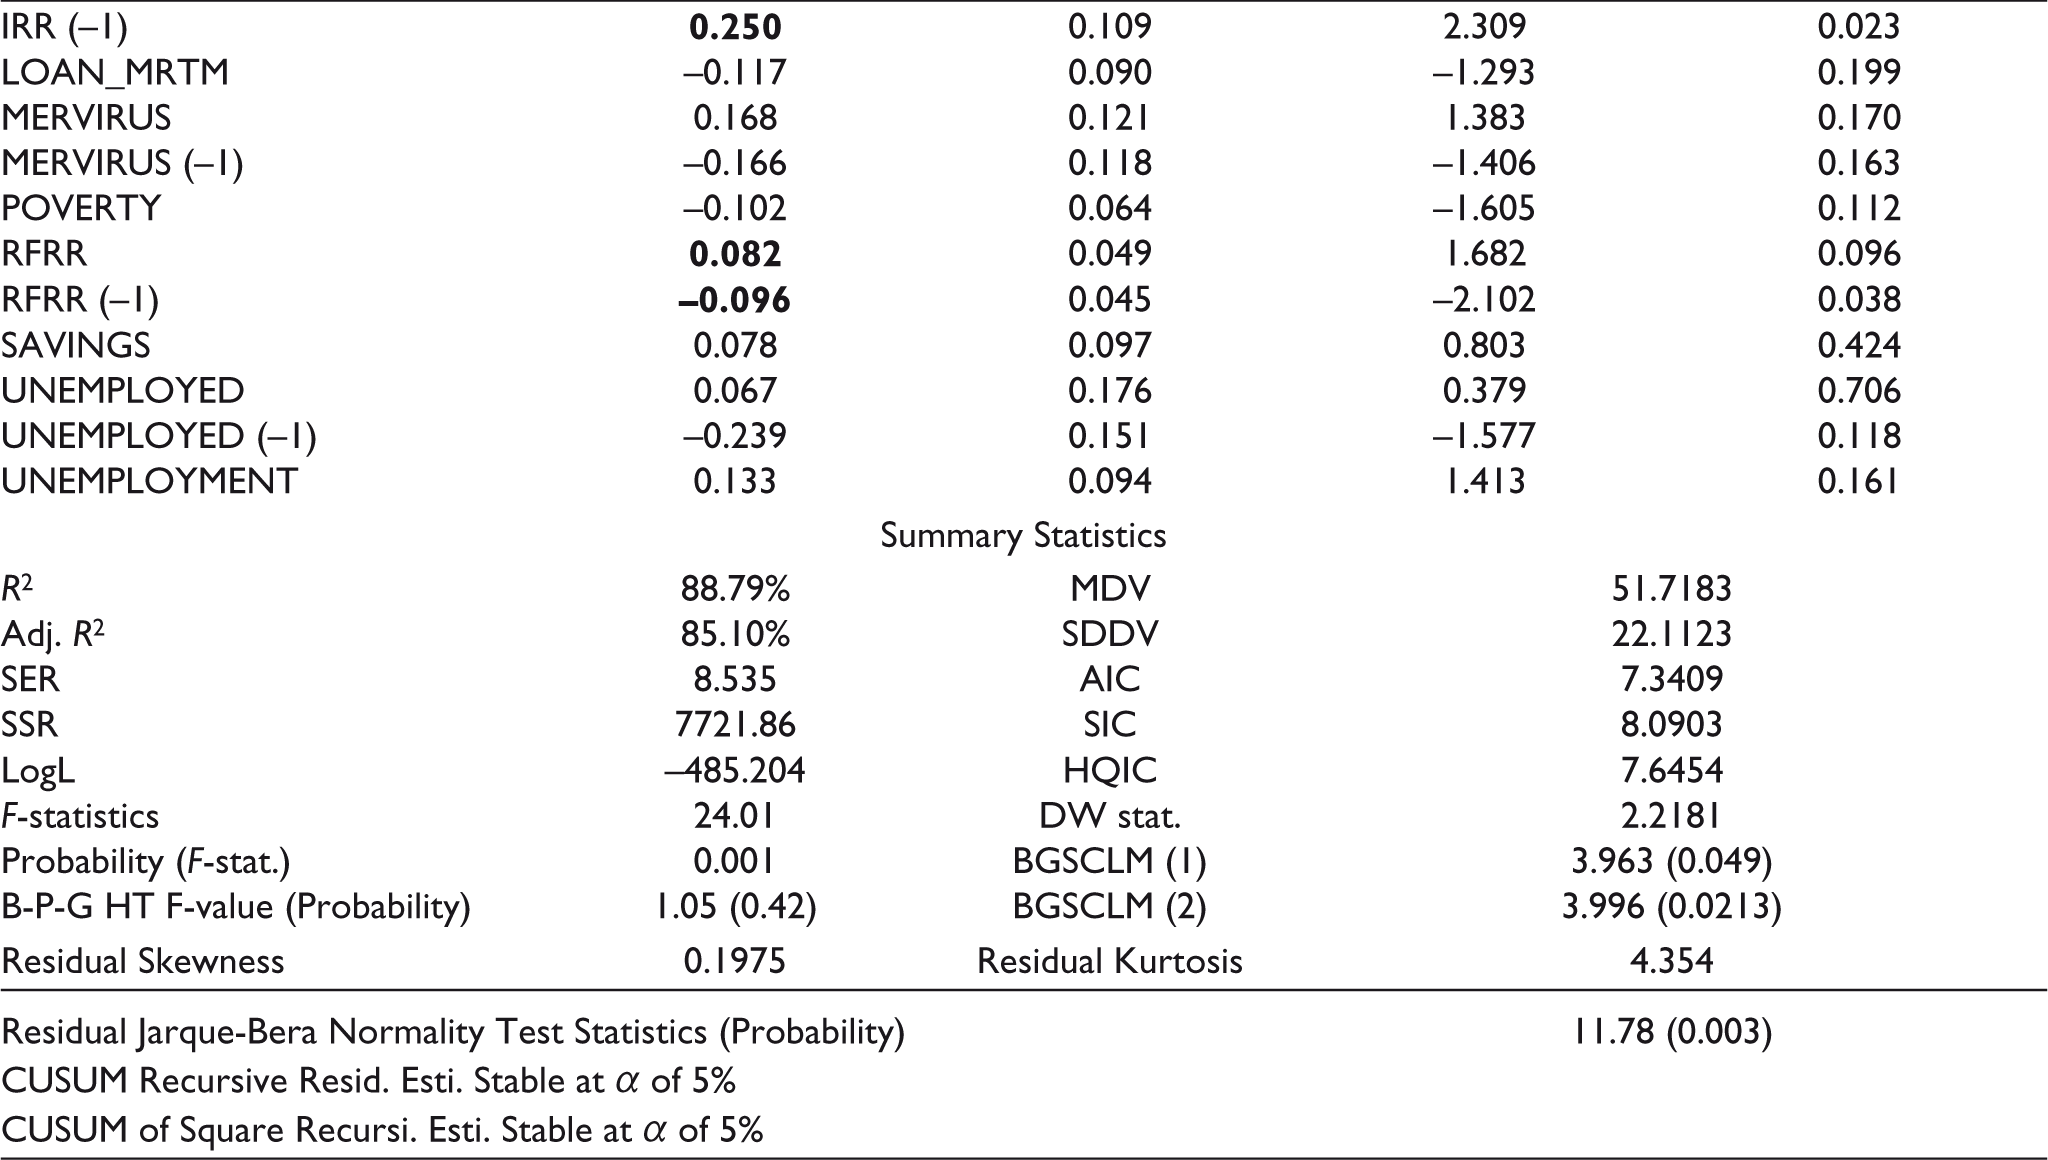
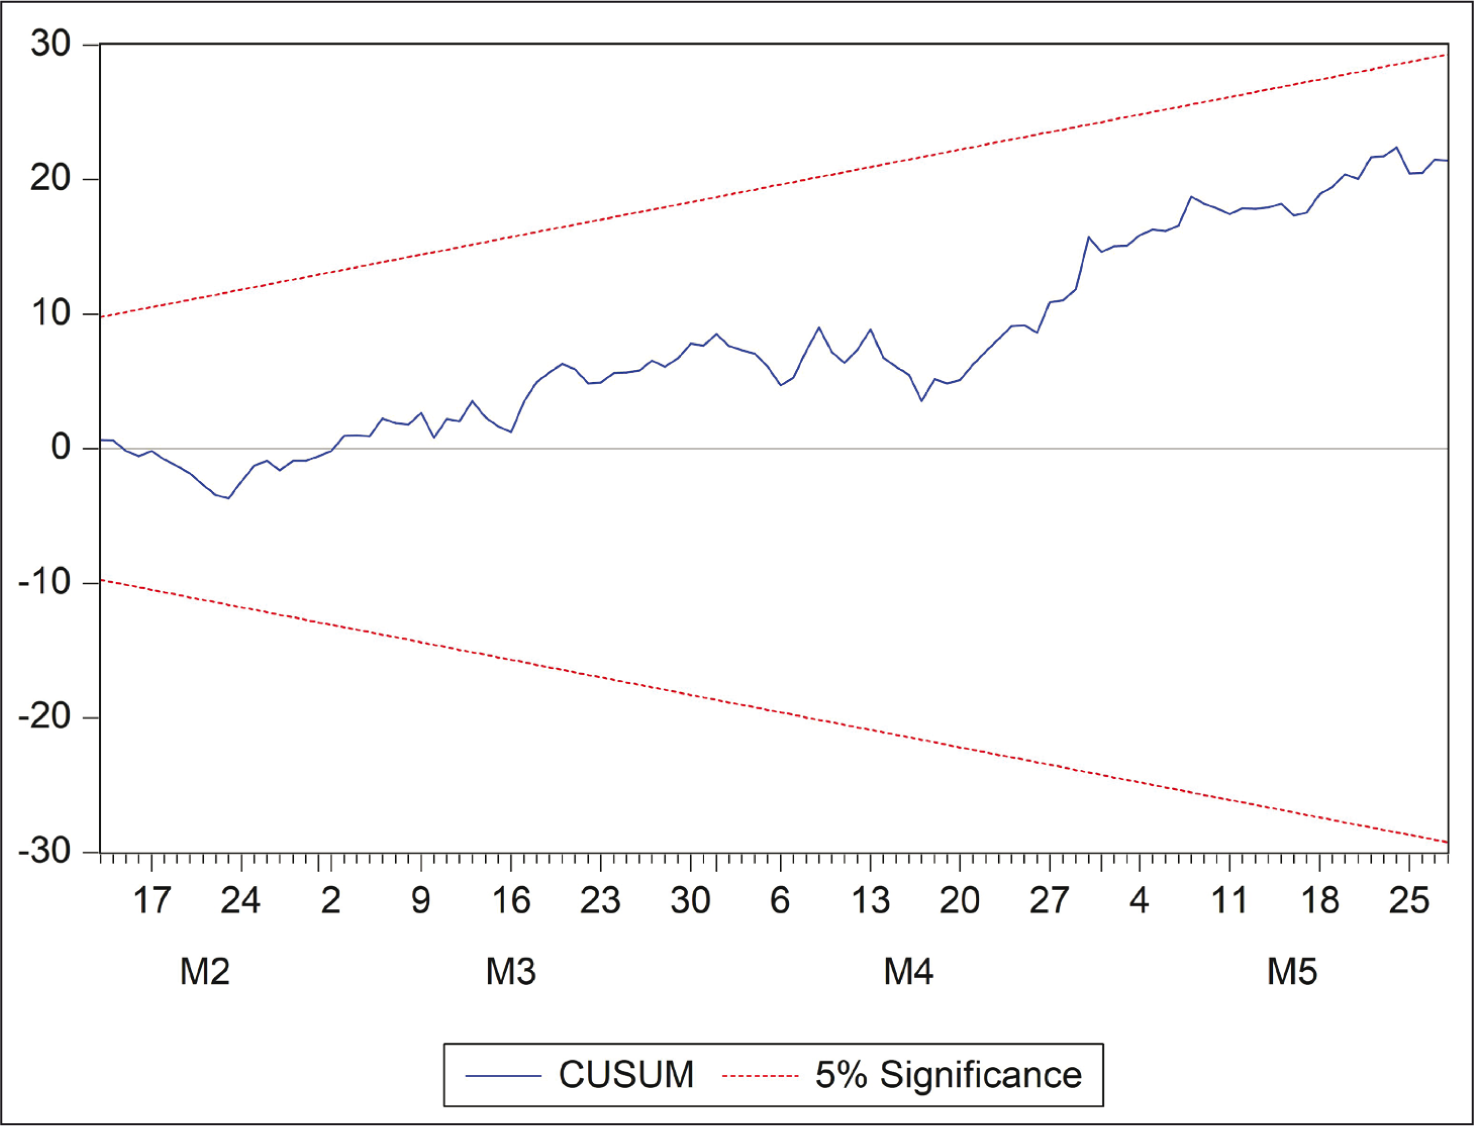
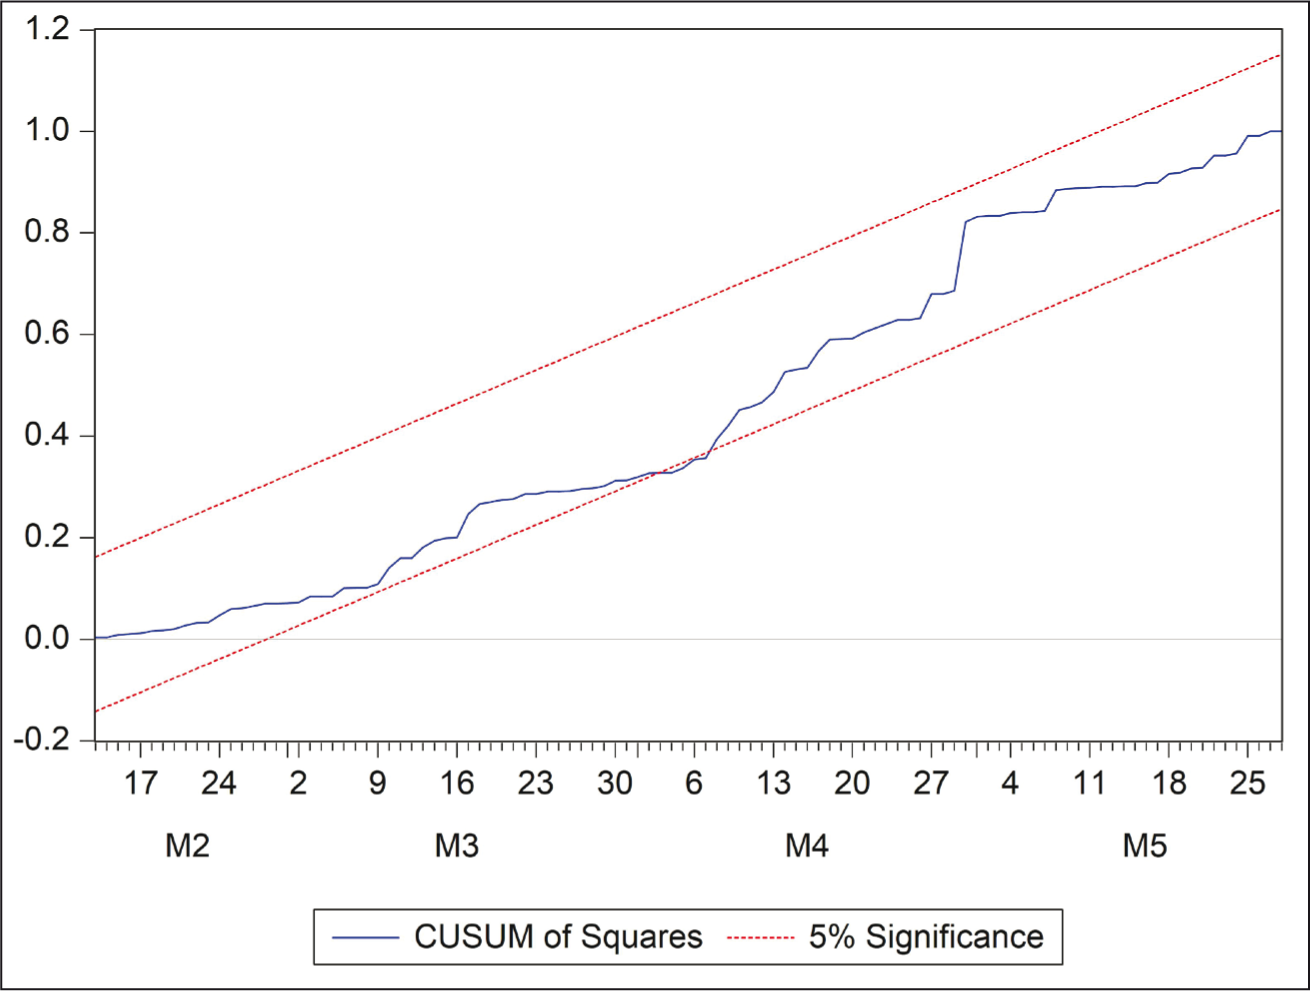
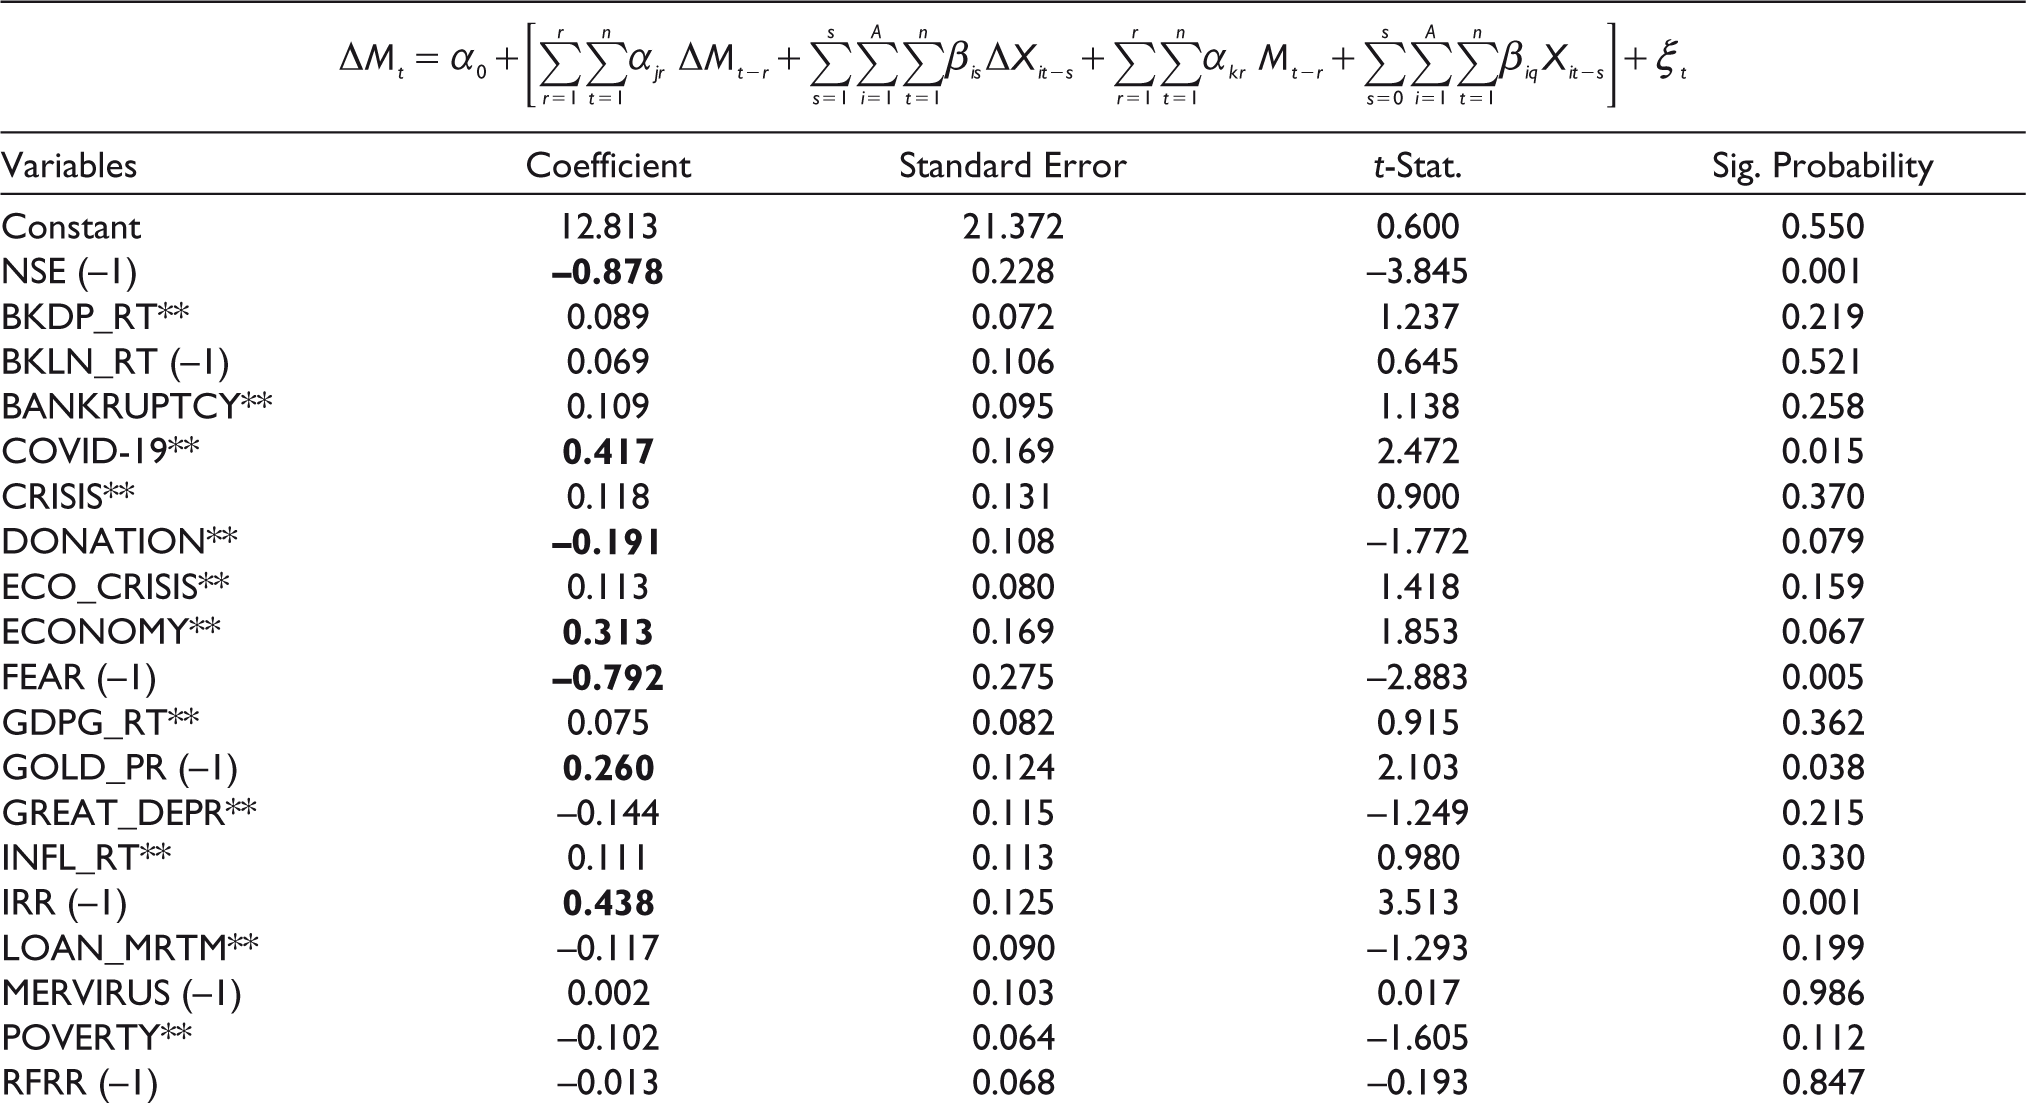
In Table 1, we find that socio-economic attention keywords ‘bank loan rate’, ‘COVID-19’, ‘economy’, ‘gold price’, ‘internal rate of return’ and ‘risk-free rate of return’ (‘fear’ and ‘donation’)—these have strong significant positive (negative) impacts on the search attention keyword ‘NSE Nifty index’, while at their first lags, there is significantly positive (negative) impact(s) for ‘internal rate of return’ (‘gold price’ and ‘risk-free rate of return’). The coefficients for the socio-economic attention keywords stated above are robust at α of 5% for ‘bank loan rate’, ‘COVID-19’, ‘gold price’, ‘risk-free rate of return’, and first lag of ‘gold price’ and at an α value of 10% for the other instances. The endogenous variable ‘NSE Nifty index’ has significantly positive (negative) impact(s) at its seventh lag (third and fifth lags), while the distant two lags are robustly significant at α of 0.1%. The above-stated results suggest for the presence of a sound cointegration amongst the socio-economic attention keywords, that result in attention effects on ‘NSE Nifty index’. These confirm that the unrestricted ARDL model has unbiased coefficients with explanatory power of 85.10% in terms of Adj. R2 value and a good fit of its model at F-value of 24.01 significant at α of 0.1%. In Figures 1 and 2, the stability diagnosis tests at the CUSUM of residuals and CUSUM of square residuals show that the model estimates are stable. The model is free from heteroskedasticity problem, while its residuals are correlated and non-normal in distributions. With the augmented GARCH-X models, however, we latter confirm that even if the coefficients are not the best linear unbiased and efficient (BLUE) estimates but these are the converging ones.
Socio-economic Attention Impacts on the NSE Nifty in the Unrestricted ARDL. Model
We now discuss the results in the conditional LRF of the ARDL model along with the bound-test results. Table 2 shows that the F-Bound test statistic value of 3.255 is significant at α of 5%. That is, there is a presence of significant relationship of attention cointegration for the socio-economic keywords influencing attention to ‘NSE Nifty index’. Amongst the keywords, ‘bank loan rate’, ‘gold price’, ‘internal rate of return’, and ‘risk-free rate of return’ (‘fear’) have positively (negatively) significant short-run effects while ‘COVID-19’ and ‘economy’ (‘donation’) have positively (negatively) significant overall impacts. Nonetheless, the endogenous variable ‘NSE Nifty index’ has both long-run and short-run strongly significant impacts at its different lags while attention to ‘gold price’ and ‘internal rate of return’ (‘fear’) has positively (negatively) significant and strong long-run attention impacts. These confirm cointegrating impacts of socio-economic attention keywords on the ‘NSE Nifty index’.
Socio-economic Attention Impacts on NSE Nifty in Conditional LRF for ARDL Model
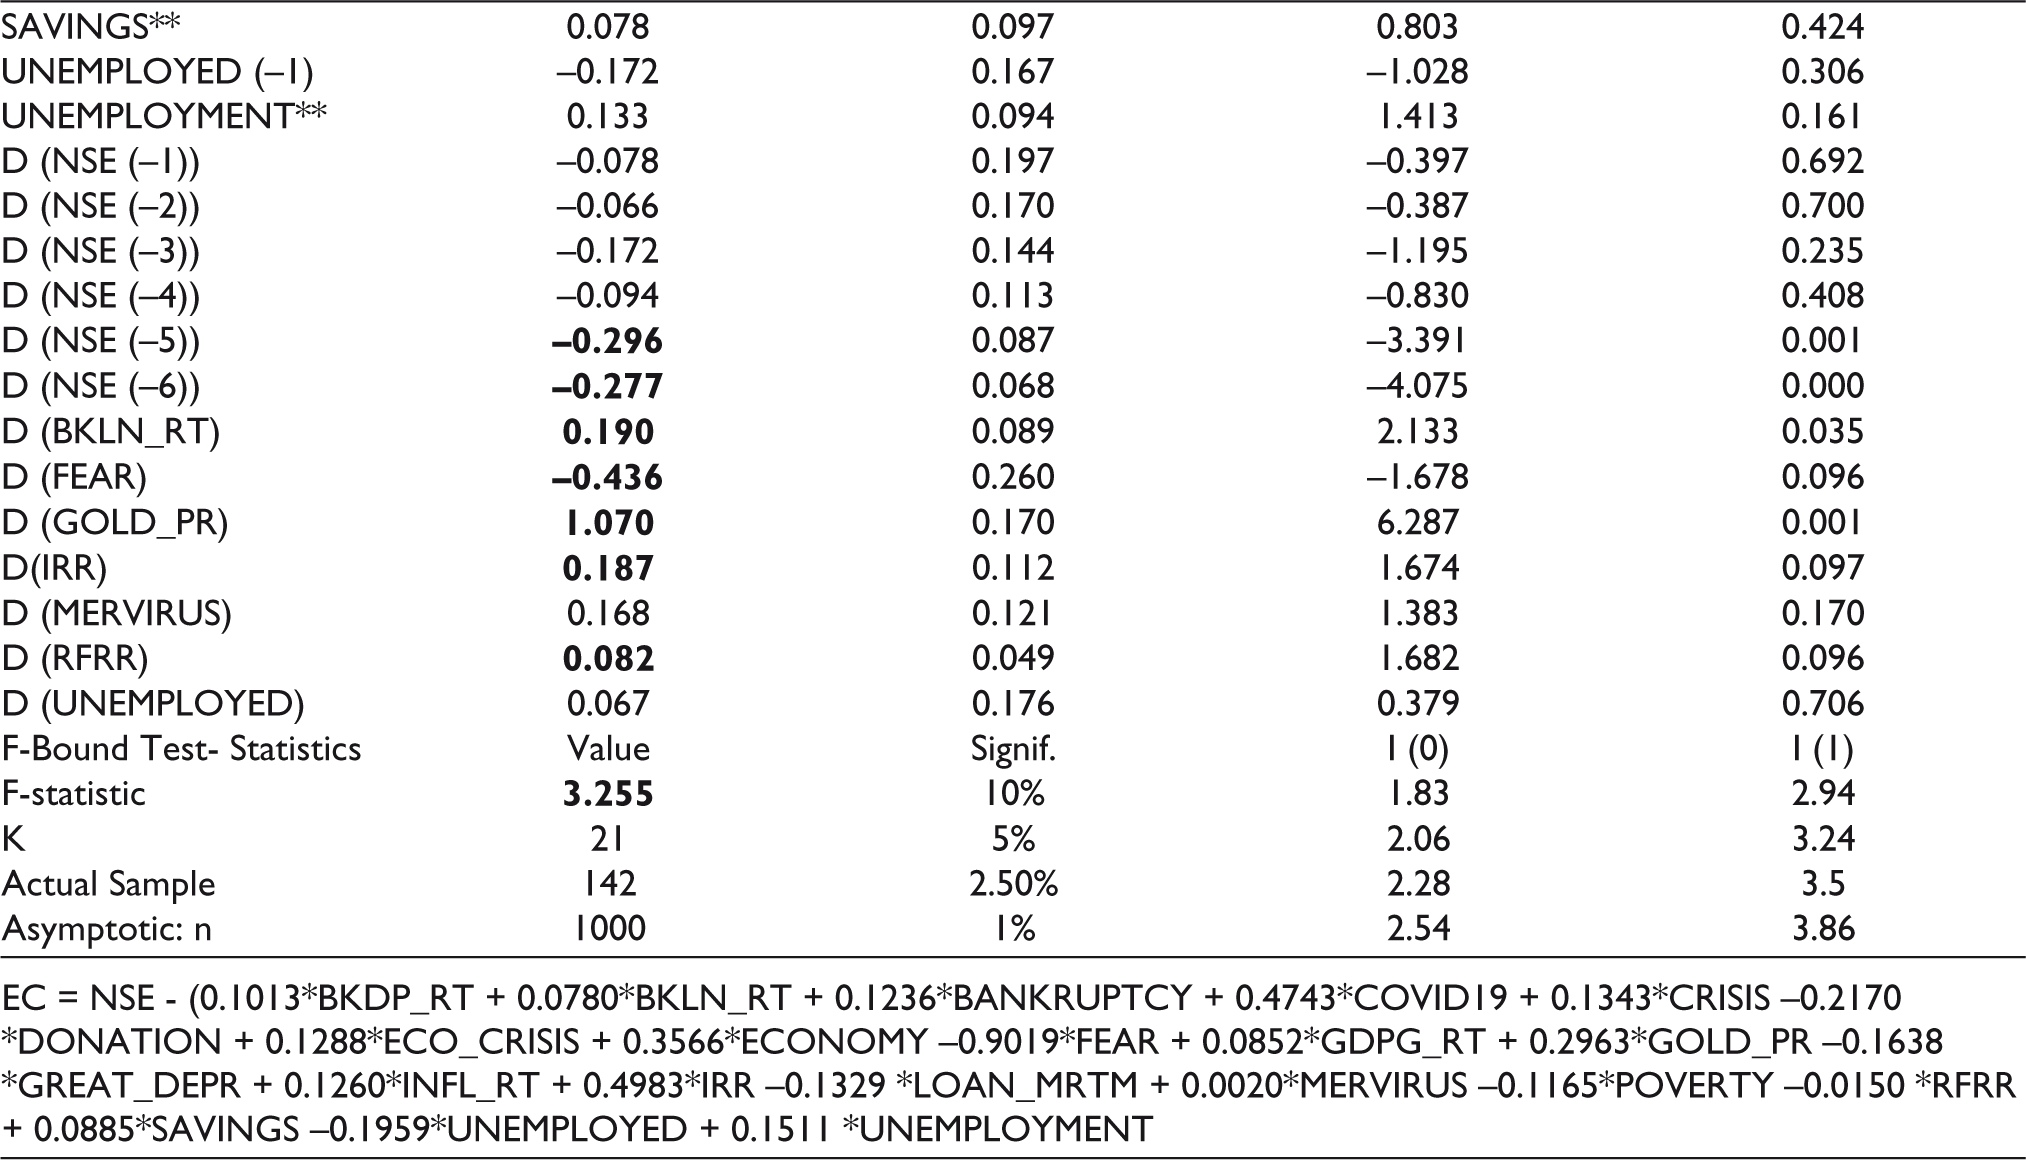
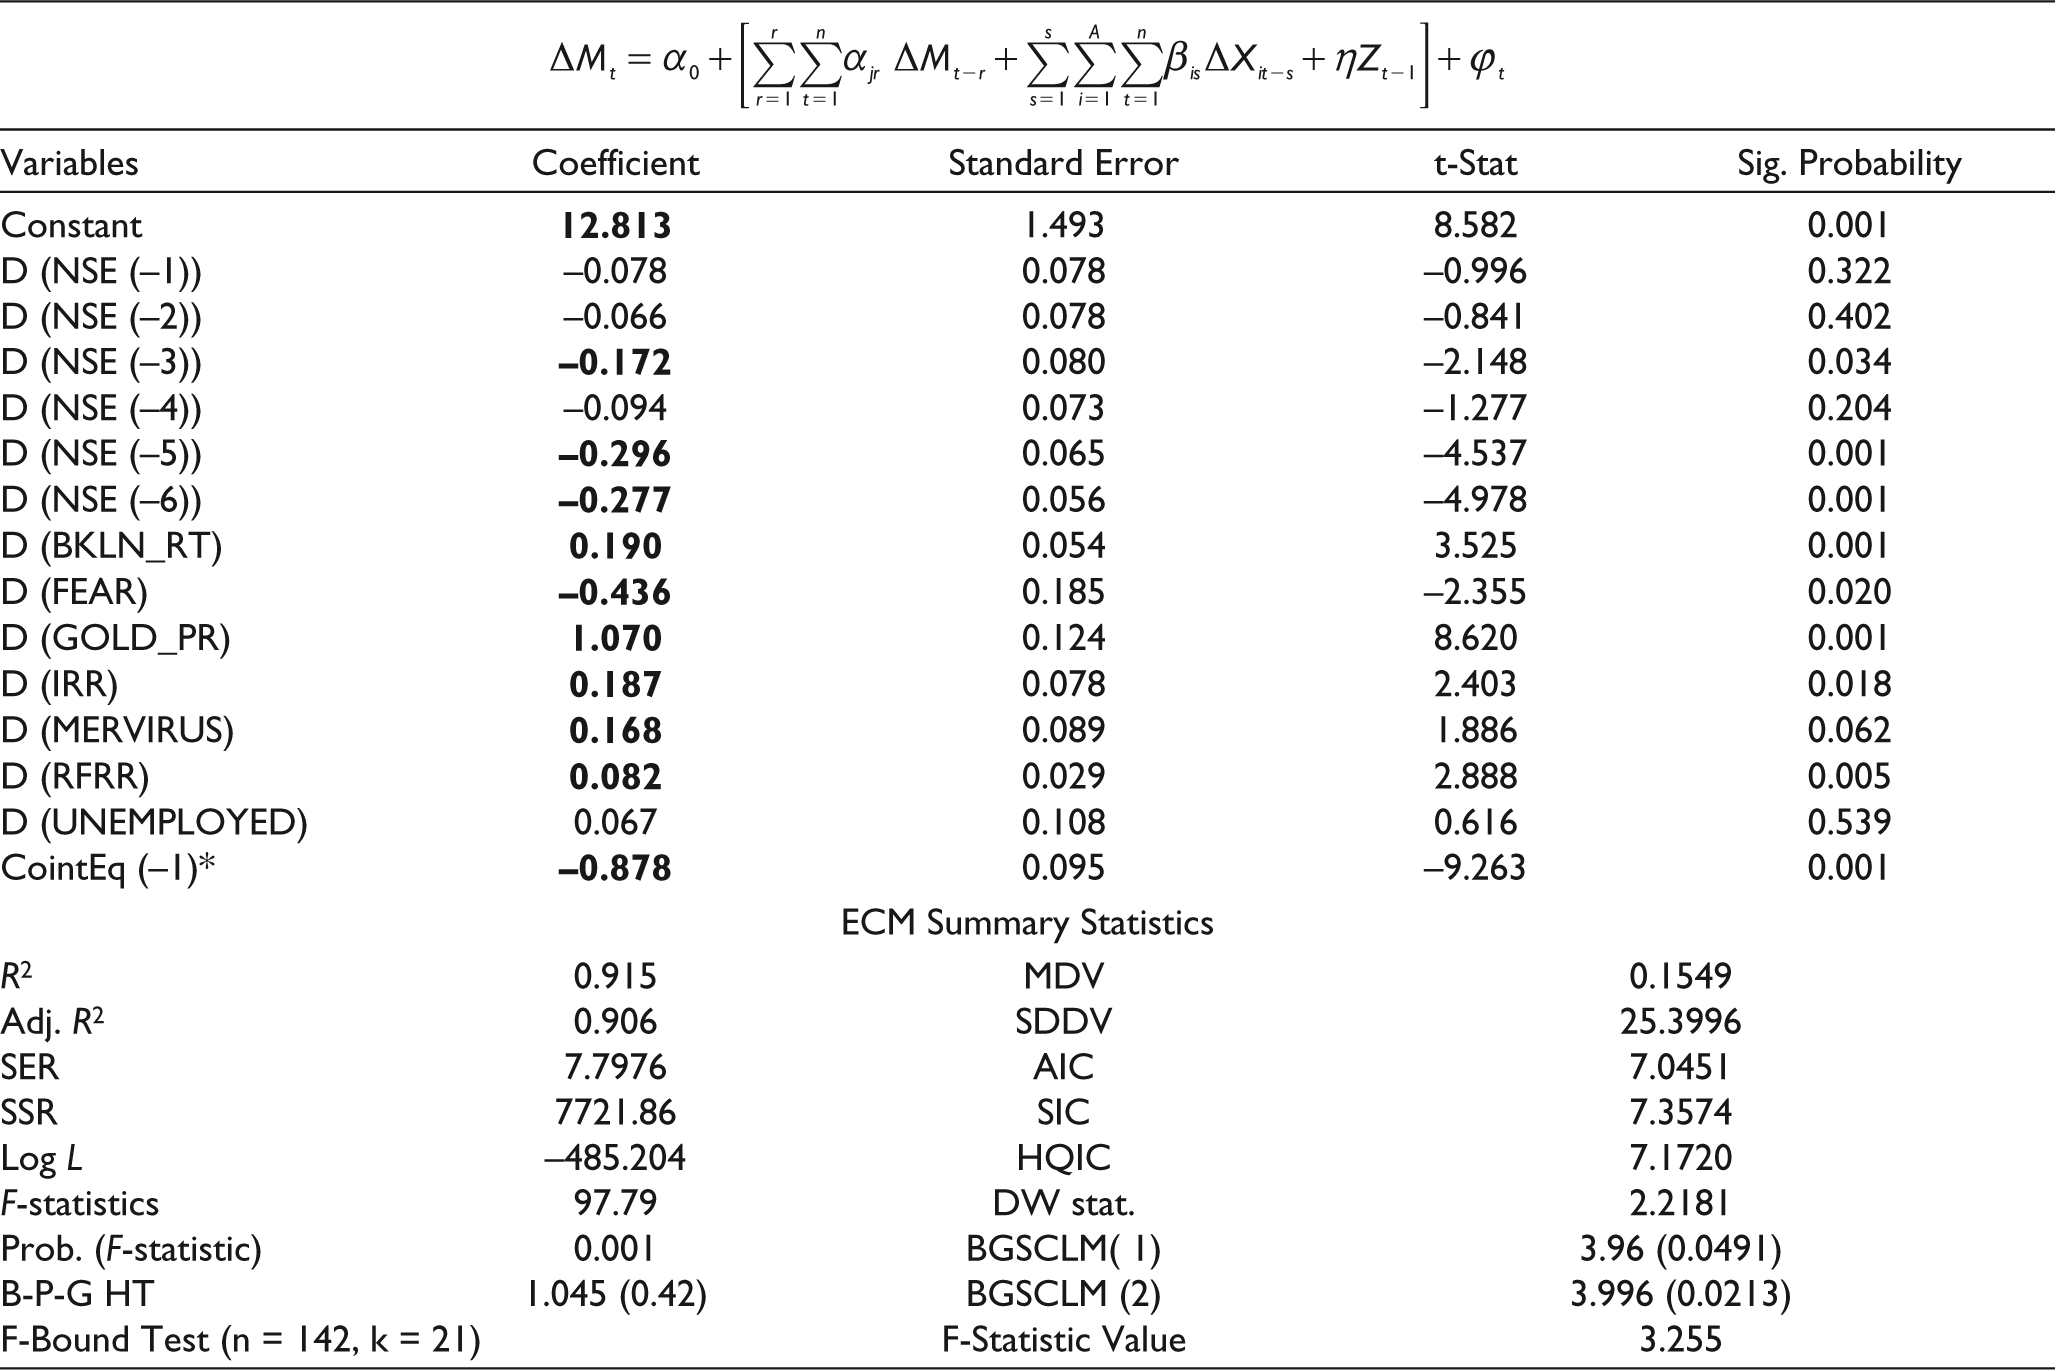
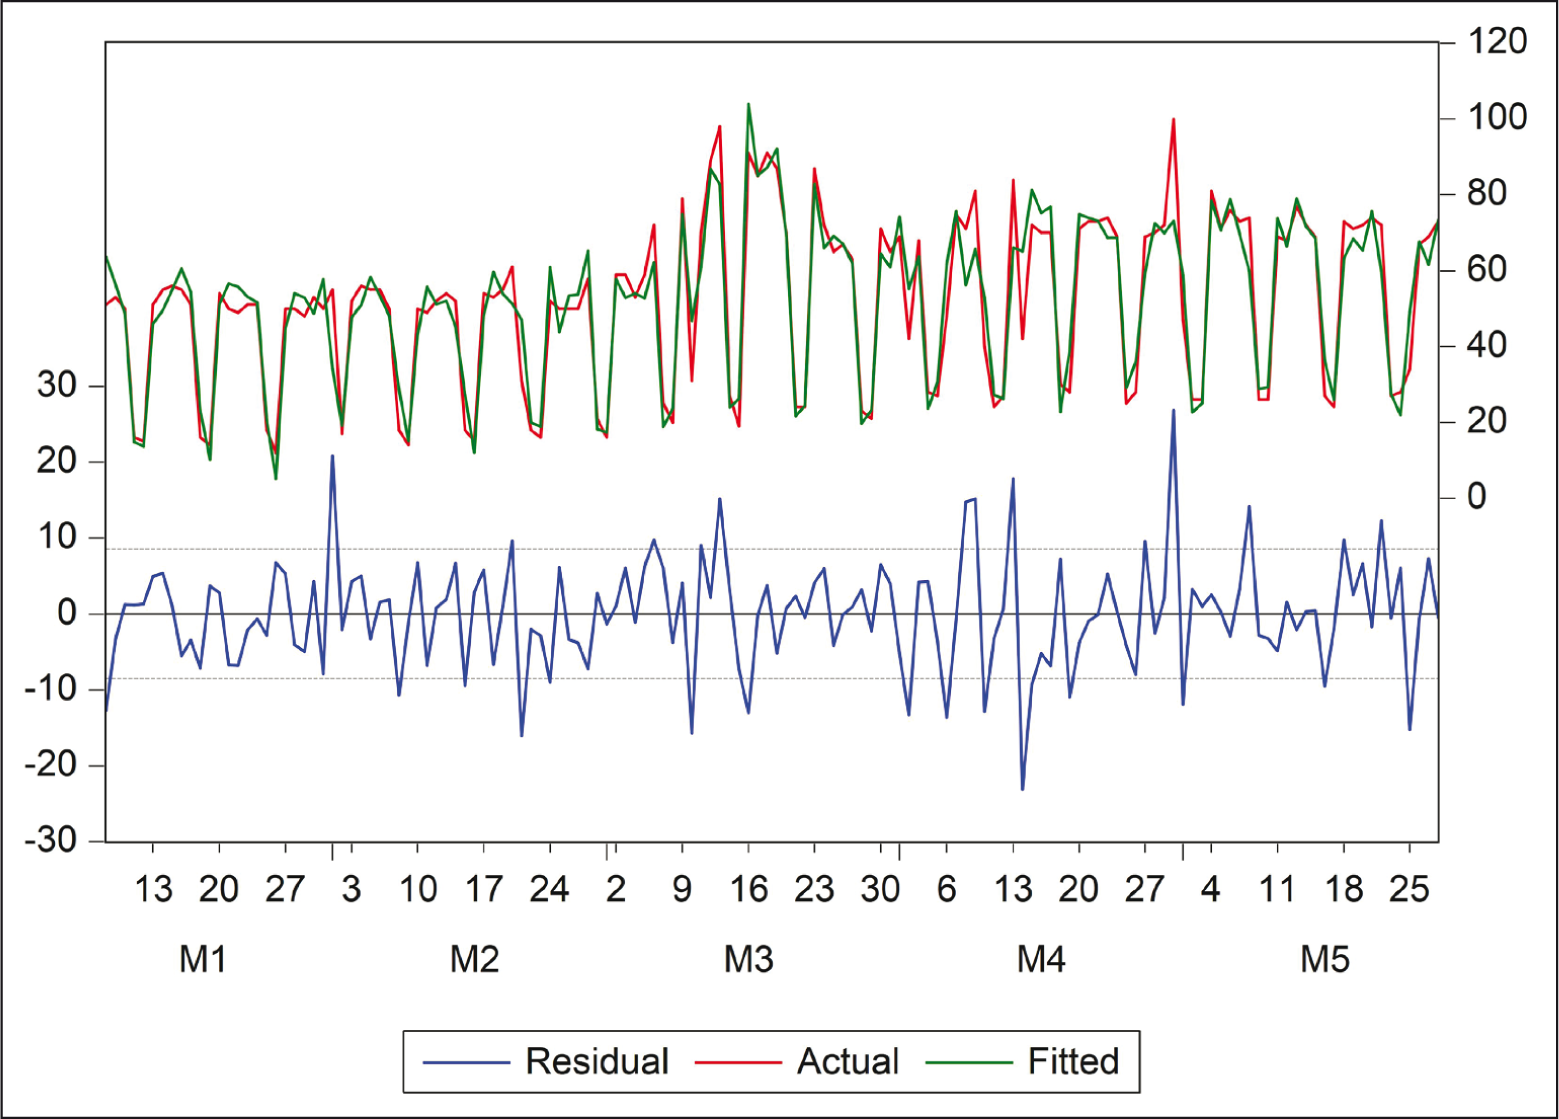
The said cointegrating relationship is also robust in the conditional ECF of the ARDL model. In Table 3, we document a negatively significant coefficient value of –0.878 suggesting for a high speed of adjustment towards the long-run attention equilibrium. Amongst the short-run attention impacts, keywords ‘bank loan rate’, ‘gold price’, ‘internal rate of return’, ‘MERVIRUS’, and ‘risk-free rate of return’ have positively significant attention impacts while ‘fear’ has negatively significant attention impact on ‘NSE Nifty index’. The ECF has a high explanatory power of about 90.6% in terms of adj. R2 value. The coefficients in the conditional ECF are also unbiased but converging to be efficient with exceptions for non-normal and correlated regression residuals. The residual, actual, and fitted values for these three ARDL model specifications, as showed in Figure 3, suggest that the ARDL residuals are trapped into a few pockets and these become meaningful once we work with the same in the GARCH-X model.
Socio-economic Attention Impacts on NSE Nifty in Conditional ECF of ARDL Model
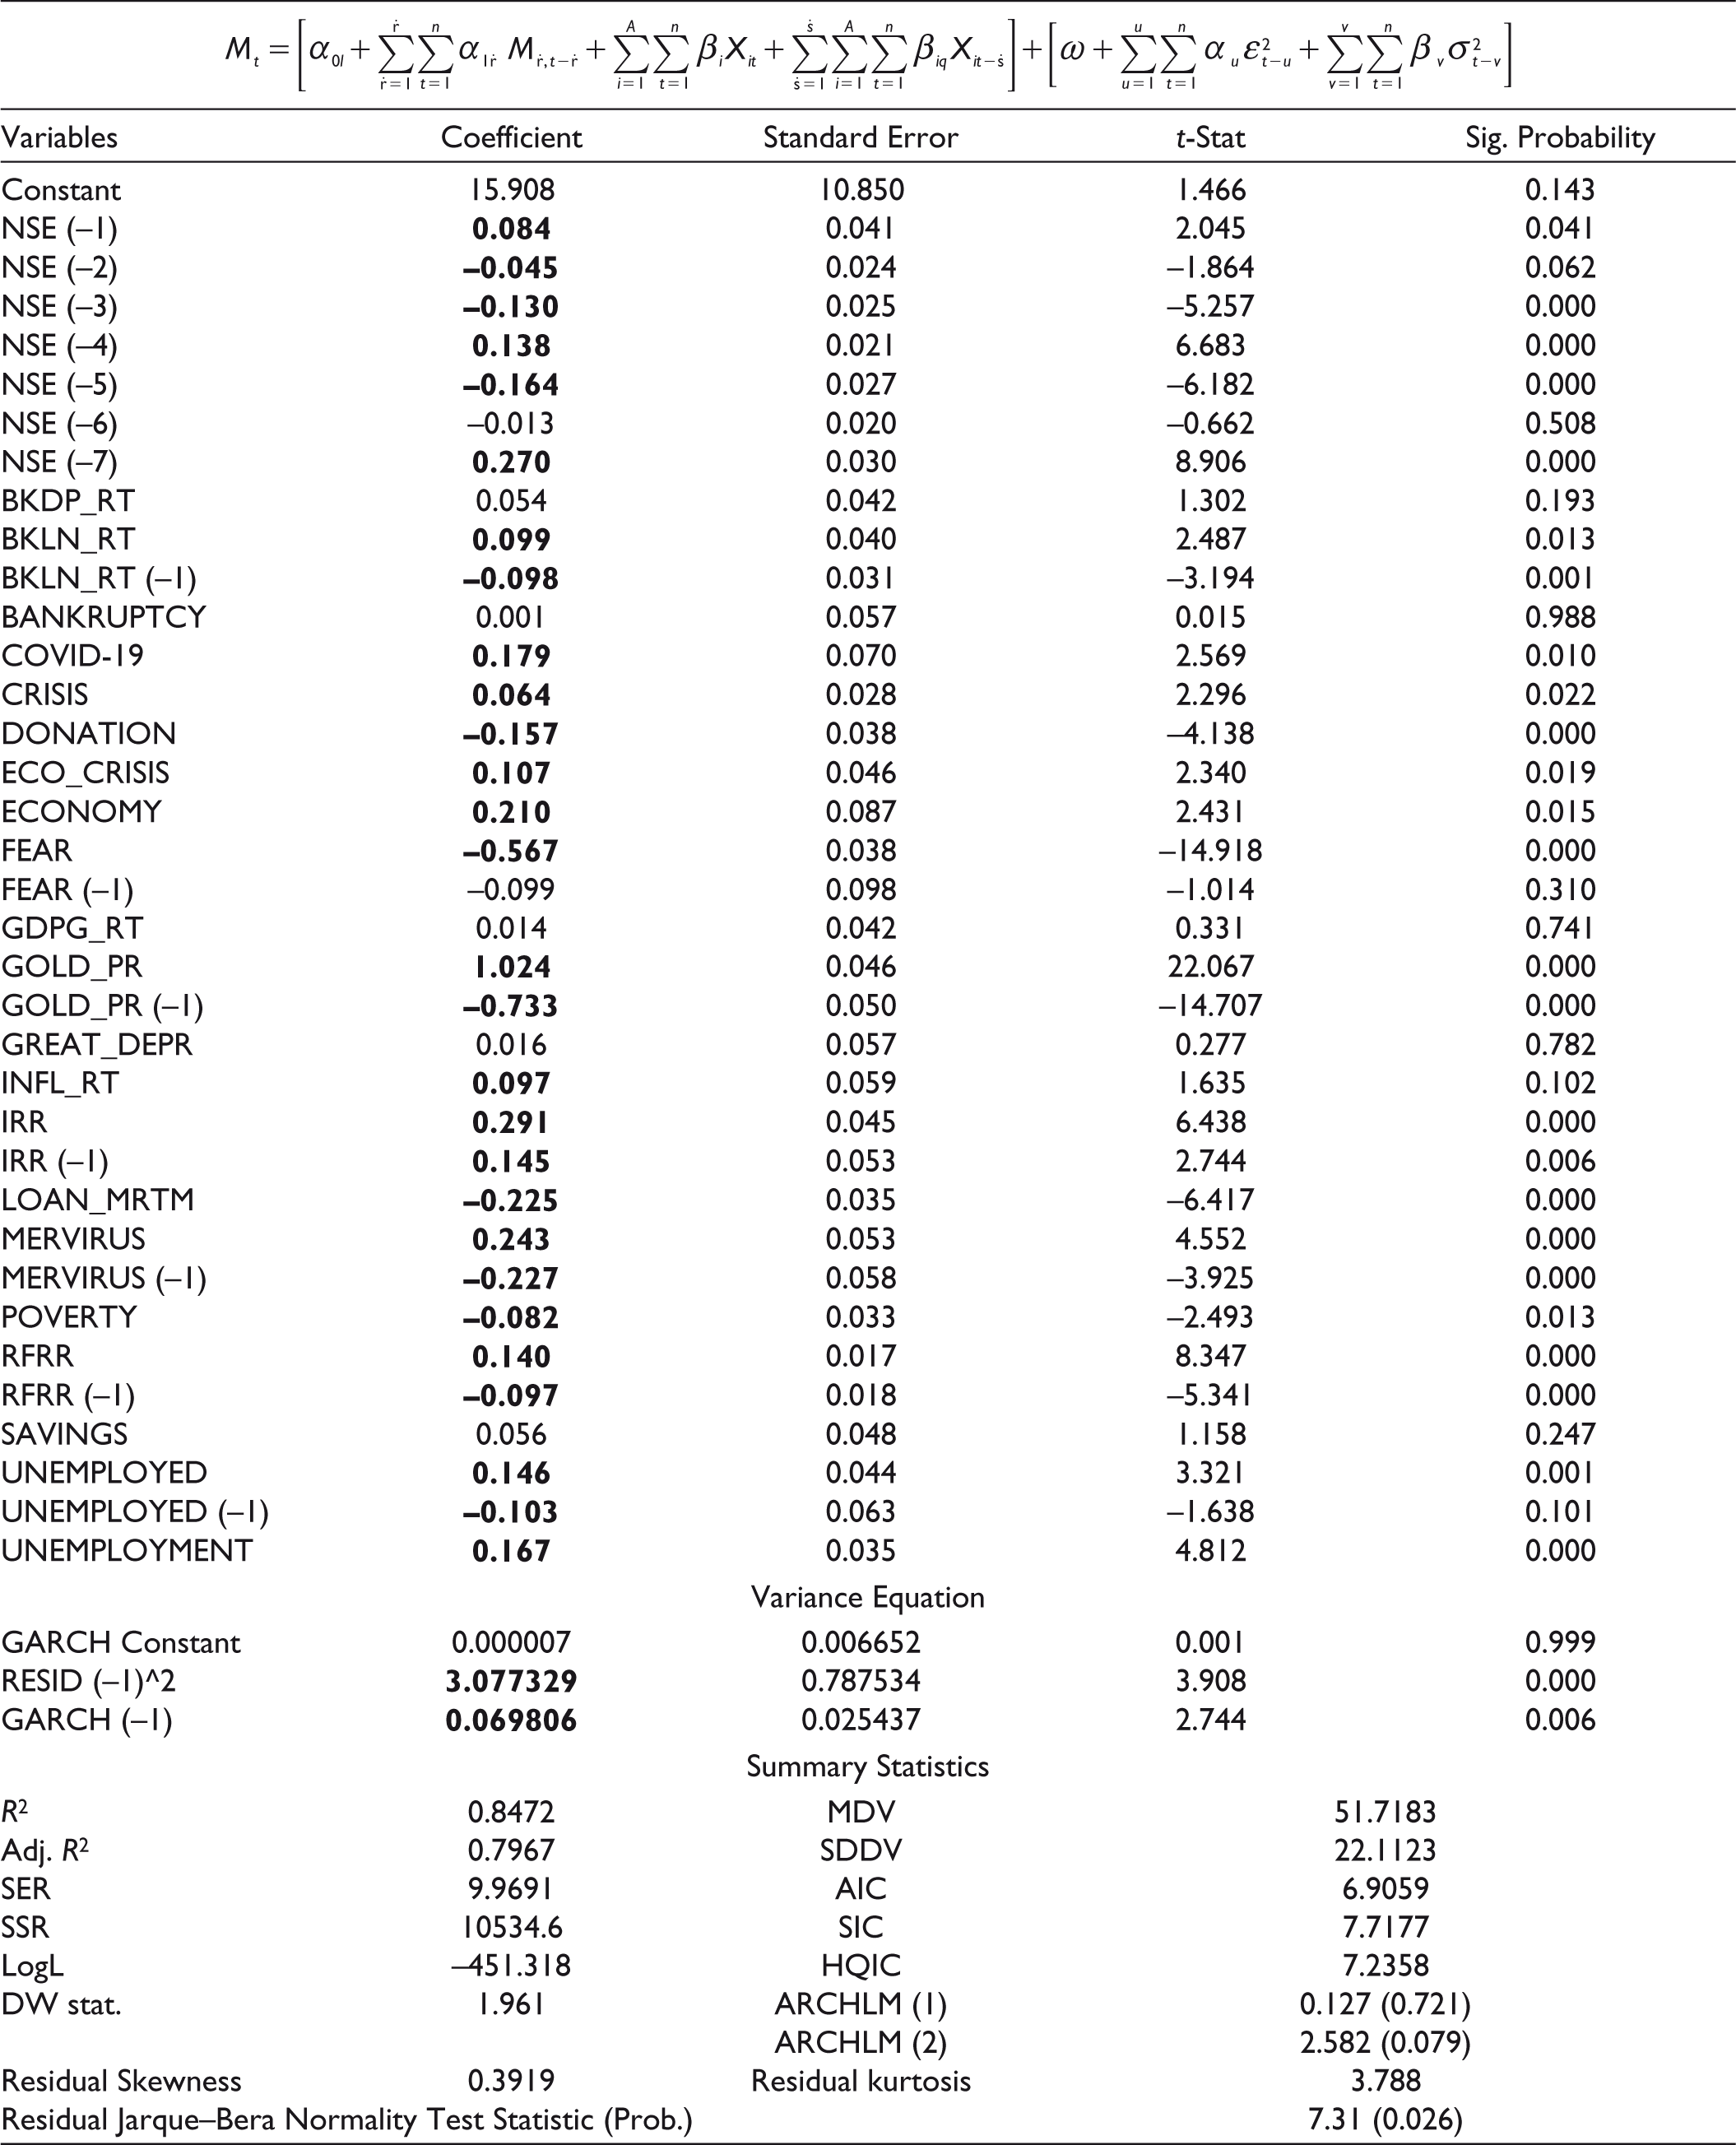
In Table 4, we depict the results for the ARDL augmented GARCH-X model and analyze towards building a parsimonious model for attention dynamics. This augmentation incorporates the impacts of the ARDL regression residual(s) along with the variance(s) of the endogenous dependent variable at first lags within the unrestricted ARDL setup. It shows that even after incorporating the significant effects of the endogenous dependent variable of NSE Nifty index, at its first five lags and the seventh lag as well, the GARCH-X model has strongly significant and positive impacts for its ARCH and GARCH components at their respective first lags (Figures 4 and 5). Again, the keywords ‘bank loan rate’, ‘COVID-19’, ‘crisis’, ‘economic crisis’, ‘economy’, ‘gold price’, ‘internal rate of return’, ‘MERVIRUS’, ‘risk free rate of return’, ‘unemployed’, and ‘unemployment’ have positively significant short-run impacts on ‘NSE Nifty index’, while those of ‘donation’, ‘fear’, ‘loan moratorium’, and ‘poverty’ have negatively significant short-run impacts. Nonetheless, we can identify that the GARCH-X model also incorporates the negatively (positively) significant long-run impacts of attention to ‘bank loan rate’, ‘gold price’, ‘MERVIRUS’, ‘risk-free rate of return’, and ‘unemployed’ (‘internal rate of return’). The above-stated results in the GARCH-X (1,1) model are BLUE, it has an explanatory power of 79.67%, and its residuals are normally distributed at the α value of 2.60% only.
Socio-economic Attention Effects on NSE Nifty in the ARDL Augmented GARCH-X Model
Therefore, the relationship of attention cointegration has a vast array of socio-economic attention spectrum leading the dynamic cointegrating impacts on the ‘NSE Nifty index’. The said relationship under the ARDL set up is unbiased but not an efficient description in terms of the parameter estimates. We discover that the GARCH-X setup is the efficient description for the dynamics of attention cointegration. In brief, investors’ attention to socio-economic attention interests shows documents in support of the dynamic attention cointegration, that is, attention coordination on to their attention to the ‘NSE Nifty index’.
Attention Coordination at BSE
In a similar style of reporting, we now present the attention coordination dynamics of the socio-economic attention keywords on ‘BSE Sensex index’.
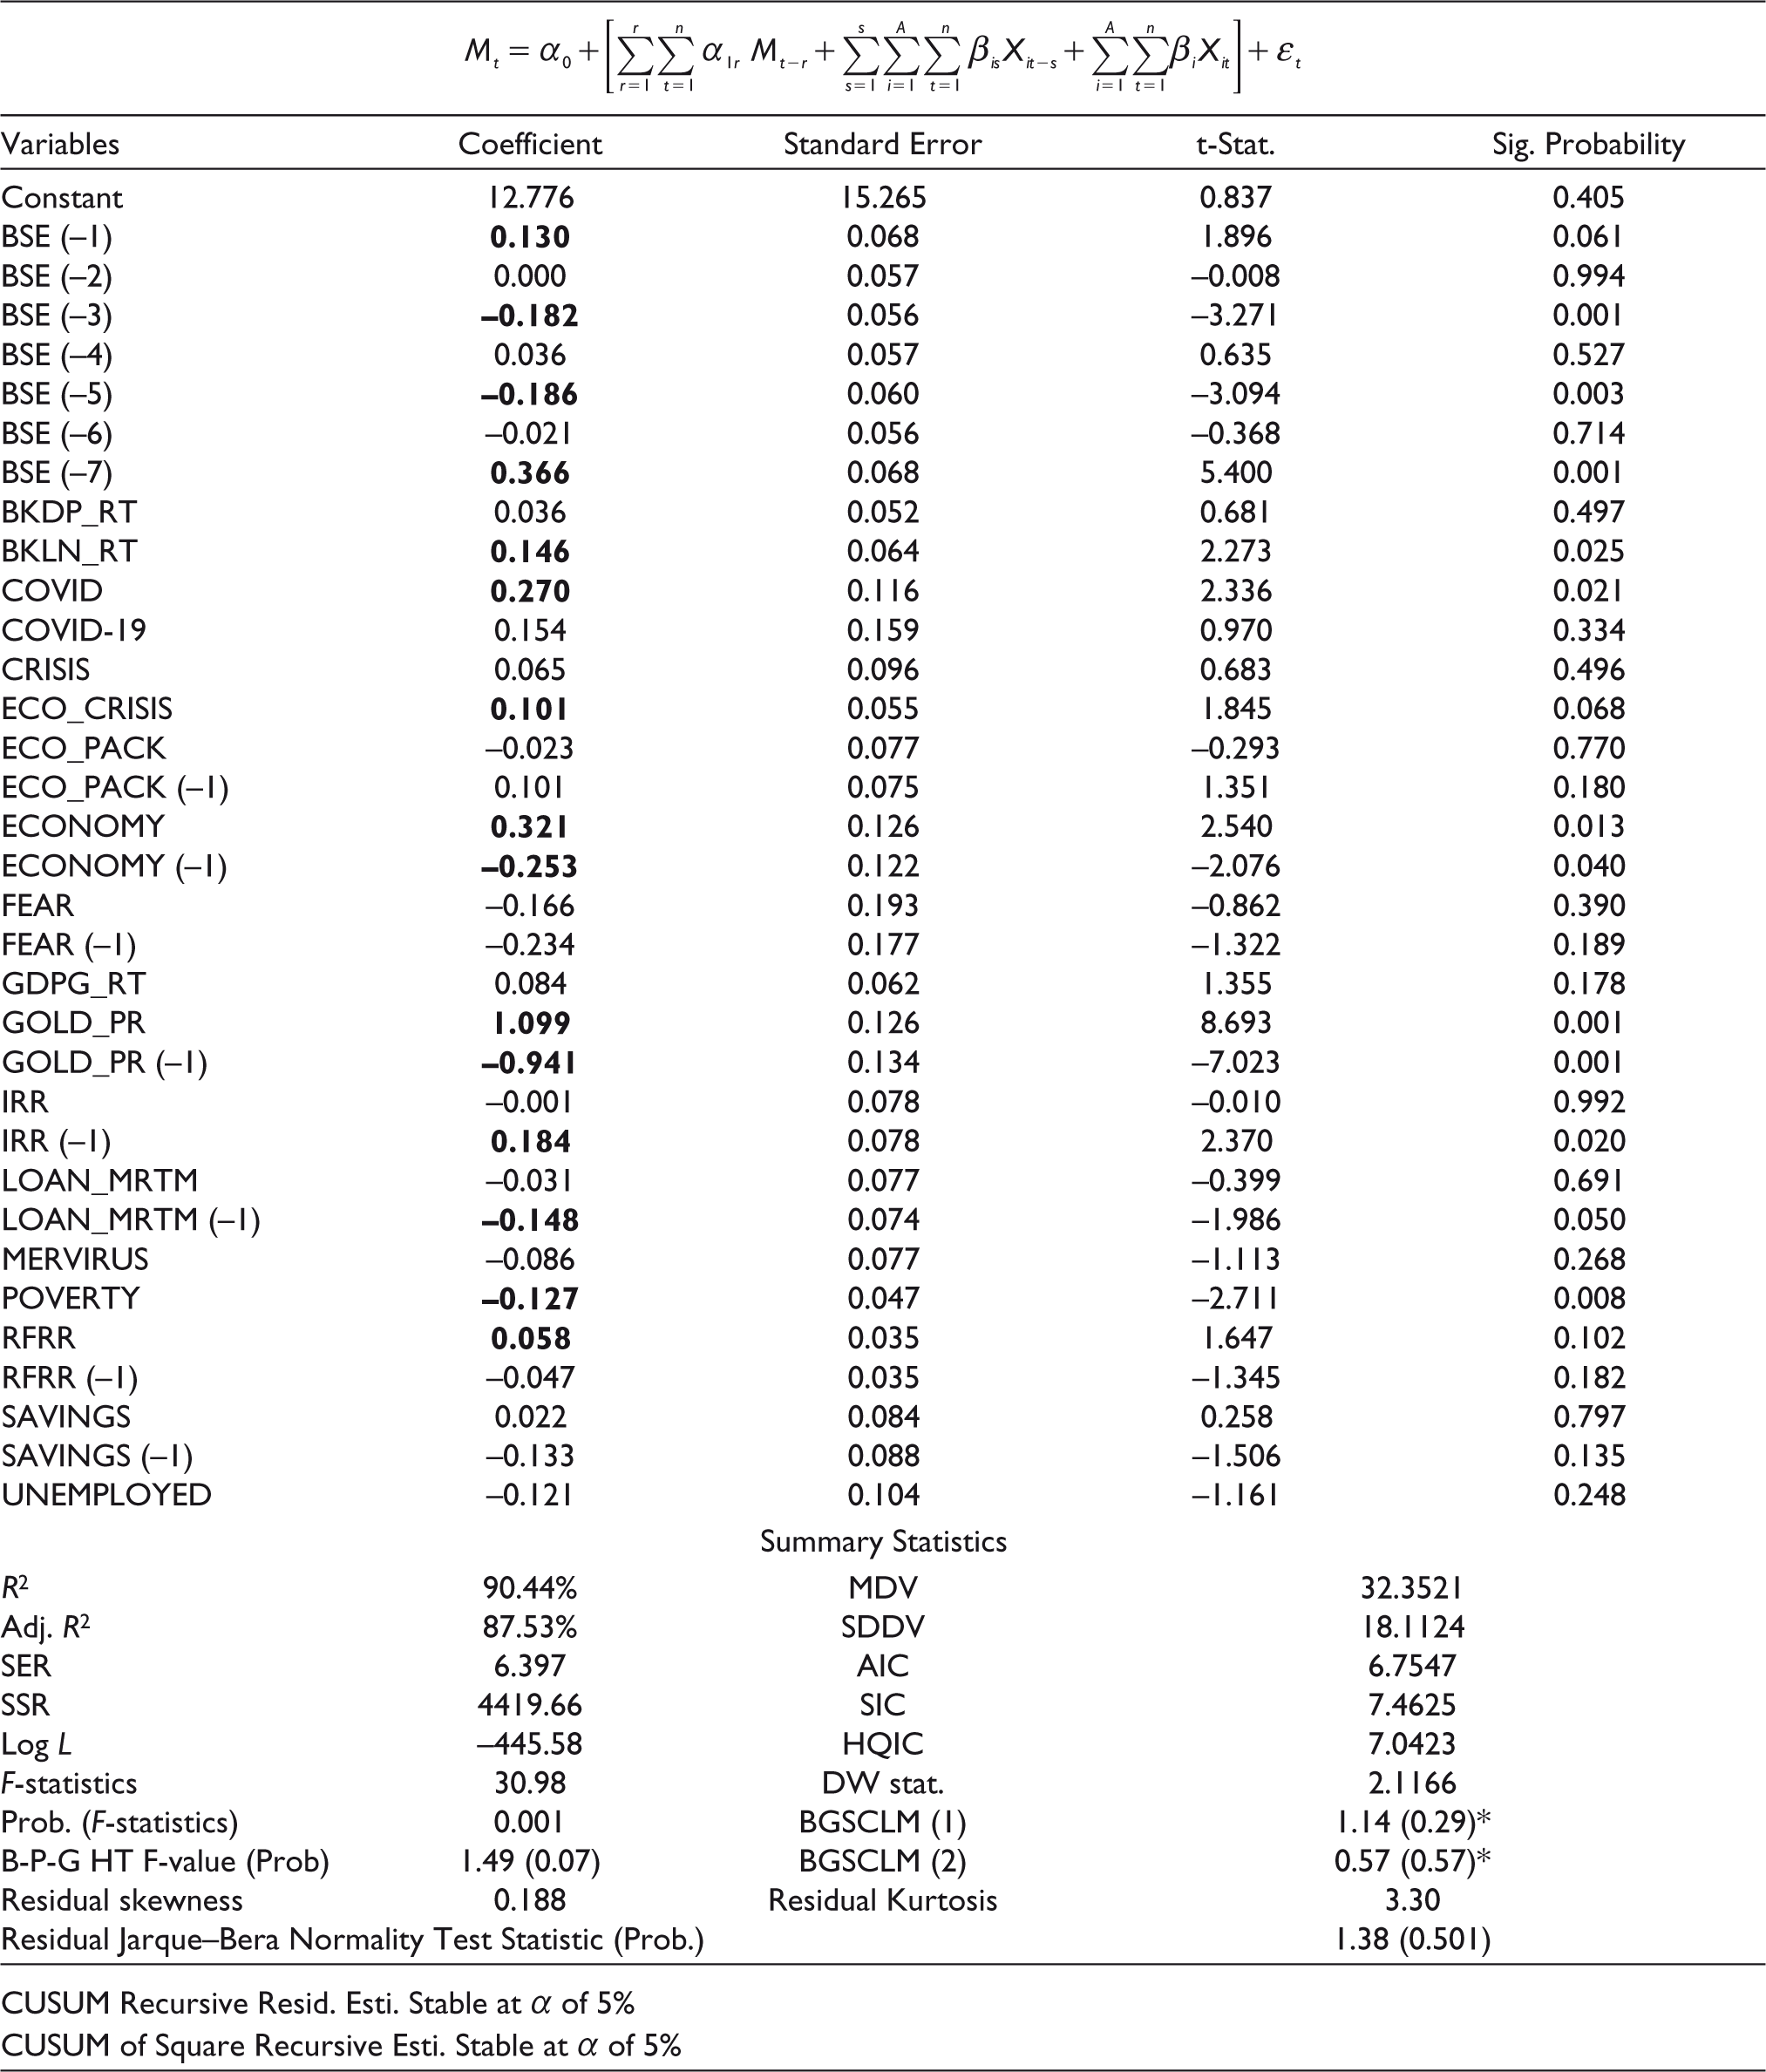
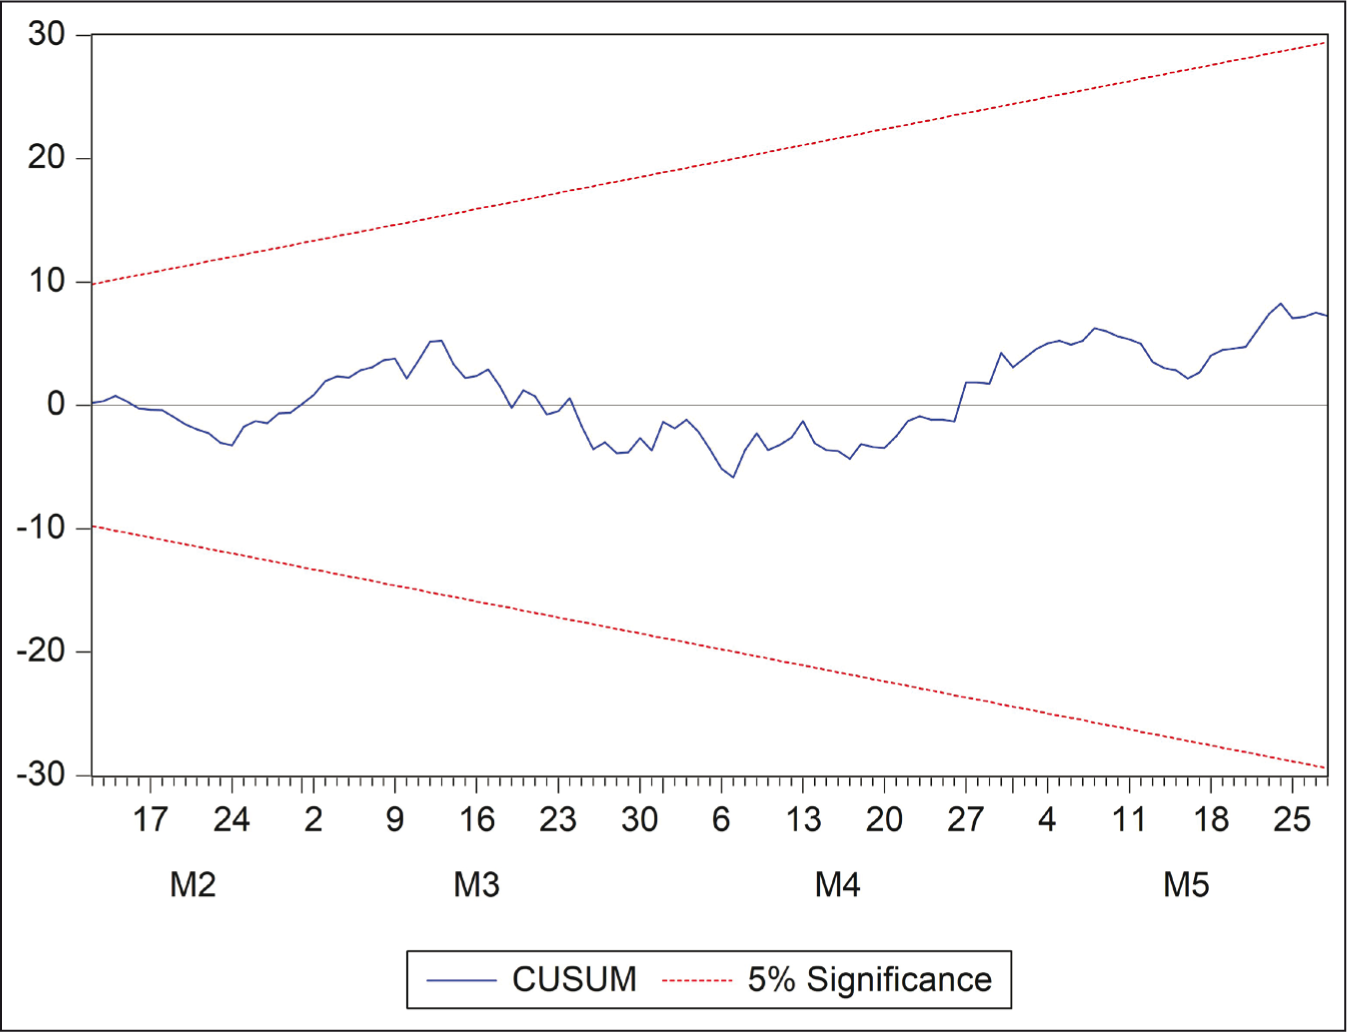
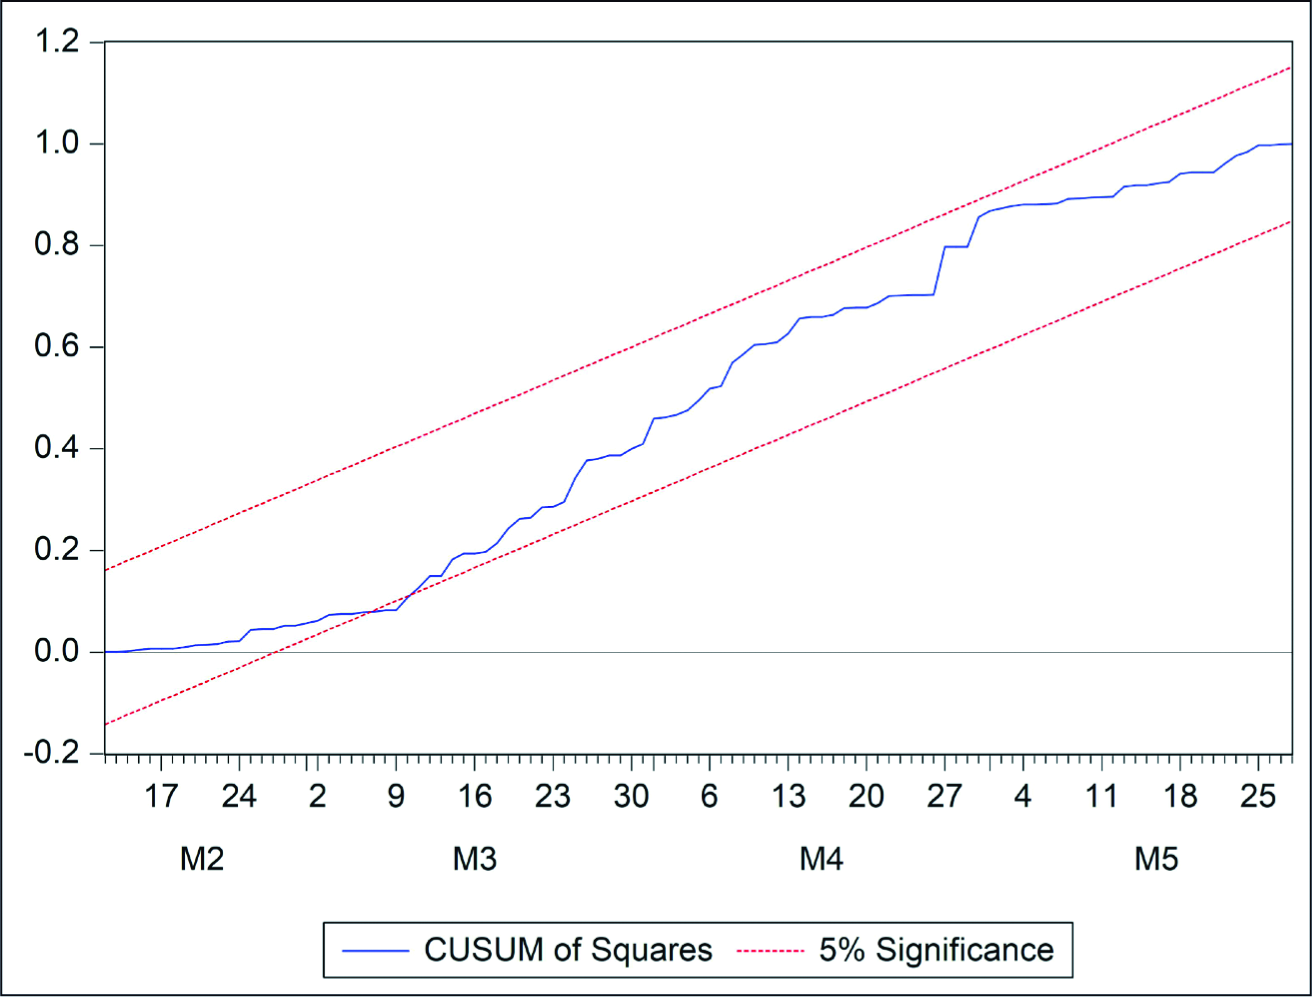
In Table 5, we show that the socio-economic attention keywords ‘bank loan rate’, ‘COVID-19’, ‘economic crisis’, ‘economy’, ‘gold price’ (‘poverty’) have strongly significant and positive (negative) short-run impacts on the attention keyword ‘BSE Sensex index’, while at long-run ends with their first lags, there are significantly negative (positive) impacts only for ‘economy’, ‘gold price’, and ‘loan moratorium’ (‘internal rate of return’). Their coefficients are robust at an α of 5% in all cases except for ‘economic crisis’ at an α of 6.8% only. The endogenous variable ‘BSE Sensex index’ has significantly negative (positive) impacts at its third and fifth (first and seventh) lags, while the long distant three lags are robustly significant at an α of 0.1%. These results illustrate a presence of sound cointegration amongst the socio-economic keywords having attention impacts on ‘BSE Senex index’. The summary statistics document that the unrestricted ARDL model has unbiased coefficients, a good explanatory power of 87.53% and the F-value of 30.89 robustly significant at an α of 0.1%. Again, in Figures 6 and 7, we confirm stability of the ARDL model with the stability diagnosis tests for the CUSUM of residuals and the CUSUM of square residuals. Nonetheless, the model is free from the problems of heteroskedasticity, residuals’ serial correlations, and non-normality distribution. The results in the ARDL model substantiate that the model coefficients are the efficient ones.
Socio-economic Attention Impacts on the BSE Sensex in the Unrestricted ARDL Model
We also demonstrate the results with the conditional LRF of the ARDL model along with its bound-test results. In Table 6, we found that the F-Bound test statistic 4.256 is strongly significant at an α of 1% and this confirms the cointegrating relationship amongst the socio-economic keywords and ‘BSE Sensex index’. Amongst the keywords, ‘economy’ and ‘gold price’ have strongly significant and positive short-run effects, while none has short-run negative impacts. Besides, ‘bank loan rate’, ‘Coronavirus’, and ‘economic crisis’ (‘poverty’) have significantly positive (negative) overall effects. The endogenous variable of ‘BSE Sensex index’ has both strongly significant and negative long-run and short-run impacts at the different lags, while attention to ‘fear’ and ‘loan moratorium’ (‘internal rate of return’) have negatively (positively) significant and strong long-run impacts. These results confirm the cointegrating attention impacts of socio-economic keywords on ‘NSE Nifty Index’.
Socio-economic Attention Impacts on BSE Sensex in Conditional LRF of ARDL Model
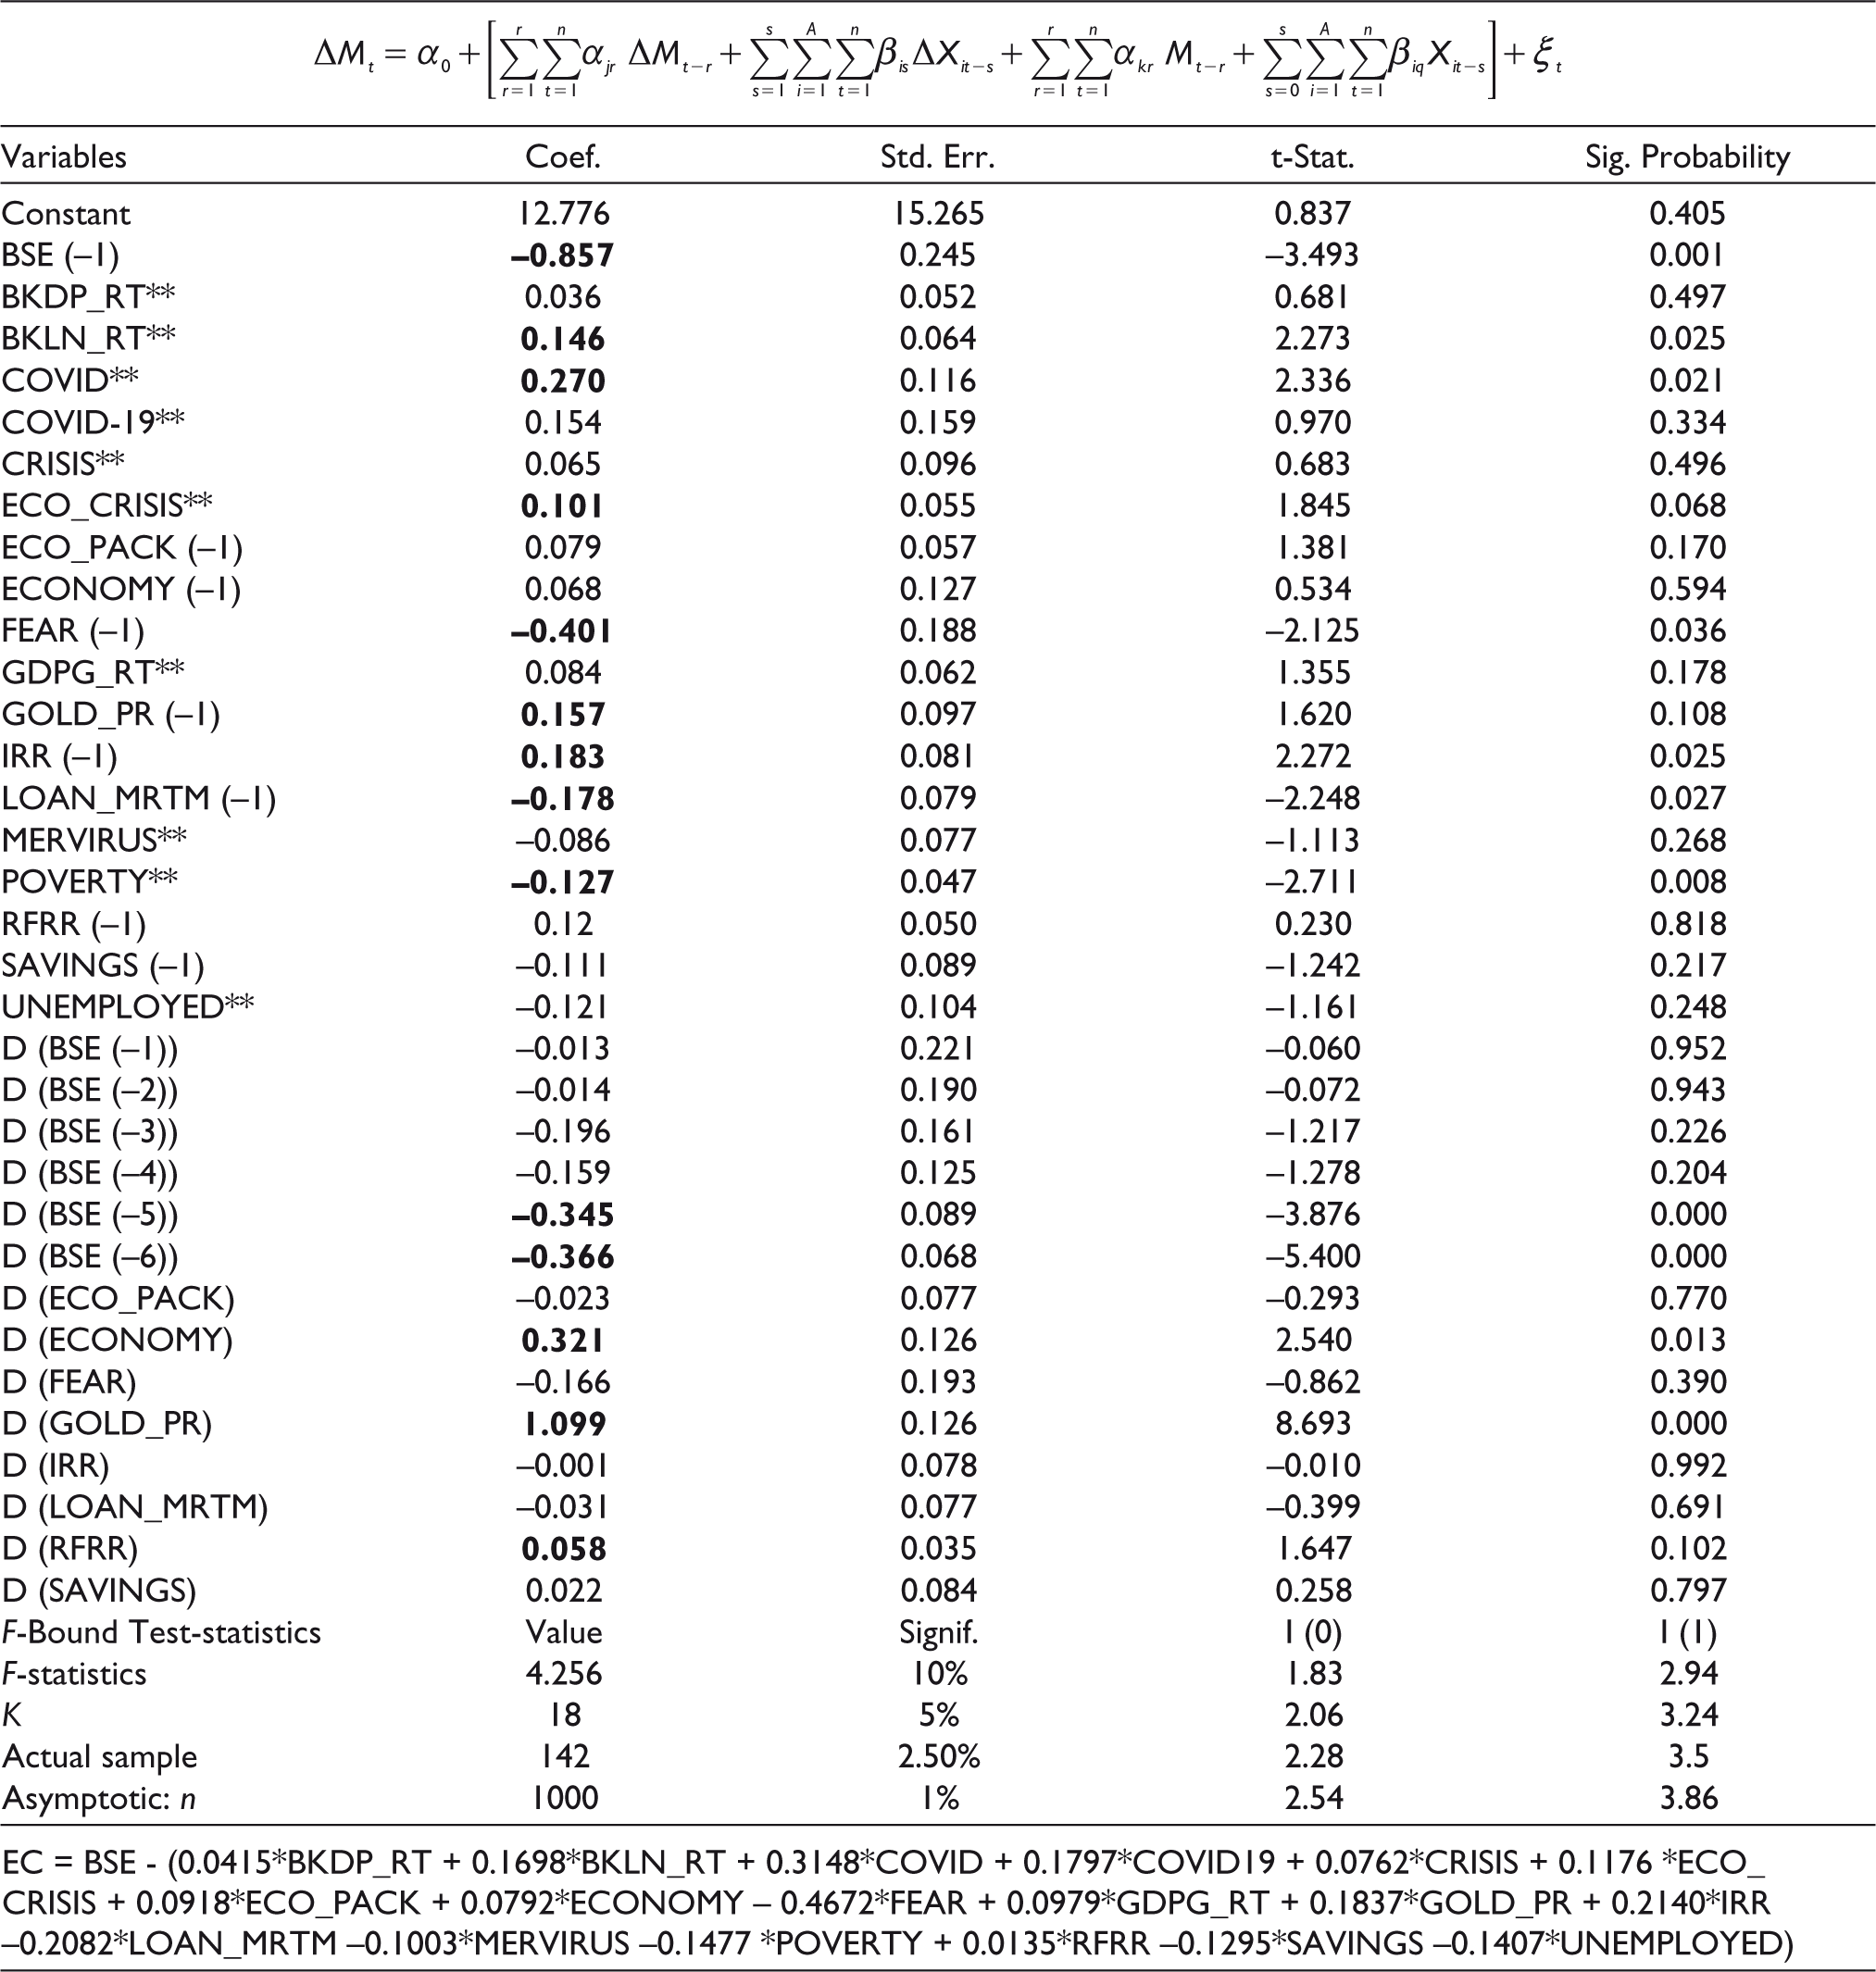
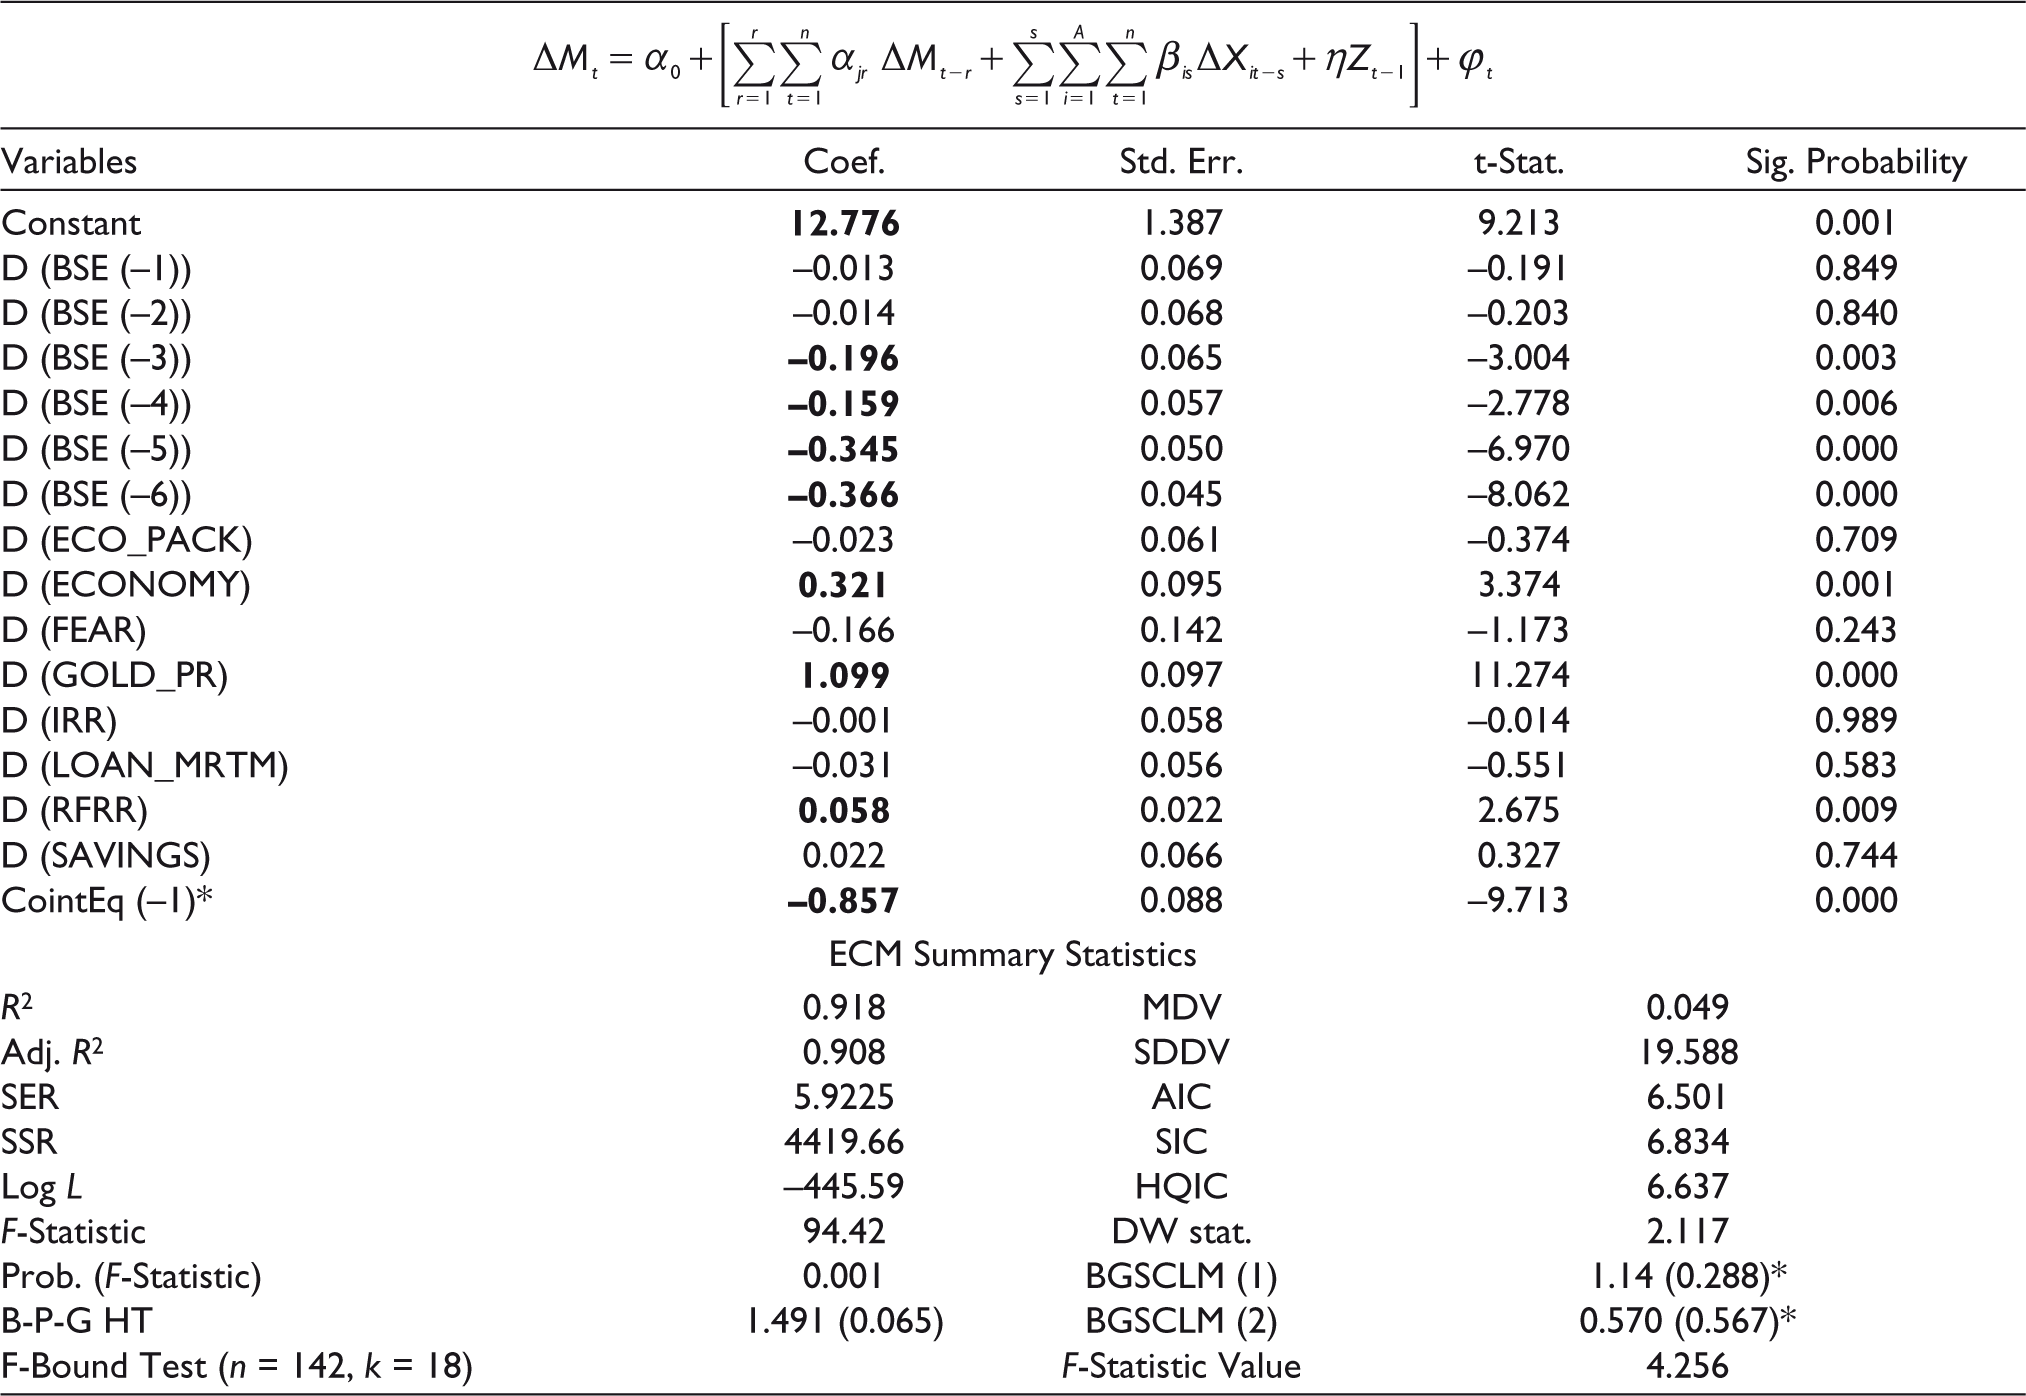
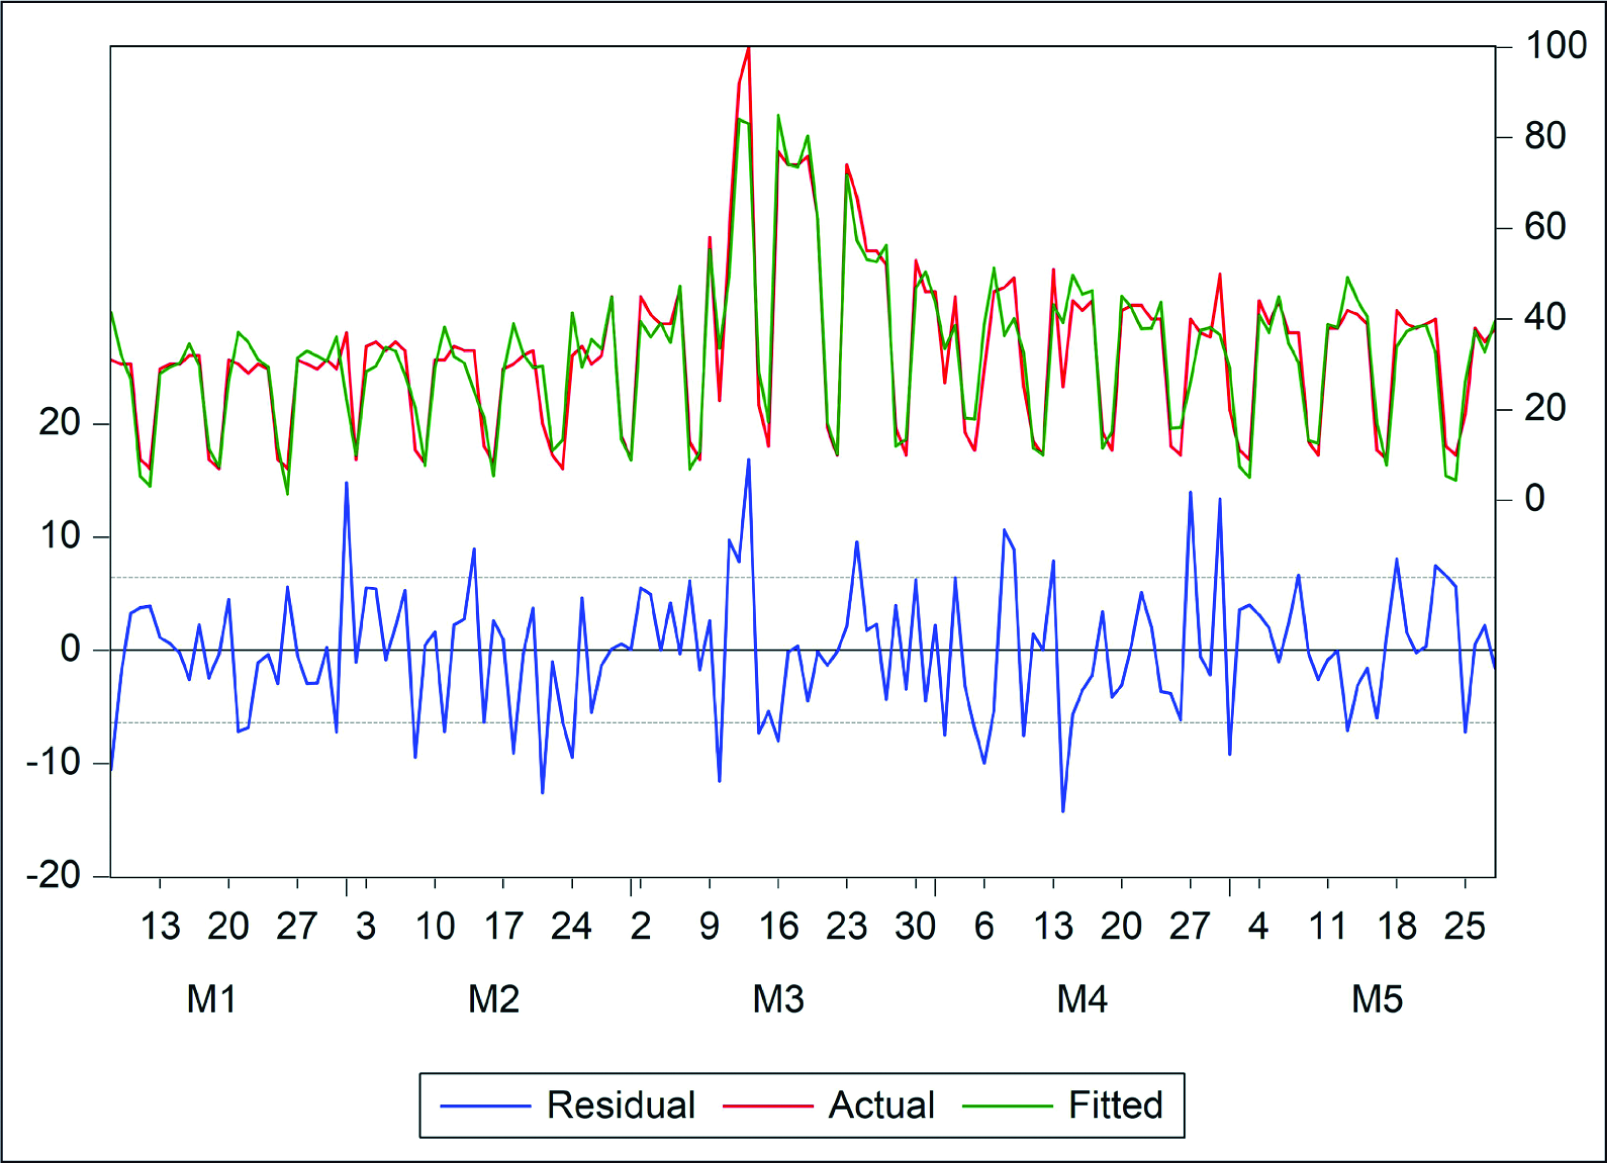
In Table 7, we compliment that the observed cointegrating relationship is robust even in the conditional ECF of the ARDL model. It has a negatively significant cointegration coefficient value of –0.857, revealing the degree of adjustments to the long-run equilibrium. Amongst the short-run impacts, attention to ‘economy’, ‘gold price’, and ‘risk-free rate of return’ have positively significant influences, while none has short-run negative impacts. The ECF has an excellent degree of explanatory power of 90.8%. As mentioned earlier, the coefficients in the stated ARDL model specification are both unbiased and efficient. The residual, actual, and fitted values in Figure 8 suggest that the ARDL residuals are symmetrically distributed at the both tails.
Socio-economic Attention Impacts on BSE Sensex in Conditional ECF of ARDL Model.
Socio-economic Attention Effects on BSE Sensex in the ARDL Augmented GARCH-X Model
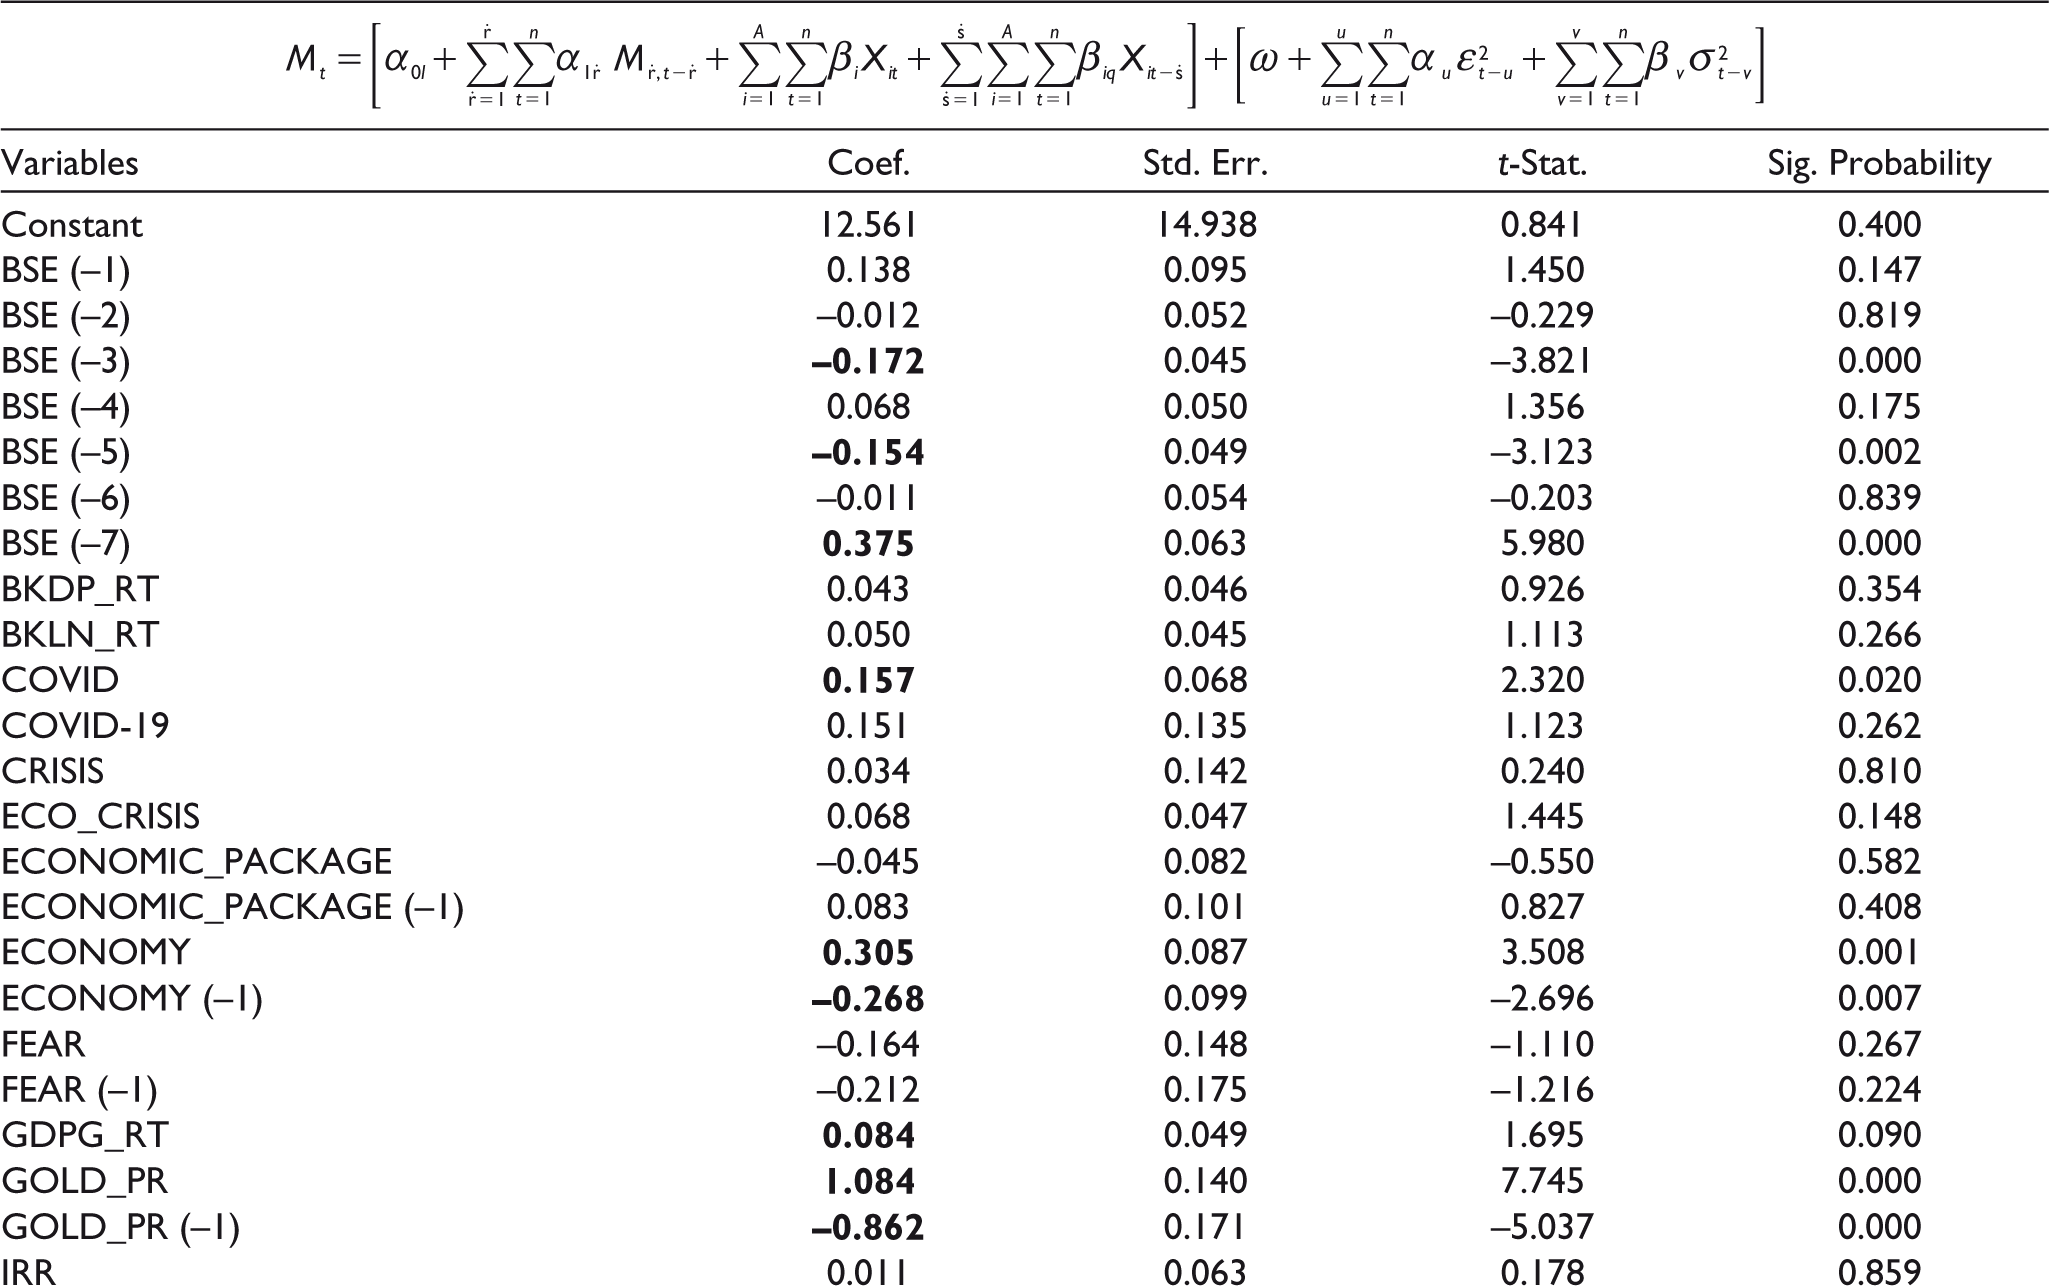
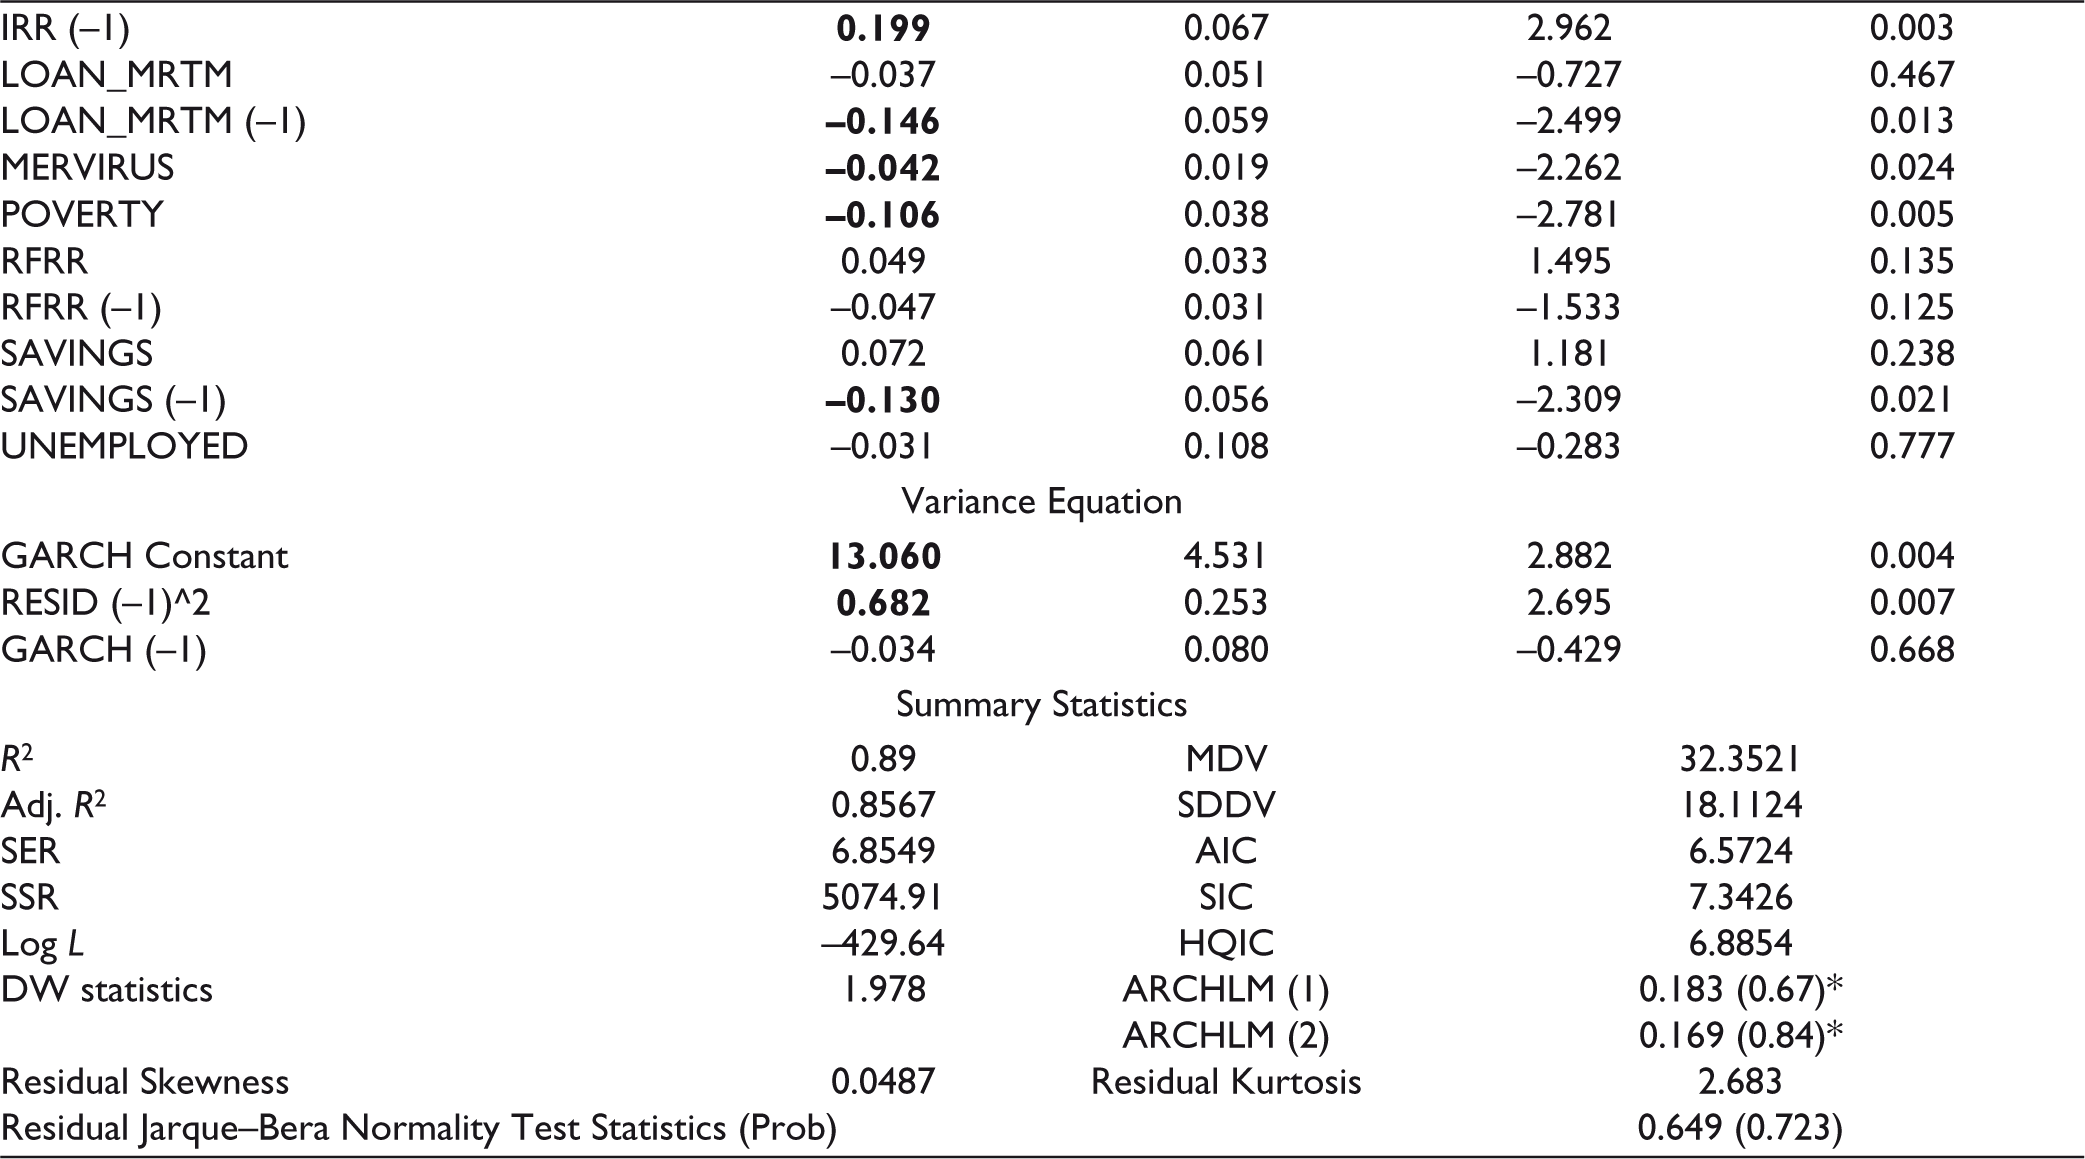
We analyse the results in the ARDL augmented GARCH-X (1,1) model to build a parsimonious model specification. It assists in developing a meaningful style at treating the trapped ARDL residuals and the variances of the endogenous dependent variable. In Table 8, we show that once the effects of the endogenous dependent variable ‘BSE Sensex Index’ at its third, fifth, and seventh lags are incorporated, the GARCH-X model shows strongly significant and positive ARCH effect at first lag with no GARCH effect at all (Figures 9 and 10). The keywords ‘Coronavirus’, ‘economy’ and ‘gold price’ (‘MERVIRUS’ and ‘poverty’) has significantly positive (negative) short-run attention impacts on ‘BSE Sensex Index’ while ‘economy’, ‘gold price’, ‘loan moratorium’, and ‘savings’ (‘internal rate of return’) have significantly negative (positive) long-run impacts at their first lags. These results in the GARCH-X (1,1) model are BLUE along with a robust explanatory power of 85.67% along with the normality of its residuals’ distribution.
In brief, we show attention cointegration with a large array of socio-economic attention searches having influences on ‘BSE Sensex index’. We also identify the GARCH-X setup in meaningful decoding of the excess residuals trapped in the ARDL setup.
Conclusion
We have empirically examined if the online socio-economic searches at Google demonstrate short-run and long-run attention dynamics leading to cointegration relationships with the keywords ‘NSE Nifty Index’ and ‘BSE Sensex Index’. In the both cases, we have documented such attention dynamics in the ARDL model setup and its augmented GARCH-X models as well. We have found robust statistics and parsimonious observations for their model specifications. We identify that investors’ attention to keywords viz., bank loan rate, COVID-19, economy, internal rate of return, risk-free rate of return, fear, economic crisis, gold price, donation, and loan moratorium have huge impacts of attention coordination dynamics on the two stock markets. The said dynamics have mixed implications in terms of short-run and long-run attention effects. The cointegrating dynamic adjustments confirm attention confidence to the long-run attention equilibrium for these two markets but the same is higher for the NSE market than the BSE market, and the same is attributed by the GARCH effect representing the investors’ underlying attention noise for the NSE market.
As conjectured in the Manifesto of the New Economy, therefore, we can empirically substantiate that the new economics, as theoretically proposed, is all about the new normal of attention dynamics. Attention search cointegration cannot be refuted as spurious correlations. Once traditional economics include ‘people’s motivations, desire and moods, their cognitive resources of memory and attention …’, the proposition of spurious correlation disappears as if Einstein’s famous criticism of ‘spooky action at a distance’ disappears with the existential interventions of entanglement in quantum dynamics. The behavioural economists can eloquently put forward theoretical arguments to explain this entanglement dynamics of investors’ attention cointegration for the socio-economic attention search keywords which otherwise look bizarre in traditional economics.
Our empirical observations can be re-examined with use of a few alternative attention search keywords like ‘Vaccine’, ‘COVID-19 Vaccine’, ‘COVAX’, ‘COVID Vaccine’, etc. The researchers may also use the field survey data to proxy for attention variables. At use of attention dynamics, towards a business application of the present research, the mutual fund managers may construct their clients’ attention spectrum and thereby, they may develop the behavioural portfolios in a behaviourally efficient manner. Future researches may explore these research gaps.
Footnotes
Declaration of Conflicting Interests
The author declared no potential conflicts of interest with respect to the research, authorship and/or publication of this article.
Funding
The author received no financial support for the research, authorship and/or publication of this article.
Appendix
Variable Lag Order Selection With the NSE Nifty Index and BSE Sensex Index
| Lag | LogL | LR | FPE | AIC | SIC | HQIC |
| The Case of Endogenous ‘NSE Nifty Index’ | ||||||
| 0 | –524.928 | NA | 147.7736 | 7.828771 | 8.393427 | 8.058228 |
| 1 | –524.847 | 0.130119 | 149.7961 | 7.841804 | 8.427374 | 8.079759 |
| 2 | –524.428 | 0.66635 | 151.126 | 7.850039 | 8.456522 | 8.096493 |
| 3 | –524.428 | 6.87E–06 | 153.3845 | 7.864223 | 8.491619 | 8.119175 |
| 4 | –524.331 | 0.151371 | 155.4699 | 7.877032 | 8.525341 | 8.140482 |
| 5 | –506.938 | 26.89057 | 123.3073 | 7.644514 | 8.313736 | 7.916462 |
| 6 | –505.94 | 1.529048 | 123.4088 | 7.64454 | 8.334675 | 7.924987 |
| 7 | –500.517 | 8.231016* | 116.0023* | 7.581799* | 8.292848* | 7.870745* |
| 8 | –500.125 | 0.589082 | 117.1131 | 7.590426 | 8.322388 | 7.88787 |
| The Case of Endogenous ‘BSE Sensex Index’ | ||||||
| 0 | –499.868 | NA | 103.5664 | 7.473303 | 8.037959 | 7.70276 |
| 1 | –499.611 | 0.411536 | 104.7227 | 7.483845 | 8.069415 | 7.721801 |
| 2 | –499.367 | 0.387201 | 105.9161 | 7.494573 | 8.101055 | 7.741026 |
| 3 | –499.352 | 0.024162 | 107.4756 | 7.508539 | 8.135935 | 7.763491 |
| 4 | –499.273 | 0.122707 | 108.9652 | 7.521608 | 8.169917 | 7.785059 |
| 5 | –484.26 | 23.21247 | 89.38923 | 7.322834 | 7.992056 | 7.594783 |
| 6 | –483.68 | 0.888885 | 89.99464 | 7.328788 | 8.018924 | 7.609235 |
| 7 | –474.132 | 14.49064* | 79.78668* | 7.207546* | 7.918595* | 7.496492* |
| 8 | –473.699 | 0.651068 | 80.50362 | 7.215588 | 7.94755 | 7.513032 |
Exogenous variables: C, BKDP_RT, BKLN_RT, BANKRUPTCY, COVID, COVID19, CRISIS, DONATION, DEEP_DEPR, ECO_CRISIS, ECO_PACK, ECONOMY, FEAR, GDPG_RT, GOLD_PR, GREAT_DEPR, INFL_RT, IRR, LOAN_MRTM, MERVIRUS, POVERTY, RECESSION, RFIR, RFRR, SAVINGS, UNEMPLOYED, and UNEMPLOYMENT