
Abstract
The article investigates the impact of earnings volatility on the South African bank’s capital structure using a sample of registered banks from 2012 to 2021. None of the research on this relationship has examined the oligopolistic market of the banking sector, which stands as a structurally distinctive economic segment. Using the generalized method of moments (GMM) model, the results show a negative and significant effect of earnings volatility on leverage. These findings help finance professionals understand the oligopolistic banking sector’s leverage dynamics and earnings volatility within the context of unexpected economic shocks. Thus, the central banks should require banks to diversify in a bid to minimize earnings variance, thereby providing them with financing flexibility. Bank executives and regulators will find the findings pertinent, providing them with perspectives for making well-informed decisions regarding the capital structure based on the degree of earnings variability.
Introduction
One of the most significant financial choices a company may make is deciding on an appropriate capital structure. The capital structure highlights the use of debt and equity to fund a company, and a firm’s management sets the leverage to maximize its worth (Ghasemzadeh et al., 2021). The literature’s controversy over the ideal capital structure of financial and other companies remains unresolved (Khan et al., 2021). Several empirical investigations on capital structure did not include financial firms, notably an oligopolist banking structure; for instance, researchers such as Sheikh and Wang (2010), Alyousfi et al. (2020) and Krištofík et al. (2022). They argued that those financial institutions, as providers and users of capital, have a unique business model tied to different regulatory structures like the capital adequacy ratio.
Similarly, financial institutions are deemed heavily indebted compared with other types of companies as payment recipients. As a result, there is a need to re-look at the determinants of capital structure in the financial sector, specifically banks. Such analysis is justified by the premise that banks are fundamentally and structurally unique as their choices result from multiple governing structures, particularly those imposed by a bank’s governing body. Regardless of variations like companies and regulatory constraints, lenders are essential in a nation’s economic framework (Khan et al., 2021). The banks’ capital deserves close analysis and monitoring as it represents a buffer against contagion risk, unexpected liquidity spirals and any unexpected shocks. Several scholars argue that banks’ capital structure reflects their ability to absorb shocks (see, e.g., Bernanke, 2009; BIS, 2022; IMF, 2022; McDonough, 1998). As capital providers, banks are essential to an economy, as noted by Ching et al. (2016), who noted that banks play a significant part in distributing capital through each productive economic sector. In rising and diversifying countries, this function becomes increasingly important as the government seeks to expand other economic sectors to reduce reliance on revenue from oil (Khan et al., 2021). This needs to be done in a setting where the capital markets are still in their infancy. South Africa has the most extensive banking sector on the African continent. The sector’s total tier 1 capital was more than 34.4 billion USD in 2021. Moreover, regarding asset worth that same year, the five financial companies in the nation ranked among the top 10 African banks. In 2020, the banking industry’s total assets made up approximately 88% of the gross domestic product (GDP) of South Africa. In contrast to 83.08% in 2019, the ratio rose. Over the observed period, the banking sector’s assets increased the nation’s GDP.
Many theories in literature explain ‘firms’ capital structure, but earnings volatility (EV) has become a key research and policy theme. Intuitively, EV negatively impacts the bank’s capital structure. A bank’s volatile earnings are expected to lower its reliability, which develops as it performs debt-related transactions by issuing debt (Khan et al., 2021). However, if a company’s earnings fluctuate, such obligations can be highly burdensome. As a result, banks must maintain trustworthy earnings security and their connection to EV and leverage in the banking sector that is yet to be fully explored.
There is a growing number of studies that argue that banks’ capital structure is similar to non-financial firms, and these studies used data from developed countries (Gropp & Heider, 2010; Jucá et al., 2012; Teixeira et al., 2014). However, few studies support the above argument in developing countries (Khan et al., 2021, 2023; Sibindi & Makina, 2018). Despite having diverse business and regulatory frameworks, Khan et al. (2023) study identified similarities among the factors influencing the capital structure of financial and non-financial enterprises. Likewise, Sibindi and Makina (2018) argued that bank-specific fixed variables serve a role in capital structure tenacity, banking supervision, managing credit risk and capital regulation possibilities for arbitrage are among them. They identified one study that looked into the factors that influence the capital structure of South African financial institutions. Using two samples from 16 banks and 26 insurance providers in South Africa, Sibindi and Makina (2018) investigated the financing framework drivers of South African financial firms from 2006 to 2015. They found that traditional firm-level capital structure indicators scientifically observed in non-financial companies are also relevant to banks and insurers. Their study did not put EV into perspective.
The current study differs from the study of Khan et al. (2023) and Sibindi and Makina (2018) in three ways. First, the present study added EV in an econometric model and measured it with a standard diversion. However, Khan et al. (2023) measured EV as the ratio of (profit after tax minus profit after taxes(t–1)) to profit after taxes (t–1). In contrast, Sibindi and Makina (2018) used credit risk (banks) as an independent variable and measured it with a proportion of weakened financing to gross loans. Second, the current study focuses only on the banks’ capital structure, whereas Sibindi and Makina (2018) used a sample of banks and insurance firms.
Moreover, Khan et al. (2023) used an unbalanced panel data set with 132 banks participating in 15 distinct The Middle East and North Africa (MENA) countries between 2012 and 2017. Third, the present study also accounts for the pandemic crisis period, where EV is assumed to have increased. Thus, the article sought to ascertain the effect of EV on the financial leverage of a South African bank.
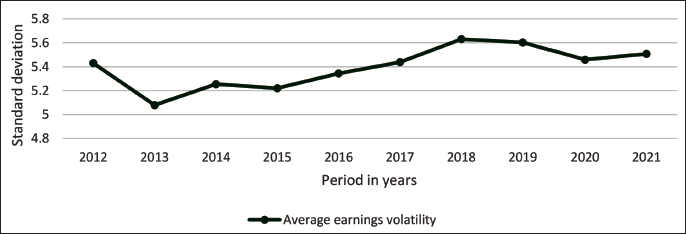
Figure A1 depicts developments in banks of South Africa’s overall EV determined by the standard deviation indicated in Appendix A. In 2012, typical EV reached a high of 5.43. It fell to the lowest level of 5.07 in 2013 before rebounding to a high of 5.63 in 2018, with an average EV of 5.26 in 2014. The median number started to decline in 2019, falling from 5.63 in 2018 to 5.60 in 2019. Furthermore, the average EV fell from 5.60 in 2019 to 5.46 in 2020. The COVID-19 pandemic in South Africa did not effectively increase average EV between 2019 and 2020, but the EV grew slightly from 5.46 in 2020 to 5.51 in 2021.
Although EV has been established as an indicator in the trade-off and pecking order hypotheses for opting for the conservative policy in capital structure, previous empirical research investigating the association has yielded inconsistent findings (see, e.g., Ahmeti et al., 2023; Assfaw, 2020; Ghasemzadeh et al., 2021; Khan et al., 2021, 2023; Obadire et al., 2023). The non-homogenized sample appears to be one of the elements causing contradicting findings. According to Ghasemzadeh et al. (2021), neglecting to consider various financial constraints and circumstances can result in a non-homogenized sample. Moreover, despite extensive research into volatility and spillover throughout different countries and economies, the association between volatility and company capital structure remains unresolved (el Alaoui et al., 2017). In addition, not much has been researched regarding the impact of EVs on the bank’s leverage, particularly in South Africa, where the banking sector is homogenized and oligopolistic. This is a variation from previous studies that investigated non-homogenized samples. Different from those who examined the banking sector, this study investigates structurally unique market structure (oligopoly structure). Furthermore, because South Africa is a developing nation with liquidity issues and a high level of risk, we need to examine EV. The research question addressed by this article is, ‘What impact does EV have on a bank’s capital structure?’
This article contributes to the existing literature in various manners. First, the current article examines banks, as the regulatory framework for banks in South Africa is primarily and functionally distinct from that of advanced nations (Marozva, 2020). Second, the banking industry in South Africa is unique as it is characterized by the four big banks that compete strategically, typical of an oligopoly structure. Third, the effect of risk on leverage has captured the interest of numerous scholars globally. The results of this article help finance professionals understand volatility within the context of unexpected economic shocks. Thus, this contributes to the literature on banks’ capital structure dynamics within the context of a pandemic. The results are useful to potential and existing investors, bank managers and policymakers as they can determine the optimal capital structures given a projection of EV and prospects of unexpected economic shocks. Moreover, the findings will assist bank professionals in identifying micro and macro-economic factors that influence leverage and help them to determine the combinations that result in optimal capital structures. Finally, as this research took place throughout the COVID-19 period, it provided an exceptional chance to investigate the pandemic’s impact on the financial sector’s leverage. The current study aimed to contribute to the growing body of literature on the effect of COVID-19 on firms’ capital structure. Results in this article show that as ‘banks’ EV rises, their leverage ratio falls, indicating a negative effect of EV on capital structure. The research suggests that banks prioritize steady earnings as it could assist them in retaining an adequate capital framework. Thus, the smaller the capital structure, the greater the EV, as they are unclear if they will ultimately be capable of covering their debts.
The rest of this article is structured as follows: the next section reviews the existing literature on the effect of EV on firms’ capital structure. This is followed by the methodology, which details our econometric approach. The findings are presented and discussed, with a conclusion and recommendations at the end of the discussion.
Literature Review
The capital structure puzzle (Myers, 2001) remained unsolved for nearly five decades. While debt and equity are interpreted to be interchangeable in an ideal capital market, firm value is untainted by capital structure decisions, based on Modigliani and Miller (1958). After investigations since 1963, Modigliani and Miller (MM) abandoned the perfect capital proposition because of friction factors like bankruptcy costs, transaction costs, agency costs and taxes, encouraging scholars to explore new ideas of capital structure since capital is critical for maximizing firm value worldwide. Some of these theories consist of trade-off theory (TOT) (Kraus & Litzenburger, 1973), pecking order theory (POT) (Myers, 1984), agency theory (Jensen & Meckling, 1979) and marking timing theory (Baker & Wurgler, 2002; Demirguc-Kunt & Maksimovic, 2002). Existing studies on the factors that influence capital structure have used POT and TOT to analyze their findings (Sibindi & Makina, 2018). The present article adopts inspiration from those investigations and utilizes TOT and pecking order notions to shed light on the bank’s capital structure decisions.
The notion of trade-offs (1973) is linked to Kraus and Litzenberger. They proposed companies seek optimal leverage as a trade-off between debt’s tax benefits and bankruptcy’s burden costs. In his static trade-off method, Myers (1984) advanced this notion more thoroughly, asserting that firms built a goal debt-to-value ratio and started moving towards it, identical to how firms modify dividends to advance to an ideal dividend payout ratio. An entity has two funding options: debt as well as equity. In a trade-off strategy, the company has to take on additional debt to reap the benefits of the debt interest tax shield until the accruals exceed the basic amount of the tax shield. Beyond this juncture, the company should fund itself with equity.
Nevertheless, Myers and Majluf (1984), the authors of the POT, assert that favouring secure investments over risky securities is undoubtedly worthwhile. Myers (1984) supports this claim by stating that, while the firm might offer security, it will prefer intrinsic external funding over equity debt. As a result of the idea, while investment exceeds internal financing, corporate debt will rise. Mamaro and Mabandla (2022) argued that managers would prioritize funding initiatives with retained earnings over issuing obligations whenever it is not prudent. As such, existing investors’ ownership and earnings per share are lessened. Therefore, providing equity capital tends to be less advantageous than issuing debt financing. Asymmetric information theory is another name for the concept of pecking order, which occurs when the management (internal stakeholders) have greater insight than investors (outsiders), which they use to their advantage (Sibindi & Makina, 2018).
Even with multiple theories with differing themes, it is still unclear what the precise ideal capital structure is, yet there is a theoretically perfect combination of funding strategies (Khan et al., 2021). All of these hypotheses are supported by empirical research, yet there is a wealth of literature on non-financial companies. Interestingly, the theoretical presumptions have found no distinction between commercial and financial enterprises. As a result, we may investigate the variables influencing bank funding decisions using theoretical presumptions, such as the MM theorem (Khan et al., 2021). Miller (1995) asserts that banks may or may not be able to implement the MM proposition. Similarities between the factors influencing the source of funding mix for non-financial and financial companies were observed empirically by Gropp and Heider (2010).
Based on empirical data from central US and European banks, Frank and Goyal (2009) for US non-financial companies and Rajan and Zingales (1995) for G-7 countries found that bank leverage has a similar significance and link to capital structure determinants. They contend that to have an efficient capital structure; banks should prioritize their capital needs secondary to other considerations and follow a model akin to that of non-financial companies. These results align with the best bank capital structure models put into practice by Flannery (1994), Myers and Rajan (1998) and Diamond and Rajan (2000). They also de-emphasize the capital requirement. According to Selim et al. (2019), bank investment is essential for developing infrastructure, which is necessary for the quick expansion of the economy.
Within the banking sector, the most applicable theories are the trade-off (TOT) and the POT. The earning volatility in TOT and POT could be used to determine the conservative strategy for the capital structure. According to the TOT hypothesis, the bank’s volatility is stochastic, and its costs for modifying leverage are substantial (Ghasemzadeh et al., 2021). Within this theoretical framework, two banks with identical mean cash flows are examined; one has an established standard deviation threshold, denoted as ‘σ’, while the other’s standard deviation is stochastic, with a mean of σ and a variance of ɛ. Based on the static TOT, the second bank has higher stochastic volatilities, yet their mean and standard deviations in cash flows are identical. Thus, to minimize the costs associated with stochastic volatilities, a bank would employ cautious financial leverage to manage the substantial altering costs and optimize the debt in reaction to volatility changes (Halov et al., 2009). According to this argument, banks employ less debt when EV is high since higher volatility is associated with a higher likelihood of insolvency.
However, the pecking-order hypothesis highlights that inter-organizational individuals possess additional details concerning these discrepancies in banks with unpredictable volatilities. Yet, extra-organizational individuals may forecast forthcoming volatilities by considering previous patterns of constant EV. As a result, under these circumstances, the bank would employ alternative resources in response to the increase in costs, which would raise the cost of capital provided by the debtors due to information asymmetry (Halov et al., 2009; Myers & Majluf, 1984). Thus, to avoid a higher cost of capital due to the high EV, the POT idea theorizes that banks with higher EVs maintain their ability to lend funds. A bank’s high-income volatility indicates a high risk for creditors and implies ambiguity regarding the bank’s sustainability.
Many studies have been conducted on the determinant capital structure in developed and developing economies. However, little is known about the impact of EV on a bank’s leverage, particularly in South Africa. Ahmeti et al. (2023) investigated the capital structure factors of the Western Balkan banking sector from 2015 to 2020. The study found a significant but positive association between profitability and book leverage. However, the leverage ratio, EV, collateral, growth and liquidity significantly negatively affect Western Balkan banks’ book leverage.
Similarly, Obadire et al. (2023) used panel data from 45 listed banks in six countries in the Basel III agreement between 2021 and 2029 to investigate the critical variables influencing the capital structure decisions made by African banks. The study’s findings showed that the net interest margin ratio with bank leverage and Zscore, a measure of a bank’s financial soundness, had a positive association. Furthermore, their study’s findings show that risk, profitability and EV are positively associated with bank capital structure. This implies that banks with high profits tend to support debt financing, a behaviour motivated by their capacity to pay down debt with spare cash flows.
Using annual data from 11 Saudi commercial national banks listed on the Tadawul Saudi Stock Exchange, Khan et al. (2021) examined the most critical factors that had impacted the bank’s capital structure from 2010 to 2017. The research findings indicate that banks are heavily leveraged in Saudi Arabia, supporting that the scope of bank firms differs from that of non-banking firms. Furthermore, the research discovers a positive and significant effect on EV, growth, bank size and book leverage.
Other studies that positively influence EV and bank leverage include earlier researchers, including Assfaw (2020), Sheikh and Qureshi (2017) and Teixeira et al. (2014), who correlate in trade-off hypothesis forecasts. However, utilizing an unbalanced panel data set of 132 banks that participated in 15 distinct MENA countries between 2012 and 2017. The critical variables influencing banks’ decisions about capital structure in the MENA area were examined by Khan et al. (2023). They discovered a significant negative association between capital structure and EV. In other studies, including those by Guizani et al. (2021), Shibru et al. (2015) and Gropp and Heider (2010), the results of their research revealed a negative effect of EV on bank leverage, which corresponds to the pecking order hypothesis. According to the trade-off hypothesis, there is a negative effect on EVs with leverage. Khan et al. (2021) argued that a company’s unreliable earnings could be anticipated to reduce its borrowing ability, as the company explicitly obligates its own to settle debt-related funds as it issues debt. When the firm’s revenues remain unstable, such payments may strain the company’s finances (Khan et al., 2021). Furthermore, the obligated company might not gain as much tax from negative earnings.
Nonetheless, empirical evidence yields conflicting results. Shibru et al. (2015) found a negative yet insignificant effect on EVs with bank leverage. In addition, Ahmeti et al. (2023) found a negative and significant connection between EVs and the capital structure of banks. Yet, EV and firm leverage appear to have a positive relationship, according to the POT. Sibindi and Makina (2018) argue that the assumption should be that the volatility of cash flows corresponds to the EVs. Thus, the bank’s retained profits must be financed. To avoid the ethical threat, it must collect funds through other sectors, beginning with the obligation markets. Companies with varying share prices have been inclined to possess uncertain perceptions aligned with that perspective. It seems reasonable to assume that such companies are exposed to significantly more unfair incentives. Supporting the prediction of the POT, Sheikh and Qureshi (2017) discovered a positive relationship between EV and bank leverage. Thus, this article’s hypothesis that:

Material and Methods
3.1. Data
The population considered consisted of all 16 registered local banks in South Africa. Yet, the article’s sample comprises 11 registered South African banks from 2012 to 2021, drawing convenience from a population of 16 registered South African banks. This period was chosen because it deliberately excluded the global financial crisis period because some capital structure factors, especially on the borrowing side were heavily influenced during the global financial crisis (see, e.g., Demirgüç-Kunt et al., 2020). Moreover, given that a lot has been done on capital structure during global financial crises, this article investigates other factors that could influence capital structure, like COVID-19 and that is the reason why the period includes the pandemic period. First Rand Bank Limited, Absa Bank Limited, Nedbank Ltd, Investec Bank Ltd, Capitec Bank Ltd, Standard Bank of South Africa, Grindrod Bank Ltd, Bidvest Bank Limited, Albaraka Bank Ltd, Sasfin Bank Ltd and HBZ Bank Ltd are among the 11 registered banks in South Africa. Due to challenges with obtaining financial data during the study period, five banks were excluded. These firms are deemed to be an adequate representation of the enrolled bank in South Africa over the period of 2012–2021. We extracted monthly and yearly financial and economic data from the South African Reserve Bank (SARB). The sample size for these registered banks is 11 within 10 years, resulting in 110 banking observations. Although the officially authorized banks in South Africa were chosen for the study, it was recognized that slight variations existed in the banks’ processes, as already pointed out.
The current research applied three capital structure measures as dependent variables: total debt ratio (TDR), long-term debt ratio (LTDR) and short-term debt ratio (STDR), following other scholars (Saif-Alyousfi et al., 2020). As Rajan and Zingales (1995) noted, the ratios of long-term, short-term and total debt divided by total assets tend to be highly adequate indicators of capital structure as opposed to the proportion of liabilities to total assets as it offers a more accurate estimate of the likelihood that the company is likely to go bankrupt in the future while also providing a significantly more plausible estimate of earlier sources of finance. However, EV and liquidity coverage ratio (LCR) were independent variables. This article uses the standard deviation of operating profits to measure EV to total assets. Other researchers determined the standard deviation employing statistics from the last 5 years, such as the most recent year (Harris & Roark, 2019; Saif-Alyousfi et al., 2020).
However, the present research estimated the standard deviation utilizing data from 3 years prior, including the present period. Furthermore, LCR is a proportion that is primarily required for execution to support short-term endurance (BCBS, 2009). Table 1 below shows details of dependent and independent variables and data sources.
Summary of Parameters as well as Proxies.
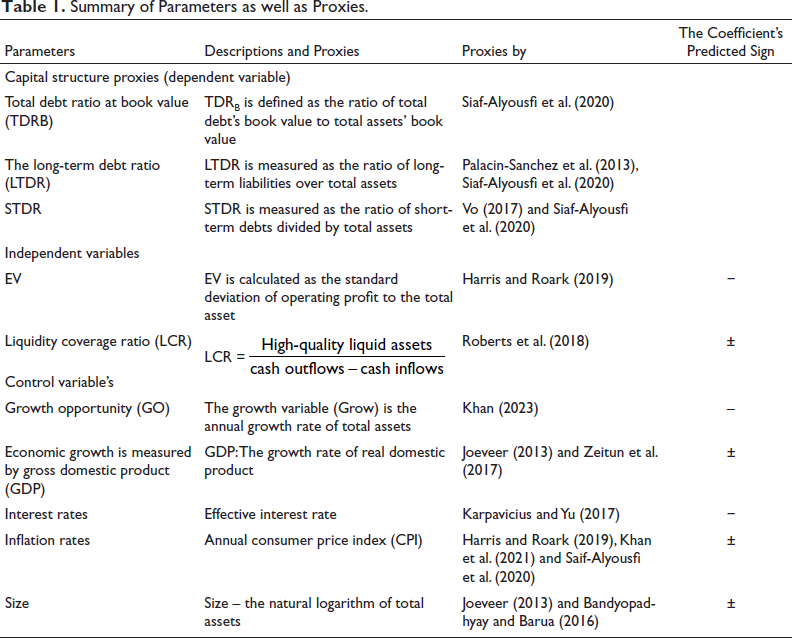
Summary of Parameters as well as Proxies.
3.2. Model Specification
This article employed the generalized method of moments (GMM). Capital structure by nature is persistent; these other studies Khan et al. (2023), Obadire et al. (2023) and Gropp and Heider (2010) concur with that notion, which uses GMM in the analysis of capital structure. The most appropriate model to test the relationship between capital structure and EV is the GMM because this can also deal with the problem of endogeneity when it comes to dynamic models. Why dynamic model, capital structure by nature is persistent the current level of the capital structure depends on the previous level. The generic GMM dynamic method has the following form:

where:
yit denotes the book value of the leverage measures for banks i in time t; xit is the vector of the explanatory variable for banks i for time t, demonstrating the banks-specific variable as well as control factors;
This article used the two-step GMM system estimating model of Arellano and Bover (1995) and Blundell and Bond (1998), with measure and lagged variables as instruments. The one-step GMM system for forecasting is thought to enhance Arellano and Bond’s (1991) GMM estimation method. Panel data regression analysis was then used to investigate the connection between EV and capital structure. We used a dummy variable to measure COVID-19 because we wanted to see if that period had some influence on capital structure. Moreover, we use a dummy variable, one for COVID-19 and 0 for the other period. The study intended to examine the impact of EV, LCR, GR, GDP, INF, interest rate (IR) and size on ‘banks’ leverage in South Africa by regressing capital structure (TDR, STDR and LTDR) with these variables. Mainly, for empirical analysis, the effect of leverage on the independent variable of bank-specific factors, macroeconomic factors, is typically evaluated using Equations (2)–(4).


where:
STDR it donates the STDR for banks i in time t, calculated by short-term over book value of total assets,
LTDR it indicates the LTDR for banks i in time t determined by long-term/total assets,
EV it donates EV for banks i in time t, calculated by the standard deviation using earnings,
LCR it is the LCR for bank i banks t,
Xij is a set of macroeconomic and microeconomic control variables determined at the end, such as growth opportunity (GO), interest, GDPR and inflation rates.
4.1. Descriptive Statistics
Table 2 shows the most important descriptive statistics for the indicators employed in this article. The bank’s TDR had a mean of 2.19, indicating the average proportion of assets funded by reserves and non-deposit debts, with a standard deviation of 13.1.
Descriptive Statistics.
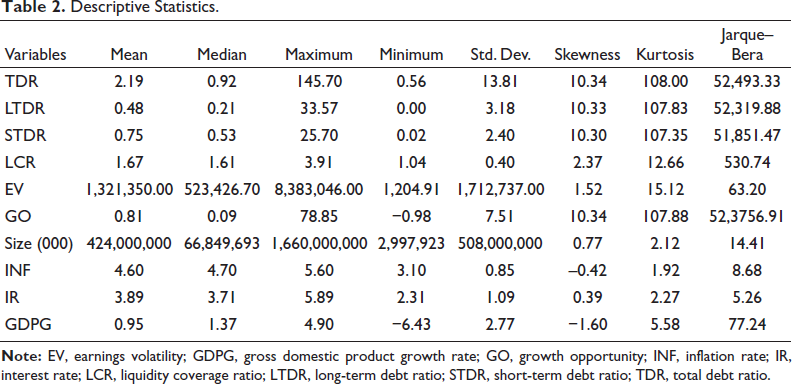
Descriptive Statistics.
The minimum TDR was 0.56, and the maximum TDR was 145.70, yielding a total range of 145.14. Yet, LTDR had an average of 0.48 and a standard deviation of 3.18. The minimum LTDR was 0.00, and the maximum LTDRA was 33.57. The average STDR was 0.75, with a standard deviation of 2.40. The minimum STDR was 0.02, and the maximum STDR was 25.70. This means some banks could maintain as little as 2% of their liabilities as STDs. However, banks may keep up to 26% of their liabilities as STDs. The mean of the LCR was 1.67. Despite the assumption that the gap in financing was positive, banks retained a significant amount of exceptional liquidity assets based on the average LCR ratio. Other banks, however, had been risk-averse, keeping a greater proportion of HQLA than 333% after expecting a negative asymmetry in their capital source. Yet the mean value of EV was 1,321,350,000.00, and the standard deviation was 1,712,737,000.00. This suggests that the average profit before interest and taxes increased for South Africa banks during the investigation was 1,321,350,000.00. The minimum and maximum values were 1,204,000.91 and 8,383,046,000.00, respectively. In terms of GO, the mean value was 0.81. This indicates an average growth rate of 0.81% during the study period. It was 7.51 for GO’s standard deviation. This implies that banks in South Africa will be better able to expand with a lot less risk. Concurrently, the overall asset growth throughout the analysis period increased from −0.98% to 78.98%. The average INF was 4.60%, with a standard deviation of 0.85%. Inflation illustrates the nation’s ability to keep prices competitive. A bigger economy means greater volatility in consumer prices, which can be particularly detrimental to those in need and small businesses because they cannot hedge against economic downturns. The average IR was 3.89, with a standard deviation of 1.09. The minimum IR was 2.31%, while the maximum IR was 5.89%. The average GDP growth rate (GDPG) was 0.95. In comparison, the standard deviation was 2.77. However, the minimum GDPG was −6.43, and the maximum GDPG was 4.90.
4.2. Correlation Metrics
As shown in Table 3, the correlation analysis illustrates the correlations between dependent and independent variables used in the banking sector. The TDR had a positive but significant relationship with the LTDR.
Correlation.
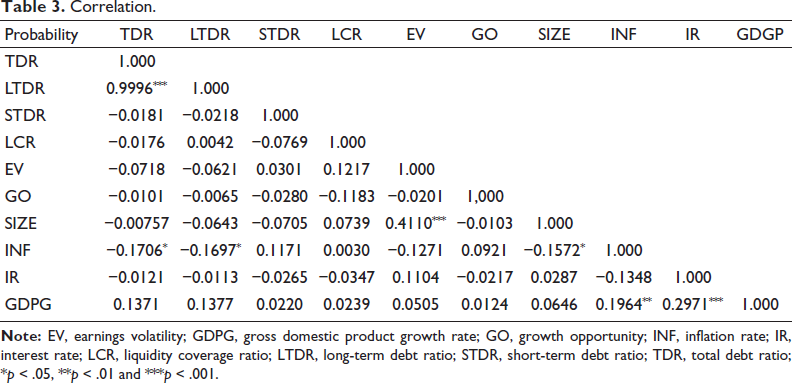
The TDR and STDR were negatively correlated with the LCR. However, there was a positive association between the LTDR and the LCR. Moreover, the TDR and LDTR were negatively associated with EV. However, the STDR was positively correlated with EV. The TDR was negatively and significantly related to the inflation rate (INF). Yet, INF was found to be significantly negatively connected with the LTDR. The possibility of multicollinearity was ruled out because the correlation coefficients were less than 0.7 (Siddik et al., 2017). Furthermore, VIF varied from 1.30 to 3.10 signifying the absence of multicollinearity. None of the parameters in the equation were significantly related. Some factors were omitted due to their insignificant effects.
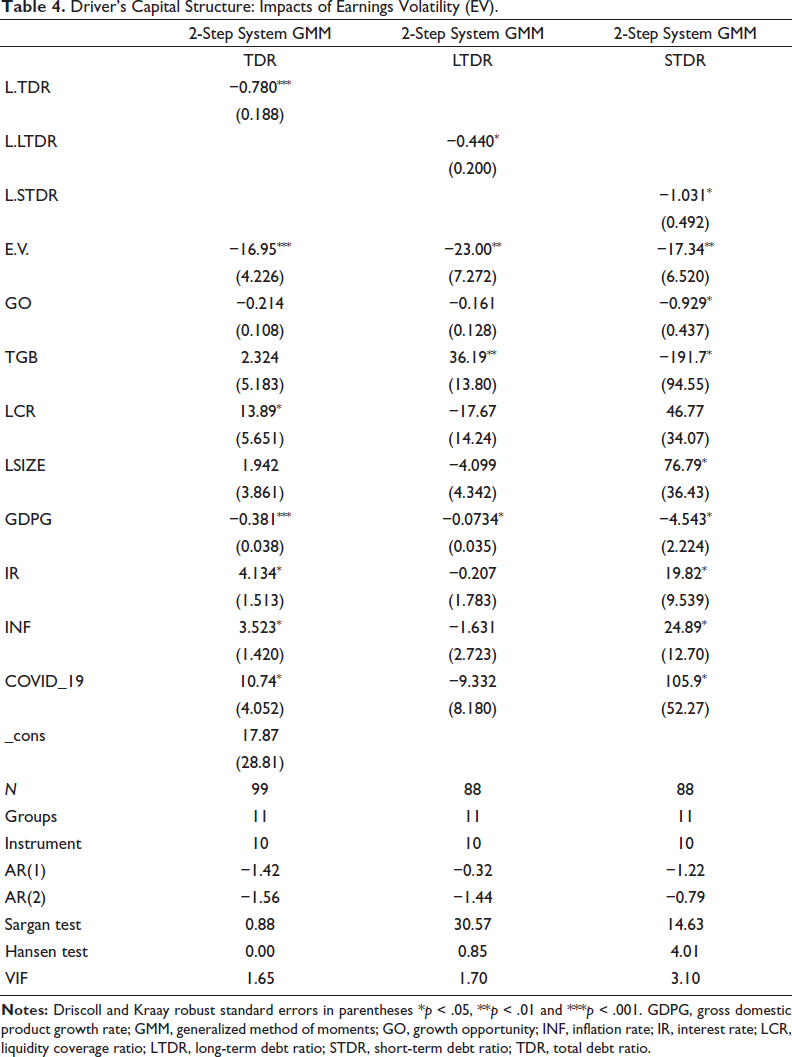
The result of the study revealed a negative and significant effect on the capital structure measures and their legged values of TDR, STDR and LTDR. This implies that ‘banks’ gearing ratios are persistent in a negative way. Yet, EV has a negative and significant connection with leverage. This suggests that if EV is substantial, banks are generally unable to issue debt as shareholders tend to be reluctant to invest in a bank with an increased risk of insolvency (Moradi & Paulet, 2019). Furthermore, the results align with the trade-off hypothesis. The idea in the association of non-financial entities case relates to this negative association in the bank case. The study results align with the finding of (Khan et al., 2023), who found a negative association between EV and bank capital structure. However, the study’s findings contradict those of Assfaw (2020) and Khan et al. (2021), who revealed a positive and significant impact of EV on bank leverage.
The results of the study indicate a significant negative relationship between leverage and GO. This implies that larger banks with better growth prospects are typically supported mostly by investors. The managers provide the bank’s access to cash and ultimately allow them to capitalize on novel expansion chances by preventing the use of external financing and agency costs. The results seem to support the findings of Khan et al. (2023), who showed a negative effect on GO and leverage.
Yet, there is a negative but insignificant association between LCR and STDR. Moreover, the research observed a positive and significant effect size with STDR. An increase in the bank size was associated with an increase in short-term gearing. The possible reason for this is that larger banks have a higher capital structure percentage of STD than small banks based on the overall usage of assets (Ali, 2019). The positive association coincides with the assumptions of the trade-off hypothesis, which maintains that bigger businesses spend more since they are thought to be too big to fail and can affect essential issues. The results support the findings of Khan et al. (2023) and Sibindi and Makina (2018), who showed a positive effect on bank size and leverage. In contrast to this study’s results, Abeysekara (2020) found a negative impact on bank size and leverage.
GDPG has a negative and significant impact on leverage with GDPG. Guizani (2021) emphasized that detrimental economic trends may significantly impact a bank’s statement of financial position, hindering sources of funding. These results contradict the trade-off principle, suggesting that businesses in quickly developing economies may have debt overhang and other financial challenges. The findings are consistent with those of Khan et al. (2023) and Abeysekara (2020), who discovered a negative effect of GDPG on leverage.
IR positively and significantly impacts banks’ gearing ratios, as measured by TDR and STDR. This means that increasing the IR raises the TDR and STDR, respectively. The result defies the findings of Karpavicius and Yu (2017), who found a negative nexus between capital structure and IR. Inflation rate was found to positively influence ‘the bank’s leverage’. A positive inflation rate value increases the TDR along with the STDR. According to Ali (2019), when inflation is substantial, bank debt rises; however, as the cost of debt grows with inflation, the rate of return after tax remains higher than the cost of debt. The findings contradict those of Almanaseer (2019), who observed a negative influence on INF with banks’ capital structure. A negative but insignificant relationship exists between INF and LTDR.
Finally, the result of this research indicates a positive and significant effect of COVID-19 on leverage. This implies that the equity capital of banks in South Africa was negatively impacted since banks increased leverage during the pandemic. This is contrary to the intuitive expectation that capital acts as a buffer to bank risk, and therefore, banks should ideally increase it during the pandemic period. The only reasonable explanation could be that equity holders preferred more bonds to equity, and hence, banks could increase their leverage quickly during the COVID-19 period. The findings contradict Mohammad (2022), who found a negative influence on COVID-19 with leverage. Given that COVID-19 has caused the South African GDP to contract by about –6.3% in 2021 before slightly rebounding with a 4.9% increase in 2021, this result aids in our knowledge of the financial leverage that governs banks in their reaction to the pandemic or any other exogenous shock in South Africa. Table 4 results showed a positive yet significant effect of LCR on TDR and LTDR.
Driver’s Capital Structure: Impacts of Earnings Volatility (EV).
The article aimed to determine the impacts of EV on banks’ capital structure from the period 2012 to 2021. Using the GMM approach, the research found a negative and significant relationship effect on EV with leverage. This implies that the higher the remaining volatility, the higher the ‘banks’ debt ratio. The negative connection confirms that banks with stable earnings tend to increase their gearing ratios as their capacity to assume risk improves. The results also demonstrate that banks with higher EV seek internal funding and a conservative capital-structure strategy to avoid bankruptcy costs. High volatility is associated with higher uncertainty and risk (Ghasemzadeh et al., 2021). The study also reveals a significant positive link between the LCR and ‘banks’ gearing ratio. Thus, the bank’s leverage increased with liquidity. High liquidity meant banks had sufficient cashflows to pay their obligations as they fell due, giving them the leverage to increase gearing. Also, it can be argued that the nexus between liquidity and capital structure depends on the leverage measure used as the dis-aggregation of TDR into LTDR and STDR resulted in insignificant relationships. The gearing ratio was found to increase with an increase in the size of the bank. Bigger banks in South Africa show that they can take more risk than smaller banks. In addition, deterioration in economic activities led to an increase in ‘banks’ leverage. Interest rates positively impacted the leverage of banks in South Africa over the period of analysis. The inflation rate was found to positively influence the bank’s leverage. Finally, this research found a positive but significant link between COVID-19 and leverage. This implies that South African Banks reduced their equity capital in favour of debt capital during the pandemic. In conclusion, these results contribute to the existing literature on ‘banks’ capital structure motion and EV in the context of unexpected economic shocks, specifically COVID-19. Thus, the study helps our understanding of ‘banks’ capital structure dynamics within the context of a pandemic. The results are useful to potential and existing investors, bank managers, and policymakers as they can determine the optimal capital structures given a projection of EV and prospects of unexpected economic shocks. Moreover, the findings will assist bank professionals in identifying micro- and macro-economic factors that influence leverage and help them determine the combinations that result in optimal capital structures. Furthermore, the drivers of capital structure for South Africa banks are mainly different from non-banking companies affirming the uniqueness of the ‘banks’ business model. Based on the study results, this research implies that banks are recommended to diversify to minimize earnings variance and grant them financing flexibility. This article was limited to the banking sector; future studies could focus on other firms. Lastly, this study used book value to measure bank capital structure; other studies can use both market value and book value to measure capital structure.
Appendix A
South African Average Bank Earnings Volatility Trends.
Footnotes
Author Contributions
Conceptualisation: NZM and GM; Methodology: NZM; Software: NZM; Validation: NZM and G M; Formal analysis: NZM; Investigation: NZM; Resources: NZM; Data curation: NZM; Writing-originality draft preparation: NZM; Writing a review and editing: G M; Supervision: GM; Project administration: NZM; Funding acquisition: NZ and GM. All authors have read and agreed to the published version of the manuscript.
Declaration of Conflicting Interests
The authors declared no potential conflicts of interest with respect to the research, authorship and/or publication of this article.
Ethical Declaration
The authors abide by all the ethics involved in this academic work and have not submitted it to any other journal.
Funding
The authors received no financial support for the research, authorship and/or publication of this article.