
Abstract
Indian Information Technology (IT) services sector today commands a huge share of worldwide IT sourcing spend. India stays to be a driving force for worldwide sourcing growth despite rising de-globalization moves across Western economies, challenges posed by East European nations, Russia, China and East Asia. A pertinent question that comes up is how will India take on the rivalry, while the Indian IT services sector seems to be content and complacent. One can see that the hunger for growth which we saw in the late 1990s and the decade of 2000s is fast eroding. India’s incentive to the world market was its economies of scale and cost advantage; however, the disruption created by the extant outsourcing or offshoring business model is fast receding. The Indian IT Services players turned complacent while competing as disruption and differentiation gave them a unique advantage and value proposition. This article builds on various articles in this domain while analysing how complacency affects competitive intensity, in turn resulting in a reduced intensity in market growth opportunity. This article endeavours to evaluate whether Indian IT services sector is trapped in its self-projected image leading to Narcissus effect.
Keywords
Introduction
In the past three decades, Indian Information Technology (IT) services players created barriers of value exchange for other competing countries to enter worldwide IT services market with cost arbitrage (Ang & Straub, 1998; Bhattacharjee & Chakrabarti, 2015; Cheng & Nault, 2007; Li, 2014; McKinsey Global Institute, 2005; Mithas & Whitaker, 2007), quality arbitrage (Bhattacharjee & Chakrabarti, 2015), English language arbitrage (Sharma, 2014) and economies of scale (Bhattacharjee & Chakrabarti, 2015; Kadam & Sudarsan, 2016). The worldwide sourcing market has been growing at around 3.7 per cent (Gartner, 2020) at a faster rate than the global GDP growth, which is also faster than the worldwide IT services spend. As indicated by the International Data Corporation—IDC (2019) and Gartner, Tier-II cities are competing with metro cities, while the businesses in smaller cities are growing at over 45 per cent which is giving intense competition to large cities with IT as its core expertise. Indian suppliers of IT services are, likewise, concentrating on turning India into an innovation hub in IT. Some of the pertinent questions are what can take the Indian IT services sector revenue from current US$100+ billion (Bhattacharjee & Chakrabarti, 2015; NASSCOM, 2016) to US$500 billion by 2025. Indian IT services is also expected to increase three times its current annual revenue to reach around US$300 billion by FY2025 (NASSCOM, 2019). Indian IT services sector with sponsorship from the Indian government is adding various ‘fire up’ programmes such as 10K start-up programmes (NASSCOM, 2019; Startup India, 2019). India’s ever-increasing well-trained IT workforce of more than 7 million engineers create a large talent pool to give the talent arbitrage (McKinsey Global Institute, 2005) as differentiator while competing. As indicated by the National Association of Software and Services Companies (NASSCOM), Indian IT services sector is equipping itself towards digital economy and changing itself as digital and innovation hub with over 65 per cent of the present workforce digitally skilled (NASSCOM, 2019). The stated facts indicate that Indian IT services sector still has some advantage over other competitors; however, it is fast eroding due to various factors; this article tries to build an understanding of the same.
With this context of fast-eroding arbitrage along with complacency in the industry, this article focuses on building a model to map the market growth opportunity. The first section of the literature review (LR) covers an in-depth analysis of various academic studies on worldwide IT services wherein LR will focus on Indian IT services industry. The second section is the Objectives section, which covers the determination of particular arbitrages and its impact along with impact of market disruption on research objectives. The third section details out the theoretical framework to underline theories behind the proposed scope of research followed by the methodology section which covers the research approach, hypothesis, research methods and selection of research data, instrument development, data capture and empirical model. The Analysis section follows with discussion on statistical models, tools and techniques. Conclusion, managerial implication and future research direction sections are described at the end of the article.
Literature Review and Identification of Research Gaps
Worldwide markets have begun taking cost reduction as a major measure as global recession is looming large in the global market; worldwide spends are decreasing with negative growth rate along these lines affecting worldwide IT spends as well. However, worldwide IT spends may have seen a differentiating development of single digit according to Gartner’s newsroom report 2020. Worldwide IT spends have not seen any momentous recuperations despite the grounded development in the pace of US economy. Notwithstanding, contrasted with worldwide IT spends and worldwide sourcing development, there is some silver lining as per NASSCOM (2016) and Gartner Facts and Figures Report (NASSCOM, 2019). India is still, and will be, the leading destination for few more decades with 55 per cent of the share of the worldwide IT services outsourcing as worldwide IT services outsourcing industry (Asher & Nandy, 2007; Bhattacharjee & Chakrabarti, 2015; NASSCOM, 2016). Naturally, the above-mentioned facts and projections will result in a critical soul-searching question on whether India can sustain the momentum. Han et al.’s (2011) research work suggests that the impact of global economic turmoil has not yet been understood with a possibility of global depression, advent of disruptive technologies, geopolitical instability, underestimation of domestic market size, US immigration and regulatory policy vulnerabilities, and UK-Euro BREXIT progress wherein worldwide economies are gradually closing their entryways to IT service providers.
Ang and Straub (1998) discusses cost arbitrage as one of the major factors of IT outsourcing in the 1990s. Additionally, the development of worldwide IT services may endure relocation of various delivery centres, service centres and sales offices due to anti-globalization moves and from protectionist senses of current US administration. Further to this rising costs of wages, automation, inflation and standard of living in some of the high-growth emerging economies are pressurizing the profitability of the entire IT services sector. Davis et al. (2006) and Shleifer and Vishny (1997) research articles talk about arbitrages, market opportunities and benefits of outsourcing; however, authors have seen some research gaps in terms of the building model for outsourcing arbitrages; similarly most papers focus only on cost arbitrage keeping aside other industry arbitrages. Cheng and Nault’s (2007) paper discusses more on IT outsourcing value proposition centred towards downstream yield; however, their study had considered barely any factors which may affect IT profitability. Similarly, one can see some major research gaps in Gao et al. (2010) where data are skewed towards large IT service providers; this study missed out on the quality arbitrage and other industry arbitrages. Both the studies conducted by Li (2014) and Singh (2014) talk about the share of wallet, which is one of the major factors in IT outsourcing sector. As per NASSCOM 2014 Annual Report, the IT spends from the Banking and Securities, and Manufacturing and Natural resources have contributed to the tune of US$500 billion each, while government and allied divisions and communication and Media Services have not been far behind with nearly US$500 billion IT spends. Insurance, Retail, Utilities, Transportation, Healthcare IT, Wholesale Trade and Education constitute the remaining US$800 billion opportunity space. Authors of this article focus on the erosion of existing arbitrage levers for IT service providers leading to loss of market opportunities.
The Indian economy was opened up in 1992 by the then Indian government, resulting in the birth of the IT Industry in India. The IT Industry that was based out of India thrived on the dotcom opportunity during the period 1998–2000, resulting in the outsourcing wave primarily due to the language arbitrage because a vast majority of the Indian engineers spoke professional English that led to the creation of the global delivery business model (GDM) by Indian IT service providers (Bhattacharjee & Chakrabarti, 2015). Global delivery was driven by scalable talent (McKinsey Global Institute, 2005) and standardized processes. By 2009–2010, competitive advantage by way of language arbitrage was eroding (Sharma, 2014). Bhattacharjee and Lin (2014) proposed a unified model of IT services while focusing on advances in IT continuance research by theorizing and validating the unifying model. Authors’ hypothesis is that IT services market space has changed dramatically, drifting away from low-cost location to value per dollar locations. Automation has resulted in the reduction of jobs at the bottom of the delivery pyramid. Similarly, standardization has led to reduced quality arbitrage (Bhattacharjee & Chakrabarti, 2015), resulting in the intensity of competing nations. As per Gartner Facts & Figures Report (NASSCOM, 2019), the IT sourcing market is seeing a significant slowdown trend wherein software spending is growing at 6 per cent, with Software Services growing at around 7 per cent to total US$350+ billion, which still provides legroom to Indian IT service providers. Although many IT service providers tried to provide value addition as the next wave of arbitrage, it did not result in any new business models. Thus, the growth rate of the IT sector slowed down, reaching a new normal of 8–10 per cent growth. The authors, through this research work, set out to validate the innovation arbitrage (Bhattacharjee & Chakrabarti, 2015) to be the next wave for the Indian IT services sector. As Sharma (2014) analysed a pertinent research question: will Indian IT service providers move up the value chain or make significant difference to the end customer? The Organisation for Economic Co-operation and Development (OECD) Group of 20 (G20) Innovation Report (OECD, 2016, November 4) highlights the facts that there are still economies of scale keeping in mind quality, unemployment and poverty of informal sector and government public policy frameworks.
Objectives
The objectives of this research work are to determine the impact of arbitrages on competitive intensity and to understand the resulting difference it makes on market growth opportunity. The study also focuses on the impact of differentiators and disruption (such as disruptive business model, disruptive innovation, policy changes and social emergencies) on competitive intensity and market opportunity. Research objective also focuses on how complacency and competitive intensity impact strategic intent and strategic focus, which may result in varied market opportunity. Worldwide strong resistance to globalization moves leading to political rhetorical environment in developed economies have caused growth challenges to emerging economies; while keeping this in mind, the study also delves into the levers for Indian IT service providers that have created a model which the Indian IT service providers can refer to.
Theoretical Framework
Authors driven by the objectives as described in the previous section worked on identifying some of the base papers, thus identifying base theories related to the services sector, in particular, IT services. Melville and Ramirez (2003) proposed a conceptual framework to explore the processes of inter-firm IT-value generation. Similarly, Montoya et al. (2010) proposed service-profit chain as a conceptual framework to put forth their research ideas while showcasing how arbitrage helped Indian IT services sector to gain significant market share in the global IT spend. The study performed by Lee and Lim (2001) shows that the catching up by latecomers to the world of technology like India does not necessarily follow the path of the advanced countries, but it may skip some stages or even create its own path that differs from that of the forerunners, which is also consistent with product life-cycle theory (Utterback & Abernathy, 1975; Vernon, 1966). Lee et al. (2014) also show that Indian firms were able to create their own unique ‘path’ or business models like the GDM in IT services and achieve leapfrogging from body shopping to offshoring to multi-site multi-country seamless delivery model. Raychaudhuri and Farooqi (2013) highlighted Service Improvements theory wherein the theory focuses on keeping up to date with technology, processes, service quality, quality and process arbitrage.
Authors’ research also brought some of the seminal works in IT based on papers in the areas of global spends like technology or IT adoption which may impact global IT spends. Venkatesh et al. (2003) summarize some of the theories of IT continuance, theories of IT acceptance, innovation diffusion theory, technology acceptance model (TAM), theory of planned behaviour (TPB), social cognitive theory and the unified theory of technology adoption (UTAUT); however, Bhattacharjee and Lin’s (2014) paper captures behavioural patterns while analysing the IT spend pattern. They propose the unified model of IT continuance as a theory which states that ‘crossover effects between experiential response and reasoned action constructs, such as between disconfirmation and perceived usefulness and between satisfaction and CI (conscious intention). These crossover effects are of theoretical interest, because they suggest that experiential response may not only influence continuance behaviours, but also bias the reasoned action component of behavior’. The research conducted by John et al. (2014) addresses the organizational behavioural issues pertaining to the intensity and success factors relating to the offshoring model wherein they propose the theory of SET offshoring while combining communication and trust inside an organization shared values of organization and partnership with clients and ecosystem players lead to offshoring success. Ambastha et al. (2004) ‘use the competitiveness framework and attempt a taxonomy of Indian software firms, by constructing Competitiveness Composite Scores for different firms’ to understand the competitive intensity. Authors further expand to such theoretical framework to understand various links between some of the major constructs or factors emanating from the study.
Methodology
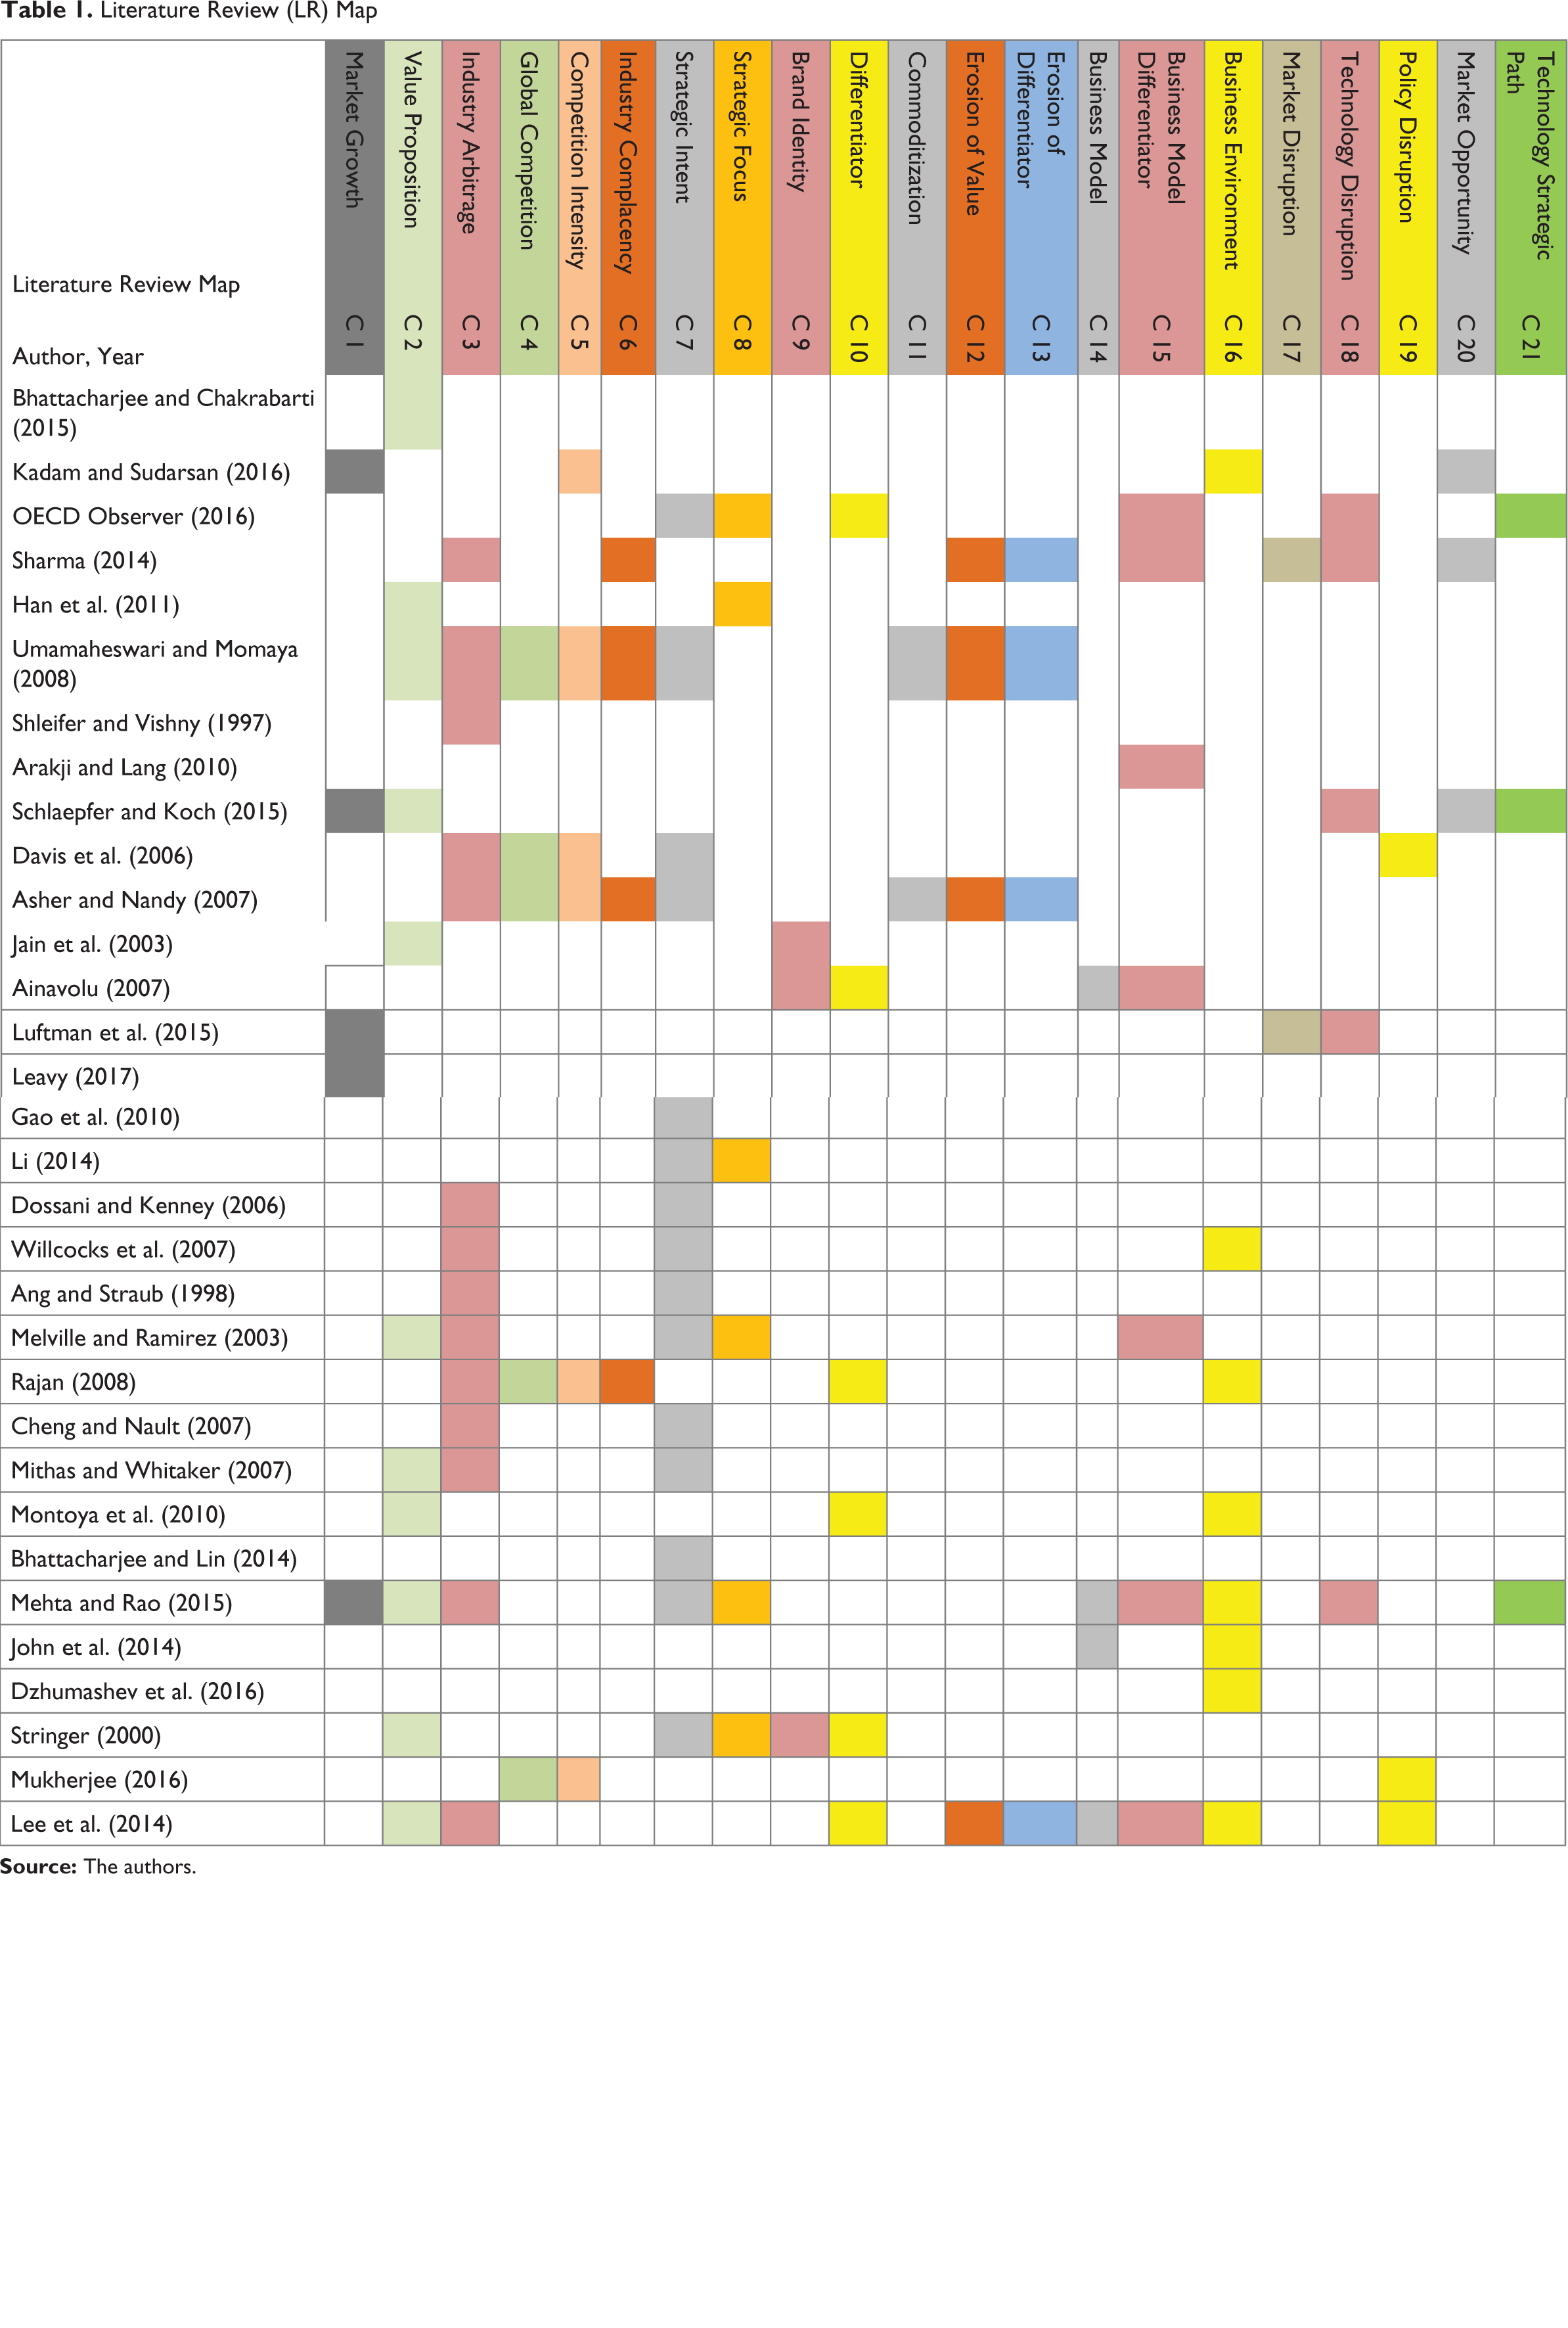
Authors have used cross-sectional information on IT services market development, market size and market disruption. Authors detailed LR work as represented in Table 1, resulting in the discovery of various constructs wherein some of the key constructs also emerged from experts’ in-depth interviews. In total, 21 constructs emerged from the LR and in-depth expert interviews. Authors used purposive sampling while selecting a limited number of experts in the IT domain. Generally, IT domain experts were not below the level of chief executive officers (CXOs) in their respective companies. Authors also used quota sampling method to ensure majority of stakeholders such as end customers; IT service providers; government IT public policymakers; IT entrepreneurs; IT researchers; and industry bodies such as confederation of Indian industries (CII) and NASSCOM as well as IT industry consultants. Research design chosen was mixed method approach along with descriptive studies. In the beginning, the authors used structured questionnaire based on interviews with six of the top IT services companies’ CEOs/CXOs, followed by interviews which had broader guidelines-based input from the first six interviews. Research approach was pragmatism (both deductive and inductive) coupled with interpretivism. Research methodology adopted was quantitative data collection methods through survey while using tools such as Survey monkey™ and WhatsApp™ and other online Methods. Authors also administered questionnaire-based interviews on phone as well. Authors sent out questionnaires through e-mails and WhatsApp to a large number of industry leaders to answer.
Authors’ survey instrument emerged from Table 1, wherein, for each variable, there was theoretical background as shown in Theoretical Framework section. Umamaheswari and Momaya (2008), Rajan (2008) and Bhattacharjee and Chakrabarti’s (2015) works inspired the scales and measures. The authors’ operationalization of constructs was based on the intent emerging from each construct. The authors’ study had both open-ended and close-ended questionnaires, which gathered mainly quantitative information; however, some important qualitative data were also captured through open-ended questions, The overview had 20 questions that gathered brief data on socio-economic information wherein the study questionnaire was sent to IT industry specialists such as CEOs, CMOs, CFOs, VPs, innovation leaders, domain experts and mid-level supervisors. Overall, 372 C-level executives from different Indian IT services companies, global in-house centres, consulting companies, IT research organizations and industry bodies have responded with rich information. It was also observed that no industry expert had exited after entering the survey, as well as most of the survey questions were answered by the respondents.
One of the major hypotheses of this study is India’s IT sector’s complacency, resulting in reduced competitive intensity leading to the loss of strategic intent, and thus reduced strategic focus impacting the intensity in market growth opportunity. India’s IT sector today dominates global sourcing of IT services with significant market share as per Gartner Facts & Figures Report (NASSCOM, 2019). Authors attempt to validate complacency in IT services sector with the domination of India as an outsourcing destination for worldwide IT services sector resulting in reduced competitive intensity. Global economy does not shield the IT industry from disruptions—like technology disruption (NASSCOM, 2019) or business model disruption. The authors try to understand the relationship between competitive intensity, strategic intent and strategic focus, which together have a significant impact on market opportunity for Indian IT services sector. Companies while competing in the marketplace try to create differentiators and economies of scale; however, strategic planning and execution play a key role in market share and wallet share (Singh, 2014). This study focuses on the intent, level of intensity and focus in terms of long-term planning among the Indian IT industry players.
Literature Review (LR) Map
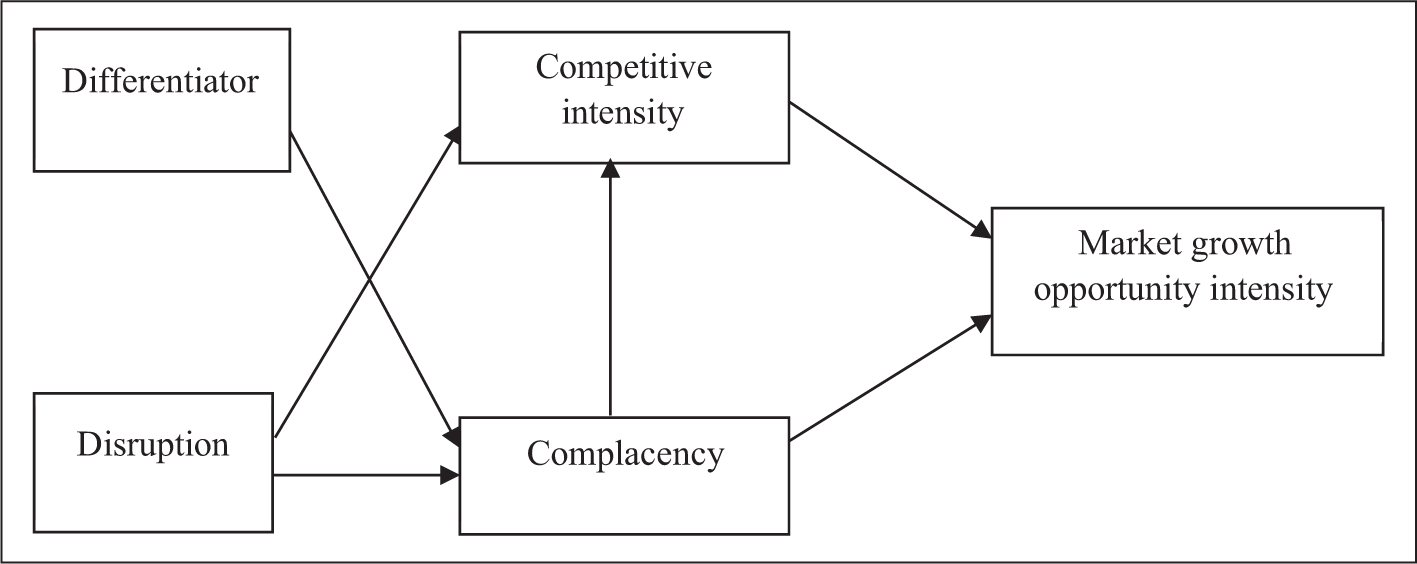
Authors have proposed the conceptual model as shown in Figure 1 while considering the ‘market growth opportunity intensity’ as a dependent variable to try to find out the link between some of the key constructs. The authors’ research work proposes any disruption (which is an independent variable) in market either by a company or by its competitor, resulting in varied value proposition, sustained competitive advantage and a changed ‘competitive intensity’. Complacency creeps in after the critical period of disruption and differentiation recedes. Complacency results in reduced competition among market players, resulting in reduced competitive intensity. Similarly, differentiation in marketplace may bring in complacency resulting in reduced competitive intensity, which will also result in reduced or loss of ‘strategic intent’ in effect may impact severely ‘strategic focus’. Any loss of strategic intent and strategic focus may result in market erosion and loss of market growth opportunities, thus impacting ‘market growth opportunity intensity’. Authors propose key constructs—‘disruption’ and ‘differentiator’ as independent variable and ‘competitive intensity’ and ‘complacency’ as moderating variables.
The conceptual research model as proposed in Figure 1 shows that disruption—technology, economy, social, pandemic, political, policy—may impact directly, leading to increased or decreased value proposition in market. Similarly, disruption also leads to complacency among market players, leading to reduced competitive intensity. As Rogers (1995) highlights that technology innovation brings in uncertainties, leading to disruption, reiterating the disruptive innovation. Behera et al. (2016) say that ‘service firms which implemented IT tools and techniques early achieved more turnover, thereby grater market share from innovation/adoption. These firms are able to better commercialize their service even if their most important innovations/adoptions are supported by vendors to some extent. Late followers (firm-first) would have higher sales from innovation by introducing services with high original content’. IT service provider’s monopolistic play may also create differentiator, which in turn leads to reduced competitive intensity. Value proposition may also lead to distinct strategic identity demonstrable as strategic intent, and unique value proposition also leads to strategic focus towards market. Authors have tried to bring in competitive intensity into the study to see the effect of complacency on competitive intensity and in turn its impact on strategic intent and strategic focus.
Analysis
Authors conducted exploratory factor analysis wherein factor loadings in either the unrotated or rotated represent the degrees of association, which is correlation of each variable with each factor while loadings take on a key role in interpretation of the factors. Unrotated matrix shows that it did not maximize the loadings of each variables on one factor; thus, a rotation technique was applied to improve the interpretation through rotated factor matrix. Factor loadings in rotated matrices represent the degree of associations or correlations of each variable with each factor. VARIMAX rotation was used and its impact was observed along with ‘component transformation matrix’. The communalities in the component matrix with greater than 0.7 for most factor groupings and greater than 0.5 as exceptions were chosen. By analysing the ‘scree plot’, it was decided that 5 Factor groupings share more than half of the variance. The authors’ assumption was validated with exogenous variables being disruption, differentiator and endogenous variables being complacency, competitive intensity and market growth opportunity intensity. By using VARIMAX rotation method, one can state that each of the variable has a significant loading as above 0.5 on one factor, selecting data reduction methods and reliability tests. Authors were able to test the reliability of the selected factors’ groupings (disruption, differentiator, endogenous variables being complacency, competitive intensity and market growth opportunity intensity).
Component factor analysis is based on the initial computation of a complete table of intercorrelations among variables, which is also referred to as correlation matrix. The correlation matrix is then transformed through the estimation of factor model to obtain the factor matrix containing factor loadings for each variable on each derived factor such as loadings resulted from disruption, differentiator and endogenous variables being complacency, competitive intensity and market growth opportunity intensity. The loadings of each variable on the factors are then interpreted to identify the underlying structure of variables. The anti-image covariance which is a correlation matrix shows that correlations and communalities are greater than 0.5; hence, these are good for analysis. Extraction method principal component analysis can be used to explain how much each variable can load after the extraction.
The Cronbach’s alpha for all variables was 0.722, which means 72.2 per cent of the variability in a composite score while combining 6 scales (adopted scales from Likert scale) is a true score variance which means that it is also reliable or internally consistent variable. The Cronbach’s alpha based on standardized items is 72.9 per cent, which is calculated under the pretence that all items have the same variance; however, some cases have roughly the same variance. Most frequently acceptable Cronbach’s alpha is 0.70 (70%), that is, sometimes, where large numbers of variables are present, even 0.5 may be acceptable. The inter-item correlation matrix shows that all the variable items in the table are positively associated which confirms with model fit. The item total statistics table shows the corrected item total correlation is almost 0.5, which means inter-correlations are acceptable. The same table also shows that if the authors delete ‘TaperMarketGrowth’, then the Cronbach’s alpha inter-correlation is very high—almost nearing 0.7 wherein original Cronbach’s alpha is 0.722, which indicates again that the solution is acceptable. Similarly, the authors have tried for adopted Likert scale for differentiator, wherein Cronbach’s alpha after deleting one variable is not higher than the original 0.722, which means there is no redundancy.
Along with checking Cronbach’s alpha for 0.7 the F-value and significance were also checked to make sure these factors represent the true model. As the significance was less than 0.5, it was treated as significant, and thus further analysis was done. Authors observed that no variable has values more than 0.9—it means there is no overlap of variables measuring the same; none of the two variables is measuring the same thing. The authors also state here that variables which do not have significant correlations may not be part of any factor, and if a variable has a large number of correlations, it may or may not be part of several factors, and one needs to note these patterns. Similarly, to make sure that the model fits well, the even regression analysis with the ‘Enter’ method was undertaken to ensure that the model fits. The model summary shows that R-square and R are above 0.9, which means that the model fits well.
Authors conducted the structural equation modelling (SEM) analysis using IBM™ AMOSS™. By plotting the histogram, one can see that data are normally distributed and so we can assume safely that data are good to proceed with. As the first components method of extraction was done to decide to reduce the number of variables, one of the key decisions was to select the number of components to be retained for further analysis. Scree test criteria known as ‘Scree Plot’ was used to decide the number of components to be retained. One can also come to the same conclusion by looking at the scree plot—five factors can represent a good model for this research objective. Test of validity or construct validity would be the final stage to test the validity of the structured model and its corresponding hypothesized theoretical relationships. One needs to analyse the convergent validity of this measurement model by computing the average variance extracted AVE. AVE should be 0.5 or above so that validity of the structured model is achieved by analysing for hypothesis. All the composite reliability scores are analogues with Cronbach’s alpha and it is more than the minimum required—0.7. The AVE average variance extracted varies from 0.5 to 0.6, while the minimum recommended is 0.5 (Fornell & Larcker, 1981). Thus, all constructs demonstrate good internal consistency and hence reliability. One can assess the overall significance of the correlation matrix with Bartlett test and the factorability of the overall set of variables and the individual variables using the measure of sampling adequacy (MSA). As factor analysis (FA) will always derive factors, the objective is to ensure a base-level statistical correlation within set of variables, such that the resulting factor structure has some objective basis. In this, one can see Bartlett’s test that shows that the correlations, when taken collectively, are significant at the 0.0001 level. MSA also looks at pattern between variables wherein overall MSA falls above 0.5, Bartlett’s test of sphericity significance level is 0.06 which is more than the significance level of 0.05, so it is non-significant hence one can accept the H0 null hypothesis. Reviewing the results shows that the p-value of Ha is 0.00, which is less than 0.05 (alpha value) and hence this hypothesis is accepted. The p-value of Ha1 is 0.679, which is more than 0.05 (alpha value) and hence this hypothesis is rejected. Construct reliability (CR) which is defined as sum all factor loadings wherein square of this sum is known as SSI and sum all error variances of each indicator is known as SEV wherein CR = SSI/(SSI + SEV), calculating CR for each latent variable results values above 0.9 so which are all variables (instruments) values above 0.8 can be said valid thus convergent validity is satisfied, all CR of latent constructs are reliable thus one can say The proposed SEM is valid and can be accepted as overall model fitness is proven as NFI, EFI, IFI, TLI, CFI is almost touching 0.9 or greater. The regression weights table shows that many p-values are significant; hence, it also signifies the significant effect on factors. The result shows that CMIN/df value is 0.910 and is positive value which shows that model is fitting and p-value of default model is 0.741 is a good value to indicate model fit. The RMR/GFI table show that GFI value is 0.969 which is goodness of fit index and AGFI (adjusted GFI) is also above 0.7 with value 0.958 which indicate model fit. The baseline table shows that comparative fit index (CFI) value is 1. Thus, the following table shows root mean square error of approximation (RMSEA) is approaching 0, which indicates model fit. In this case, chi-square being exactly as large as the df, the denominator gets zero, and thus the whole RMSEA becomes zero. The non-centrality parameter represents the crucial idea behind fit indices as it saves some amount of model-data inconsistency behind random sampling error to be expected and, thus not problematic. Parsimonious comparative fit index (PCFI) is above 0.7 which is acceptable The PCFI is the result of applying the parsimony adjustment to the CFI: (James et al., 1982)

where d is the degrees of freedom for the model being evaluated, and db is the degrees of freedom for the baseline model.
The discriminant validity test result table shows that Wilks’ lambda is statistically significant as it is above 0.7 for each of the predictor variables like TaperMarketGrowth, SustainMarketGrowth and so on. The group statistics table shows that mean values of 2.0 is higher than 1.0. Similarly, the mean for scale value 3.0 is higher than scale value 2.0 and so on. The below standardized canonical discriminant function coefficients matrix tables show that SustainMarketGrowth with a score of 0.556 is the best predictor for function 1 and StartegicFocus3 is the worst predictor when it comes to function 1, but StrategicFocus3 is the best predictor for function 2. The structure matrix table shows that none of the values are below 0.3, and hence the solution for function 1 is acceptable. Using the unstandardized coefficients from the table, we can write Discriminant Function Equation like regression as follows. Discriminant function equation = A0.689x + B0.387y + C0.646z + D0.172p, wherein x, y, z and p would be the values of predictor variables, and A, B, C and D would be constants. The classification results of discriminant analysis shows that 56.7 per cent of the test results are correctly classifieds, so though the score could be higher, it is still acceptable as it is almost 60 per cent.
Discussion
The Cronbach’s alpha value of around 0.7 shows that complacency and competitive intensity are significantly affecting the market growth opportunity intensity. Complacency leads to reduced competitive intensity, which poses a threat to the survival of existing structure of the Indian IT services sector. As far as maintaining status quo of the way of doing business, it is statistically insignificant and needs to be understood in the context where industry leaders feel that the Indian value proposition will help the industry survive for the next decade; however, the differentiators are fast eroding, leading to complacency. The Cronbach’s alpha value of around 0.7 also shows that disruption resulted in complacency in the Indian IT services sector, which resulted in varied strategic intent and loss of strategic focus. The results also demonstrate that disruption resulted in reduced intensity while directly impacting competitive intensity, in turn reducing the market growth opportunity intensity. As proposed, the model’s SEM results are a model fit. Authors suggest that the mood in the Indian IT services sector showcases mixed response with 30 per cent or more saying that the Indian IT services industry will touch US$300+ billion in 2020–2021. One can also see that more than 50 per cent respondents say that the Indian IT services industry will cross US$400 billion quite soon in a few years from 2020; however, the model suggests that complacency has crept into the industry, resulting in reduced competitive intensity leading to reduced intensity of market growth opportunities.
Conclusions
This study clearly brings in lack of innovation in business model by the Indian IT services industry; complacency has blurred the vision to identify large market opportunities, thus reducing intensity of growth. Indian IT industry players are complacent in identifying the large scalable next big wave of opportunities that will power the market to touch the trillion-dollar market size. Creating disruption and differentiators in the market resulted in competitive sustainable advantage; however, complacency will eventually erode the befits of sustainability. This study highlighted the loss of intent and focus due to complacency while competing, resulting in reduced competitive intensity leading to lack of intent of growth opportunity in the market. The study concludes that the Indian IT service players can leverage the suggested model to understand the relationship between complacency and competitive intensity with market growth opportunity intensity.
To date, there are not many studies that have attempted to map the market growth opportunity intensity, though there are several studies on sizing market growth or market opportunity. The authors also bring in various academic constructs pertaining to the global IT services sector. Most research works have not taken into account complacency and competitive intensity as key constructs while analysing the global IT services sector. This article attempts to build a model which links the independent variables such as differentiating factors of IT services players, disruption in the IT services market, mediating variables like complacency while competing, competitive intensity and dependent variable as market growth opportunity intensity.
Managerial Implications
Authors’ proposed conceptual model which is a also empirically tested, clearly describes practitioners (managers) the levers they have to improve market growth opportunities; the model suggests managers should not only focus on disrupting the market with innovative solution but also should focus on not being complacent. Similarly, differentiators created while competing may result in complacency leading to reduced intensity while competing. Thus, they should focus on reducing complacency while trying to create sustained competitive intensity. Managers can understand how ‘intent’ can lead to execution focus resulting in expanded market opportunities based on this proposed model. Through this model, authors also highlight that even though both differentiation (in solutions) and disruption (through business models) may be sustainable as of now, the status quo may still result in stagnation of market growth opportunity because of loss of intent while competing.
Future Research Direction
Authors’ current research work limits itself to Indian the IT services sector and global IT spends, and the proposed conceptual model has not been tested in other industry sectors. Researchers can take the empirically tested conceptual model, survey instruments and questionnaires to other industry verticals. Research scholars can experiment using adopted parameters to align to their areas of focus. Authors have not extended the research work to build the model to identify the next wave of industry arbitrages like innovation and next-generation technology. Researchers can build models by extending the research using mixed method approach with both qualitative and quantitative research methods. Research scholars also pitch for project funding to consulting companies wherein sample size can be increased to few thousands from the current 372 (CXOs) to further expand the model. However, authors suggest that researchers should capture valuable qualitative data that may be of immense value to further expand and empirically test the model.
Footnotes
Acknowledgement
The authors are grateful to the anonymous referees of the journal for their extremely useful suggestions to improve the quality of this article. The authors also would like to thank the Indian Institute of Management, Kashipur team, Mr Ramnath P. K. and Mr Sunil Pathak (both executive research scholars and IT Industry experts) for their in-line comments, Prof. Madhurima Deb for inputs on the questionnaire and scales, and Prof Mridul Maheshwari for her inputs on measures of scales.
Declaration of Conflicting Interests
The authors declared no potential conflicts of interest with respect to the research, authorship and/or publication of this article.
Funding
The authors received no financial support for the research, authorship and/or publication of this article.