
Abstract
This paper attempts to measure and report the extent and magnitude of tax evasion in the medical sector and to be compared with other selected human-to-human (Η2Η) life services in the Greek economy. Specific household expenditures for human (Η2Η) services for the period 2011–2017 were analysed, using data from the annual ‘Household Budget Survey (HBS)’ of the Hellenic Statistical Authority (ELSTAT) and were compared with the financial administrative data from the ‘Statistical Business Register (SBR)’, which is updated on an annual basis with data provided by the tax authority, depending on the case-specific characteristics of each sector under study that have been taken into account in the calculations.
The research showed that the participation of doctors in the phenomenon of tax evasion as a whole has been declining in recent years while other human economic activities are responsible many times over for the perpetuation and exacerbation of the phenomenon. The annual tax evasion on average for the period 2011–2017, for the medical sector, is estimated to amount to €565.6 million (0.31% of the Greek GDP – mean value of the same period), while for the ‘accommodation services (hotels)’ sector, it is estimated to €3.3 billion (1.84% of GDP), to €6.8 billion for the catering sector (3.76% of GDP), to €2.1 billion for the education sector (1.18% of GDP), to €87.3 million for the hairdressing/other beauty treatment services of the personal service sector and finally to €50.3 million for the funeral and related services sector.
Introduction
Through the enforcement of taxes, each state seeks to ensure the smooth flow of planned budgetary revenues as the main source for meeting its needs, in serving the public interest. Over time, however, states come to face the efforts of their natural and legal entities to evade taxes, driven by a variety of factors. The intensity of the phenomenon varies from period to period, from state to state, from the business sector to business sector and so on, and the measurement of the phenomenon is always a challenge for the researcher. The consequences of the phenomenon of tax evasion are multifaceted. They extend to the economy, society and the state itself (Feige, 1989).
The current study aims to identify tax evasion in the provided economic activities of specific human-to-human (H2H) life services, provided by business entities, exclusively to individuals, and especially the provided medical services of the medical sector by comparing them in relation to other economic activities such as education, accommodation, recreation, hairdressing and other beauty treatment, funeral and related services, and so on, which for the purposes of our research are grouped under the general category ‘H2H life services’.
Conceptual Definition
The concept of tax evasion, in financial terms, is related to unlawful acts, which are adopted in order for a person (natural entity or not) not to fulfil, in full or in part, his tax obligations, by not paying to the competent authorities the amounts due to him (Chiumya, 2006; GIZ, 2010). In legal science terminology, tax evasion is that illegal attempt not to pay all or part of the amount, which is taxable to a citizen. The taxpayer refuses to present his true tax ‘overview’ before the competent state bodies, thus seeking to evade the payment of his legal tax obligations. In fact, the concept of tax evasion, as a criminal act in a strictly legal sense which is also an unlawful punishable behaviour, exists when tax evasion exceeds a monetary limit set by the legislator (e.g., for the case of Greece this holds when income tax exceeds €100,000 and value added tax (VAT) €50,000) or concerns the issuance of fictitious tax documents. Otherwise, it constitutes a financial violation which entails only administrative sanctions and fines (Finokaliotis, 2015).
Research Methodology
Basic Methodological Techniques for Assessing the Shadow Economy
The methods of detecting shadow economy phenomena and tax evasion in particular can be classified in various ways, such as distinguishing between methods that use microeconomic data and methods based on macroeconomic variables or between accounting and econometric methods (Barthelemy, 1988; Carter, 1984; Frey & Schneider, 2000).
Two principal methods are distinguished, namely, direct and indirect. The direct method attempts to determine the extent of the informal economy by researching the behaviour of taxpayers. More specifically, anonymised data are collected from those involved in the shadow economy, through investigations or audits carried out by the tax authority. The main direct methods in use are voluntary interviews, questionnaire surveys and tax audits (Frey & Pommerehne, 1984).
Indirect methods are based on the fact that although informal economic activities are not directly visible and measurable, they affect all areas of economic life (Tanzi, 1999).
Therefore, the degree or change of financial figures caused by tax evasion is an indication of its magnitude.
Data and Methods
The main assumption of the method followed in the current work for the assessment of tax evasion in Η2Η services is the following. Consumers’ expenditure on specific services, mainly to business entities, mainly involved in the provision of—human life—services to individuals, at the same time, constitutes ‘the revenue’ of those business entities that must be declared to the tax authorities. Therefore, any discrepancy between the individuals’ expenditure for Η2Η services and the corresponding entities’ revenue is considered a strong indicator of the extent of tax evasion in the respective sector.
Specific household expenditures for human (Η2Η) services for the period 2011–2017 were analysed, using data derived from the annual ‘Household Budget Survey’ (HBS) conducted by the Hellenic Statistical Authority (ELSTAT), which were then compared with the corresponding financial data from the ‘Statistical Business Register’ (SBR). It is specifically mentioned that the SBR is annually updated with administrative data from the tax authority, which records the gross income of economic entities. Apart from the above data sources, special parameters were taken into account for the calculation of the factors, depending on the characteristics and the special conditions of each financial sector under study as will be presented in detail in the current research.
It could be argued that the method used in the current study, on the one hand, is a combination of elements from direct methods, as it attempts to determine the extent of the tax evasion by analysing taxpayer behaviour through formal and in-depth ‘Household Budget Surveys’ data that record citizens’ expenditure and on the other hand elements from the indirect methods, since it attempts at once to determine the discrepancy between the citizens’ purchasing expenditure on ‘specific services’ and the declared revenue/turnover of ‘entities providing these services’ to the tax authority (revenue vs expenditure discrepancy).
The Household Budget Survey
The HBS is a national survey annually conducted by the ELSTAT covering the whole Greek territory that collects information from a representative sample of households on their composition, members’ employment status, their living conditions and, mainly, their expenses on goods and services, as well as on their revenue. The expenditure information collected from households is very detailed. This means that information is not simply collected on the main categories of expenses, such as food, clothing and footwear, health, but detailed information on these sub-categories as well, for example, white bread, fresh milk, fresh beef (food), men’s footwear, women’s footwear (clothing and footwear), pharmaceuticals, medical laboratory services (health), and so on The main purpose of the HBS is to determine in detail the household expenditure pattern in order to revise the consumer price index, compiled by the ELSTAT.
The total initial sample size of households amounts to approximately 6,400 (sampling fraction 01.43‰) and is equally allocated within the reference year based on a rotational integrated design method, so as to end up with four different equivalent independent samples corresponding to the four quarters of the reference year. The data collection method is the Paper-Assisted Personal Interview (PAPI) (ELSTAT, 2020a).
The Statistical Business Register
The SBR is the most efficient method for grouping many and diverse information on enterprises. It is the basic tool for preparing and coordinating statistical surveys and the main source of information for the statistical analysis of business population and business demography, as well as for the identification and establishment of statistical units. The SBR covers all the units that, wholly or partially, exercise an economic activity. Any activity concerning the offer of goods and services on a given market is regarded as an economic activity. All economic activities according to NACE Rev2 classification are covered.
The main administrative sources of information of the SBR are the Independent Authority for Public Revenue (IAPR-Tax Authority) and the Social Insurance Institute (IKA), now called e-EFKA. It is noted that from IAPR the following data are obtained: (a) data on legal units/enterprises concerning identification information, demographic characteristics, legal form, economic activity and relations with enterprise groups; (b) financial data of entities obliged by law to submit periodic VAT declarations, income tax declarations of natural and legal persons, as well as financial statements from business activity; and (c) employment data from electronic earnings attestations, that employers are obliged to submit for their employees (ELSTAT, 2020b).
Eligible Research Categories
For the purpose of this study, the researchers chose the most representative categories of the HBS (Table 1), which reflect the expenditures that are mainly made for the service and needs of individuals and not for the purposes of legal entities. These categories are life service providers (H2H):
‘Health/medical services’, ‘Hotels, motels, inns and similar accommodation services’, ‘Catering’, ‘Education’, ‘Personal care (hairdressers/beauty treatment centres)’ and ‘Funeral and related services’.
HBS Description of Goods and Services.
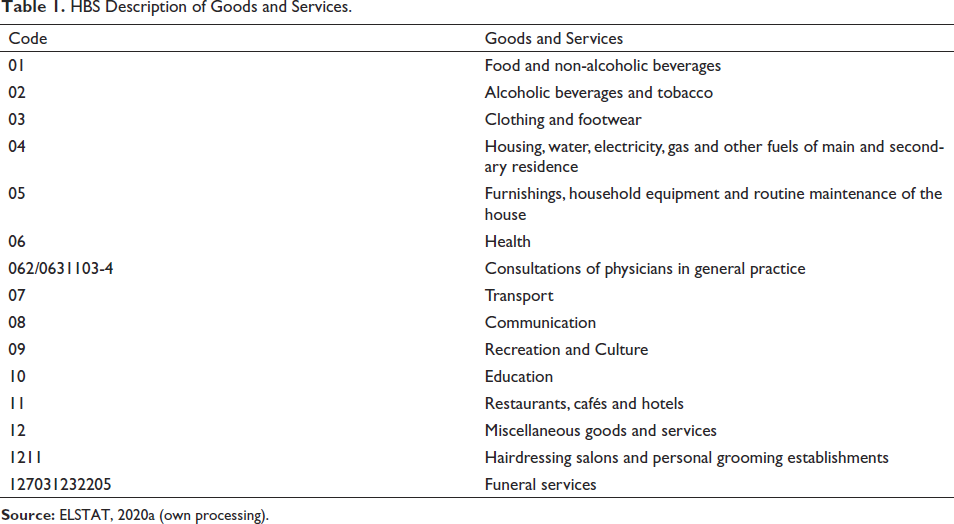
Table 2 compares the HBS categories with the corresponding categories of the SBR.
Comparison of HBS Activity Codes vs the SBR(NACE Rev.2) Codes.
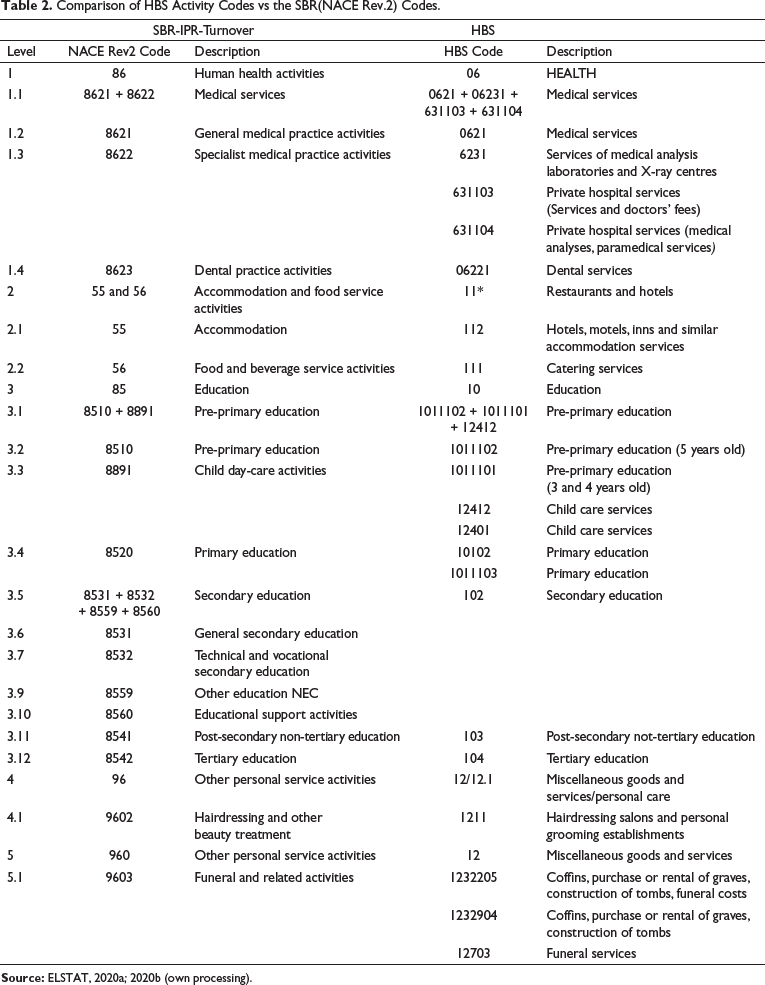
For the category ‘Code 09: Creative, arts and entertainment activities’ of the HBS, although its characteristics meet the conditions and methodology of the research, the structure of the codes of this category is not completely distinct and comparable with the corresponding categories of the SBR, mainly because several sub-categories overlap rendering any data analysis and comparison unsafe. For this reason, this category was omitted by the researchers.
Finally, services and especially goods of other categories are the subject of purchase and sale of legal entities as well, resulting in unsafe comparison data that cannot be used for the purposes of this study.
Results
Estimation of Tax Evasion: Medical Sector
HBSs, as mentioned earlier in detail, record household expenditure on an annual basis.
Concerning Code 062 ‘Outpatient services’ and Code 063 ‘Hospital Services’, they both contain valuable information on household expenditure on an annual basis on specific health issues.
It is noted that the analysis model includes households’ expenditure for the fees of doctors employed in private hospitals in the total expenditure amounts, because the majority of self-employed obstetricians, surgeons, and so on (if not all), on the one hand, hold a contract with private hospitals so as to make use of the building facilities and medical equipment and, on the other hand, the doctors are paid directly by patients, under a provision of services status. Medical laboratory examinations performed on the premises of private clinics that also function as primary health care providers are also included in the total households’ expenditures.
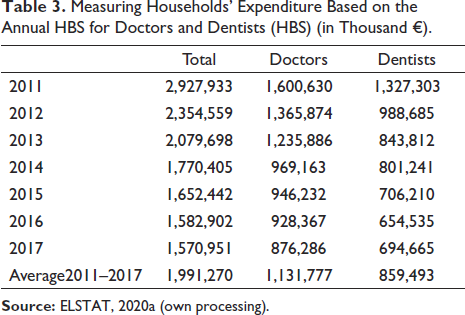
Based on the data available from the HBS on households for the period 2011 to 2017, Table 3 is constructed, which distinguishes the households’ expenditures between self-employed doctors and dentists.
Measuring Households’ Expenditure Based on the Annual HBS for Doctors and Dentists (HBS) (in Thousand €).
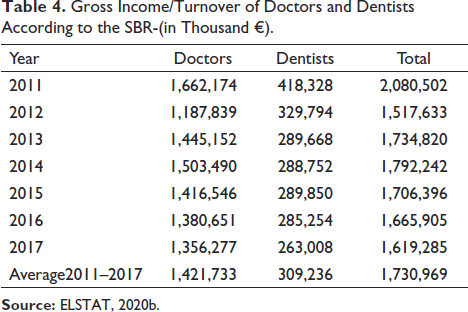
Based on data derived from the SBR, which, as earlier mentioned in the methodological section, is updated with administrative financial data from the tax authority and is maintained by the ELSTAT for all enterprises of doctors and dentists, including companies, the gross income/turnover of doctors and dentists are calculated as shown in Table 4.
Gross Income/Turnover of Doctors and Dentists According to the SBR (in Thousand €).
It is noted that the ‘Turnover’ of medical entities, according to the chart of accounts, does not include VAT and this also holds for all enterprises. However, this amount of turnover is comparable to the citizens’ declared amounts for medical services, since these amounts do not include VAT anyway, as medical services in Greece are not subject to VAT. For other occupational categories, where the above does not hold, in order for the amounts to be comparable, the proportionate share of VAT should be added to the turnover.
The use of all available data on enterprises and corporate partnerships (solely operating in the medical services) was deemed necessary by the research as there were no available data on payments made from insurance funds exclusively to sole proprietorship (individual) medical entities but were only available as a total.
Most self-employed doctors are contracted to public insurance funds. This means that in addition to direct charges to citizens, they also receive payments from insurance funds for the main medical services they offer. Based on the data collected and processed, Table 5 was constructed.
Estimated Revenues of Self-employed Professionals and Medical Companies from Public Insurance Funds (in Thousand €).
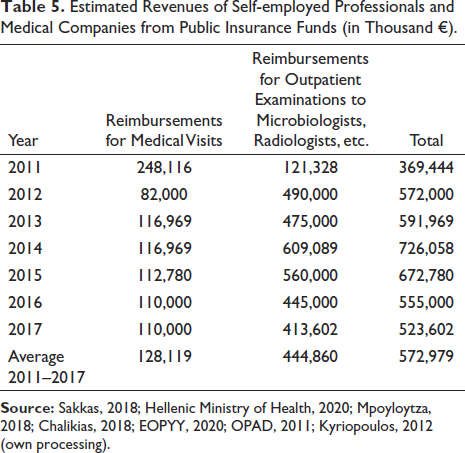
Therefore, for comparability reasons between the amounts recorded in the HBS of the ELSTAT and those recorded from the SBR/Tax Administration, the amounts derived from the insurance funds are excluded.
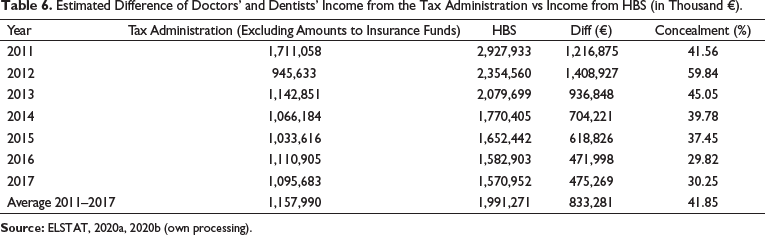
In the seven-year period between 2011 and 2017, there is a clear declining tendency of income concealment from the tax authority (see Table 6).
Estimated Difference of Doctors’ and Dentists’ Income from the Tax Administration vs Income from HBS (in Thousand €).
Estimation of Tax Evasion: Accommodation and Food Service Activities
This section assesses tax evasion in the ‘Accommodation and food service activities’ sector.
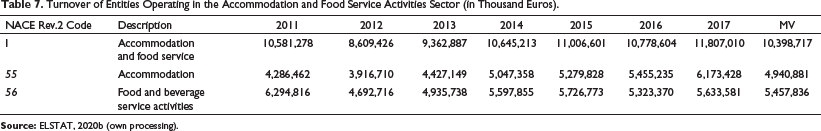
From the data (see Table 7) derived from the SBR, it appears that for the period 2011 to 2017, a specific ‘turnover’ (which does not include VAT) was declared to the tax authority by the entities of this sector, which amounts to an annual mean value of €5.45 billion for food service activities and to €4.9 billion for accommodation services.
Turnover of Entities Operating in the Accommodation and Food Service Activities Sector (in Thousand Euros).
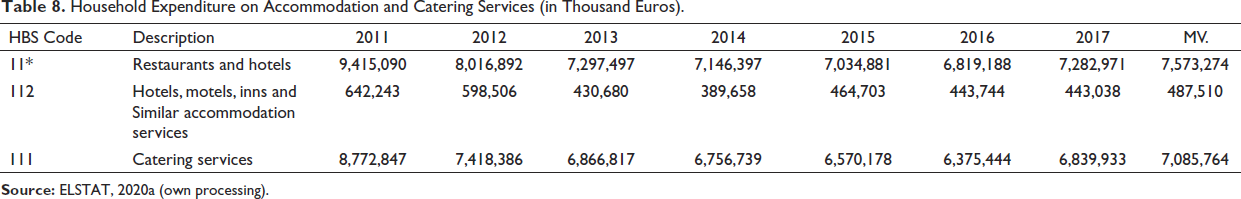
On the other hand, concerning the households included in the respective HBS surveys, the costs incurred, for the accommodation and food services, as shown in detail in Table 8, with the MV, amount to €7 billion for the catering and €487.5 million for accommodation services, respectively.
Household Expenditure on Accommodation and Catering Services (in Thousand Euros).
For reasons of data comparability, the declared amounts of the household budgets are then remitted from the relevant VAT (see Table 9), in order for all the data to be comparable with the turnover of the business entities, of Table 7, which does not include VAT. During the conduct of the HBS survey, the respondent, when declaring the amounts for costs incurred, could not at the time of the interview identify the VAT due to the purchase made, while in several cases due to the different VAT rates per product/service, might not even be aware of the VAT rate. At this point it is noted that regarding the VAT for services provided, from 2011 to 2015 the rate was 23% and from 2016 until today the rate is 24%.
Household Expenditure for Accommodation and Catering Services (in Thousand Euros) (Tax Remitted).
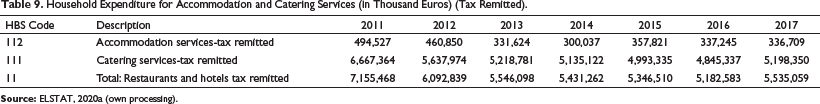
By initially comparing the household expenditure on accommodation (Table 9) with the respective turnover of companies in this sector (Table 7), a significant difference in size is identified.
This difference—at least partially—is due to the fact that a large part of the annual revenue of the companies in the accommodation sector is attributed to non-permanent residents of Greece (tourists, etc.), which is not reflected in the HBS. Besides, it is a general assumption that tourism is the ‘heavy industry of Greece’.
For this reason, the research proceeded to the following analysis to estimate the revenue of enterprises in the accommodation sector from non-residents in Greece.
Utilising official financial data of the Hellenic Central Bank (BoG) and in particular data from the ‘Annual Border Survey’ (Travel Receipts Survey section-key figures) and from the datasets ‘Number of inbound passenger traffic of non-residents in Greece by country of origin (in km)’ and the ‘Average length of stay per trip of non-residents in Greece by country of origin (in number of nights)’, the amounts paid by visitors to our country for accommodation and food services were estimated (see Table 10) (BoG, 2021).
Estimated Total Revenue from Accommodation and Food Services of Non-residents in Greece.
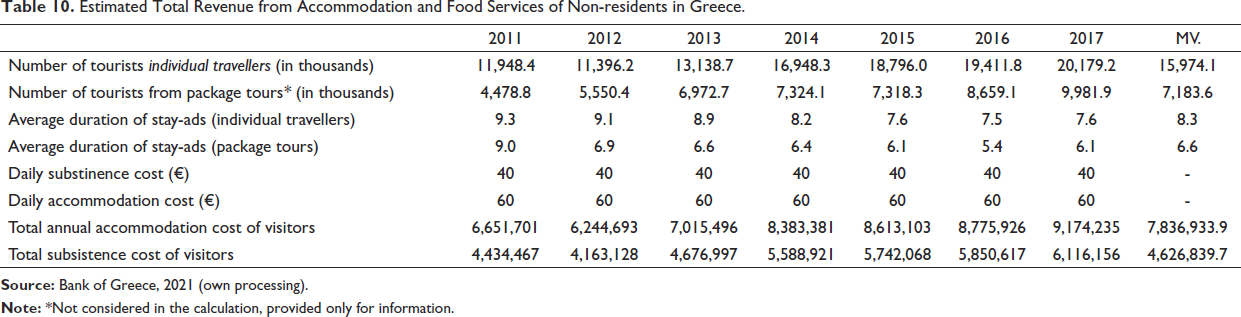
For the calculation of the annual expenditure on food services and accommodation, €40 and €60, respectively, per person without VAT were used as the daily calculation basis. These amounts were selected by the researchers, based on Greek Law no. 4336/2015, which defines them as remuneration amounts for accommodation and subsistence of Greek civil servants within the Greek territory when travelling for official purposes. These amounts are representative as they were established by comparative data for the ‘food services and accommodation sector’ under study and were checked before being incorporated in the Greek Law no. 4336/2015 and by the Hellenic General Accounting Office of the Hellenic Ministry of Finance (author note: each Greek law prior to its adoption is accompanied by a special Report of the Ministry of Finance for reasons of any incurred budgetary burden).
It is noted that in the calculation of the overall expenditure on food services and subsistence costs of non-residents, the expenditure of visitors through tour operators is excluded because in most cases customers trade with tour operators.
In Table 10, the estimated total revenue from accommodation and food services provided to non-residents of Greece is calculated, which for the period 2011–2017 annually amounts on average to €7.8 billion and €4.6 billion, respectively.
Therefore, the estimated aggregated annual expenditure by Greek and non-Greek visitors, for ‘accommodation and catering’ is shown in Table 11, with the average per annum expenditure for the period 2011–2017, amounting to €8.3 billion and €12.3 billion, respectively.
Estimated Household Expenditure for ‘accommodation and catering’ by Greek and Non-Greek Visitors (in Thousand Euros).
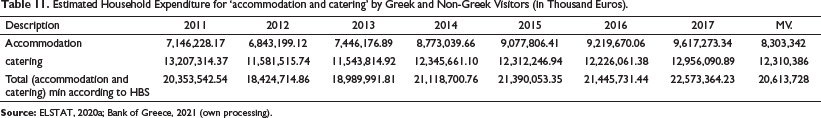
By comparing the turnover declared to the tax authority by the enterprises of the sector with the calculated aggregated expenditure by Greek (according to HBS) and non-Greek visitors (according to the BoG Border Survey) for accommodation and catering, Table 12 is constructed.
Difference Between the Amounts Recorded from HBS and Border Surveys (Residents and Non-residents of Greece) Compared to the Turnover Declared to the Tax Authority by the Enterprises of the Sector Accommodation and Catering, According to the SBR(in Thousand Euros).
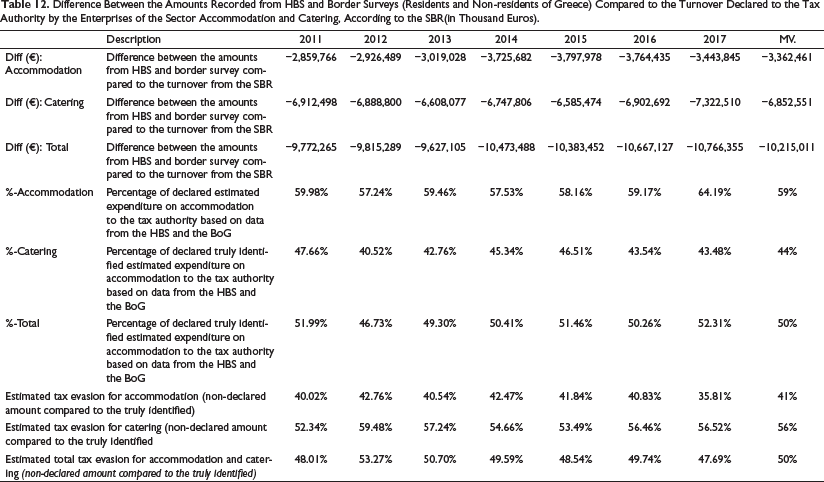
The difference between the aggregated expenditure by Greeks and non-Greeks, with the gross declared amounts of the sector enterprises, makes for a robust indicator of tax evasion of the specific sector.
Based on Table 12 we observe that tax evasion in hotel accommodation is constantly increasing, with the MV for the period 2011–2017 amounting to €3.3 billion and for catering to €6.8 billion.
The income concealment rate for the hotel-accommodation sector is estimated at 41% and for the catering sector at 56% on average for the period 2011–2017.
Estimation of Tax Evasion: Education Sector
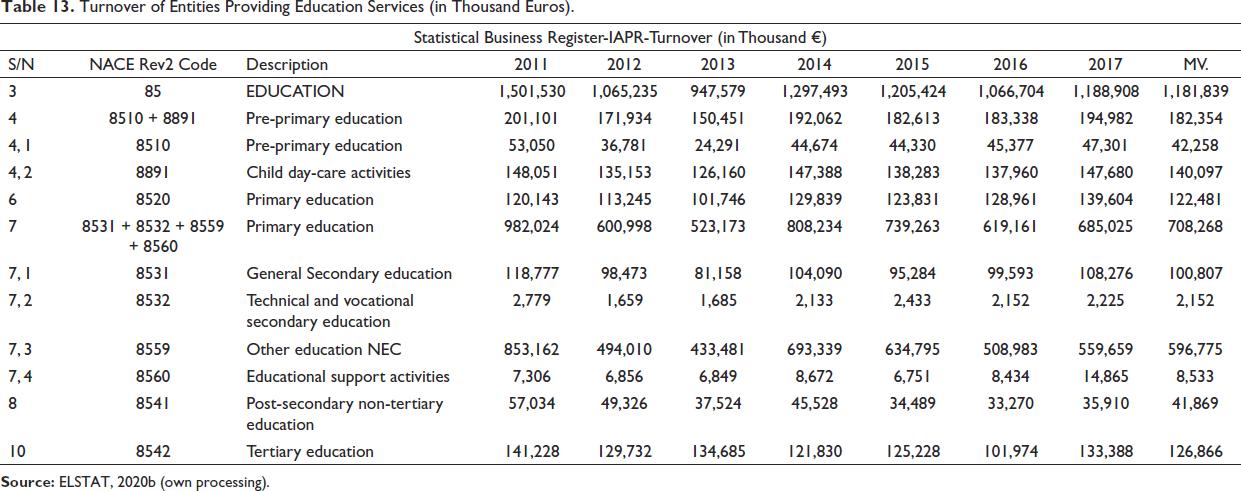
Based on data derived from the SBR for the period 2011 to 2017, the declared ‘turnover’ by all types of entities classified in the sector ‘provision of education services’ is shown in Table 13, with an MV of €1.1 billion.
Turnover of Entities Providing Education Services (in Thousand Euros).
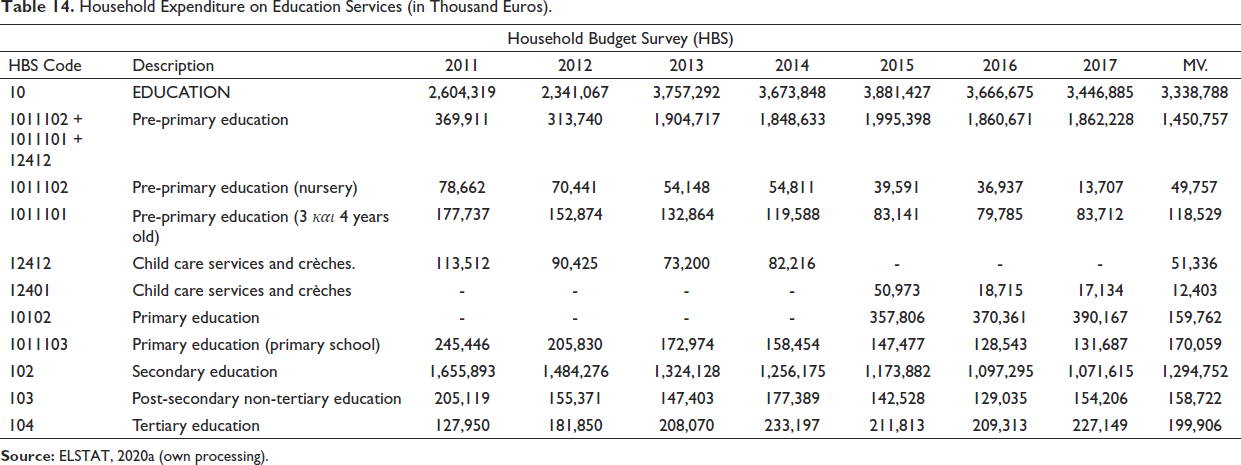
On the other hand, according to the households declared expenditure in the HBS survey, the expenses they made for education services for the same period, amount on average to €3.3 billion, as shown in detail in Table 14.
Household Expenditure on Education Services (in Thousand Euros).
The education services, according to Article 22 of the Greek Law no. 2859/2000 (VAT), are exempt from VAT, and therefore no tax remittance is required for reasons of comparability for the amounts recorded in HBS, which includes the ‘accommodation and catering’ sector.
Table 15 depicts the comparisons of the amounts declared to the tax authority (turnover) with the household expenditures for education services according to HBS. The table shows the difference between these two figures, which makes for a strong indicator of tax evasion for the current research.
Difference Between Education Services Expenditures According to HBS and the Declared Turnover to the Tax Authority by Entities Providing Education Services (in Thousand Euros).
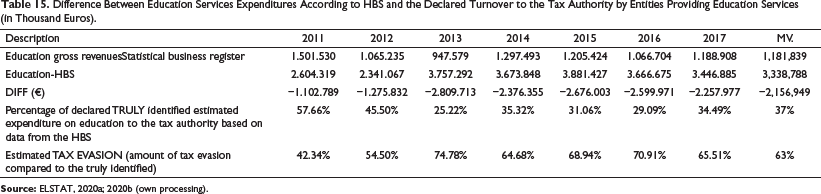
Based on Table 15, we can observe that tax evasion in education services in 2017 doubled (€2.25 billion) compared to 2011 (€1.1 billion) while the average amount of tax evasion for the period 2011–2017 is €2.15 billion.
The average income concealment rate for the education sector is estimated at 63% for the period 2011–2017, while from 42.34% in 2011 it soared to 74.78% in 2013 following a declining course which is estimated at 65.51% in 2017.
Estimation of Tax Evasion: Personal Care
In this section, we will attempt to estimate tax evasion for the sector of personal care services and in particular for the activity ‘Hairdressing and other beauty treatment’, which meets the criteria of the research for the comparability of data.
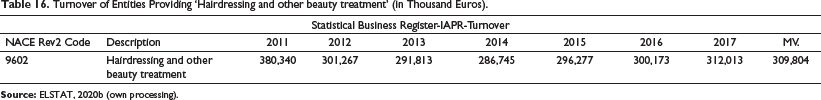
Based on the data derived from the SBR it appears that for the period 2011 to 2017, a specific ‘turnover’ (which does not include VAT) was declared by all kinds of entities for the category under study ‘Hairdressing and other beauty treatment’ with the average value amounting to €309.8 million (see detailed data in Table 16).
Turnover of Entities Providing ‘Hairdressing and other beauty treatment’ (in Thousand Euros).
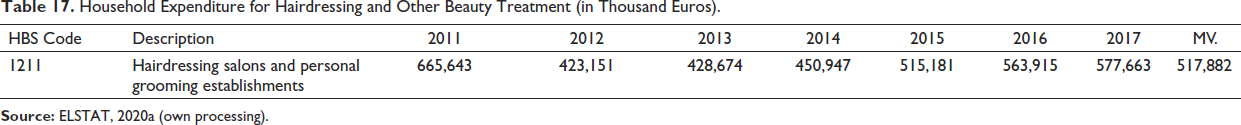
The household expenditures, according to the amounts declared in the HBS surveys, for the respective years, for hairdressing and other beauty treatment services amount on average to €517.8 million as given in detail in Table 17.
Household Expenditure for Hairdressing and Other Beauty Treatment (in Thousand Euros).
The services provided by hairdressing salons and personal grooming establishments from 2011 to 2015 were subject to a VAT rate of 23% and from 2016 until today to 24% and for reasons of comparability are in this case remitted from VAT (see Table 18).
Household Expenditure for Hairdressing and Other Beauty Treatment Services (in Thousand Euros) (Tax Remitted).

From Table 19 we can observe that tax evasion concerning the hairdressing and other beauty treatment services sector, although at a declining rate, has an average value for the period 2011–2017 of €309.8 million.
Difference Between HBS Expenditure Concerning Hairdressing and Other Beauty Treatment Services and Turnover Declared to the Tax Authority from Entities Providing Similar Services (in Thousand Euros).
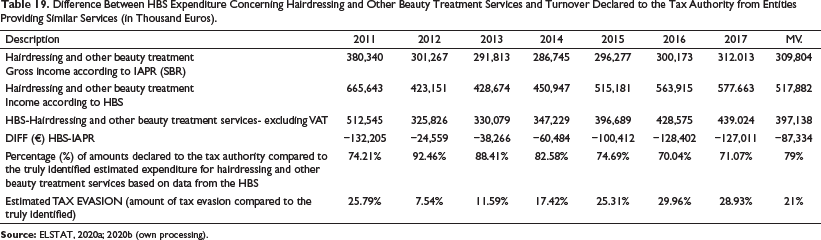
The income concealment rate for this sector is estimated on average at 21% for the same period.
Estimation of Tax Evasion: Funeral and Related Activities
According to the data from IAPR based on the SBR, it appears that for the period 2011 to 2017 a specific ‘turnover’ was declared by all kinds of entities for the examined sector of funerals and related activities (see Table 20), which in 2017 amounted to €57.3 million having a marginal difference compared to 2011, that is, €58.4 million.
Turnover of Entities Providing Funeral and Related Services (in Thousand Euros).

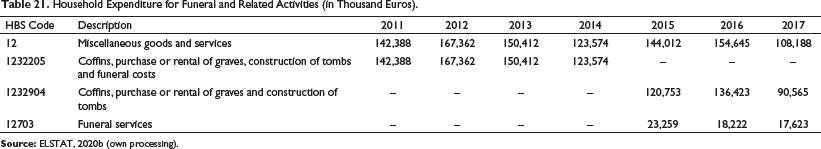
Based on the annual HBS data, the household expenditures for the above-mentioned services of funerals and related activities in 2017 amounted to €108.1 million while in 2011 they amounted to €142.3 million (see Table 21).
Household Expenditure for Funeral and Related Activities (in Thousand Euros).
The provided funeral and related activities services from 2011 to 2015 were charged with a VAT rate of 23% and from 2016 until today with 24%. In this case, as previously, the necessary tax remittance was carried out for reasons of comparability (see Table 22).
Household Expenditure for Services of Funerals and Related Activities (in Thousand Euros) (Tax Remitted).

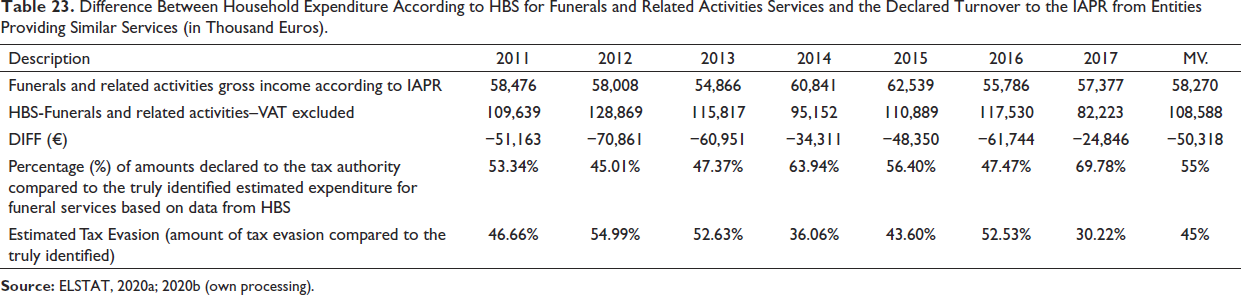
From Table 23 we can observe that tax evasion in the funerals and related activities sector for the period 2011–2017 amounted on average to €58.2 million while the percentage of income concealment for the same sector and the same period is estimated at 45% on average.
Difference Between Household Expenditure According to HBS for Funerals and Related Activities Services and the Declared Turnover to the IAPR from Entities Providing Similar Services (in Thousand Euros).
Calculation of State Foregone Revenue
In this section, we will attempt to determine the state’s foregone revenues based on data from the ‘H2H life services’ (Table 24).
Total State Foregone Revenues for the Period 2011–2017 in Selected H2B Services (in Thousand Euros).
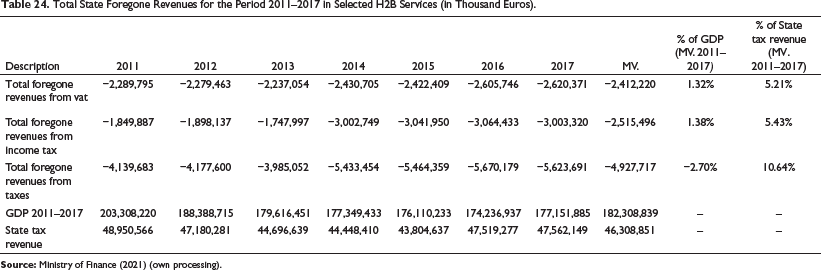
It is noted that income tax is calculated by the tax authority, based on the amount of income per income scale, using a different tax rate for each scale. So for example the first €20,000of income is taxed at a rate of 22%, and the subsequent amounts at a different rate and so on. This renders it really difficult to accurately calculate the state’s revenue from income taxes. However, an attempt will be made to identify them using the most modest approach. For corporate income tax for the period of 2011–2013 and for incomes up to €26,000 the tax rate was 15.07% (Greek Law No.2238/1994). For corporate income tax from 2014 until today and for income up to €20,000 tax rate are set at 22% (Greek Law No. 4172/2013).
Therefore, the amounts in Table 24 are determined based on these coefficients. Regarding the VAT from 2011 to 2015, it amounted to 23%, and from 2016 until today, it is fixed to 24%. Health and education services, based on Article 22 of Greek Law No.2859/2000 (VAT), are exempt from VAT.
The total Greek state foregone annual income tax on average, from the business activity, of the above specific sectors, was estimated—at least—at €2.51 billion (1.38% of GDP) and the corresponding foregone annual revenue from the VAT on average, amounted to €2.41 billion (1.32% of GDP) while the general total was €4.92 billion (2.70% of GDP) (see Table 24).
At this point, it is worth mentioning that the total annual revenues of the Greek state on average for the period under study (2011–2017) amounted to €46.3 billion (see Table 24). By analogy, the foregone tax revenues of the Greek state due to tax evasion in relation to the total revenues were 10.64%. In other words, if tax evasion in the examined sectors was non-existent, the state revenues would increase by 10.64%, that is, by about €5 billion.
Discussion
On average, the Greek state total foregone annual income tax from the business activity solely from the economic sectors under study was estimated—at least—at €2.51 billion (1.38% of GDP) and the corresponding foregone annual income from the total VAT on average amounted to €2.41 billion (1.32% of GDP).
The estimated state foregone revenue from the provision of medical services amount on average to only €107.7 million (0.06% of GDP), while the corresponding loss from catering services is €.9 billion (1.59% of GDP), from accommodation services is €1.4 billion (0.79% of GDP) and from education services is €423.1 million (0.23% of GDP).
The concealment percentage of doctors’ incomes decreased from 59.84% in 2012 to 30.25% in 2017, while the concealment income percentage from the provision of education services amounted to 54.50% and 65.51% in 2012 and 2017, respectively.
The average annual tax evasion for the period 2011–2017, for the health sector amounted to €565.61 million (0.31% of GDP). In 2017, it assumed its lowest value (€475.27 million) whereas in 2012 its highest (€1.4 billion). The average annual income concealment for the health sector for the period 2011–2017 amounted to 40.54%, while compared to the other sectors under study:
(i) The average annual tax evasion for the period 2011–2017 for the sector of ‘Accommodation/Hotels and similar accommodation’ amounted to €3.4 billion (1.84% of GDP). 2011 has the lowest amount of tax evasion (€2.9 billion) and 2015 the highest (€3.8 billion). The average annual income concealment for the accommodation sector for the period 2011–2017 amounted to 40.61%. (ii) The average annual tax evasion for the period 2011–2017, for the catering sector, amounted to €6.8 billion (3.76% of GDP) 2015 had the lowest amount of tax evasion (€6.6 billion), and 2016 had the highest (€7.3 billion). The average annual income concealment for the catering sector for the period 2011–2017 was very high at 55.74%. (iii) The average annual tax evasion for the period 2011–2017 for the education sector amounted to €2.1 billion (1.18 % of GDP).
The average annual income concealment for the education sector for the period 2011–2017 amounted to 63.10%.
(iv) The average annual tax evasion for the period 2011–2017 for the hairdressers/other beauty treatment sector amounted to €87.3 million.
The average annual income concealment for the hairdressers/other beauty treatment sector for the period 2011–2017 amounted to 20.94%.
(v) The average annual tax evasion for the period 2011–2017, for the funeral services sector was estimated at €50.3 million.
The average annual income concealment for the funeral services sector for the period 2011–2017 amounted to 45.24%.
5. Comparing the results of the current research with other surveys conducted to assess tax evasion, the following findings are reported:
(i) Bühn and Schneider (2012) used the multiple indicator multiple causes model to study the scale and variability of tax evasion in 38 OECD countries. During this period, the average tax evasion rate of the above 38 countries represented 3.2% of their GDP, of which 1.8% related to tax evasion in indirect taxes with Greece being estimated at 4.8%. However, the current research estimated the total annual tax evasion for the period 2011–2017, in specific sectors, at 2.70% of GDP.
(ii) When the income corresponds to self-employed persons, the probability of income concealment is higher, and the concealment rates are estimated to range between 24% and 53% (Matsaganis & Flevotomou, 2010). The activities under study in the current research are largely derived from the self-employed and less from big enterprises. Also, according to the estimates made by Artavanis et al. (2016) from 2006 to 2009, the real total income of self-employed persons was 1.75 to 1.84 times their declared income, which shows that the tax evasion rate reached 43%–45%. In the current research, the income concealment rate is estimated at 45.12% on average, and in particular, it ranges from 40.54% to 63.10% (with the exception of hairdressing and other beauty treatment services for which the concealment rate is 21%).
Conclusion
The research has shown that the contribution of the health sector to overall tax evasion is much smaller and disproportionate—in financial terms—to the strong criticism and accusations it receives from the media. It has thus been proved by the current research that other sectors of the economy are many times more responsible for the perpetuation and the exacerbation of the phenomenon of tax evasion, namely, by the degree of importance: catering, accommodation and education, and so on
However, the doctor–patient relationship is a special one and is often characterised by information asymmetry. The advantage in this transaction lies in the doctor-provider of service, in contrast to the patient who is not in the position to know the severity of his condition. The patient is not able to form his own opinion about his health, the same way that he can for a room in an accommodation facility, a meal in a hotel or an education service in a private lesson. The doctor, on the other hand, has taken an oath to Hippocrates, and in the eyes of the patients, he is not just a professional provider, such as a restaurant, a hotel or a private school owner, whose profit is an end in itself. He is a healer, acting in society, and is a component of social balance. That is why society, and consequently the mass media in practice prove to be—consciously or unconsciously—more rigorous in their critique of the contribution of doctors to the overall tax evasion.
Footnotes
Acknowledgments
This manuscript has been done within the framework of the PhD Programme in Business Administration of the University of West Attica (Greece).
Declaration of Conflicting Interests
The authors declared no potential conflicts of interest with respect to the research, authorship and/or publication of this article.
Funding
The authors received no financial support for the research, authorship and/or publication of this article.