
Abstract
Incorporating the user’s and the broader community’s values in the built environment design for placemaking is becoming essential. The proposed method applies a quality function deployment framework to assess campus accessibility and functionality to meet the users’ needs. The results showed the improvements required to the current campus design, including quiet places, more meditation places, improved public transport from home to and on campus and increased social activities and accessibility. We concluded that access to meditation places was essential for enhancing people’s well-being. The study results could be extended from suburban campuses to suburban town centres and prominent industrial places. There is a significant need to connect with the built environment by ensuring that people’s desires and needs are integrated into a place-making approach.
Keywords
Introduction
Individuals’ social capital is closely related to the built environment design, which has become a hot topic in recent decades (Leyden, 2003). Suburban development has its nature of isolation and a lower health outcome caused by a lack of resources, population density and transportation inconvenience (Doogan et al., 2018). Ulrich et al. (1991) found that the natural environment reduces stress compared to urban environments. It is advocated that city planning considers an individual’s demands and urban nature with lower noise levels to assist in psychological restoration (Ojala et al., 2019).
The individuals’ needs in the built environment design have attracted considerable attention in recent decades, and incorporating the users’ values in the built environment design is essential for developing quality design (Moghimi et al., 2017). Decision-makers engage in design processes during planning, impacting dimension and arrangement, integrating actions and services, site spatial characteristics and service quality. These decision-making activities need transparency, rationality and the involvement of a wide range of stakeholders (Dehe & Bamford, 2017). Complex built environment design projects require more knowledge from different perspectives than designers’, as the knowledge related to a design project is usually distributed among the stakeholders (Arias et al., 2000). Realising the potential of these new design insights needs reasonable consideration between the designers and the users (Somerville Mary, 2008).
Ongoing studies have shown that better buildings and human interactions reduce tension and increase satisfaction, sense of belonging and productivity (Ergan et al., 2018). Human experience in the built environments is related to the influence of the environment on human’s temper, feeling of comfort and interactions with context (Western, 1981). Social capital and spatial accessibility impact people’s knowledge sharing, education, innovation and creativity (Östh et al., 2018). Moreover, the built environment design features like objects symmetry, spaces connectivity and openness impact human experience (Ergan et al., 2018). Alabi (2020) stated that the lack of green open space impacts people’s behaviour and socioeconomic situations while increasing contact with green open space can enhance community sense. However, few studies have explored how campus end-users, including students, staff and visitors, perceive the campus-built environment in planning and design. A university campus is one of the major built environments in a community, as it is known by the local community and society beyond the university’s status and reputation, which have a significant influence on a community (Abd-Razak et al., 2012). Therefore, the formation of a campus to meet the wellbeing of end-users is necessary, which can show progressive principles and serve students, staff, and the larger Australian community.
Campus accessibility represents people’s access to campus services, resources and activities. Accessibility is one of the critical aspects of testing social equity and social sustainability (Ali et al., 2019). Several factors impact the accessibility of a campus, such as the ability to move, the quality and affordability of alternative modes of transport on campus, the availability of a transport system network such as from the interchange to the campus, and mobility substitutes such as shared bikes, and land-use system. Accessibility can be assessed from many aspects, such as a particular group, form, spatial position, or activity (Litman, 2008).
This study aimed to analyse factors that impact the end user’s perception regarding the accessibility of the built environment design using the University of South Australia (UniSA) Mawson Lakes campus as a case study. Quality function deployment (QFD) is introduced in this study to identify factors that the staff and the students prefer and are concerned about the quality of the campus’-built environment design and to provide proper planning and design recommendations.
Urban Design and Planning Method
As the users’ perceptions play a significant role in the built environment design, many studies have explored the end user’s perspective on the built environment design. In recent decades, an appropriate framework was introduced to understand the end-users’ added value (Appel-Meulenbroek et al., 2011; Moghimi et al., 2017).
Transportation and Accessibility on the University Campus
As one of the primary forms of mobility, walking depends on the infrastructure such as pavements and crossings and the built environment (Krizek et al., 2009). Liu et al. (2014) conducted a natural experiment to demonstrate the connection between the changes in the built environment and walking behaviour using two surveys, one before and the other after the changes. The results showed that a better pedestrian network connection contributes to an increased willingness to walk as the mode of travel, and the increasing application of recreational construction distributed in the mid-range areas leads to a greater walking distance (Sun et al., 2014). Meanwhile, according to the existing literature, few research studies have attempted to highlight different transportation behaviours on campus (Liu et al., 2014). Liu et al. (2014) developed a method for analysing the features of a mixed traffic flow on campus, considering motor vehicles, motorbikes, bikes and walking, and aimed at determining the influencing factors for various traffic flows. The traffic flow analysis results are significant for campus planning for safety, efficiency and accessibility (Liu et al., 2014). Berte and Panagopoulos (2014) reported that an appropriately built environment ecosystem should provide green sidewalks, a part of the campus accessibility system.
The most recent campus master plan demonstrated that the strategy and the objective for campus development and management are to develop a campus that is open, accessible and more integrated with the surrounding environment (Phillips/Pilkington Architects, 2016; Taylor Cullity Lethlean, 2006). The extent of people’s perception on campus towards university amenities and services at different locations should be compared to analyse which facility-related aspects influence overall satisfaction (Kärnä & Julin, 2015).
Built Environment Design/Redesign
The built environment is for people, meaning it should be a people-friendly place; however, the designers are sometimes trained as the dominant decision-makers instead of involving the users in the decision process (Siu, 2003). For example, in Lucy Craft Laney Campus design, Maleitzke (2010) proposed a redesign master plan with five basic design philosophies: sustainability, safety, accessibility, studying activities and gathering, which commences with a site analysis. A systematic analysis and evaluation, including tree coverage, circulation and gathering places on the site, was conducted:
The evaluation showed that the plant cover on the campus failed to provide sufficient shelter for the car park and confluence areas. Two major circulation issues were insufficiently illuminated crossings and separate pedestrian lanes or bump-outs to assist daily crossing and accessibility to the parking lot and the articulated entrances. From a gathering perspective, the study pointed out that there were only two areas to sit and that more seating facilities were necessary around the outdoor space.
Users’ Perspective on the Built Environment
To better understand the users’ experience in urban precinct design, some campuses or working environments were studied in terms of the built environment’s various aspects from a users’ perspective. For an indoor built environment, the studies explored the users’ experience, including an effective working environment (Appel-Meulenbroek et al., 2011), sustainable workplaces (Smith & Pitt, 2011) and university library planning (Somerville Mary, 2008), while many studies related to the users’ feeling of the outdoor built environment on campus were also conducted (Farag et al., 2019; Hanan, 2013; Nasar, 1994). The relationship between travel behaviour and urban built environments is the junction of transport planning and built environment design, and some built environment characteristics can influence people’s travel behaviour, mainly walking (Lamíquiz & López-Domínguez, 2015).
Social and Mental Health Requirements for the Built Environment
According to the U.S. Department of Health and Human Services (2020), social factors cover many aspects, including social and physical determinants. The social determinants include access to resources, quality schools and transportation options. The physical determinants in social factors include the natural environment, such as plants; built environments, such as buildings or transportation, worksites and schools; and aesthetic elements in the built environment, such as adequate lighting. A meditation area allows people to release their stress and enhance their cognitive health. Researchers have explored the relationship between the interactions of place and self-cognition. Proulx et al. (2016) suggested that a framework, including all environmental and human cognitions, is worth considering by architects and urban planners. Helmer (2014) analysed classroom interactions, revealing that secular mindfulness practices can benefit teaching and learning. Hanh (2011) mentioned that the built environment affects how people live and interact and necessity of meditation areas.
Quality Function Deployment
QFD is a planning methodology for transforming the clients’ needs into appropriate technical requirements for every phase of product development and production (Sullivan, 1986). A QFD framework applies relationship matrices to demonstrate the relationships between clients’ needs and design requirements (Khoo & Ho, 1996). The traditional method to satisfy customer requirements in product design is called the analytical approach (Mizuno et al., 1994). Compared to an analytical approach, QFD is one of the design approaches that require starting from the objectives and then moving to the methods for meeting these objectives. The clients’ needs shape these objectives, which must be engaged in the design quality (Abdul‐Rahman, 1999; Akao, 2004).
QFD Application in the Built Environment
QFD should capture and integrate with the design attributes of campus design (or redesign) that satisfy the customers’ demand. Francis (2010) pointed out some design attributes related to practical design, such as appropriately distributing functional areas, providing productive activities, taking the staff’s most enormous advantages and modern technology, reducing waiting times and cleaning the footpath. Moreover, Trant (2010) listed some key attributes that contribute to a good building design: (1) The buildings should be integrated with and contribute to the local environment. (2) The building should make the best use of open space. (3) The design should fully use natural light and install appropriate ventilation systems.
QFD Application to Campus Redesign
The most crucial phase of QFD is called the house of quality (HOQ), linking the users’ thoughts to the technicians’ skills. In this phase, the customers’ voice for the product is identified and converted into technical operations to meet the requirements (Chan & Wu, 2005). The customers’ or end-users demand is the WHAT side in the HOQ matrix, which captures the customers’ data by methods such as survey questionnaires (Eldin & Hikle, 2003). The quality element is the HOW side, which includes design characteristics, processes, amenities and approaches to meet the given demanded qualities (Wood et al., 2016).
Mawson Lakes Campus Demand for Accessibility
This study used the UniSA, Mawson Lakes Campus, to test the critical factors to improve accessibility and social and mental health in a suburban town centre. Mawson Lakes campus is adjacent to the Mawson Town centre, 14 km north of the Adelaide CBD, and 800 m away from the train station linked to the Adelaide CBD. Mawson Lakes is an economic and social driver for the immediate community of the City of Salisbury. There are three phases of the work in this case study. Phase 1 is the transport auditing, Phase 2 is transportation observations and questionnaire survey, and Phase 3 is the deployment of QFD to inform the campus redesign priorities.
Phase 1 Transportation Audit
The main aim of a transportation audit is to recognise the issue and provide campus transportation design regarding safety (majority driving to work and walk to lunch), policy compliance and effectiveness. The transportation audit should include the university and its environments, as the transportation needs do not stop at the university boundaries. The campus transportation audit includes observing campus transportation-related design, including access and parking, zebra crossings, way-finding and signage and the built environment design.
The local council has launched the Ability Inclusion Strategic Plan required by the state government legislation to promote accessibility for people of all abilities in the community (City of Salisbury, 2020). One of the critical areas supporting disabled people living in Salisbury is accessibility to buildings and open spaces such as parking spaces (City of Salisbury, 2020).
For access and parking on campus, the transportation audit examines the accessibility of parking spaces and safety issues around the parks. According to the audit report, the car park safety and campus design must meet government policy compliance. Table 1 shows the policy compliance of campus transport and suggestions.
Policy Compliance.
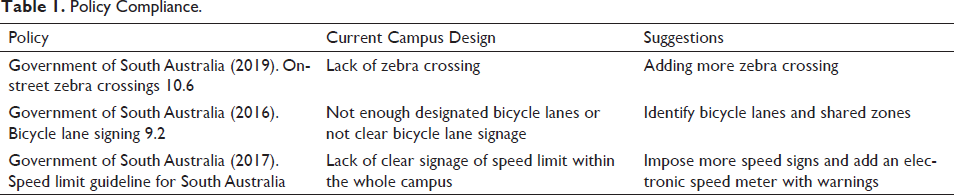
Some additional suggestions for improving transportation in and around campus are as follows:
Improve smooth turning at plant curbs, car parks and road traffic areas; for example, the plant curb affects the delivery of lab materials, and high bushes block the drivers’ and pedestrians’ vision. Improve ambiguous signage for one-way access or buses and authorised vehicles and loading zones. Increase bike storage facilities. Improve wayfinding signage, for example, electronic screen mapping.
Phase 2 Users’ Perspective Survey
Understanding Campus Travel Accessibility
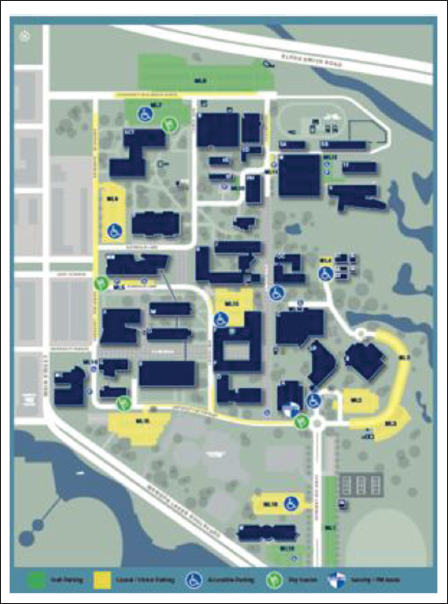
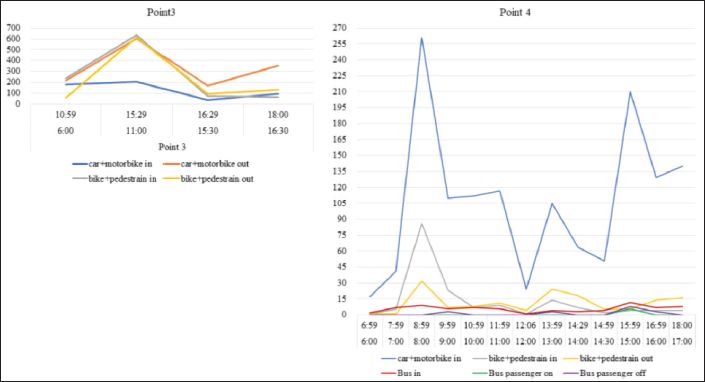
A campus counting survey was conducted to better understand the campus traffic flow on a Wednesday in May 2019, from 6 am to 6 pm. The traffic observation on different modes of access was conducted at six points (Figure 1) of the Mawson Lakes campus (Figure 2), as buses are scattered around the Mawson Lakes town centre and it is difficult to identify whether the passengers are university patrons. Therefore, Points 1–5 cover all modes except buses, and Point 6 is for bus access (Bus Numbers 225, 501, 225F, 501 and 225F). The roundabout near Point 6 to Point 4 is a one-way road. Figure 3 shows the change in the traffic flow in a day at three major entrances of the campus.
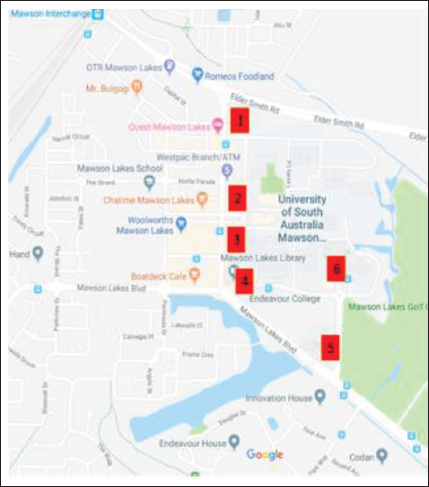
Campus Traffic Flow.
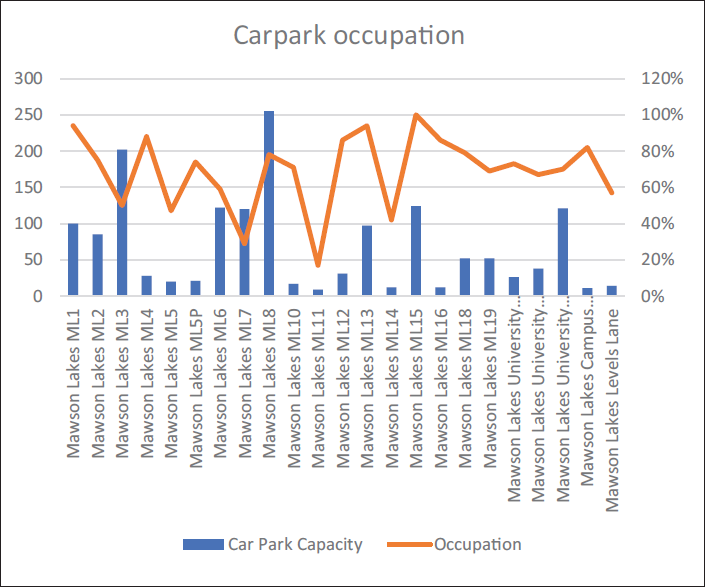
On the observation day, the parking duration is shown in Figure 4; the average parking occupation rate was 76%.
Mawson Lakes Carpark Occupation.
The traffic flow at each point on the campus was as follows:
Point 1: Approximately 540 people were entering by driving in the morning and driving out in the evening, and a small number of people were walking in (assumed to be train travellers or Mawson Lakes residents). Point 2: Approximately 120 cars parked on campus grounds, but around 200 cars drove in and then out immediately. Nearly 100 people walked in/out around lunchtime. Point 3: In total, 550 cars drove in, and 1,300 cars drove out (who drove in from Point 5 for Endeavor College to drop kids to school and then drove out from point 3). Point 4: The parents mostly used this point to drop off their children. Point 5: In total, 1,765 cars drove in and 1,300 cars drove out.
The campus followed morning and afternoon peak hours, just like a conventional business; however, the traffic flow was relatively busy during the peak hours because of the coursework and teaching activities.
Transportation and Accessibility Survey
The questionnaire was structured into three sections. Section 1 included questions about the respondents’ demographics, living location and background (e.g., roles in the university, and frequency of visits to the university). Section 2 evaluated the importance and satisfaction level of different factors that influenced the perception of the quality of a campus-built environment design. Section 3 was related to travel behaviour and travel mode preferences. The Kruskal–Wallis H test was applied to investigate a statistical difference between the different frequency groups to analyse the impact of position and visit at the university. It has no assumption regarding the population distribution statistics (Ayarkwa et al., 2022).
Campus Patrons’ Requirement
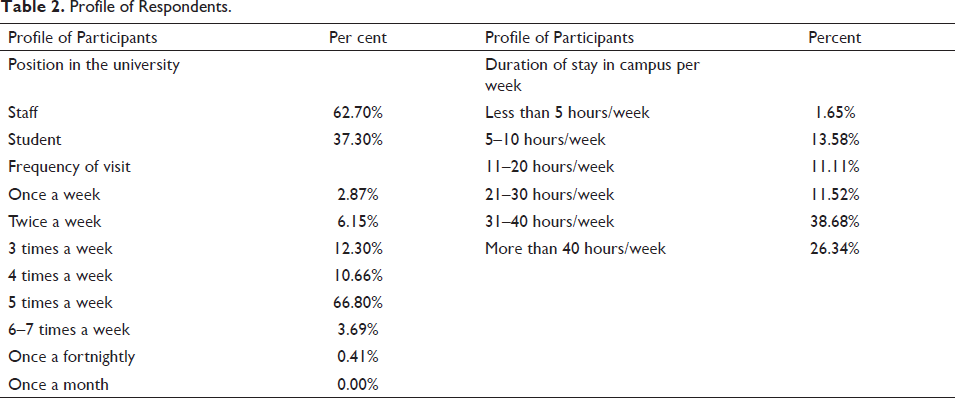
The survey was sent via email to Mawson Lakes students and staff. In total, 246 responses were received. A response rate consisting of 62.70% of staff and 37.30% of students was achieved, according to Table 2. Figure 5 shows the location of the respondents. Most campus patrons lived within 10–20 km from the campus.
Profile of Respondents.
Respondents’ Residential Locations.
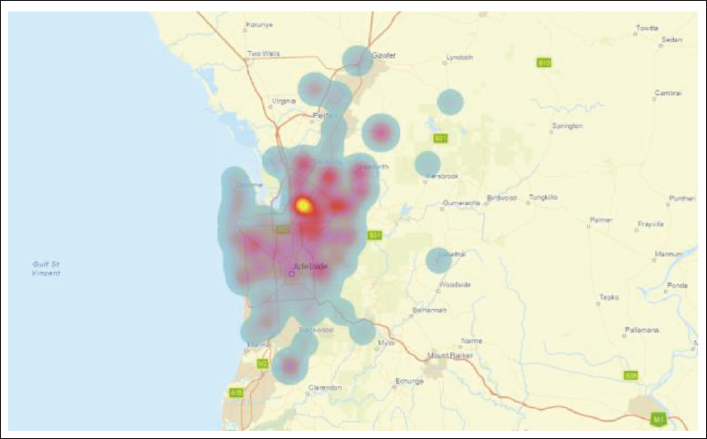
Table 2 summarises the frequency of visits for students and the staff. Most participants visited the campus five times a week, accounting for 66.80% of all the respondents. Moreover, around 38% of the respondents spent 31–40 hours per week on campus. The respondents were required to assess factors related to their acknowledgement of the built environment and their travel behaviour and preferences.
Importance of Factors in Built Environments
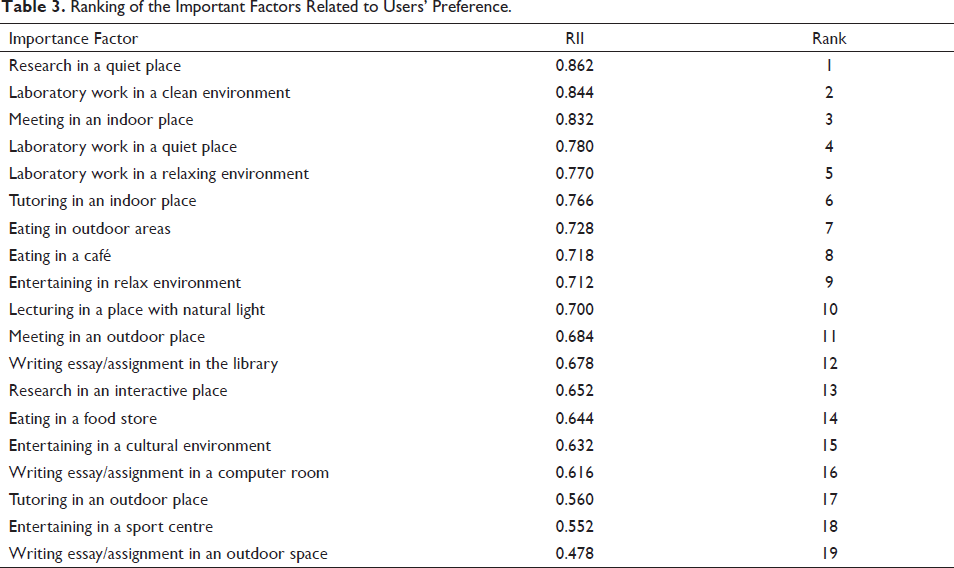
Table 3 shows the ranking of the important factors related to the users’ preferences of the campus’s-built environment. The respondents preferred a quiet, clean and indoor environment. Based on a scale of 1 to 5, each factor’s average importance is listed below.
Ranking of the Important Factors Related to Users’ Preference.
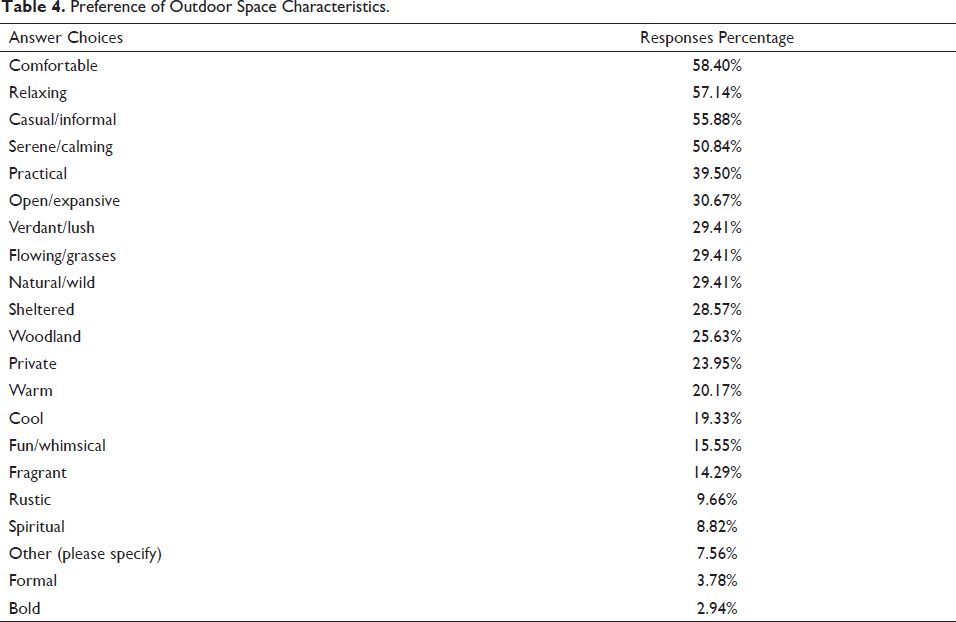
The respondents were asked to choose the campus’s characteristics and landscape that attracted them the most, as listed in Table 4. Outdoor space is the main area for campus recreation, relaxation and resilience; therefore, the users’ demands and perceptions are presented more from a social health perspective with feelings that need to be understood (Aydın & Ter, 2008).
Preference of Outdoor Space Characteristics.
Importance of Factors Affecting Travel Behaviour
According to the Australian Bureau of Statistics (2017), as shown in Table 5, driving remains the major means of travel to work in Australia. Table 5 compares the Australia-wide travel method to work and how people commute to the Mawson Lakes campus. Driving (car, as the driver) is the primary transport method for university students and staff and accounts for 83.3%, which is slightly higher than the Australia-wide usage of 68.7%, while people travelling to campus are less likely to use a shared car (car, as a passenger) and multiple methods. A slightly higher proportion use motorbikes/scooters, bicycles and walking.
Method of Travel to Work.
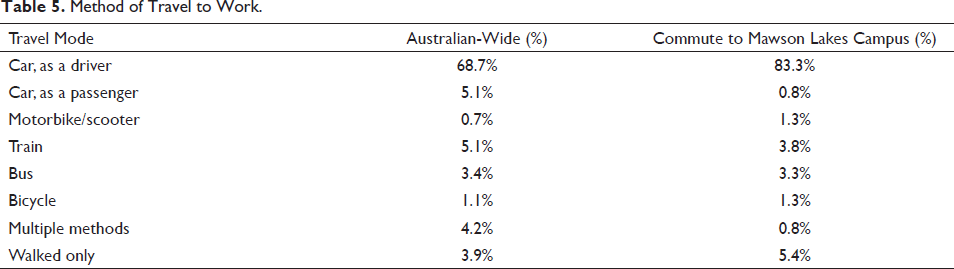
Table 6 indicates that respondents are more willing to drive to campus instead of using another travel mode. It shows the desire for public transportation, with around 20% more patrons who would like to use public transport.
Travel Mode Preference.
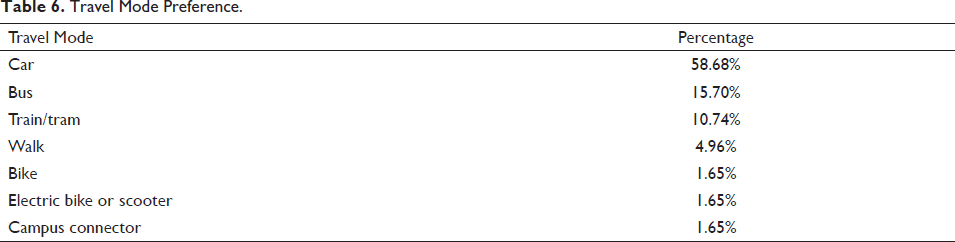
Figure 6 shows the ranking of car parks that the students and the staff prefer. Car parks ML8, ML1 and ML6 rank as the top three car parks that the students and the staff prefer. ML8, ML1 and ML6 are close to the campus’s major entrances with a capacity of 255, 100 and 122.
Car Park Preference.
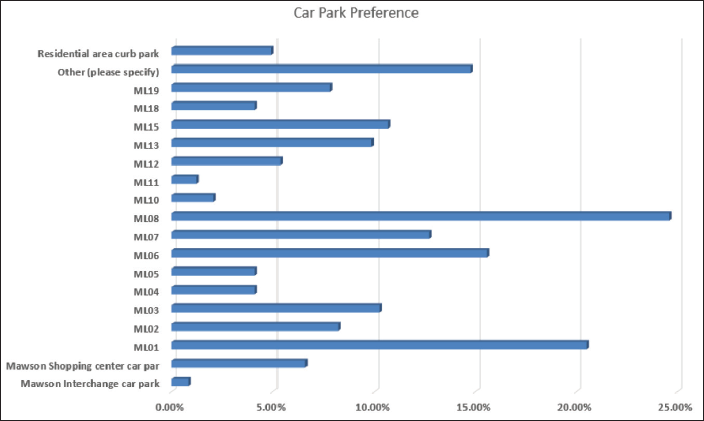
Table 7 shows how people like to travel from the interchange to the campus. In total, 30.64% of the respondents might travel from the Mawson interchange to the campus, and most people walk from the Mawson interchange to the campus. The data showed that nearly 70% of respondents do not consider a train a travel option.
Mawson Interchange to the Campus Travel Model.
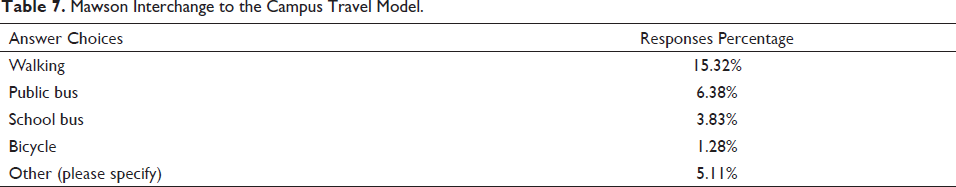
Table 8 shows how respondents perceive active travel modes (i.e., walking or cycling). In general, the respondents realised the benefit of active travel modes, and almost all of them agreed that it was safe to walk and cycle on campus and that doing so from the Mawson interchange to the campus was convenient. In contrast, the respondents perceived that there was insufficient walking and cycling tracks and facilities information on campus, from the interchange to the campus, and people around them seldom walked or cycled regularly.
Perception of Active Travel Mode.
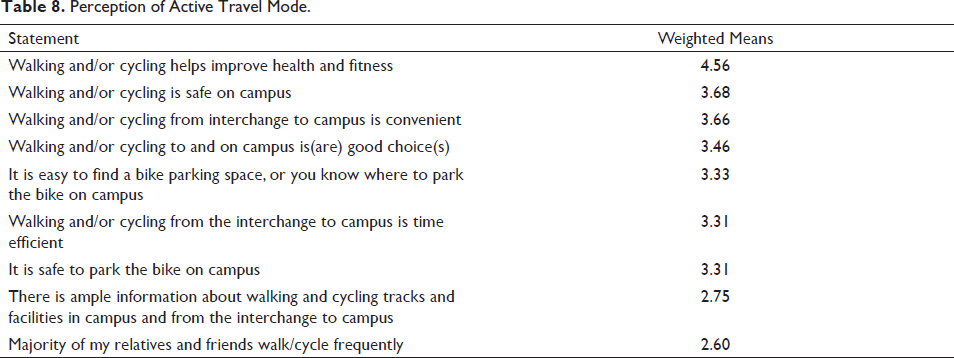
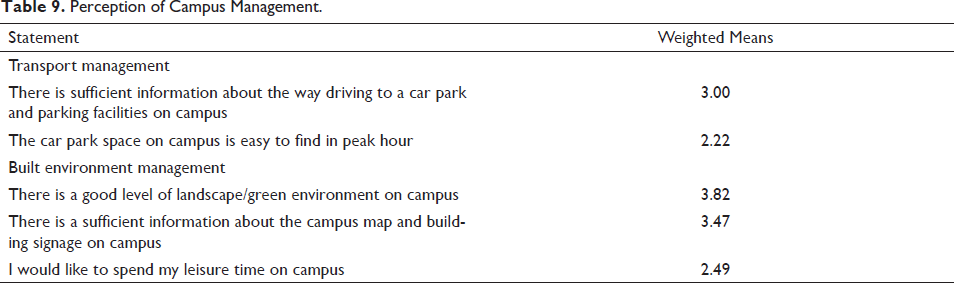
Table 9 shows the students and the staff’s perceptions of campus management in many aspects. First, the respondents maintained a ‘Neutral’ attitude in that there is sufficient information about driving routes to the car park and parking facilities on campus. Second, on average, the respondents perceived that it was difficult to find car park during peak hours (this should have improved since July 2019, as the car parking for the staff changed from an assigned car parking to a shared car park. The respondents held a negative attitude towards shared bikes from the Mawson interchange to the campus. Meanwhile, on average, the respondents agreed that the campus had an excellent landscape environment. The respondents agreed that there was an excellent way-finding system, but they did not strongly agree to spend their leisure time on campus.
Perception of Campus Management.
Different User Groups on Campus
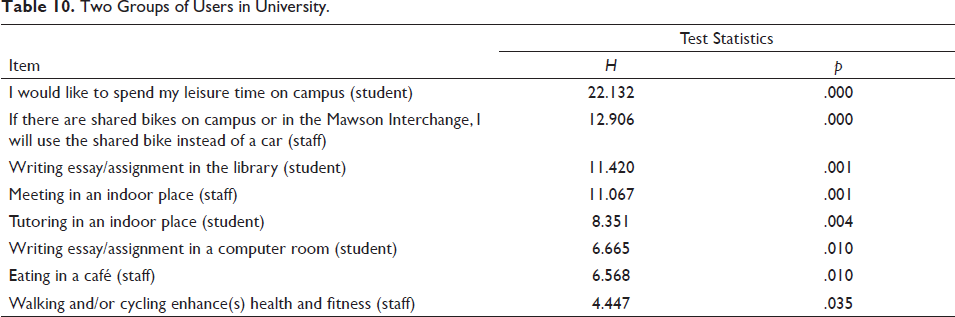
The findings of the Kruskal–Wallis H test indicated that two essential groups (students and staff) in the university played a role in evaluating the importance of factors for several items. Generally, the groups evaluated most of the factors as equivalently important. However, the students and the staff had perceptions differing to some degree (Table 10). Students tended to seek opportunities for spending leisure time, using shared bikes, writing assignments and tutoring on campus. In contrast, the staff tended to prefer eating in outdoor areas or a café or accessing active travel modes.
Two Groups of Users in University.
A Strong Voice from the Student Group
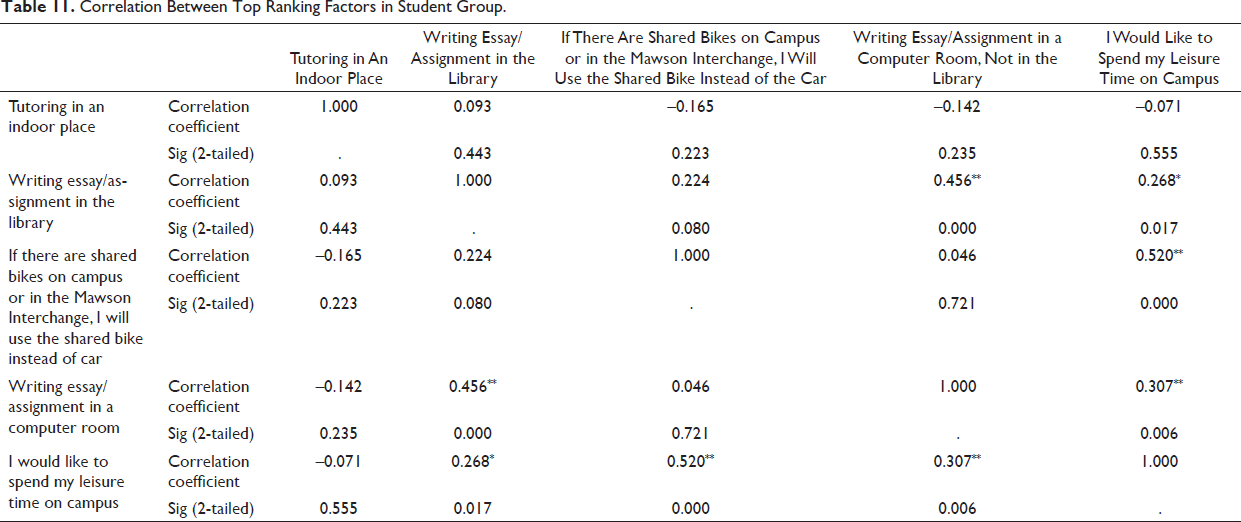
Spearman’s correlation analysis was carried out to determine whether there was a correlation between the ranking items within the student group. According to the results of the SPSS tests (Table 11), there were significant correlations between ‘I would like to spend my leisure time on campus’ and ‘writing essay/assignment in the library’, and ‘I would like to spend my leisure time on campus’ and ‘writing essay/assignment using a computer pool’. Moreover, there were some significant positive correlations; it could be said that the students who were willing to write assignments in the library were also likely to write assignments in a computer pool (rs = 0.456, p < .001). The students who agreed that ‘if there are shared bikes in the Mawson interchange, I will use the shared bikes instead of a car’ would also tend to spend their leisure time on campus (rs = 0.520, p < .001). In contrast, there was no significant statistical correlation between the top-importance ranking items within the staff group.
Correlation Between Top Ranking Factors in Student Group.
Phase 3 QFD of Mawson Lakes Campus
Linking Voice of Customers and Technicians (House of Quality)
The HOQ links customers’ and technicians’ thoughts and consists of a quality table associated with quality characteristics (Akao, 2004; Li et al., 2014), demonstrating how the campus design meets the users’ requirements. The HOQ addresses the success of campus-related factors, attributes and relationships (Griffin, 1992; Hauser & Clausing, 1988; McElroy, 1989).
Customers’ Demand Matrix (Demand Qualities)
This study collected respondents’ perception using a survey and then analysed for more accurate specifications before being grouped in a hierarchal manner as either first level, second level, or third level; then, each data item was categorised by the level of importance (Wood et al., 2016) (refer as Figure 7). The campus end-users’ demanded qualities that impact the quality elements were added into a relationship matrix to establish an accessible campus design framework. In the matrix, three figures illustrated the relationship between the demanding quality and the quality element. The strongest correlation, which was given an index value of 9, is represented by the icon (•), and the icon (O) shows a medium correlation with an index value of 5, while the icon (▽) indicates a probable correlation with an index value of 1. If there is no correlation, no icon is given.
HOQ for Mawson Lakes Campus.
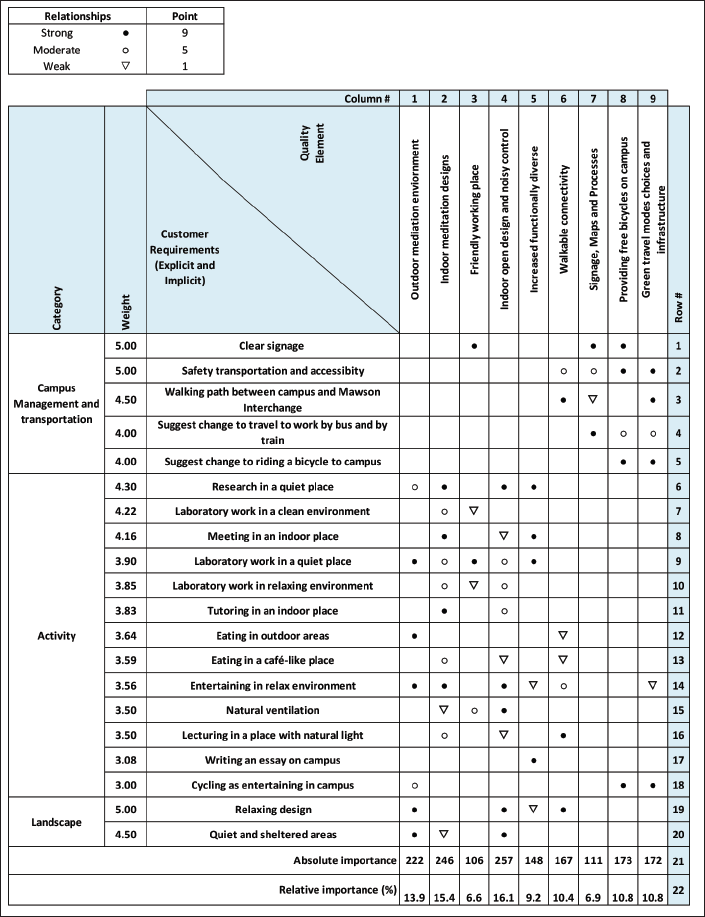
The HOQ findings are shown in Figure 7. It collects the campus patrons’ favoured activities from Phases 1 and 2 results. The results demonstrated that indoor open design and noise control was the most critical criterion, with an index of 256. The following most important requirement was providing a meditation place indoors with an index of 246. Meditation places in an outdoor environment were similarly important for campus users. This showed that providing relaxing, quiet areas was significant for indoor and outdoor environments. The requirements also put weight on providing free bicycles on campus, walking path connections and public transportation modes (20% of the participants). In comparison, providing more diverse functions, a friendly working place and signage were less critical.
Discussion
Wood et al. (2016) suggested that only identifying quality as specification compliance is not enough to assist designers to ensure their clients’ satisfaction; QFD is one of the methods used to evaluate the customers’ requirements. Based on the findings, the end-users preference was thoroughly investigated and connected with the quality element.
First, let us consider the quiet and meditation areas requirement to provide the students and the staff a high-quality place to help with emotional restoration and reduce stress. Open indoor design and quiet teaching and learning space would contribute to better education results. Second, improving campus transportation convenience, including public transport connection from home to campus (e.g., parking), free bicycles on campus (linking the campus to public transport nodes) and more sustainable modes, is necessary. Third, university building utilisation needs more diversification serving many purposes instead of only focusing on teaching activities, such as providing a café and a place for writing a thesis or conducting research work.
From the social health aspects, low health consequences are worsened by the negative interaction between individuals and the built, social and natural environments. Accessibility is one of the determinants of social factors influencing health (U.S. Department of Health and Human Services, 2020). Therefore, improving the meditation place design on campus and at any workplace can contribute to the students’ and the staff’s well-being. In contrast, exposure to a modern lifestyle with mass media and emerging technologies can negatively impact campus social determinants. Therefore, relaxing and meditation as positive physical determinants could ease negative ones (Östh et al., 2018).
Conclusions
In conclusion, conventional accessibility usually only includes physical access to services, jobs, and friends and relatives; this study suggested that accessing meditation places should be one of the necessary criteria. These planning concepts should be introduced to improve suburban business/industrial centres and rural town centres and even for the spiritual connection with the land through the first nation aboriginal people. Mixed land use with facilities needed surrounding the houses also creates job opportunities and reduce the needs to traffic (Meng et al., 2021). Thus, universities have started to develop into their town centres, which have been traditionally the local government’s domain. This may cause a conflict in Australia between the local government and the universities. There is a greater demand for local services and competition to attract accommodation, retail, hospitality, sports and entertainment in an environment with a level playing field. In most cases, universities do not pay rates and can offer competing incentives to attract investment.
There are opportunities for cohesion between the local government and the universities, as a university can be a significant economic driver for the community, although it may not always be connected with the whole community. A significant determinant of a nation’s knowledge and skills, employment, income, economic development, immigration, formation of family and prosperity of future generations is higher education, which is pursued by about one-third of the Australian population. This is not always replicated within the suburbs where the universities are connected physically. Moreover, the time spent physically at the university is not the same as the time spent living or working in a local community, and as such, there are more downtimes or underutilised spaces at universities.
Footnotes
Acknowledgement
The authors would like to express special appreciation to Mr. Justin Faggotter, the Mawson Lakes Campus Facility Management manager, University of South Australia, for his tremendous support in survey data collection and insights on-campus development.
Declaration of Conflicting Interests
The authors declared no potential conflicts of interest with respect to the research, authorship and/or publication of this article.
Funding
The authors received no financial support for the research, authorship and/or publication of this article.