
Abstract
As the COVID-19 pandemic marches exponentially, epidemiological data is of high importance to analyse the current situation and guide intervention strategies. This study analyses the epidemiological data of COVID-19 from 17 countries, representing 85 per cent of the total cases within first 90 days of lockdown in Wuhan, China. It follows a population-level observational study design and includes countries with 20,000 cases (or higher) as of 21 April 2020. We sourced the data for these 17 countries from worldometers. info, a digital platform being used by several media and reputed academic institutions worldwide. We calculated the prevalence, incidence, case fatality rate and trends in the epidemiology of COVID-19, and its correlation with population density, urbanisation and elderly population. The analysis represents 85 per cent (N = 2,183,661) of all cases within the first 90 days of the pandemic. Across the analysed period, the burden of the pandemic primarily focused on high- and middle-income countries of Asia, Europe and North America. While the total number of cases and deaths are highest in USA, the prevalence, incidence and case fatality rates are higher in the European countries. The prevalence and incidence vary widely among countries included in the analysis, and the number of cases per million and the case fatality rate are correlated with the proportion of the elderly population and to a lesser extent with the proportion of the urban population.
Background
The COVID-19 (coronavirus disease 2019) pandemic caused by severe acute respiratory syndrome coronavirus 2 (SARS-CoV-2) has swiftly created a cataclysm for the human civilisation (Wu et al., 2020). Since its appearance in the city of Wuhan (Hebei district) in China, it has been a relentless march of new cases and deaths (Wu et al., 2020). A total of 2,397,217 confirmed cases and 162,956 deaths have been reported worldwide due to COVID-19 (Coronavirus Disease 2019 (COVID-19) Situation Report—92, 2020). The pandemic has been primarily focused on industrialised, high- and middle-income countries, and the eventual march towards low-income countries of Africa and Asia seems inevitable.
No aspect of human society is untouched by this pandemic. The unprecedented strain on health systems along with job loss, business closures and the economic downturn has become a worldwide phenomenon. The virus primarily spreads through droplets and aerosols generated by an infected individual who might be asymptomatic with illness at the time (Rothan & Byrareddy, 2020b; L. Wang et al., 2020) The primary symptoms are fever, dry cough and difficulty in breathing (Rothan & Byrareddy, 2020a). While the clinical severity of disease seems to be higher among the elderly and the immunocompromised, the socio-economic fallout is falling more severely on the poor and the marginalised groups (Harapan et al., 2020; Rothan & Byrareddy, 2020b) The current lack of any successful treatment or viable vaccine is threatening to make the negative effects more prolonged, thereby delaying recovery (L. Wang et al., 2020).
The Epidemiologic Triangle is a model which can be helpful to understand the epidemiology of an infectious disease like COVID-19 and how it has spread around the world (Centers for Disease Control and Prevention, 2012). The Triangle has three corners (called vertices) (Centers for Disease Control and Prevention, 2012). The agent is the cause of the disease, and for COVID-19 pandemic it is the virus SARS-CoV-2. Hosts are organisms, usually humans or animals, which are exposed to and harbour the agent (Centers for Disease Control and Prevention, 2012). The ‘host’ heading also includes symptoms of the disease that can vary among different hosts for the same agent. The environment is the favourable surroundings and conditions external to the host which cause or allow the disease agent to be transmitted (Centers for Disease Control and Prevention, 2012). Initial reports indicated that the spread and recovery from the novel coronavirus have varied between the countries, pointing towards the variation in agent, host and environmental factors present in these different settings (Centers for Disease Control and Prevention, 2012). Therefore, there is an urgent need to explore the differences in epidemiological measures and demographic distribution of COVID-19 between different countries. This would include a difference in progression (new and cumulative cases), case fatality, recovery, morbidity among different age and chronic disease groups, population size, density and urban population (Jordan et al., 2020; Yang et al., 2020).
The main objective of this study is to describe the situation in countries with a total of more than 20,000 cases by 21 April 2020, 90 days after Wuhan, China was placed under quarantine on 23 January 2020. The aim is to identify the most heavily affected countries and hence contribute to a substantial body of knowledge to understand the pandemic progression. We thought this was of paramount importance since it would help understand the differences between characteristics of the pandemic in the most affected countries, identify the lessons available and explore unknowns associated with COVID-19 at this relatively early stage of the pandemic and help plan future course of action.
Methodology
This is a population-level observational study using pooled data from worldometers. info, a digital platform being used by several academic and media institutions, including Oxford University press, Johns Hopkins Centre for System Science and Engineering (CSSE), Wiley, Pearson, European Organization for Nuclear Research (CERN), Worldwide Web Consortium (W3C), The Atlantic, British Broadcasting Corporation (BBC) (worldometer, n.d.). Worldometer provides de-identified COVID-19 patient data in real time from all over the world, obtained by collecting information through official reports and government communication channels (directly or indirectly). The available data are in the public domain, and therefore the study did not require ethical clearance.
Data Compilation
The COVID-19 case data between 22 January 2020 to 21 April 2020 were used to extract daily new cases, new deaths, cumulative cases, cumulative deaths, recovery rate and total tests per 1 million population. The de-identified patient data were collected for 85 per cent of total cases and this included all countries with more than 20,000 cases (cumulative count) as of 21 April 2020. We obtained data for these 17 countries (USA, Spain, Italy, France, Germany, UK, Turkey, Iran, China, Russia, Brazil, Belgium, Canada, the Netherlands, Switzerland, Portugal and India) and entered and formatted them in Microsoft Excel for further quantitative data analysis.
Data on population density (people per km2), percentage of urban population and percentage of the elderly population (>65 years) for each of the 17 countries were also collected. The projected population density, urban population and elderly population were compiled from the 2019 Revision of World Population Prospects prepared by Population Division of the Department of Economic and Social Affairs of the United Nations Secretariat. 1
The 2019 Revision of World Population Prospects is the 26th round of official United Nations population estimates and projections prepared by Population Division of the Department of Economic and Social Affairs of the United Nations Secretariat.
Statistical Analysis
We analysed the compiled data for each country and calculated the following epidemiological indicators.
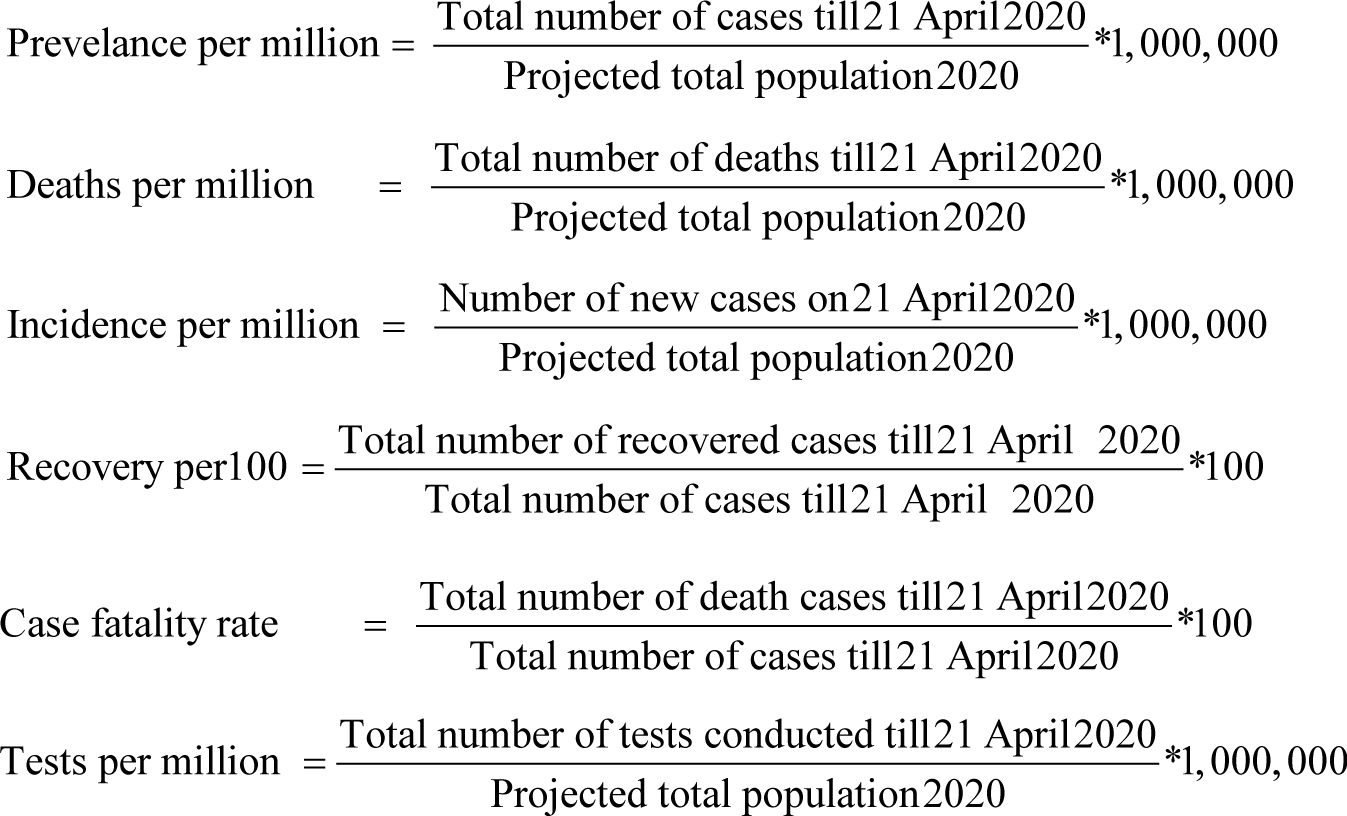
The trends in distribution of new cases and deaths were analysed for every 15-day interval. We used the Stata statistical software (version 14) for additional statistical analysis. Pearson correlation test was applied to study the strength of association between the prevalence per million with the percentage of urban population, population density, tests per million and elderly population (≥65 years). We also analysed the data similarly for the association between the case fatality rate with population density, urban population, the elderly population (>65 years) and tests per million.
Results
The 17 countries representing 85 per cent (N = 2,183,661) of all cases within the first 90 days of the pandemic were USA, Spain, Italy, France, Germany, UK, Turkey, Iran, China, Russia, Brazil, Belgium, Canada, the Netherlands, Switzerland, Portugal and India. Among 17 countries, the highest number of cases were reported in USA (37.5 per cent) followed by Spain (9.4 per cent), Italy (8.4 per cent), France (7.2 per cent), Germany (6.8 per cent), UK (5.9 per cent), Turkey (4.4 per cent), Iran (3.9 per cent), China (3.8 per cent), Russia (2.4 per cent), Brazil (2 per cent), Belgium (1.9 per cent), Canada (1.8 per cent), the Netherlands (1.6 per cent), Switzerland (1.3 per cent), Portugal (1 per cent) and India (0.9 per cent). As per WHO situation report, out of 17 countries, cases reported in 12 countries were attributed to community transmission, while those in three countries (China, India and Russia) were a cluster of cases and two (Spain and Portugal) were still pending to report (Coronavirus Disease 2019 (COVID-19) Situation Report—92, 2020). The prevalence per million, incidence per million and death per million varied widely between countries. The prevalence of COVID-19 ranged between 14.6 per million in India and 4,367 per million in Spain, whereas incidence ranged from 0.04 per million in India to 14.7 per million in Belgium. Deaths ranged from 0.5 per million in India to 517.5 per million in Belgium (Table 1).
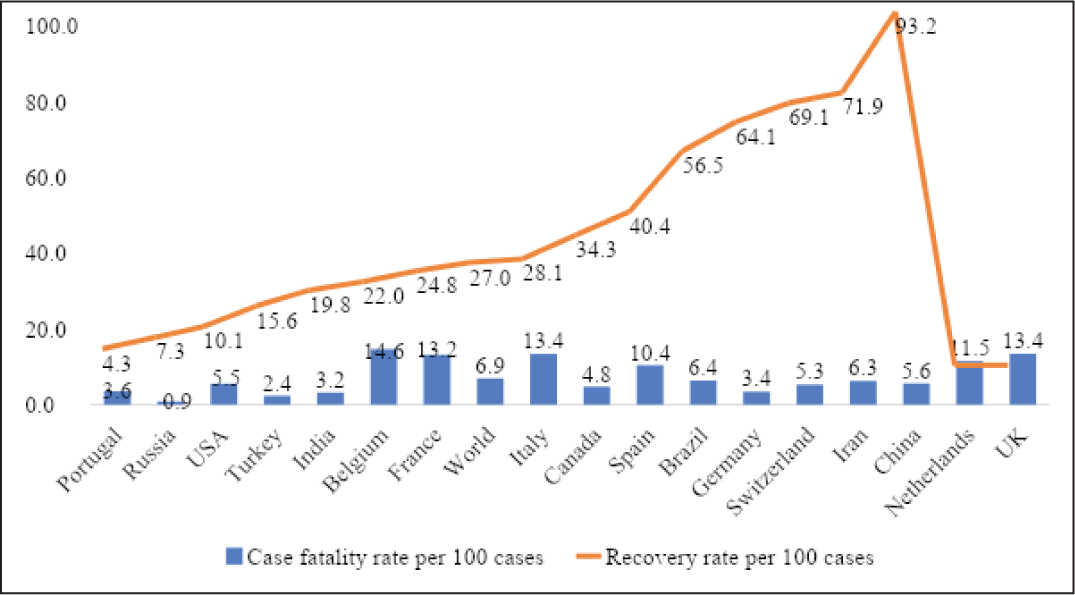
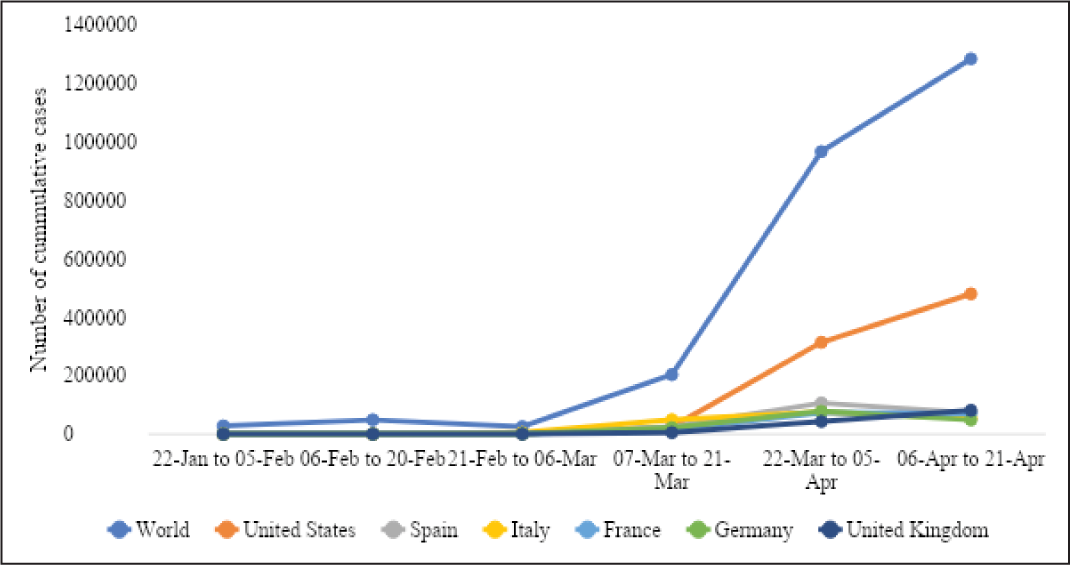
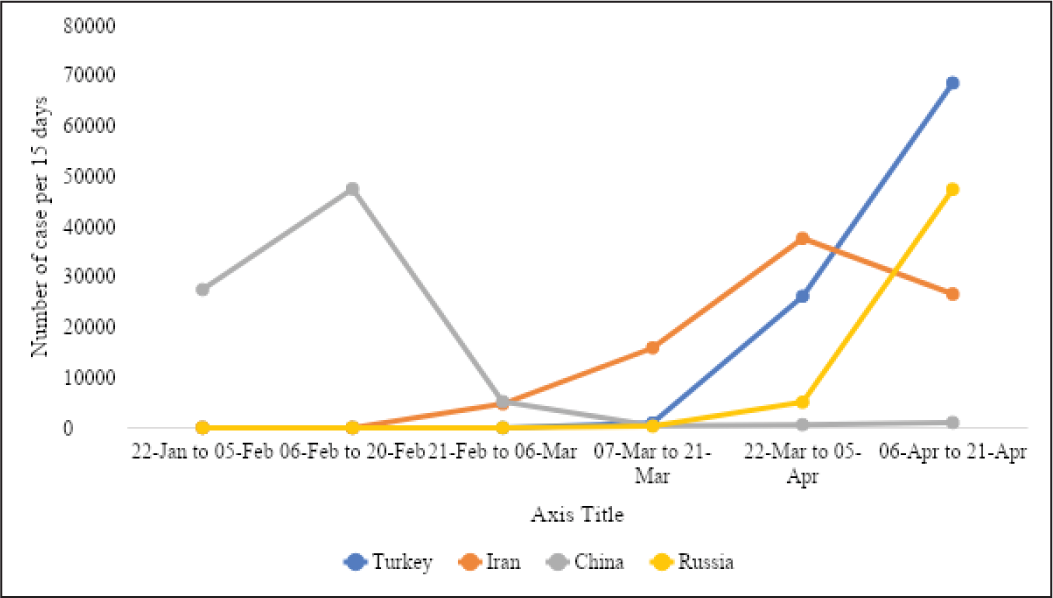
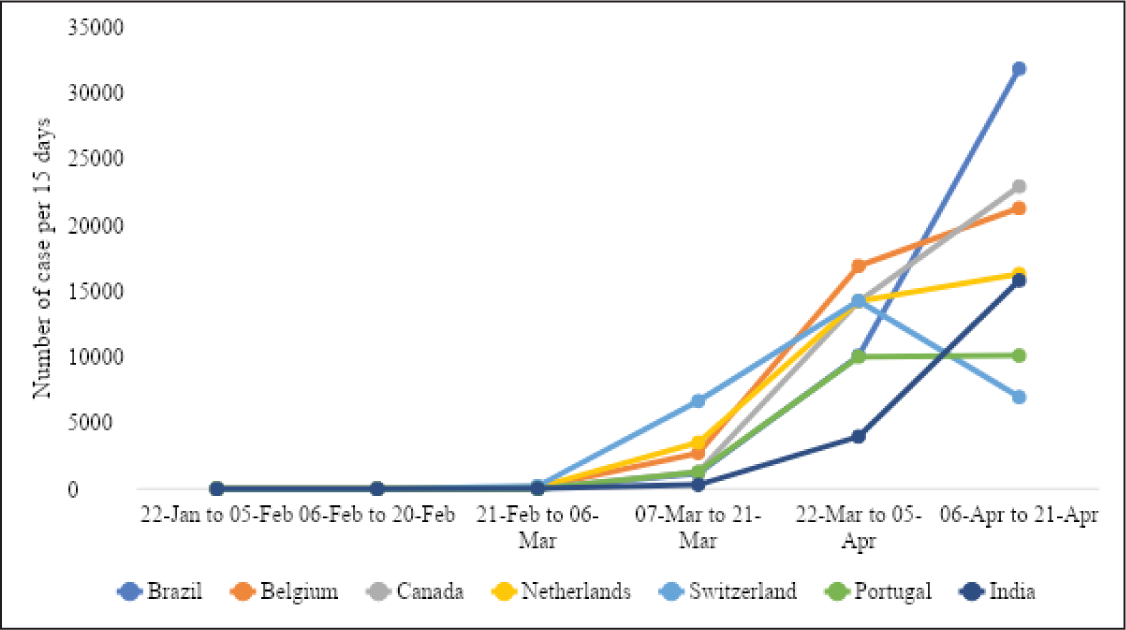
The case fatality rate (per 100 cases) recorded was highest in Belgium (14.6 per cent) and lowest in Russia (0.9 per cent). The recovery rate (per 100 cases) ranged from 93.2 per cent in China to 4.3 per cent in Portugal (Figure 1). Six countries, namely USA, Italy, Spain, France, Germany, UK, had more than 100,000 cumulative cases by 21 April 2020. Out of these six countries, USA and UK have a continuous rapid increase in COVID-19 cases in every 15-day interval. A rapidly increasing trend of COVID-19 cases was observed till 5 April 2020 in Spain, Italy, France and Germany. Later, in the following 15-day interval, Spain, Italy and Germany have shown a decreasing trend in COVID-19 cases (Figure 2). Four countries have between 50,000 and 100,000 COVID-19 cases and they include Turkey, Iran, China and Russia (Figure 3). Turkey, Russia and Iran have shown a continuously increasing trend of COVID-19 cases. Besides, Iran has shown a decreasing trend in cases in the last observed 15-day interval between 6 and 21 April 2020. Seven out of 17 countries have less than 50,000 cumulative cases of COVID-19 and they include Brazil, Belgium, Canada, the Netherlands, Switzerland, Portugal and India. Although the first COVID-19 case reported in these seven countries was in mid and/or late February 2020, except Switzerland, the number of cases has continued to increase till 21 April 2020 (Figure 4).
Countries with >20,000 Cumulative Reported Cases of COVID-19 on 21 April 2020

Total Cases (Per 1,000,000 Population), Case Fatality Rate Per 100 Cases and Their Association with Population Density, Urban Population, Tests Per Million and Elderly Population (>65 Years) by Country as on 21 April 2020

The total cases per million showed a weak correlation with population density (r = 0.14, p = 0.58, N = 17) and a moderate correlation with urban population (r = 0.44, p = 0.07, N = 17) (Table 2). Tests per million (r = 0.67, p = 0.003, N = 17) and elderly population (r = 0.70, p = 0.002, N = 17) showed a strong correlation with total cumulative cases per million (Figure 5). This association was found to be more prominent in countries with community transmission. The case fatality rate showed a weak correlation with test per million (r = 0.02, p = 0.934, N = 17). It was observed that population density (r = 0.38, p = 0.12, N = 17), urban population (r = 0.49, p = 0.04, N = 17) and elderly population (r = 0.45, p = 0.06, N = 17) showed a moderate correlation with case fatality rate (Figure 6).


Discussion
Our observational study reports on the early phase of COVID-19 pandemic and includes countries with 85 per cent of the reported cases in the first 90 days from the start of quarantine in Wuhan, China. Our findings indicate the burden of the pandemic during this early phase primarily focused on high- and middle-income countries of Asia, Europe and North America. While the total number of cases and deaths is highest in USA, the prevalence, incidence and case fatality rates are higher in European countries. The number of cumulative cases for every 15 days since 22 January 2020 is on a rise in most countries and it indicates a rising trend of the pandemic. Cumulative cases are declining in China, Italy and Spain, each exposed to the pandemic earlier than other countries. Two notable exceptions with relatively late onset and declining trend in cumulative cases are Germany and Switzerland. Across the 17 countries, the number of cases per million and the case fatality rate are correlated with the proportion of elderly population and to a lesser extent with the proportion of urban population.
The rising burden of COVID-19 across the 17 countries represents the early stages of the pandemic caused by a highly infectious airborne viral agent. However, the variation in epidemiological parameters in these countries seems to be associated with host and environmental level factors. Older age of the host has been reported as an important risk factor in several studies, and our study indicates a higher burden in countries with a higher proportion of the elderly population (Guan et al., 2020; Jordan et al., 2020; Manary et al., 2004; Mb et al., 2020; Raoult et al., 2020; D. Wang et al., 2020; Wu et al., 2020). Higher population density and subsequent increase in physical proximity of infected and susceptible hosts in urban centres are reported to facilitate the transmission of airborne virus particles (Lee et al., 2020; Rocklöv & Sjödin, 2020). Similar to other studies on factors that promote airborne transmission of illnesses, in our study a higher proportion of the urban population is an environmental risk factor associated with a higher burden of COVID-19 (Lee et al., 2020; Mb et al., 2020; Rocklöv & Sjödin, 2020). The prominent urban nature of this pandemic is reflected in the virus, first originating from Wuhan and spreading to other urban cities including Milan, Madrid, Seattle, New York, Detroit and New Orleans (Mb et al., 2020; D. Wang et al., 2020). Our study also indicates that some countries seem to be more successful at disrupting the agent, host and environment triad and stem the rising trend to ‘flatten the curve’ more quickly. The importance of rapid scale-up of testing, tracing and isolation of infectious cases has been repeatedly reported in the literature and the news media; however, testing rates vary widely among the countries included in our study (Verity et al., 2020). Italy and Spain were ahead in the pandemic curve and subsequently were able to scale up testing efforts successfully. Germany, Portugal and Switzerland were part of the later wave of infection; however, they were able to scale up testing faster than other countries, thereby able to flatten the curve faster.
While our study describes the disease burden and some of the agent, host and environmental factors associated with COVID-19 pandemic in the first 90 days, some caution is needed in comparing across countries that might calculate these estimates differently. There is no accepted international standard for how deaths or their causes should be measured. Some countries count a death due to COVID-19 only if the virus is recorded as the main cause of death, while others count a death due to COVID-19 if there is any mention of the virus on the death certificate. Moreover, medical certification of deaths varies widely across countries. While for most European countries, certification is almost universal, in India only 22 per cent of registered deaths are medically certified. A characteristic feature of the infective agent is a vast pool of asymptomatic cases, that if not tested would recover without being counted as a case of COVID-19 (Cascella et al., 2020; Ye et al., 2020). The wide variation in testing rates across countries would probably also affect the number of confirmed cases reported in each country (Verity et al., 2020). Therefore, comparing the death rate in confirmed cases is difficult across multiple countries. Moreover, some countries record the number of people tested, while others record the total number of tests carried out (many people need to be tested more than once to get an accurate result).
While the findings of our study are instructive of important host and environmental factors during the early phase of COVID-19 pandemic, it will be useful to follow up with additional epidemiological studies during the mid and late stages and its eventual transmission in low-income countries of Africa, Asia and South America (Adhikari et al., 2020). Additional host factors that would be important to explore are comorbidities among infected patients, including hypertension, chronic respiratory disease, kidney disease and diabetes (Guan et al., 2020; Yang et al., 2020). Several important environmental factors could also be included in future studies, including rural versus urban location; weather conditions (e.g. temperature); effect of different interventions (e.g. lockdown, testing, tracing and isolation) being implement by governments around the world (Chan et al., 2011; Lee et al., 2020; Rocklöv & Sjödin, 2020).
Footnotes
Declaration of Conflicting Interests
The authors declared no potential conflicts of interest with respect to the research, authorship and/or publication of this article.
Funding
The authors received no financial support for the research, authorship and/or publication of this article.