
Abstract
The article aims to present a bibliometric study that sought to identify the profile of scientific articles in the Scopus database on the term Stage-gate, in the period from 2013 to September 2023, analysing how the evolution of the dissemination of international scientific studies for the area of product development. The research methodology is quantitative through bibliometrics that evaluates scientific metrics. The author who published the most was Robert Cooper with 12 documents, the journal that most addresses the term Stage-gate is Research Technology Management with nine documents and the keyword amiss cited is Stage-gate with 9% of the citations. The country that contributes the most and contributes to the Stage-gate method is the United States with 78 documents. In conclusion, the results presented highlight the relevance of this model, the contribution of different authors, the diversity of academic sources, and the global dispersion of this concept.
Introduction
According to Cooper (1990), the Stage-gate method is a structured and iterative approach to the product development process. It provides a clear and organized guide for companies throughout each product lifecycle stage, from conception to market launch. This methodology has proven to be extremely important for both companies and the academic world, as it offers several benefits that drive success and innovation.
One of the main advantages of the Stage-gate method is its ability to increase efficiency and reduce risks in product development. By dividing the process into defined stages, each with its own evaluation and decision-making criteria, companies can identify problems and opportunities earlier, avoiding wasting resources on projects that have no potential for success. In addition, the Stage-gate method allows companies to adopt a data- and information-driven approach, making more informed and informed decisions (Stage-gate International, 2023).
Another important aspect of the Stage-gate method is its ability to promote innovation. By defining specific plans for generating and evaluating ideas, the process encourages creativity and out-of-the-box thinking. This allows companies to explore new solutions, technologies and approaches, driving continuous innovation and differentiation in the market (Walrave et al., 2022). In addition, the Stage-gate method also encourages collaboration between different areas of the company, such as research and development, marketing and production, enabling the integration of different perspectives and knowledge (Cooper & Sommer, 2018).
In the academic context, the Stage-gate method has been widely trained and adopted as an effective approach to research and product development. It provides a clear and repeatable framework for conducting scientific studies, allowing researchers to evaluate and improve their findings over time. In addition, the Stage-gate method also facilitates communication and collaboration between researchers from different areas, promoting the exchange of knowledge and the creation of strategic partnerships (Tavares-Quinhoes & Velez-Lapão, 2023).
The Stage-gate method is an essential approach for business and the academic world. It offers a robust and organized framework for product development, increasing efficiency, reducing risk and encouraging innovation. By adopting this method, how can it improve their ability to launch successful companies into the market, while academic researchers can enhance their findings and contribute to the advancement of knowledge in their respective fields? Therefore, the Stage-gate method plays a key role in improving competitiveness and advancing innovation in both the business and academic worlds (Cooper, 2008).
The article aims to present a bibliometric study that sought to identify the profile of scientific articles in the Scopus database on the term Stage-gate, in the period from 2013 to September 2023, analysing how the evolution of the dissemination of international scientific studies for the area of product development. The article is divided into: (a) Introduction; (b) Theoretical framework; (c) Methodological procedure; (d) Analysis of the results and discussion; and (e) Final considerations.
Theoretical Framework
Product Development Process
The product development process is a crucial step for companies that want to stand out in the market and offer innovative solutions to consumers. Throughout this journey, several phases are traversed, from the identification of opportunities to the launch of the final product. Each of these steps plays a key role in the success of the product and requires a strategic and judicious approach (Trott et al., 2022).
According to Kruachottikul et al. (2023), initially, the identification of market opportunities is the starting point. Through research and trend analysis, companies seek to identify unmet demands and gaps in the market. This research is critical to driving product development and ensuring that it meets the needs of consumers.
The idea generation phase occurs, where several product concepts are created. At this time, creativity is essential to explore different approaches and find innovative solutions. However, these ideas must be selected based on criteria such as technical feasibility, market potential and alignment with the company’s strategy (Tavares-Quinhoes & Velez-Lapão, 2023).
Once the concept is selected, the design and development phase begins. At this stage, prototypes are created and tests are carried out to validate the technical feasibility and acceptance of the product by the market. Quality, safety, regulations and sustainability are aspects that must be considered during this process, to ensure that the product meets legal and ethical requirements (Kampf et al., 2023).
According to Binci et al. (2023), production is the next stage, in which the product is manufactured at scale. Here, it is necessary to consider issues such as cost, efficiency and ability to meet market demand. It is essential to find the balance between product quality and the costs involved in production to ensure competitiveness in the market.
After production, the final testing phase is carried out, where aspects such as durability, performance and safety of the product are verified before its distribution. It is important to ensure that the product complies with established standards and that it can meet consumer expectations (Binci et al., 2023).
The launch strategy is another crucial point in this process. It is in this phase that the marketing and communication actions are defined to publicize the product and reach the target audience effectively. Good launch planning can be decisive for the success of the product, creating expectations and generating interest in the market (Tiwari et al., 2024).
During launch, it is critical to monitor product performance and collect customer feedback. This step is essential to identify possible adjustments and improvements that can be made to increase consumer acceptance and satisfaction. The ability to adapt and continuously improve is an important differential in this process. As the product gains traction and a larger share of customers, it enters the growth phase. At this stage, it is necessary to be attentive to market demands and look for ways to expand the presence and participation of the product (Stage-gate International, 2023).
However, it is important to note that the product development process does not end with growth. When reaching the maturity stage, it is necessary to evaluate the need for updating or replacing the product. The evolution of market demands and technological obsolescence are factors that must be considered in this decision-making (Cooper & Kleinschmidt, 1987).
Throughout the process, it is essential to have a trained and engaged multidisciplinary team. Collaboration between different areas and clear communication is essential to ensure the success of the product. In addition, the use of innovative technologies and tools can also boost the development process, facilitating the creation and testing of prototypes, for example (Rozenfeld & Amaral, 2006).
In short, the product development process is a complex journey that requires strategic planning, creativity, technical rigor and continuous adaptation. Each step of this process plays a key role in the success of the product and requires a judicious approach. With efficient execution and a clear vision of the market, companies can create innovative and successful products, winning consumer preference and achieving business success (Cooper & Kleinschmidt, 1987; Cooper & Sommer, 2018; Rozenfeld & Amaral, 2006; Stage-gate International, 2023).
Stage-gate Method
According to Vasconcellos and Marx (2011), the stage gate is a method to manage the development of new product projects, constituting that its first generation was architected in 1985 by Cooper (1990) and perfected since then from the examination of hundreds of product launches to identify what has been done by successful companies and teams in new product development (DNP), to distinguish product development practices.
According to Stage-gate International (2023), the model Stage-gate was widely disseminated and today brings as a result the commercialization of a 2–3 times faster product, 72% profitability of the marketing values, and 12 times more productivity in the development phase. Another interesting fact is that 80% of the total 1,000 global companies use this concept for the development of new products, which shows the robustness of the methodology (Stage-gate International, 2023).
According to Cooper (2008), the method of Stage-gate is a conceptual and active representation of the development of new products, which goes from the idea to the launch of the product in the market. The author suggests that the innovation process is divided into a set of stages (stages). Each internship focuses on a set of pre-defined activities, developed equivalently and carried out by a multidisciplinary group. Stages are designed to generate data so that the project can thrive for the next stage (Cooper & Sommer, 2018).
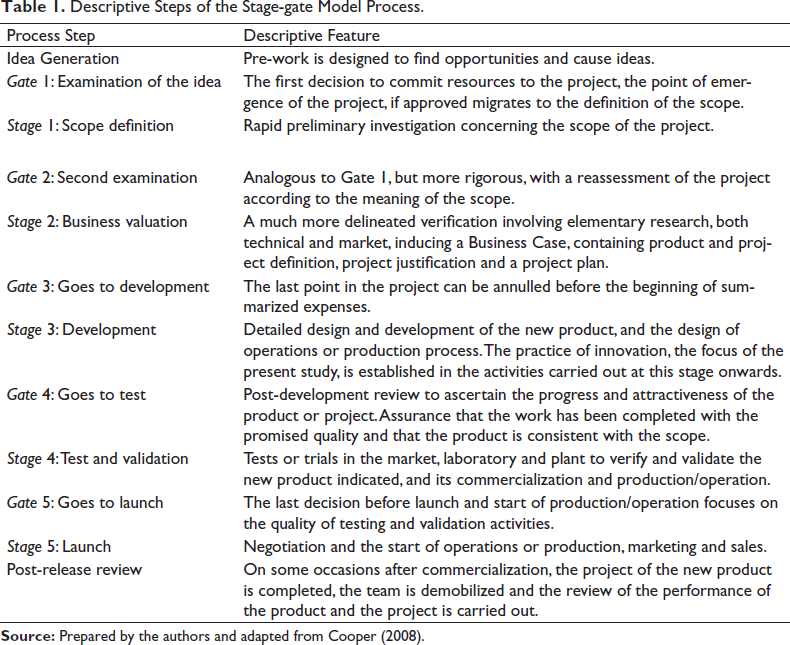
Cooper (1990) provides the following definitions: (a) Stage: manifest as phase, refers to the stage where the actions take place. The multidisciplinary team carries out the previously defined activities, in addition to others in parallel. (b) Gate: manifesto as an investigation, refers to the stage where decisions to remain or eliminate the project take place. Through the adoption of metrics, the potential for success of the projects is evaluated and the quality control of the development is carried out. Us Gates projects are prioritized and resource allocation is presented and chosen. Stage-gate is not a rigid process. Organizations can and need to adapt it to their situations, not essentially need to go through all stages (stages) or gates (gates), activities and lectures can be ignored, in their way, activities from one stage can be transferred to another stage, as recommended by Cooper (2008). For a more detailed understanding, the objective was to make Table 1 with the characteristics of each stage of the model Stage-gate.
Descriptive Steps of the Stage-gate Model Process.
There are some criticisms of the Stage-gate model that have been recorded that according to Sethi and Iqbal (2008) have found problems with the application of the Stage-gate model for new product development. Based on a survey of 120 projects focused on DNP, they found that Stage-gate’s strict control criteria overrode design inflexibility, which in turn induced learning failures in the ‘DNP’ design 1 and thus nullified product performance.
According to Kopmann et al. (2017), they indicated the idea of ‘strategic control’, which includes the control of facilities, the control of implementation and control of entirely unforeseen new things. The first two controls are linked to the given strategies and the last control is connected to emerging strategies in particular. Based on a survey of 182 DPN projects, they found that strategic control activities not only promoted the implementation of the desired strategies (i.e., ‘main flow’ of DPN projects that went through the classic rigorous gate review process) but also consented to the discovery of strategic opportunities revealing emerging patterns.
Qin and van der Rhee (2021), used their research the literature review and interviews with managers to minimize some flaws of the Stage-gate model. By developing a checklist companies can use to identify potentially successful new products (treasures) among previously abandoned projects (junk), the study checklist is not only useful for reducing the sunk cost associated with projects rejected before but can also cultivate their potential for success and become a complete Stage-gate model (Marzi, 2022; Stage-gate International, 2023). For these reasons, this classic process has been subject to changes and adjustments by some companies. In this sense, for high-uncertainty projects, the software industry has implemented Agile methods at each stage of the classic stage gate (Cooper & Sommer, 2018).
Evolution of the Stage-gate Model.
The Stage-gate Full model is a more complete and detailed version of the Stage-gate model for managing new product development projects. It includes a series of sequential steps that must be completed before the project can progress to the next phase. Steps include detailed project assessments, market analysis, concept development, financial analysis and various validation tests (Cooper, 1990; Cooper & Sommer, 2018).
The goal of the Stage-gate Full model is to ensure that new product designs are well-planned, financially viable and supported by market research and proof of concept. It provides a robust framework for project management and helps ensure that all important aspects of the project are taken into consideration before proceeding to the next phase. In summary, the Stage-gate Full model is an expanded version of the Stage-gate model that includes more details and steps to ensure the quality and feasibility of new product designs (Stage-gate International, 2023).
The Stage-gate Lite model is a simplified and more agile version of the Stage-gate model for managing new product development projects. It is designed for lower-risk, smaller-scale projects such as minor product modifications and renovation projects.
The Stage-gate Lite model includes only two phases: a business case scope and elaboration phase, followed by the execution phase, which involves product development, testing and launch. This simpler process allows project teams to move faster and more efficiently, with fewer detailed documents and assessments, which is appropriate for simpler, lower-risk projects. In summary, the Stage-gate Lite model is a more agile and simplified version of the Stage-gate model, suitable for projects of lower risk and scale, such as minor product modifications and design renovations (Binci et al., 2023; Stage-gate International, 2023).
Stage-gate Express is a variation of the Stage-gate process designed for smaller, lower-risk projects with fewer unknowns. It is an accelerated 3-stage version of the traditional 5-stage Stage-gate process, which includes idea generation, idea screening, concept development and testing, business analysis, development, testing and launch. The Stage-gate Express process emphasizes speed and efficiency and includes fewer inputs and deliveries than the traditional process. It is usually used for minor product modifications or improvements, line extensions, or other incremental changes (Cooper & Sommer, 2018; Walrave et al., 2022).
Research Method
This research is classified as descriptive and quantitative because it involves the use of techniques based on statistics to investigate, ensure the accuracy of the results, and avoid distortions of analysis and interpretation, which will result in greater security to the inferences. (Hair et al., 2009). To respond to the objectives of this research, the bibliometric diagnosis of the scientific production on the Stage-gate method was carried out. The choice for bibliometrics results from the increasing precision of measuring the increases and increments of science and technology in the various areas of knowledge (Grácio et al., 2020; Vanti, 2002).
Bibliometrics can be perceived as a ‘quantitative and statistical technique for measuring the indices of production and dissemination of knowledge’ (Fonseca, 1986). It presents itself as an important technical instrument, because it allows, through the measurement of the number of publications and citations of researchers, to analyse the productivity and quality of research in a given area of knowledge (Kozma et al., 2023; Urbizagástegui Alvarado, 2002; Vanti, 2002).
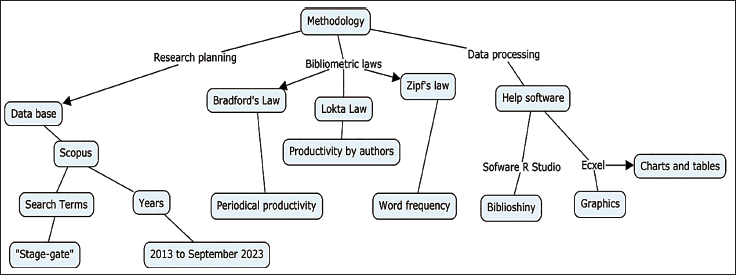
To better visualize the structure of the research and its analysis, a mental map was used, as a more accurate planner for a bibliometric (Figures 1). Mind maps are snapshots of notes of information. According to Buzan and Buzan (1996), the creators of this technique known in English as Mind maps, are instruments of thought that confirm the reflections externally in what goes on in the mind. It is a way of equipping thoughts and making the most of mental aptitudes. The mind map was developed with the help of the free use software Cmaptools.
Mental Map of the Study.
Data Collection
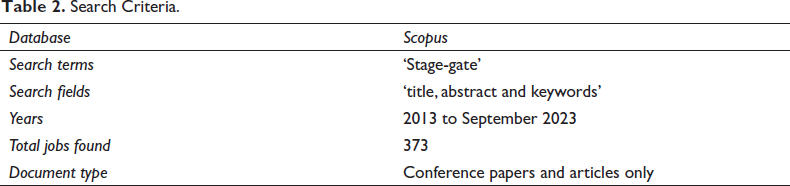
For data collection, the Scopus database was used, given its multidisciplinary character, comprehensive worldwide and because it has an indexed volume of works, it belongs to the Elsevier platform. The largest database of abstracts and citations of technical and scientific peer-reviewed literature is estimated, namely: books, scientific journals and conference proceedings. Table 2 shows the search criteria.
Search Criteria.
Bibliometrics has certain practical principles resulting from the improvement of science over time that have been termed laws. Lotka’s Law (1926) is the productivity of each author, being a criterion for the dimension and frequency to raise the impact of the production of an author in a given area of knowledge. Bradford’s Law (1949) is the degree of charm of the journal with the criterion of reputation to identify the most relevant journals that give maximum flow to a specific research topic. Zipf’s Law (1949) conceives the frequency of keywords with the ordered list of most recurrent themes pertinent to a field of knowledge (Chueke & Amatucci, 2015; Mugnaini et al., 2017)
In short, based on the problem and the objectives of the research, criteria and strategies were defined to guide the search and collection of information. Then, with the support of the R software using the bibliochiny data package, the necessary procedures were carried out to treat and transform the available data into useful data capable of supporting the definition of studies and/or actions of researchers and professionals in the area.
Processing of Collected Data.
For operationalization purposes, the complete bibliographic data were exported in the BibTeX (.bib) file format. Subsequently, the Bibliometrix package (version 3.0.4) was installed and loaded into the RStudio environment (version 1.4.1103) to support the initialization of the Biblioshiny application (Aria & Cuccurullo, 2017). Indicated for the realization of scientific mappings, Biblioshiny stands out as one of the most complete research tools related to bibliometrics and scientometrics, having an intuitive interface, as well as a wide range of the number of functionalities, analyses and graphs (Aria & Cuccurullo, 2017).
Analysis and Discussion of Results
Macro View of Research Data
For the syntax of the data in a macro form, we elaborate the Table 4, with the data extracted from the Scopus database.
Table 3 provides a series of data related to a particular source of information. In this text, we will analyse and discuss the data in this table to better understand the main information and content of the referenced documents. Key information about the data: The period covered by the data is from 2013 to 2023, totalling 10 years of information collected. During this period, 282 different sources were used to obtain the registered documents. In all, 373 documents were found in this source.
Key Data Information.
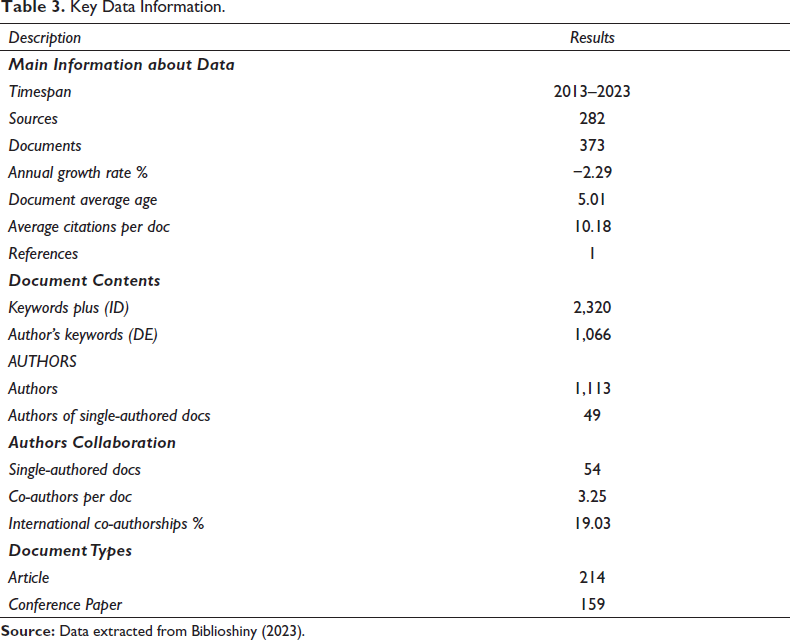
The annual growth rate of these documents was –2.29%, decreasing a decrease in the number of documents over time. In addition, the average age of the documents is 5.01 years, which suggests that the proven source contains both recent and older documents (Grácio et al., 2020).
Regarding the instructions, each document has, on average, 10.18 requests. This information indicates that the documents presented in the source are considered relevant and have been referenced by other authors (Vanti, 2002).
Contents of the documents: The table also highlights some information about the content of the documents found in the supporting source. ‘Keywords Plus’ (ID) are additional terms assigned to documents, and 2,320 of these terms were found. In addition, 1,066 keywords were provided by the authors of the documents themselves (DE) (Mugnaini et al., 2017).
Authors: The table reveals that 1,113 different authors were found in proven documents. Of these, 49 were the sole authors of their respective documents, while the others worked in collaboration with other authors.
Collaboration between authors: Of the 373 documents analysed, 54 were written by a single author, while the others were the result of collaborations between different authors. On average, each document had 3.25 co-authors. In addition, 19.03% of the collaborations occurred between international authors, evidencing the internationalization of the academic work present in the proven source (Chueke & Amatucci, 2015).
Document types: Finally, the table presents information about the types of documents found. A total of 214 articles and 159 conference papers were identified. These data indicate that the proven source contains a variety of types of academic documents, which contributes to the diversity of information available (Fonseca, 1986).
The analysis of the data in Table 3 revealed useful information about the data source in question. Through this data, we can better understand the main information and content of the documents, as well as the collaboration between authors and the types of documents present. This analysis contributes to the understanding of the importance and relevance of the source of proven data, as well as its contribution to academic and scientific production (Kozma et al., 2023).
Timeline of Publications
The timeline of publications using bibliometrics can be constructed based on different indicators, such as the number of articles published each year, the number of submissions received by these articles and the index of the authors, among others. By analysing the timeline of publications, it is possible to identify periods of accelerated growth, periods of stagnation and even periods of decline in scientific production. This information is important for understanding the evolution of a field of research over time and for identifying areas of greatest interest and impact.
By analysing the number of articles published each year, we can observe some trends and patterns (Figure 2). In 2013, 29 articles were published in this specific field. This number increased to 41 articles in 2014, indicating a growth in scientific production. The following year, in 2015, there was a small drop, with 32 articles published. In subsequent years, the number of articles varied between 31 and 39, showing relative stability in production. As of September 2023, there have been 23 articles.
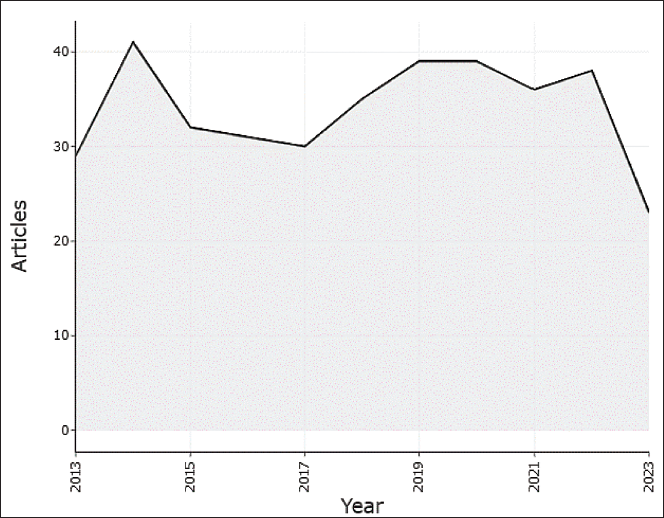
In some years, such as 2014 and 2019, there was a significant increase in the number of articles compared to the previous year. This may indicate a more productive group of authors or greater collaboration among these researchers in specific years.
Lotka’s Law
Lotka’s Law, also known as the Inverse Square Law, is a law that describes the distribution of authors’ productivity in a given field of scientific knowledge. This law was formulated by the mathematician and bibliometrist Alfred J. Lotka in 1926 and is widely used in the field of bibliometrics to analyse the productivity of authors in terms of scientific publications (Urbizagástegui Alvarado, 2002).
According to Lotka’s Law, author productivity follows an uneven distribution, where the vast majority of authors contribute a relatively low number of publications, while a small number of authors account for a significant proportion of total publications (Chueke & Amatucci, 2015).
The author who published the most was Cooper with 12 documents. Robert Cooper is a prominent figure in the area of innovation management and product development. He is widely recognized for developing the Stage-gate model, a structured approach to managing the process of bringing new products to market. The Stage-gate model, also known as the Stage-gate process, provides a framework for organizations to effectively and efficiently navigate the various stages and decision points involved in product development.
Cooper first introduced the Stage-gate model in the 1980s as a response to the need for a more systematic and efficient approach to managing innovation projects. The model is based on the concept of breaking down the product development process into a series of distinct steps or doors, with specific criteria and checkpoints at each step to evaluate and make decisions about the progress of the project. Figure 3 shows the 10 authors who published the most on the research topic.
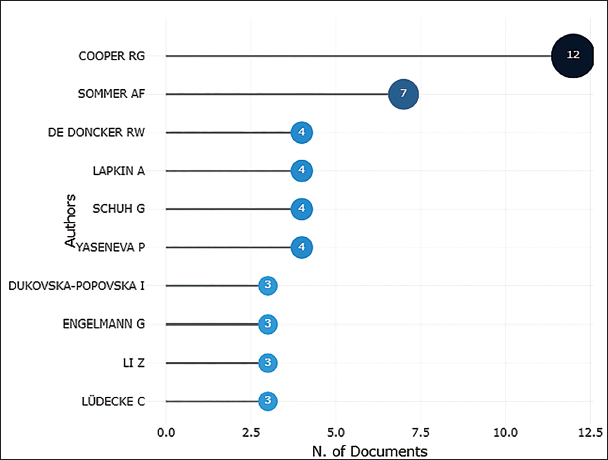
Sommer was the second most published author with seven documents and has a partnership with Cooper in publications on the Stage-gate method. The Authors De Doncker, Lapkin, Schuh and Yaseneva, have four documents each. The authors with three documents each in the Scopus database are Engelmann; Li and Lüdecke.
In this data set, each author contributed an article, indicating an equal level of productivity. However, the fractional representation of the articles provides insights into the distribution of productivity. The authors’ fractional contributions range from 0.11 to 0.33, implying varying levels of productivity among the authors.
Bradford’s Law
Bradford’s Law is one of the fundamental laws of bibliometrics, an area of study that uses quantitative methods to analyse and measure scientific production. This law was proposed by Samuel C. Bradford in 1934 and describes the distribution of documents in different subject areas. According to Bradford’s Law, most scientific documents are technical in a limited number of journals or scientific journals. These journals are considered the ‘core’ or ‘central core’ of the research area because they concentrate on a greater number of relevant articles (Mugnaini et al., 2017).
Bradford’s Law also establishes that there are ‘peripheral core’ articles that, although not as relevant as the central core, are still considered important to the research area. In addition, there is a third zone called the ‘dispersion zone’, where the less relevant newspapers are. This distribution of documents in the core, peripheral core and scattering zone is known as ‘Bradford’s law of scattering’. This law is useful to assist in the selection of journals for bibliographic review, as it indicates which are the most important and relevant for a given area of study (Grácio et al., 2020). Figure 4 shows the 10 authors who published the most on the research topic.
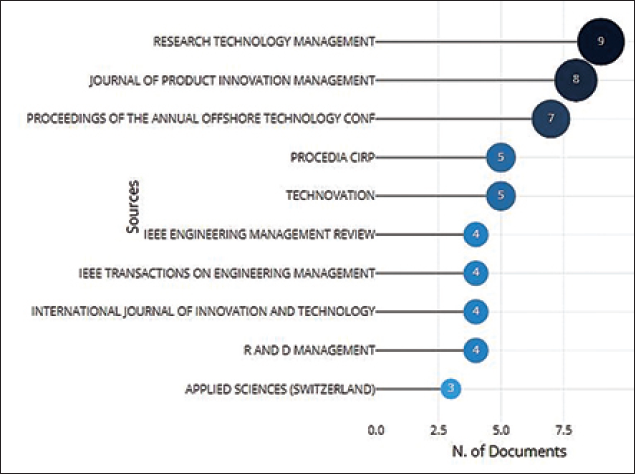
Figure 4 provided shows the grouping of sources through Bradford’s Law. It shows the number of articles published in various sources or journals. Research Technology Management: This source has the highest number of articles with a count of nine. Journal of Product Innovation Management: This source has the second-highest number of articles, with a count of eight. Proceedings of the Annual Offshore Technology Conference: This source has seven articles. CIRP and Technovation Proceed: These two sources have five articles each. IEEE Engineering Management Review, IEEE Transactions on Engineering Management, International Journal of Innovation And Technology Management, R&D Management and Applied Sciences (Switzerland): these sources have 4, 4, 4, 4 and 3 articles.
Zipf’s Law
Zipf’s Law is an empirical law that describes the frequency distribution of words in a linguistic text or corpus. According to Zipf’s Law, the frequency of a word is inversely proportional to its ranking in the frequency table. In other words, the most frequent words in a linguistic text or corpus have a much higher frequency than the less frequent words. For example, the most frequent word occurs approximately twice as often as the second most frequent word, three times as often as the third most frequent word, and so on (Grácio et al., 2020).
Zipf’s Law is widely observed in different languages and types of text, including literary texts, scientific documents, speeches and even in words used in internet search engines. It is considered one of the fundamental laws of linguistics and has important implications for natural language processing, text analysis and information modelling (Urbizagástegui Alvarado, 2002).
It is worth mentioning that Zipf’s Law is a statistical law observed in the media and can vary in different contexts and types of text. However, it provides a basis for understanding the frequency distribution of words and helps identify linguistic patterns and features in a text (Vanti, 2002). Figure 5 proves that the number of keywords linked to the term ‘Stage-gate’ increased over time, reaching a total of 2,320 words used over the 10 years studied.
TreeMap is a mapping data structure that implements the Map and NavigableMap interface in Java. It is similar to a HashMap, but the elements are stored in a tree, which ensures that they are kept in order. TreeMap can be used to store key-value pairs where the order of elements is important. For example, TreeMap can be used to store a list of words in alphabetical order or a list of dates in chronological order.
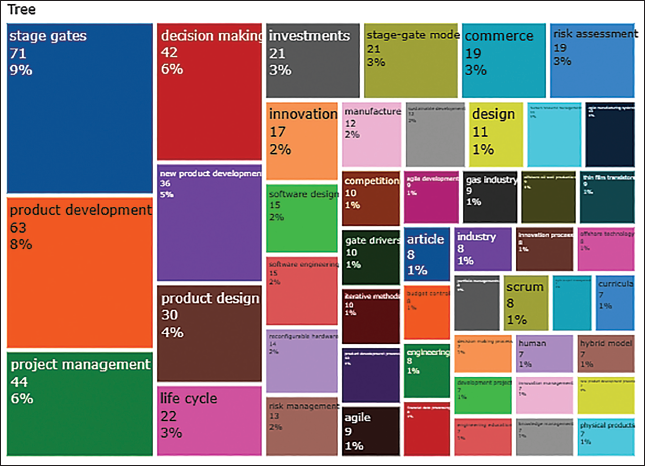
Figure 5 provides an overview of the distribution and frequency of terms related to the grouping of sources and the production of the main terms used in searches. It suggests that ‘Stage-gate’ is the most frequently mentioned term, followed by ‘product development’ and ‘project management’. These terms may represent key concepts or areas of focus in the context analysed.
Social Structure
The Collaboration WorldMap is a visualization of scientific collaboration between countries. It is elaborated from bibliometric data, which are data about the publication of scientific articles. The data is used to create a network of countries, where each country is connected to other countries by the number of articles co-authored by researchers from those countries.
Collaboration WorldMap can be used to visualize the global landscape of scientific collaboration. It can also be used to identify countries that collaborate and to track changes in collaboration over time.
Collaboration WorldMap is a powerful tool that can be used to understand the dynamics of scientific collaboration. It can be used by researchers, policymakers and other stakeholders to make informed decisions about research funding and collaboration strategies. Figure 6 shows the social structure of the publications.
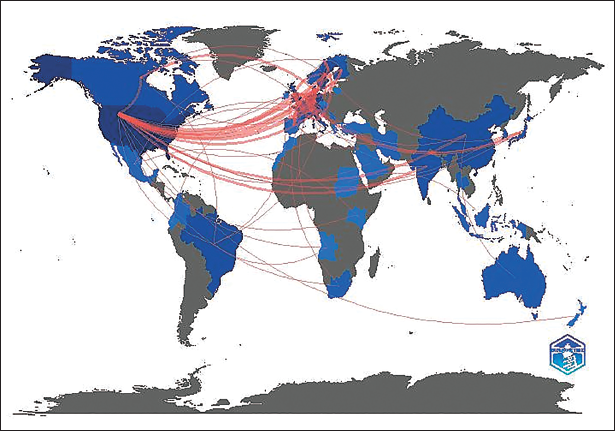
Figure 6 shows that several countries have published articles on the Stage-gate method. However, we focus on the 10 countries that have published the most. There was also a substantial presence of European countries. The United States has 78 documents first and Germany with 41 documents. In third place comes the UK with 28 documents. Sweden comes fourth with 24 documents followed by the Netherlands with 23 documents in fifth place. Based on this information in Figure 6, we can observe that Brazil has several documents, with a total of 21. Then both Canada and China have 19 documents each. Denmark has slightly less, with 17 documents. Finally, India has only 11 documents.
Table 4 shows the frequency of connections between the U.S. and various countries. Each row represents a connection from the U.S. to a specific country, and the frequency column indicates the number of occurrences of that connection.
Frequency of Connections Between the U.S. and Other Vountries.
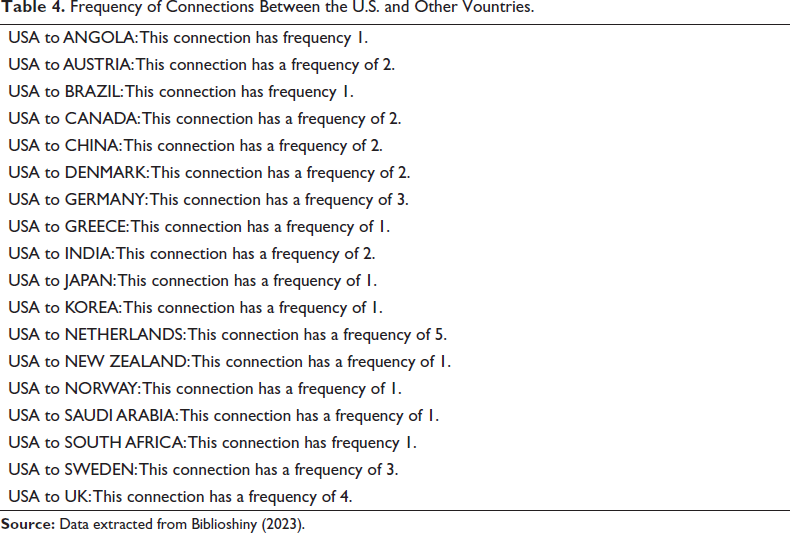
Table 4 provides an overview of the connections between the U.S. and various countries, indicating the frequency of these connections. It suggests the level of interaction or communication between the U.S. and each country mentioned. It is important to note that without additional context or information, it is challenging to draw definitive conclusions from this table alone. Further analysis and interpretation would require a deeper understanding of the specific domain or field under investigation.
Discussion of the Stage-gate Method
The Stage-gate model is a strategic approach widely used in product development and innovation processes. It has been developed to ensure that each step of the process is carefully evaluated and approved before moving on to the next phase (Cooper, 1990).
In the context of the text provided by the authors in Figure 2, we will discuss the Stage-gate model about the results presented. According to the results, Sommer is the second most published author, with a total of seven documents. In addition, she has partnered with Cooper on the Stage-gate method publications. This indicates that both have a common interest in this model and are contributing significantly to the field (Cooper & Sommer, 2018).
In addition to Sommer, other authors have also developed research on the Stage-gate model. De Doncker, Lapkin, Schuh and Yaseneva have four documents each. These authors are also engaged in the dissemination and exploration of this method (Kozma et al., 2023).
However, it is interesting to note that the fractional representation of the articles reveals important insights into the distribution of productivity among authors. Fractional contributions range from 0.11 to 0.33. This implies that some authors have higher productivity levels than others. This variation may be the result of different factors, such as experience, available resources and the approach adopted (Vanti, 2002).
When considering the importance of the Stage-gate model, it is essential to take into account the diversity of authors’ contributions. Although all have contributed to an article, differences in productivity indicate that some may have a deeper understanding or more effective application of this method (Grácio et al., 2020).
The results presented in Figure 4 show the distribution of articles published in various sources or journals related to the Stage-gate model. According to the information provided, the source ‘Research Technology Management’ has the largest number of articles, totalling nine publications. This indicates that this source is an important reference for research related to the Stage-gate model (Fonceca, 1986).
Then we have the Journal of Product Innovation Management, which has the second largest number of articles, with a total of eight publications. This source is also highly relevant in the field of innovation management and product development.
Another source mentioned is Proceedings of the Annual Offshore Technology Conference, which has seven articles. This suggests that this conference is also a significant platform for the dissemination of research on the Stage-gate model in the context of offshore technology. Also, ‘Procedia Cirp’ and ‘Technovation’ are two sources that have five articles each. These journals are also important for knowledge sharing and advancements in the field of innovation management and product development (Stage-gate International, 2023).
Finally, we have several sources that have fewer articles related to the Stage-gate model. IEEE Engineering Management Review, IEEE Transactions on Engineering Management, International Journal of Innovation And Technology Management, R&D Management and Applied Sciences (Switzerland) have 4, 4, 4, 4, and 3 articles, respectively. These results indicate that the Stage-gate model is an active research topic and widely explored in several academic sources. These publications were sent for the understanding and application of the model in different contexts and sectors (Mazi, 2022; Tavares-Quinhoes & Velez-Lapão, 2023).
Analysing the results presented in Figure 4, we can observe the most cited keywords about the Stage-gate model. The word ‘Stage-gate’ appears most frequently, accounting for 9% of the total 2,320 proven words. This indicates that the Stage-gate model is a central concept and is widely discussed in the context of the research conducted (Stage-gate International, 2023).
In addition, the expression ‘product development’ is mentioned with a frequency of 8%, which demonstrates the importance attributed to this process in the context of the Stage-gate model. This emphasis on product development is directly related to the idea of innovation and continuous improvement (Tiwari et al., 2024).
Another relevant keyword is ‘project management’, with 6% frequency. Second Kopmann et al. (2017), highlight the importance of efficient and structured management to ensure the success of the model Stage-gate. Proper management of resources, deadlines and risks is critical to the successful progress of a project (Sethi & Iqbal, 2008).
The expression ‘decision-making’ is also mentioned with a frequency of 6%. This underscores the importance of making informed and strategic decisions in each phase of the Stage-gate model. Decision-making is crucial to ensure that resources are allocated correctly and that the project is headed in the right direction (Rozenfeld & Amaral, 2006).
Other keywords mentioned in the text include ‘new product developments’ with 5%, ‘product design’ with 4%, ‘life cycle’ with 3%, ‘investments’ with 3% and ‘innovation’ with 2%. These additional keywords highlight different aspects and elements involved in product development and implementation of the Stage-gate model (Kruachottikul et al., 2023).
The results of the keyword analysis highlight the importance of the Stage-gate model in the context of product development and project management. These results demonstrate the emphasis on elements such as product development, project management and decision-making, as well as highlighting the importance of innovation and the product life cycle. This information is essential to understanding the application and impact of the Stage-gate model in practice.
The United States will top the list, with 78 published documents. Second, we have Germany, with 41 documents, followed by the United Kingdom, with 28 documents. Sweden ranks fourth with 24 documents and the Netherlands comes in fifth with 23 documents. In the Brazilian context, it is possible to observe that Brazil has a significant number of published documents, totalling 21. This demonstrates the country’s interest and participation in the field of studies related to the Stage-gate model.
Regarding Canada and China, both have 19 published documents, which indicate a similar level of involvement in this research. Denmark has slightly less, with 17 documents. Finally, India has fewer published documents, with only 11. However, it is important to note that the number of documents published does not necessarily reflect the quality or relevance of the research conducted in each country.
These results evidenced the importance and global diffusion of the Stage-gate model. Through the analysis of the countries that have published the most on the subject, we can perceive the impact and interest that this model generates in the academic and business communities around the world (Stage-gate International, 2023).
Final Considerations
The Stage-gate model is a strategic approach widely used in product development and innovation processes. It is designed to ensure that each step of the process is carefully evaluated and approved before moving on to the next phase. The results presented demonstrate the relevance of this model, as well as the contribution of different authors to its development and dissemination.
Authors Sommer and Cooper are highlighted as important contributors to the field, with a significant partnership in publications on the Stage-gate method. In addition, other authors have also dedicated themselves to the research and exploration of this model. The diversity of the authors’ contributions indicates that there are different levels of productivity and understanding of this method.
The distribution of articles in different academic sources reveals the importance and dissemination of the Stage-gate model in several areas. Some sources are highlighted, such as Research-Technology Management and Journal of Product Innovation Management, which have a significant number of publications. This demonstrates the relevance of these sources as important references for research related to the Stage-gate model.
The most cited keywords in the articles indicate the main topics and elements related to the Stage-gate model, such as the term ‘Stage-gate’ itself, product development, project management and decision-making. These keywords highlight the importance of these aspects in the context of the application of the model.
The Analysis of the countries that have published the most about the Stage-gate model reveals the global impact of this model, with the United States leading the list followed by Germany, the United Kingdom, Sweden and the Netherlands. Brazil also stands out with a significant number of publications, demonstrating the country’s interest and participation in this field of study. The Stage-gate model is a strategic approach widely used in product development and innovation processes. The results presented highlight the relevance of this model, the contribution of different authors, the diversity of academic sources and the global dissemination of this concept. This information is essential to understanding the application and impact of the Stage-gate model in practice.
Limitations of the Research
Bibliometrics, like any scientific method, has its limitations. Although it is a valuable tool for the analysis of scientific production and the impact of academic works, it is important to recognize its restrictions. Here are some limitations of bibliometrics:
Publication bias: Bibliometrics depend on articles and documents published in journals and conferences. However, not all academic papers are published, and many negative or less relevant studies may not be included in bibliometric analyses. This can lead to a distorted view of scientific production in certain areas. Language bias: Bibliometrics is often based on databases that primarily cover the English literature. This can result in an underrepresentation of searches in other languages, which can lead to envied or incomplete instructions. Exclusion of other forms of scholarly communication: Bibliometrics focuses primarily on journal and conference articles, leaving out other forms of scholarly communication, such as technical reports, theses and dissertations. This can lead to a limited view of the scientific landscape in certain areas. Lack of contextualization: Bibliometrics mainly analyses the number of articles, citations and other bibliometric indicators. However, it does not take into account the context in which these works were produced. This can lead to mistaken or simplistic interpretations of the results. Lack of quality: Although bibliometrics can provide an overview of scientific production, it does not directly measure the quality of work. An article may receive many requests, but that doesn’t necessarily mean it’s high quality or relevant to the area.</NL>
Future Research
For future work use other databases and other bibliometric laws. Conduct a Systematic Literature Review from the Stage-gate concept, to generate a list of applications in industries, information technology and public management. That can be estimated with a new mapping. Conducting a meta-analysis of studies with the Stage-gate method financially impacts organizations.
Footnotes
Declaration of Conflicting Interests
The authors declared no potential conflicts of interest with respect to the research, authorship and/or publication of this article.
Funding
The authors received no financial support for the research, authorship and/or publication of this article.