
Abstract
‘Science’ has for long been advocated as a key driver of Africa’s post-independence modernisation. This project featured strongly in the Organization of African Unit Lagos Plan of Action of 1980 that called for governments to mobilise 1% of GDP towards building their scientific and technological capabilities. The 1% goal was duly re-affirmed at the African Union Ministers’ Conference of 2003, in Africa’s Science and Technology Consolidated Plan of Action 2005, and in the 2014 Science, Technology and Innovation Strategy for Africa. The contribution presents a high-level assessment of the extent to which these various efforts are revealed in the present continent-wide status of science, technology and innovation (STI). To this end, a high-level appraisal of STI inputs, focus and outputs is assembled. In so doing, the limitations of data and STI indicators must be acknowledged. While there are signs of progress, STI policy has greater rhetorical than operational outcome, raising concerns for African states’ capability to attain the SDGs and shape their participation in the Fourth Industrial Revolution.
Keywords
Introduction
Advocacy regarding the importance of science, technology and innovation (STI) came early in the life of the African Union, founded in 2002 at Durban, South Africa, as the successor to the Organization of African Unity (OAU). The most appropriate point of departure for this assessment is, therefore, reference to the African Union seminal document ‘On the Wings of Innovation, the Science, Technology and Innovation Strategy for Africa 2024 (STISA–2024)’, ‘that places science, technology and innovation at the epicentre of Africa’s socio-economic development and growth’ (African Union [AU], 2014a). This strategy follows from the prior ‘Africa’s Science and Technology Consolidated Plan of Action (CPA)’ (African Union, 2005) that set out five programmes to improve policy conditions and build innovation mechanisms, including science and technology policies, and their measurement through the African Science, Technology and Innovation Indicators (ASTII) initiative. The CPA re-affirmed the 1980 Lagos Plan of Action target of 1% for Gross Expenditure on Research and Development to GDP (GERD: GDP) (OAU, 1980). The work on indicators then gained substance through the founding of the African Observatory on Science, Technology and Innovation (AOSTI) and the African Innovation Outlook series (AU, 2010, 2014b, 2019). African and international donors supported these moves.
The above intentions notwithstanding, the African Union comprises of considerable diversity in group, language, governance, focus, industrialisation and innovation activity, comprising of 55 member states. In population size, she is only comparable with China and India, both of which are federal states. Assessing the status of STI of Africa is thus a formidable task that is more challenging by the absence of an authoritative and overarching statistical authority on par, for example, with the European Union Eurostat, or national statistical authorities of a China, India, the Russian Federation and so on.
This contribution offers an appraisal of the status of STI, nearly two decades into the life of the African Union, examining policy, research and innovation inputs, system focus and outputs, with consideration given to domestic and international knowledge exchanges. Attention is given to attainment of the SDGs, especially food and health security. The prospects for engagement with the emerging Fourth Industrial Revolution (4IR) are also addressed. At the time of writing, the COVID-19 pandemic had not yet manifested, and hence its mitigation and impact cannot be covered in depth.
The article comprises of eight sections. The ‘Introduction’ section is followed by a section on ‘Methodological Notes’. The third and fourth sections cover developing talent and scientific production, respectively. The fifth section is devoted to innovation activities, followed by the sixth section which gives consideration to linkages. The findings are brought together in the seventh section, which is followed by the concluding remarks and recommendations.
Methodological Notes
The obvious starting point for the assessment must be African Innovation Outlook III (AU, 2019) that presents data for 23 AU member states. The following must be noted:
The ‘2019’ data covers a range from year 2012 to 2015. The data is far from current. Of the 23 states that provided R&D Survey data for African Innovation Outlook III, only 8 have submitted data for the AIO series since 2010. R&D survey coverage is generally incomplete, and restricted to public sector R&D performs, namely the universities, government and public research institutes (PRIs). Innovation surveys are a rare occurrence among the member states
This data hiatus is naturally replicated in the data repositories of the multinational organisations such as the UNESCO Institute for Statistics (UIS), which over the period 2013–2018 hosted GERD data for about 26 African countries. However, of the 156 associated fields for the period, only 42 are populated. The R&D survey data is a rare event.
Accordingly, sets of indices that draw on UIS data, for example, those of the World Bank, African Development Bank, Global Innovation Index and Global Competitiveness Index (WEF, 2019) are equally incomplete insofar as data on research and innovation for African countries is concerned.
High- and middle-income countries have the political will and capacity to regularly conduct surveys on the inputs to R&D or innovation activities according to the guidelines of the Frascati Manual (OECD, 2015) or Oslo Manual (OECD, 2018), respectively.
For STI activities in Africa, the task of data collation is the responsibility of the AU ASTII initiative and the African Observatory of Science, Technology and Innovation (AOSTI). Since late 2005, ASTII, later joined by AOSTI, has assisted in building national capacity to conduct R&D and innovation surveys.
Given the sparse budgets available for national statistical authorities to conduct R&D and innovation surveys, two points must be made. The first is that measurement capacity is limited. The second point is more positive in that anecdotal evidence is that measurement activities have stimulated cross-sector dialogue on the importance of research and innovation.
Noting the measurement difficulties, the UIS worked with the Organization for Economic Cooperation and Development (OECD) Committee of National Experts on S&T Indicators to produce a technical guide—Measuring R&D in Developing Countries (UNESCO, 2010). This was then adopted as the Frascati Manual Annex (OECD, 2012) and was subsequently incorporated into the 7th edition of the Frascati Manual (OECD, 2015). The Technical Guide and Annex note the difficulties facing statistical authorities and offers pragmatic advice on how estimations may assist the task of data compilation.
An unconventional approach is that which was adopted by the World Bank and Elsevier (World Bank–Elsevier, 2014, p. 3) that points to ‘shortcomings of reliable statistics on education and research’ and then averred that ‘the information contained in a bibliometric database will shed light on regional collaboration within Africa, academia-business collaboration, and STEM capacity’. This approach extends the use of bibliometrics to track the geographic mobility of scientists (Moed et al., 2013). The approach does not substitute for bibliometric analysis using the Web of Science database (Clarivate Analytics) or Scopus (Elsevier) to examine focus, productivity and impact. There is, of course, no simple way of making a precise correlation between publication outputs and research expenditure. Bibliometrics cannot substitute for R&D surveys.
Another measurement thrust is typified in the targeted opinion surveys of the World Economic Forum Global Competitiveness Report (WEF, 2019) and the World Bank Doing Business Survey (World Bank, 2019). Both such surveys result in country rankings that may serve to guide investment decision-making. By their very nature, executive opinion surveys are subjective and influenced by respondent selection, their perceptions and the prevailing zeitgeist. When business confidence is high, executive opinion may lead to elevated scoring; when the economy is in recession, opinion may turn negative.
UN agencies such as World Intellectual Property Organization (WIPO; patent, copyright, design, trademarks), the International Telecommunications Union (ITU; connectivity) and the International Union for the Protection of New Varieties of Plants (UPOV) compile data of relevance to assessing STI capacity and productivity. The WIPO and ITU African data coverage are more complete than the UIS STI data, while that of the UPOV is patchy, with only a handful of countries reporting cultivar registrations.
Other sources for gauging STI performance include indices on development (e.g., UNDP Human Development Index), governance (Freedom House; Ibrahim Index: Economist Index), industrial development (UNIDO industrial diversification) and education outcomes (OECD Programme for International Student Assessment [PISA]; Trends in International Mathematics and Science Study [TIMSS]). Attention must also be given to the achievement award schemes.
These various measures serve to generate the usual STI indicators. As yet, there is no agreed African Innovation Scoreboard, the closest to such being the intention of Economic and Social Commission for West Asia (ESCWA) to develop a Middle East North African Innovation Scoreboard. While there are examples of econometric estimations at national level, no specific African model has been published, though a number of African countries have been included in the econometric analysis of Fagerberg and Srholec (2017).
STI performance information, despite ongoing language and discipline biases, is partially demonstrated through bibliometric analysis. It is poorly served by direct fieldwork activities that the collection of R&D and innovation data requires. The situation is compounded by the dearth of essential registries, be these of students, graduates or companies. These are the very issues that were addressed in UNESCO (2010) that suggested that estimation and imputation methods be explored. An exploration of novel heuristic approaches is long overdue. At face level, conducting R&D surveys of the public sector entails a census of known performers. The usual issues apply as follows: generating a shared understanding of what counts as R&D; who is a researcher; how to estimate the full-time equivalent; and obtaining estimates of labour costs, space costs and capital expenditure. When it comes to the private sector, the essential problem is the identification of R&D performers. To this end a random survey may be effected, or a purposive survey undertaken. The first requires a business register that is often unavailable; the second is labour intensive and requires specialised investigators. As above, the usual issues apply. Collection of the data needed to generate STI indicators requires dedicated staff and resources.
Better documentation of sources of funds for R&D is needed. In many countries’ research and innovation systems, foreign funding dominates, especially towards health sciences research. This raises important questions concerning agency and control of innovation systems. Finally, while much is made of the need to measure innovation activities in the informal sector, this remains ‘terra incognita.’
Developing Talent
Skilled personnel are the basis for all innovation systems. It is thus encouraging to note the progress being made in primary education. WEF (2019), based on UNESCO data, documents the quality of primary education for thirty-three African countries, finding gains for fourteen, little change for seven and some decline for twelve. Strong gains were shown by Algeria, Burundi, Kenya, Mali, Mauritania, Mauritius, Namibia, Rwanda, Senegal, South Africa, Swaziland and Zimbabwe. Even so, the Global Education Monitoring Report (UNESCO, 2018) continues to record a steep fall-off in enrolment rates for secondary schooling and low rates of take-up into technical and vocational education.
Improving science, technology, engineering and mathematics (STEM) education thus remains an ongoing challenge. Information and communications technology (ICT)-based STEM instruction holds promise; ultimately competent teachers will hold the key to the improvement in outcomes.
As for the higher education, UIS for 2018 recorded 15.9 million students enrolled across the continent, with 8.34 million in sub-Saharan Africa (SSA) and 6.88 million in Northern Africa. Over the decade, enrolments rose by 42% for SSA and 25% for North Africa, and this despite the much higher income status of the North African countries. The explanation for lower growth is a possibility linked to political instability and lower hydrocarbon revenues.
Some 390,000 students from SSA attended foreign institutions, as did 168,000 from North Africa. There were large inward flows to Senegal, Ghana, Mauritius and to South Africa, especially from their neighbours. South Africa serves as the sub-Saharan hub for postgraduate studies, with 7% of its student body being international students. At postgraduate level, some 40% of its doctoral graduates hailed from elsewhere in Africa (Cloete et al., 2015), and 60% of her postdoctoral students were internationals. A pilot study on the career paths of the international African doctoral graduate holders found that the overwhelming majority returned to their home countries upon graduation (Kahn et al., 2019; Kahn & Oghenetega, 2021). These mid-career professionals thereby engaged in ‘brain circulation’.
Limitations aside, it behoves to include reference to university ranking systems. The three most influential are Times Higher Education, Academic Ranking of World Universities (ARWU) and whose methodologies address university staff–student composition, outputs and openness of the, differ in detail and weighting. According to the Leiden Africa’s leading universities are clustered in South Africa and Egypt, with one each in Ghana, Kenya, Nigeria and Uganda. The ranking schemes lend themselves to gaming by university administrators in their quests for prestige. To compensate for such bias, Vernon et al. (2018) make the case that universities and grant administrators should rather consider a range of ranking systems rather than the one that gives highest rank for an institution.
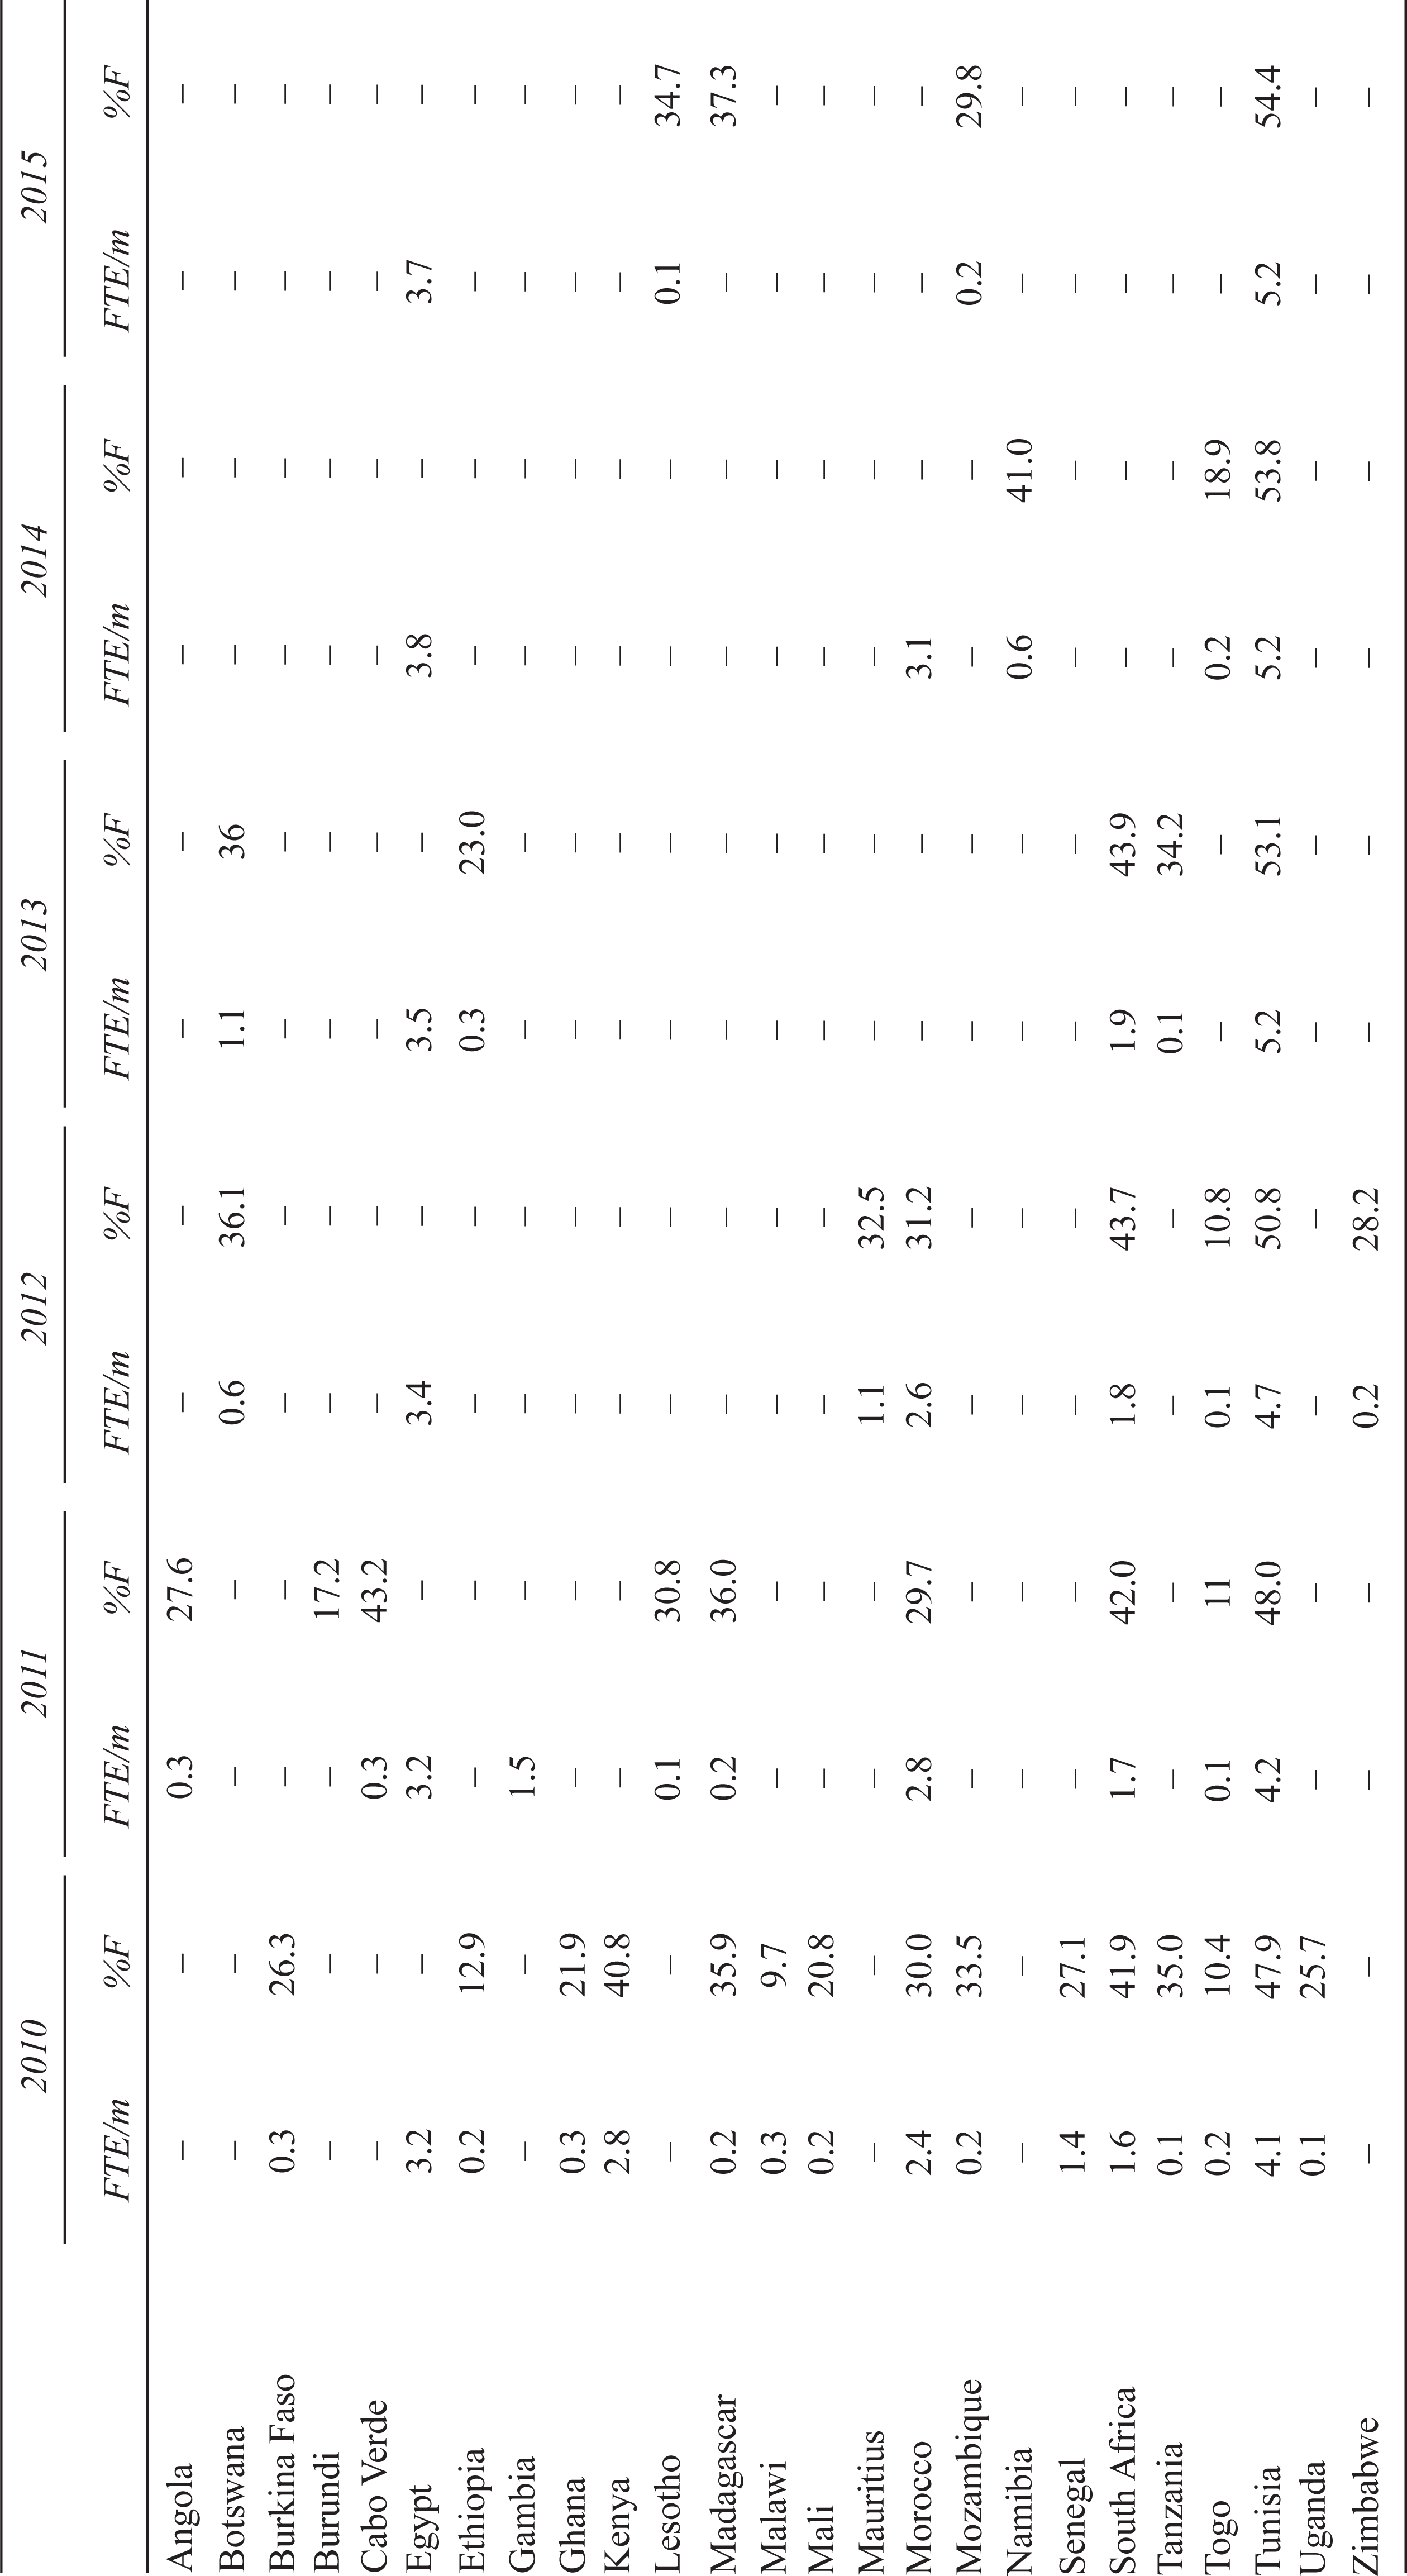
The UIS STI gathers data on R&D personnel (Table 1). Four aspects are apparent in this data set: First, only twenty-five countries are represented; second, the erratic availability of data; third, the very low availability of personnel; finally, gender bias against women, with the most equitable distribution found in Tunisia. It must be added that the much higher availability of R&D personnel recorded for Tunisia is a survey artefact in which Tunisia has led the way in including research master’s students as a component of R&D personnel, whereas other countries restricted the count of postgraduate researchers to doctoral and postdoctoral students only. The Frascati Manual guidelines have since been revised to include research master’s students in the researcher headcount.
R&D, Personnel Per Million and Gender
PRIs are important components of all innovation systems. In Africa, these include organisations such as the Theodor Bilharz Research Institute of Egypt, the Pasteur Institutes in Algeria, Morocco and Tunisia, newcomers such as the Manhiça Health Research Centre of Mozambique, the Cancer Research Institute in Morocco, Council for Scientific and Industrial Research (CSIR) of South Africa and the Botswana Institute for Research, Technology and Innovation. Other PRIs are active in space science and technology, nanotechnology, nuclear research, astronomy, non-communicable diseases, renewable energy and biotechnology. South Africa and Egypt display the widest number and range of PRIs, with Algeria, Tunisia, Kenya, Ghana and Morocco steadily adding to their complement. PRIs and higher education institutions, together with the communication backbone, constitute the public sector research infrastructure that includes large items of specialised equipment. Business sector R&D is discussed below. What then emerges from this investment in people, technology and organisations?
Scientific Production
A search of Clarivate Analytics Essential Science Indicators for the period 2010–2019 shows that Africa produced 659,910 publications. Africa’s world share rose from 1.7% in 2010 to 3% in 2018. The top ten science categories reveal dominance of Engineering-Electrical and Engineering, well above the next category, Public Environmental and Occupational Health. However, when combined with the categories ‘infectious diseases’, ‘pharmacology pharmacy’ and ‘tropical medicine’, the strong attention to the health sciences is evident. However, viewed by region, North Africa focuses on science, engineering and technology and SSA focuses on the health sciences. The earlier comments regarding donor sources of funds and their influence on the field of R&D has reference.
Rather than listing the outputs of all fifty-five countries, it better serves the purpose of this contribution to consider the most scientifically active countries, defined as those whose outputs over the period have received 100,000 citations or more. Table 2 presents this selection along with average citations per paper (C/P), the number of highly cited papers and the category normalised citation rate (CNCI). The CNCI is the ratio of the count of citing items to the expected citation rate for documents of same type, publication year and scientific category. Where publications are assigned to more than one category, the average of the individual category ratios is taken (Clarivate Analytics, 2019). A CNCI of unity represents the world average value.
Scientifically Prolific Countries, 2012–2018
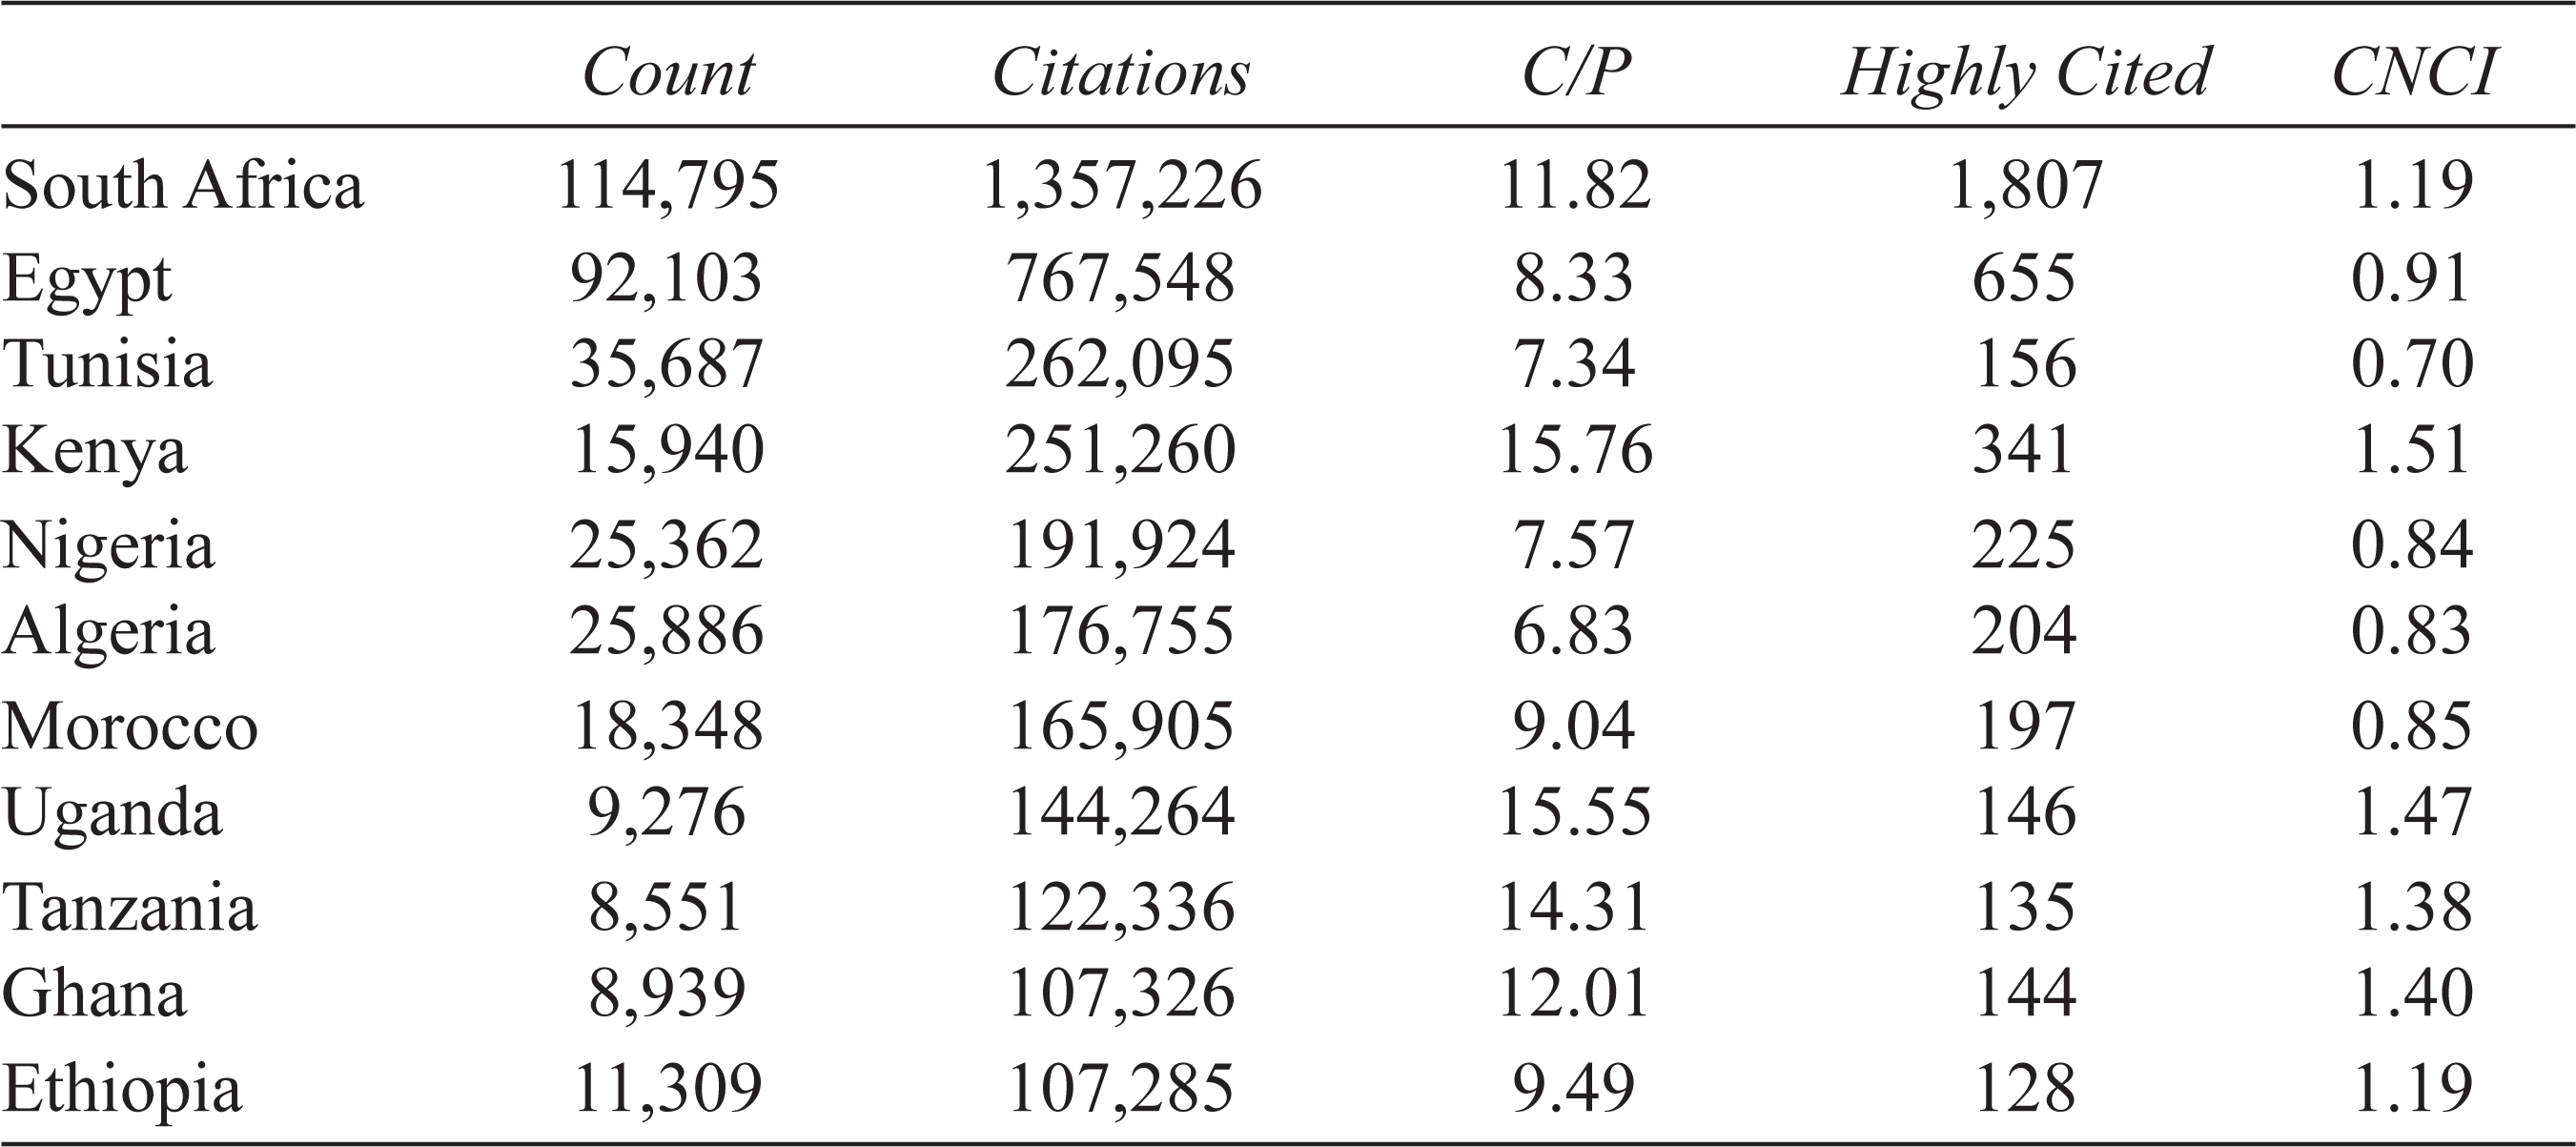
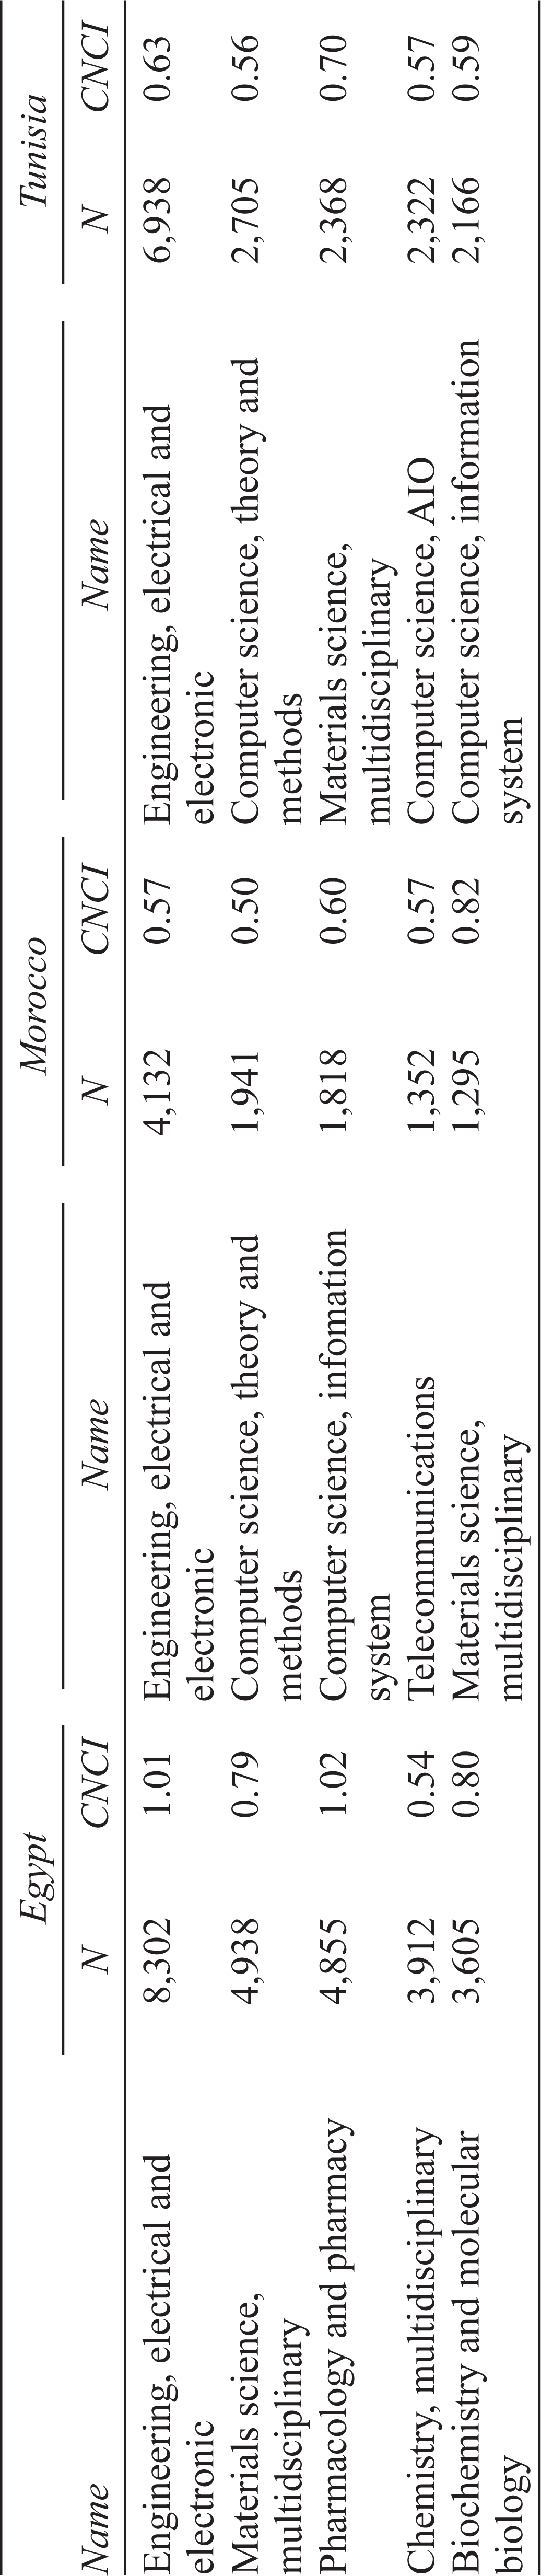
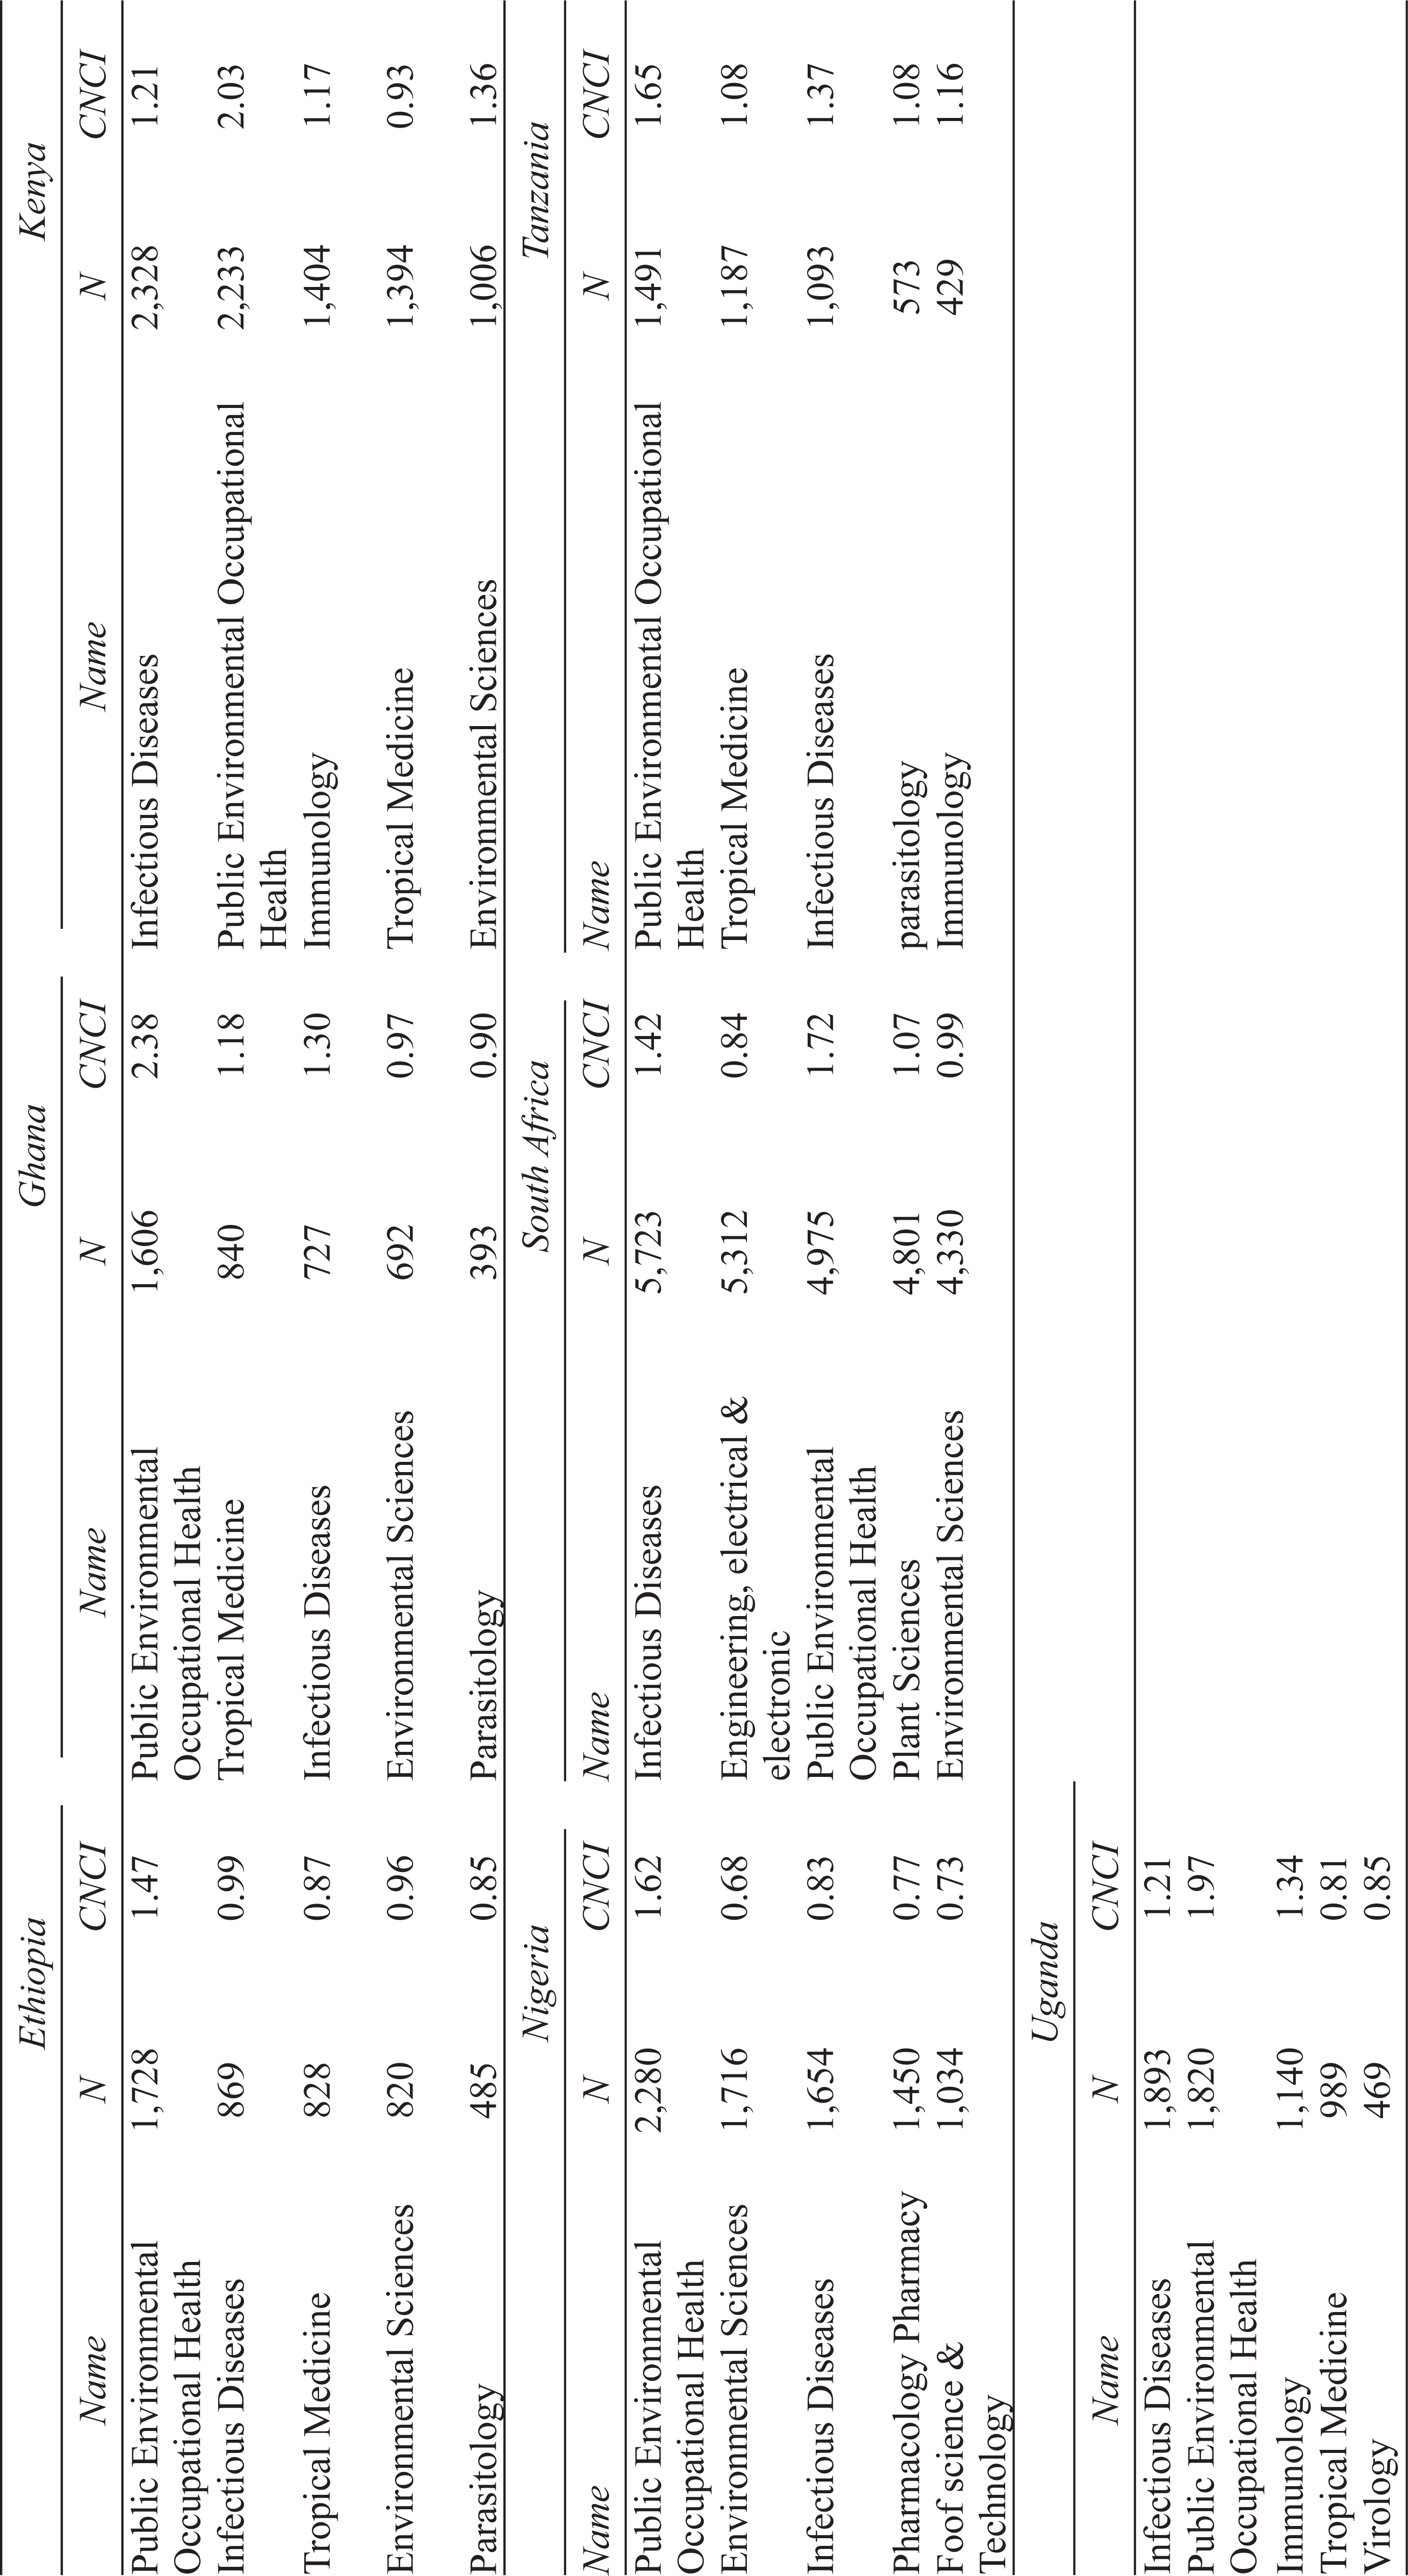
It is noted that by total count, South Africa is the most prolific, followed by Egypt, then Tunisia, Algeria and Nigeria. Next is Morocco, followed by Kenya. This points to the dominance of North Africa by total count, followed by South Africa, with Nigeria in West Africa and Kenya to the East. The total citation counts proceed in the order South Africa, Egypt and Tunisia, but Kenya now occupies 4th rank, followed by Nigeria, Algeria and then Morocco. Kenya also disrupts the ranking of highly cited papers, being third after Egypt. CNCI follows the same pattern as the C/P. This suggests that the countries producing smaller counts might have special characteristics that elevate their CNCI. Such characteristics are examined at country level for North Africa and SSA (Tables 3 and 4) for subject categories by order of publication count, as a proxy for research focus. Alongside each category is the respective value of the CNCI. Cursory examination of the country profiles shows that the former has a focus corresponding with Glanzel’s (2001) ‘socialist’ model of scientific activity, whereas the countries of SSA follow the ‘Western’ or ‘biomedical research model’. North African scientists appear to wish to follow the path of technical modernisation, while SSA scientists are locked into dealing with its excessive burden of infectious diseases. North Africa concentrates on hard technologies and ICT; SSA has a strong focus on human and animal health. Of the eighty scientific categories listed for North Africa, CNCI > 1.10 occurs in but 5 instances. By contrast, in the case of SSA, of the 140 categories presented, CNCI > 1.10 occurs in 65 instances, indicating much higher scientific impact on the world stage. As an example, in public, environmental and occupational health, Ghana demonstrates high output and a high CNCI of 2.38. In the natural sciences, South Africa leads with a CNCI of 1.96 for astronomy and astrophysics. Space limitations mitigate against tabulating full data sets for the countries of interest; but there is one other category that must be mentioned, namely ‘medicine, general and internal’ that records CNCI of 18.35 (Ghana), 16.72 (Ethiopia), 10.68 (Kenya), 10.62 (Tanzania), 7.61 (Uganda), 4.48 (Nigeria) and 2.38 (South Africa). These values add further strength to the categorisation of the sub-Saharan countries as dominated by a biomedical research model. This thrust is a combination of domestic and foreign interests in dealing with communicable and neglected tropical diseases, especially in clinical trials. Research into the aetiology of the diseases is highly specific so that publications, especially those appearing in high impact journals, will achieve high citation rates. So, Ghana, Kenya, Tanzania and Uganda, that have small science systems, record high average CNCI values.
North Africa: Publication Count Top Twenty Categories, with CNCI, 2012–2018
Sub-Saharan Africa: Categories by Count with CNCI, 2012–2018
Analysis of co-authorship will also be addressed for the two regions. Over 2012–2018, SSA produced 170,234 articles, with the main foreign collaborating countries being the United States, England and Europe, with China emerging as an important partner. The ranking by country is category dependent, usually running the United States, and England with subsequent partners varying by field. For health sciences, the sequence is the United States, England, Switzerland, Canada and the Netherlands, reflecting language, expertise, donor interests and historic ties. For North Africa, the 2012–2018 count is 152,934, with France ranking as the first, followed by Saudi Arabia, then the United States, Germany, Spain, England and Spain, a sequence influenced by language, history and expertise. China also has a strong and increasing presence.
International co-authorship and co-publication, proxy measures for ‘collaboration’, have been on the rise over the past two decades, spurred on by the ease of human and electronic communication, as well as participation in international ‘Big Science’ projects in Infectious Diseases, Astronomy and Nuclear Physics. Examples are the Global Burden of Disease study, the ATLAS project at CERN, Geneva, the Planck Satellite, and on African soil the Square Kilometre Array (Kahn, 2018). Prowess in such fields is recognised in the election as fellows of the ‘Royal Society’—Professor Salim Abdool Karim and Dr Bernard Fanaroff, both from South Africa and experts in epidemiology and astrophysics, respectively. Data on the rate of international co-authorship requires analysis beyond the scope of this contribution, save to note that World Bank–Elsevier (2014) reported co-authorship in the range 40%–55%.
Innovation Activities
The revised Oslo Manual (OECD, 2018) provides expanded definitions of the terms ‘innovation activities’ and ‘innovation’, that understand innovation activities to comprise all developmental, financial, management and commercial activities intended to result in innovation for firms, including engineering, design and creative work, marketing and branding, R&D, intellectual property activities, training, software and database development, and the acquisition of capital items. Innovation results when a new or improved product or process is made available to potential users or brought into use by the innovating party. As it happens, very few African countries have produced a time series of Oslo-style innovation surveys, the exceptions being Egypt, Lesotho, Uganda and South Africa (AU, 2019). Accordingly, other sources of information on innovation performance are turned to.
A commonly used resource for such information is the series of World Economic Forum Global Competitiveness Reports. Rankings of three of the main indices tabulated in the reports—the Global Competitiveness Index (GCI), Technological Readiness and Innovation—are presented in Table 5. The GCI is constructed from data provided by national statistical agencies as well as through the World Economic Forum Executive Opinion Survey, and it allows tracking over time, and among countries. Another resource, the Global Innovation Index (GII), that has a sharper focus on the variables that drive innovation is also included in Table 5.
GCI, Technological Readiness, Innovation and GII, 2017
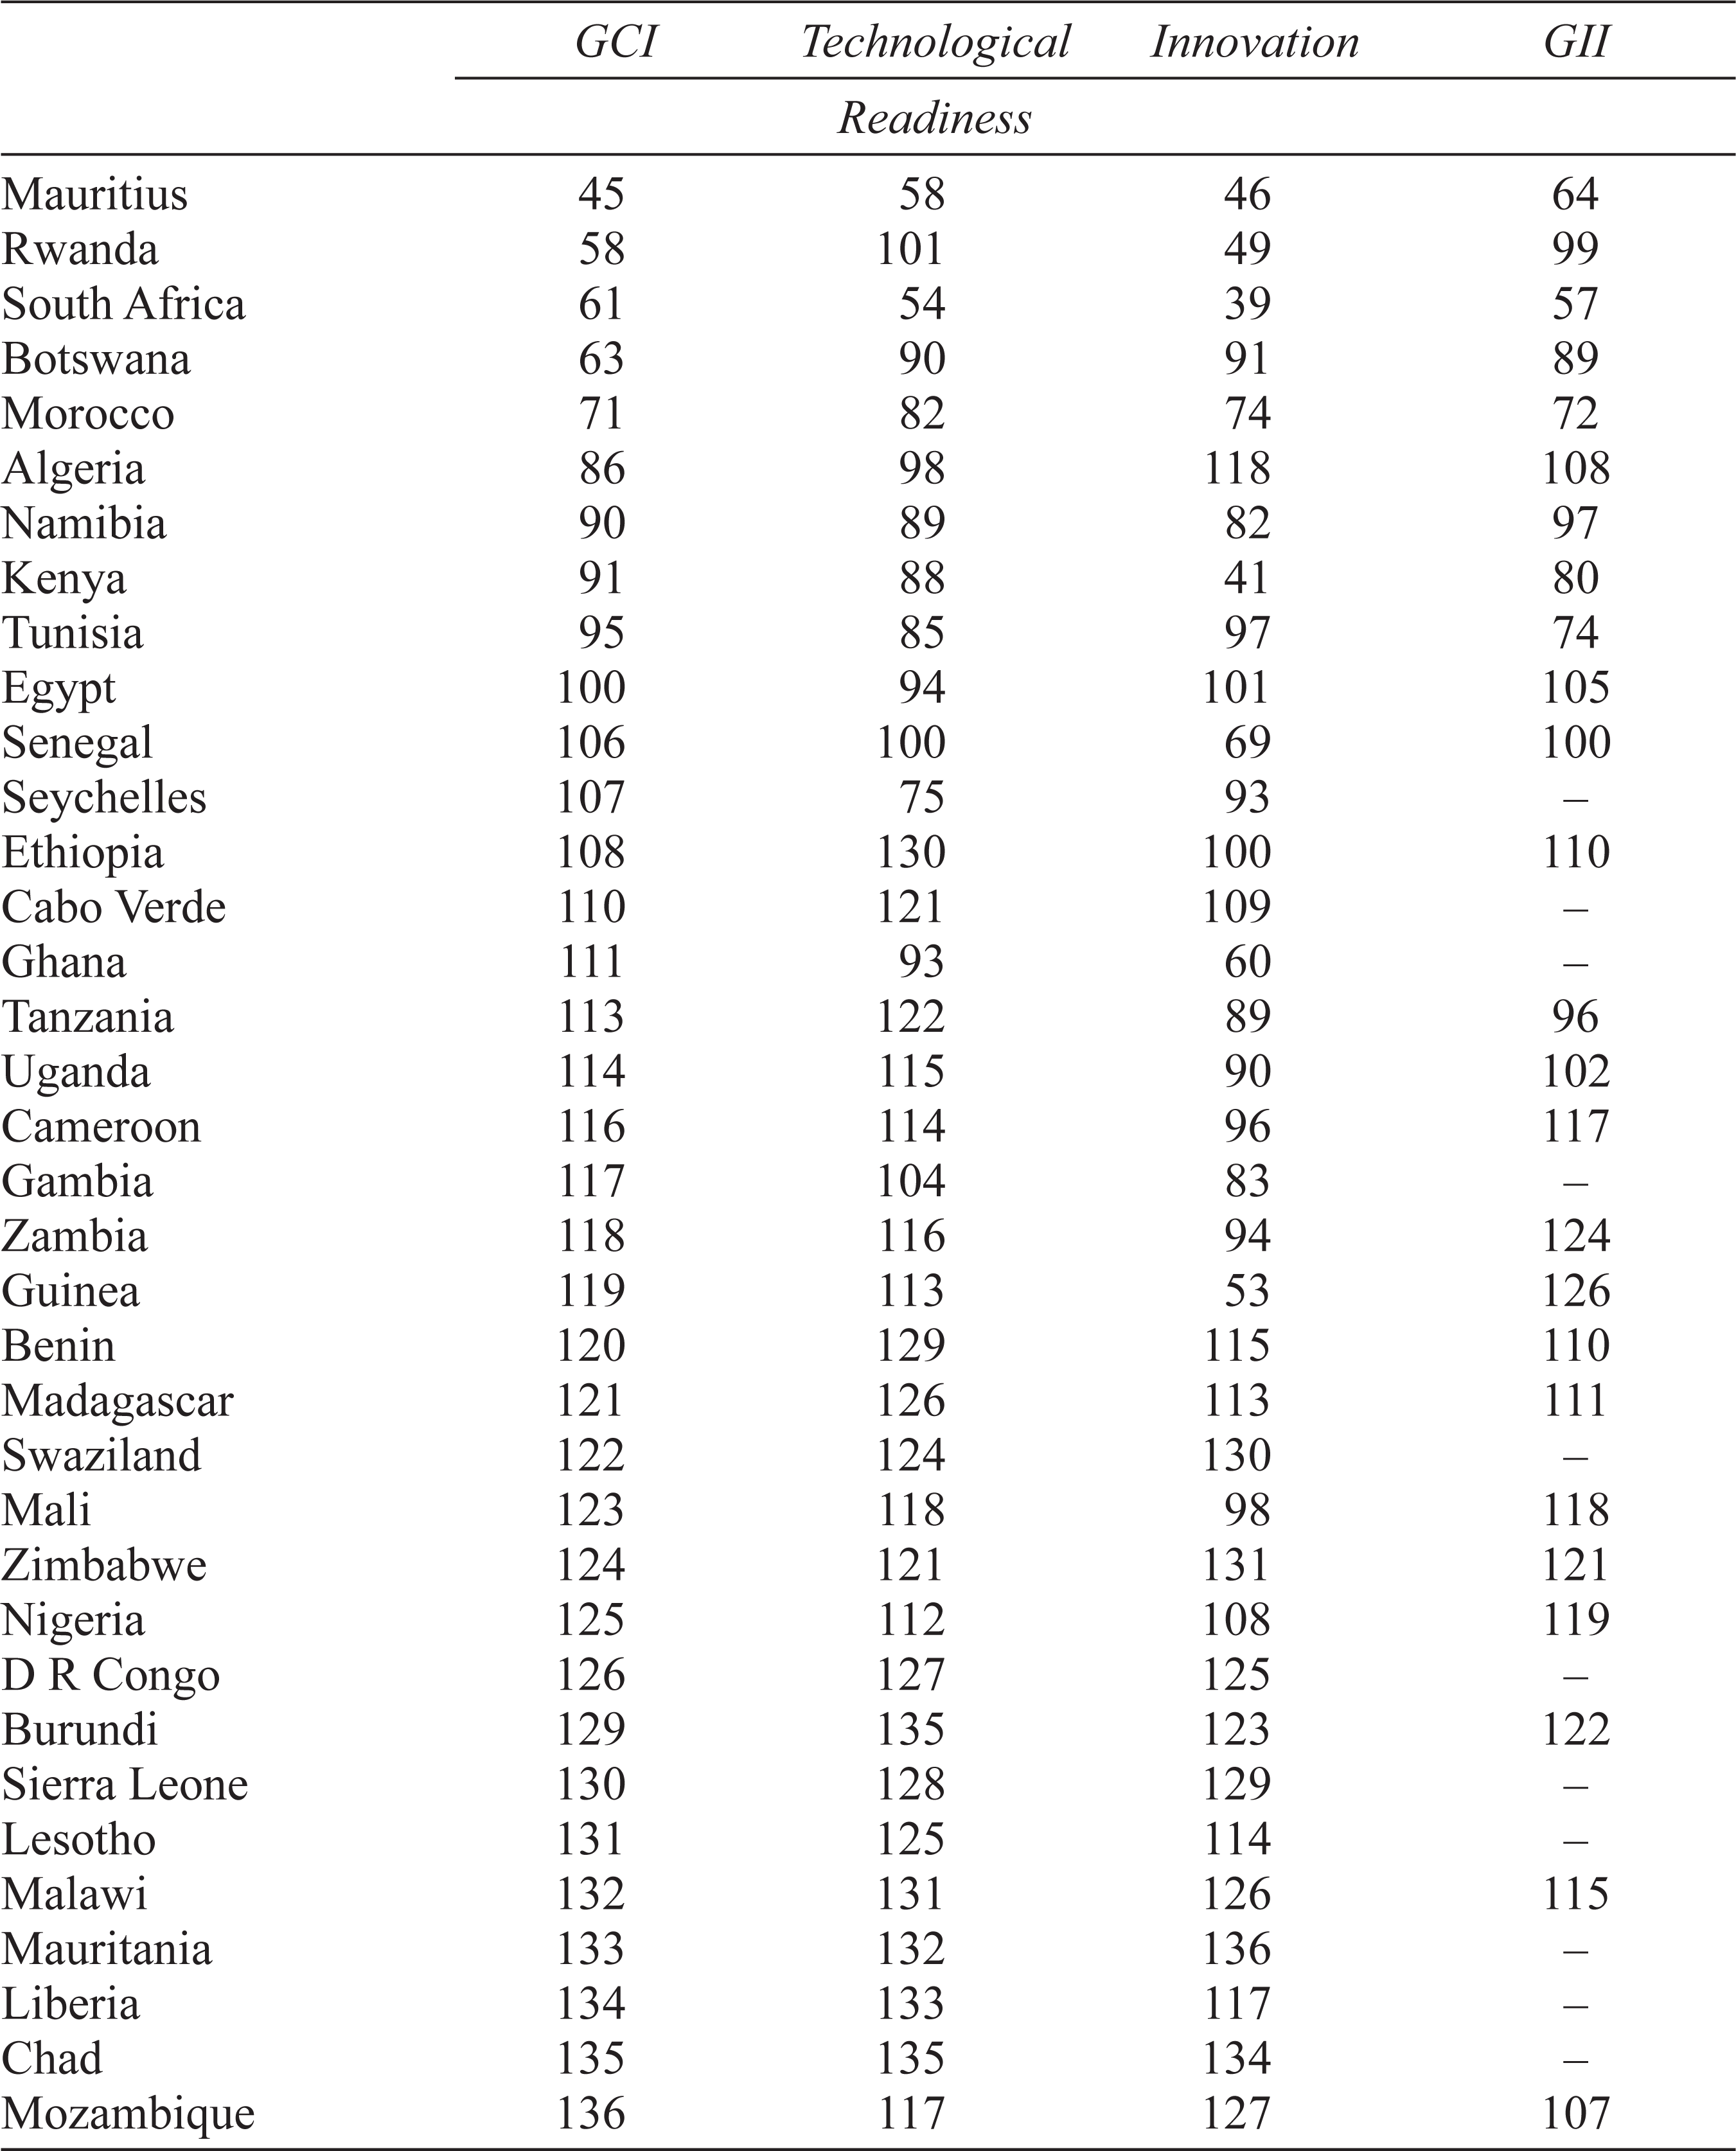
The median GCI rank for the African participating countries is 117, some 40 positions below the world median. Mauritius is in top rank, followed by Rwanda, then South Africa. The GCI for Mauritius rose by ten places since 2011; Rwanda climbed twenty-two; South Africa fell by seven places. For ‘Technological Readiness’, the median rank for Africa is 116; for ‘Innovation’ it is 99. These are all very low. But there are positives: First, catch up by Kenya, Mauritius and Zambia in relation to South Africa and strong rankings for Algeria, Egypt, Morocco and Tunisia.
The GII analyses innovation inputs and outputs. South Africa remains in top rank, followed by Mauritius and then Morocco, Tunisia and Kenya. It is encouraging that of the seventeen countries classed as ‘innovation achievers’, eight are in SSA, namely Kenya, Rwanda, Senegal, Uganda, Mozambique and Malawi, with the recent addition of Tanzania and Burundi. These countries have shown a steep rise in their scores for ‘Institutions and Market Sophistication’.
Innovation is a response to a demand, or anticipation of a new market. Meeting the needs of Kenya’s ‘unbanked’ gave rise to M-PESA, which now has twenty-four million customers and has spread to another nine countries. Another example of a market innovator is Shoprite of South Africa that operates in fourteen countries, sometimes displacing incumbents, creating employment and creating supplier opportunities. Dangote Group of Nigeria is on the move, with cement production in eight countries, and oil, plastics and food processing activities on home ground, while Orascom of Egypt operates in twenty countries. At smaller scale are companies such as Trade Kings of Zambia, Tswana Pride of Botswana and Reliant Group of Mozambique that have found ways to enter value chains and compete. All purchase process and product technologies are needed; they prosper via the strategy ‘invented elsewhere, adapted here’.
Over 2005–2015, Africa’s patent applications grew from 10,900 to 14,800 with an average growth rate of 3.1% compared to the world growth rate of 5.4% (WIPO, 2016). As China surged forward, Africa’s world share of patent registrations fell from 0.6% to 0.5%. South Africa has the largest number of patent applications, with non-resident applications far exceeding those of residents. When normalised per million population, Morocco is the African leader (Table 6).
PCT Applications and Grants, Trademarks and Registered Designs, 2015
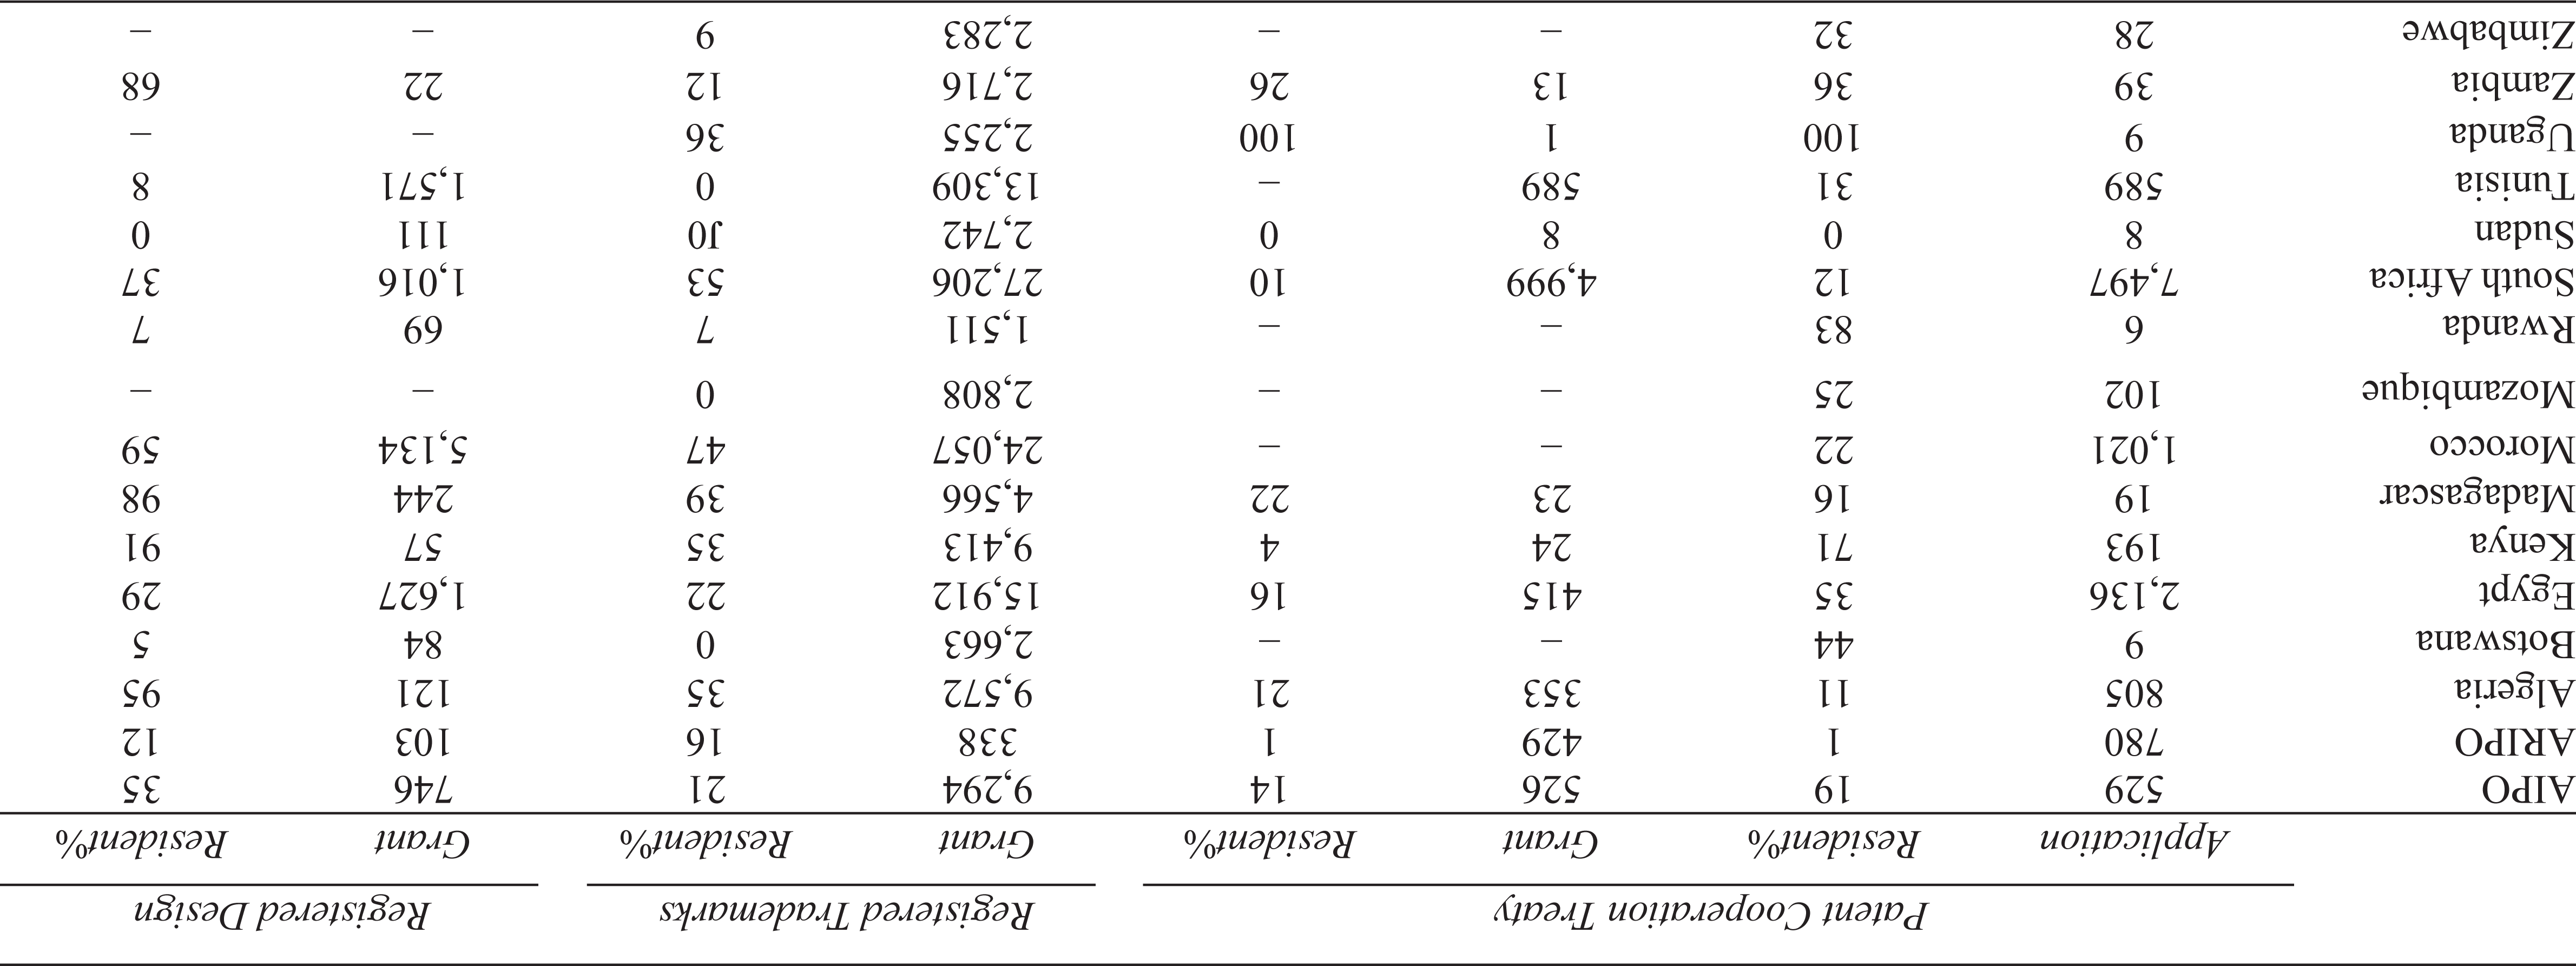
Notable too is the number of trademarks in force, at a level higher than Hong Kong and Portugal, and ahead of all Latin American countries. In the case of Registered Designs, South Africa leads in absolute number, though normalised to population size, Tunisia moves to top rank. Both trademarking and the registration of designs and copyright are given poor attention in the literature on the economics of innovation.
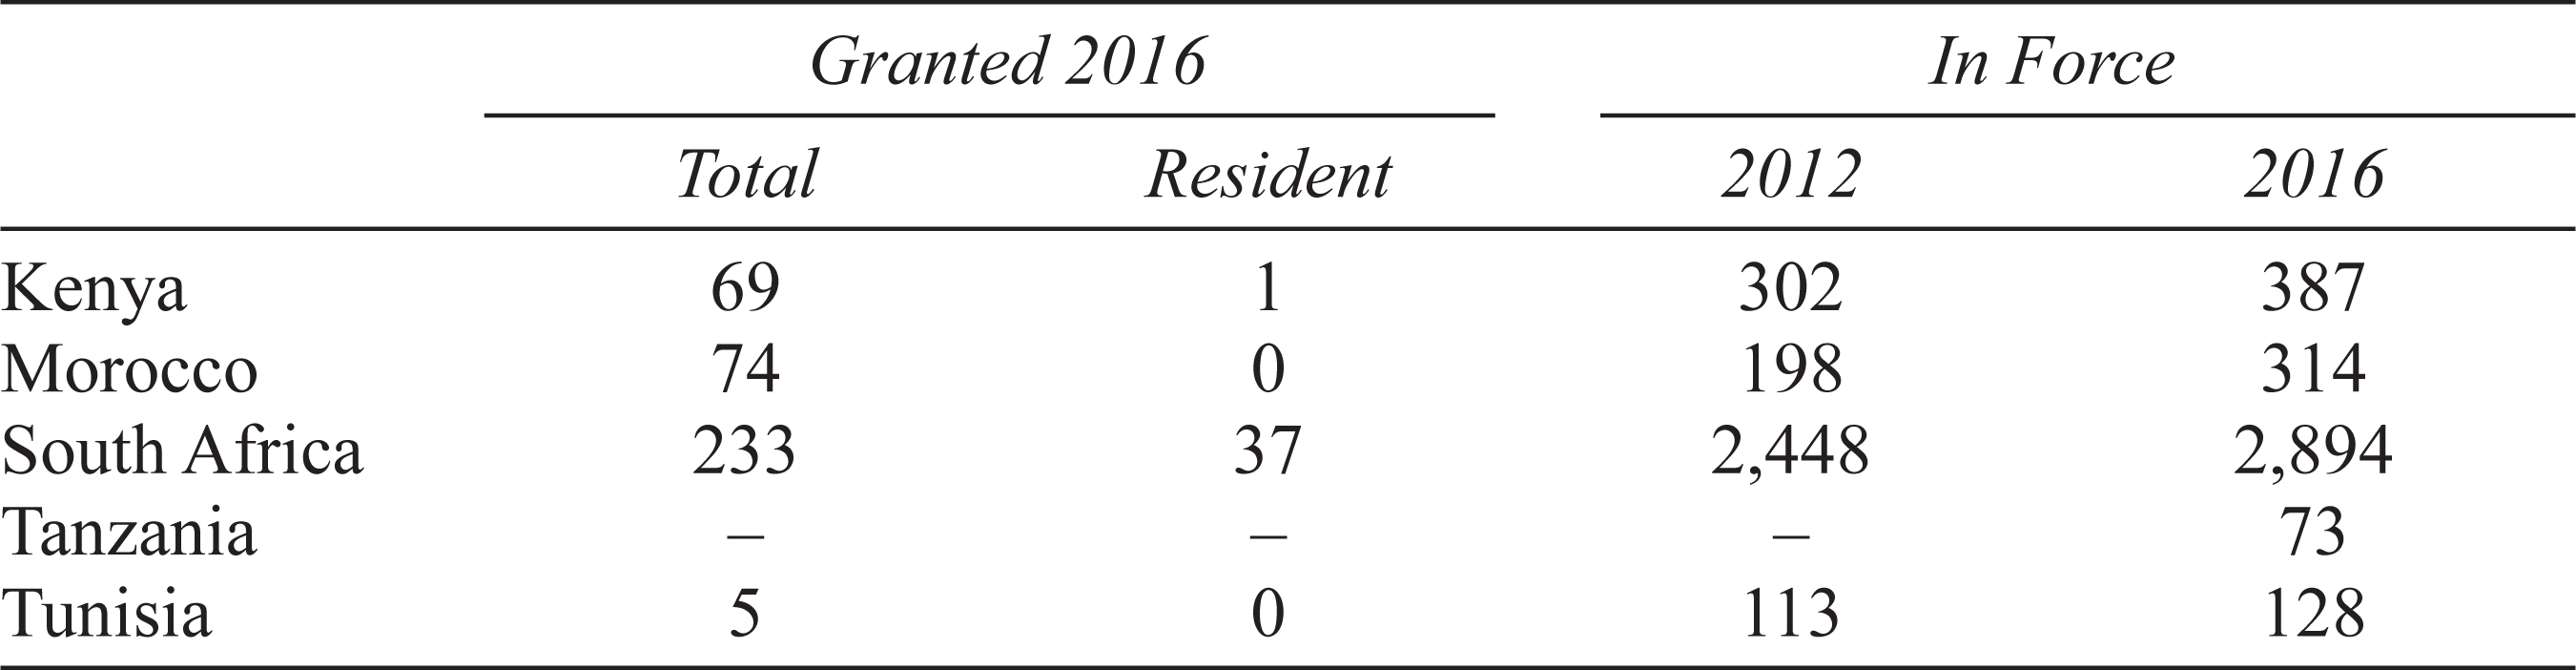
The value of plant breeders’ rights and new plant cultivars is poorly recognised in the literature on the economics of innovation. South Africa dominates the registration of plant cultivars, with Kenya moving up strongly (Table 7).
Plant Cultivar Registrations
The political economy regarding intellectual property rights (IPR) has particular reference in the ‘with COVID-19’ era, abbreviated as WC. Protection of IPR, with potential monetisation thereof, is enshrined in the charter of the World Trade Organization and the 1995 Trade-Related Aspects of Intellectual Property Rights (TRIPS) agreement that is binding on signatories. TRIPS covers patents, trademarks, copyright, geographical indications, registered designs, trade secrets and plant cultivars, along with standards, enforcement and dispute resolution. Article 40 provides for signatories to dispute practices that are deemed to be anti-competitive or abusive. Even so, the twenty-year patent protection granted to patent owners prevents developing countries from the production and marketing of low-cost generic copies. This is now a matter at the forefront of diplomatic efforts to ensure the fair and timeous disseminate and further development of COV–2 vaccines according to the premise that health for all depends on vaccination of all.
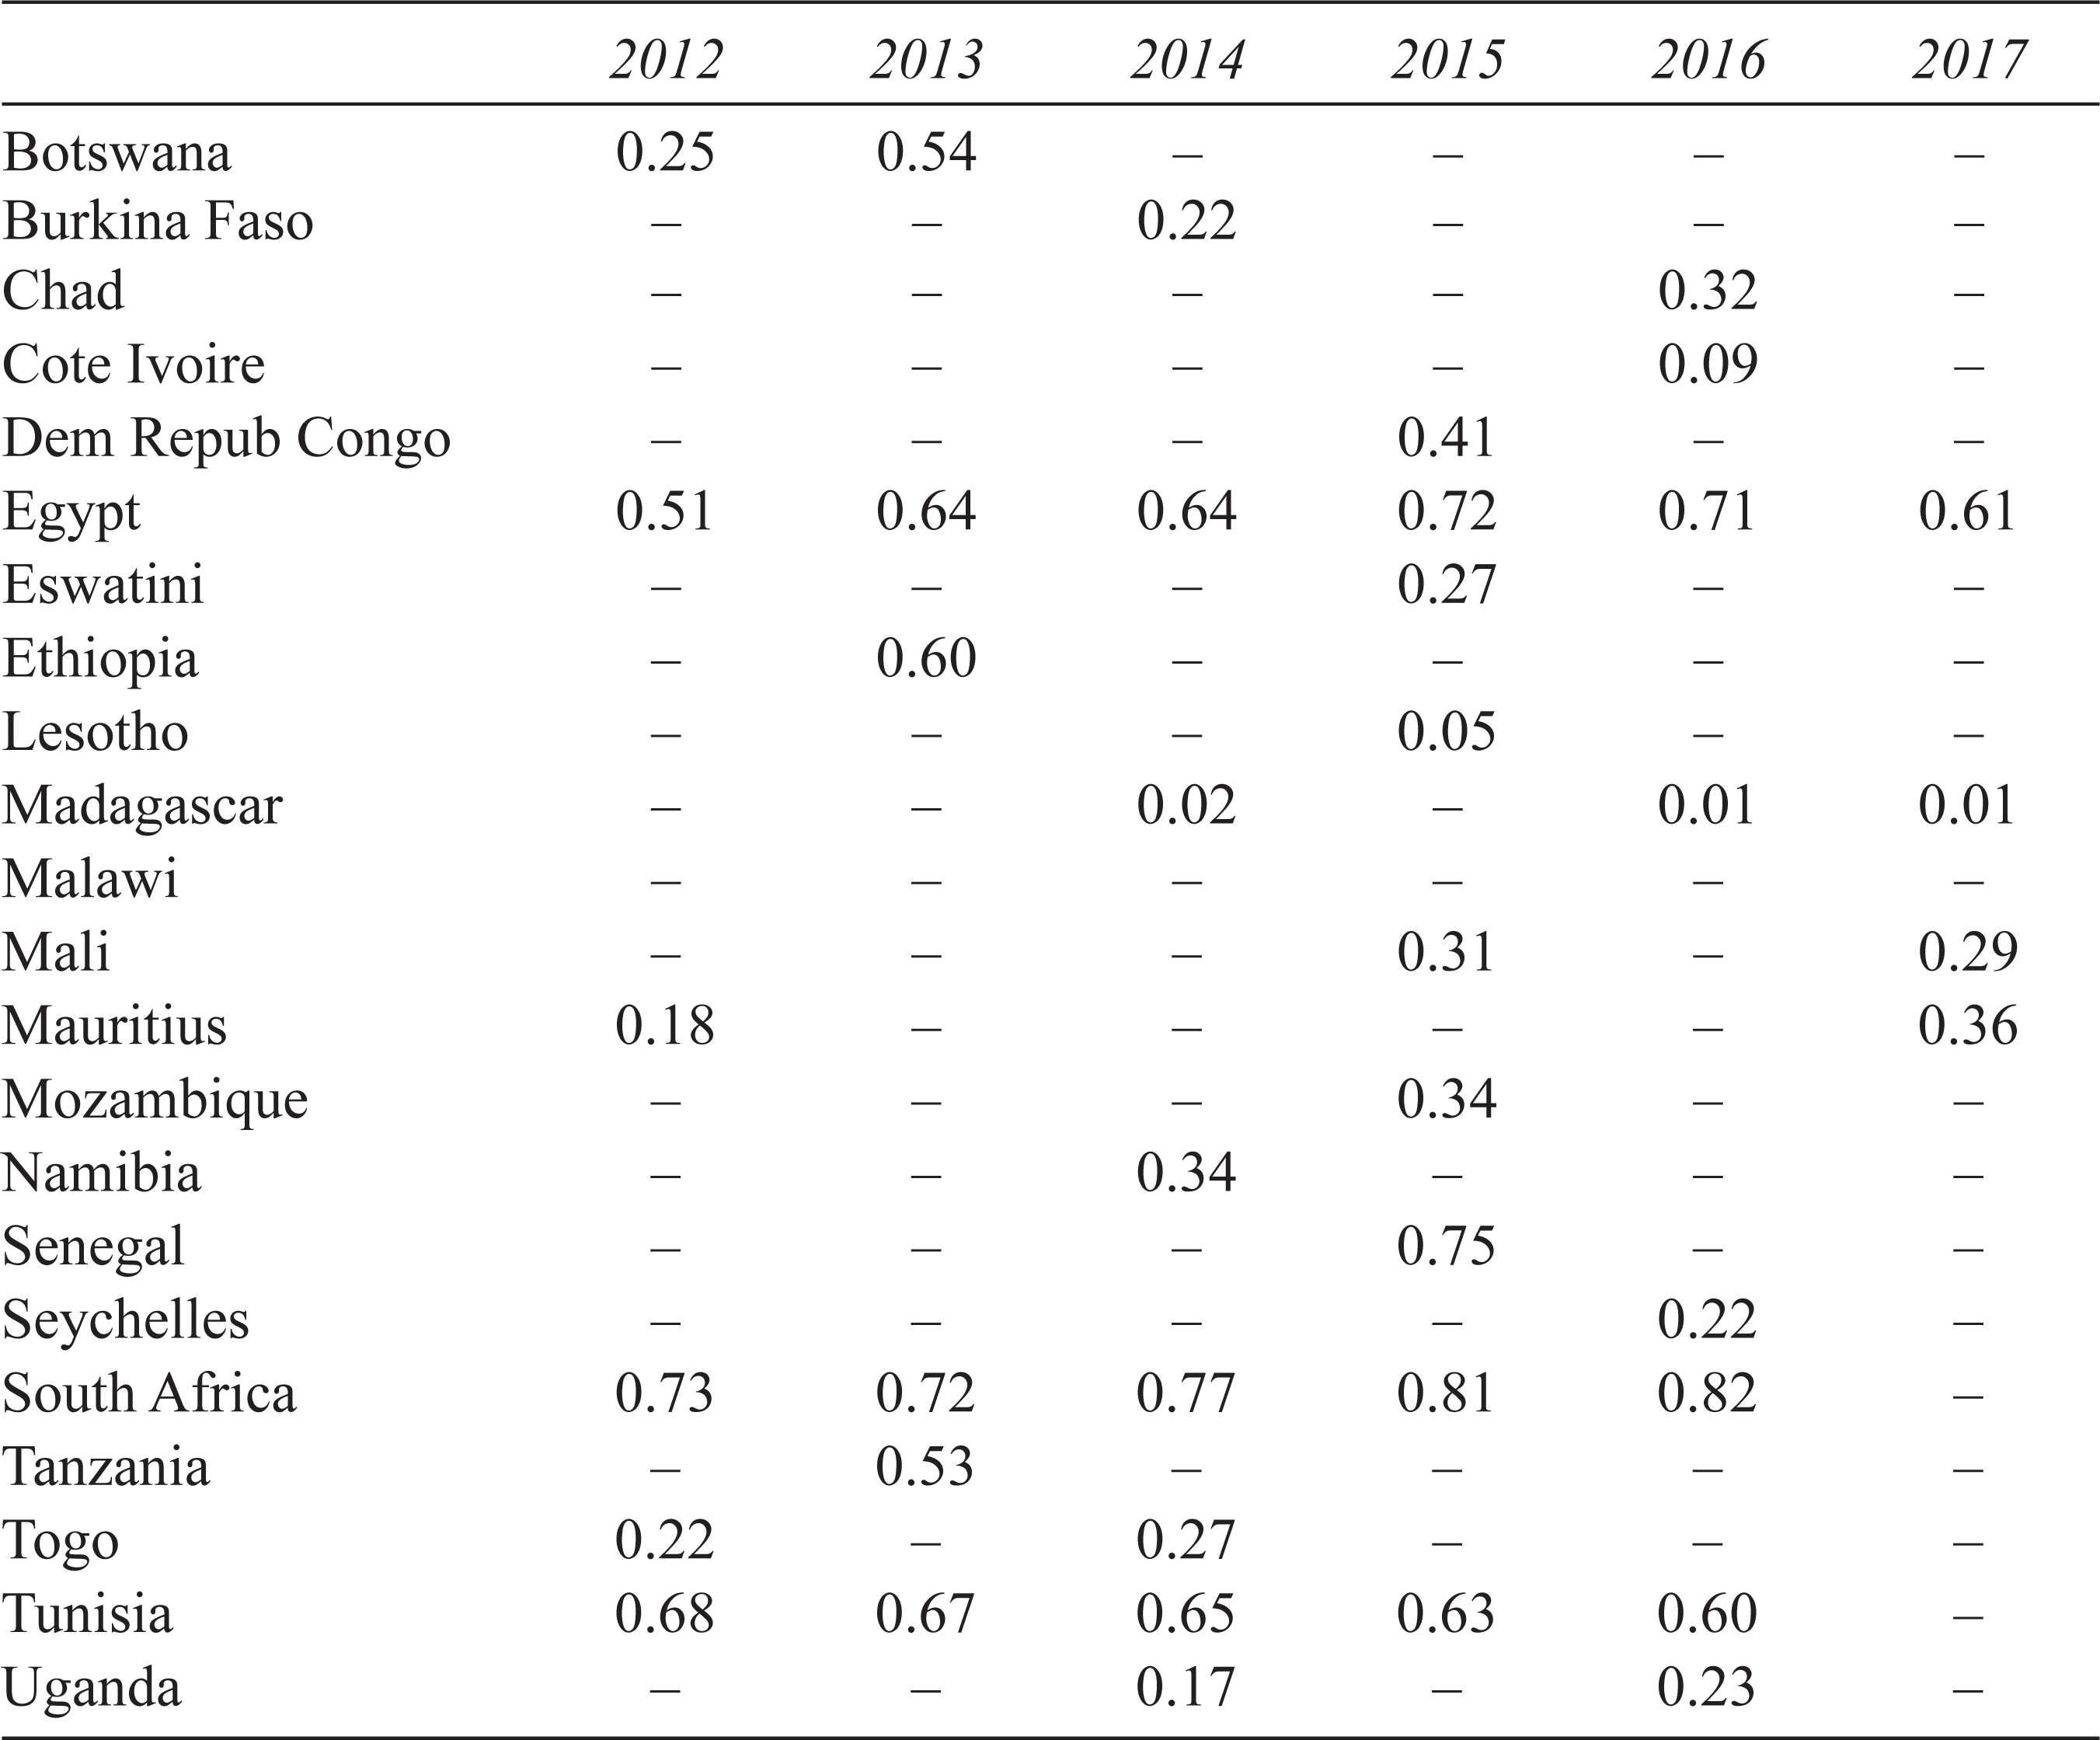
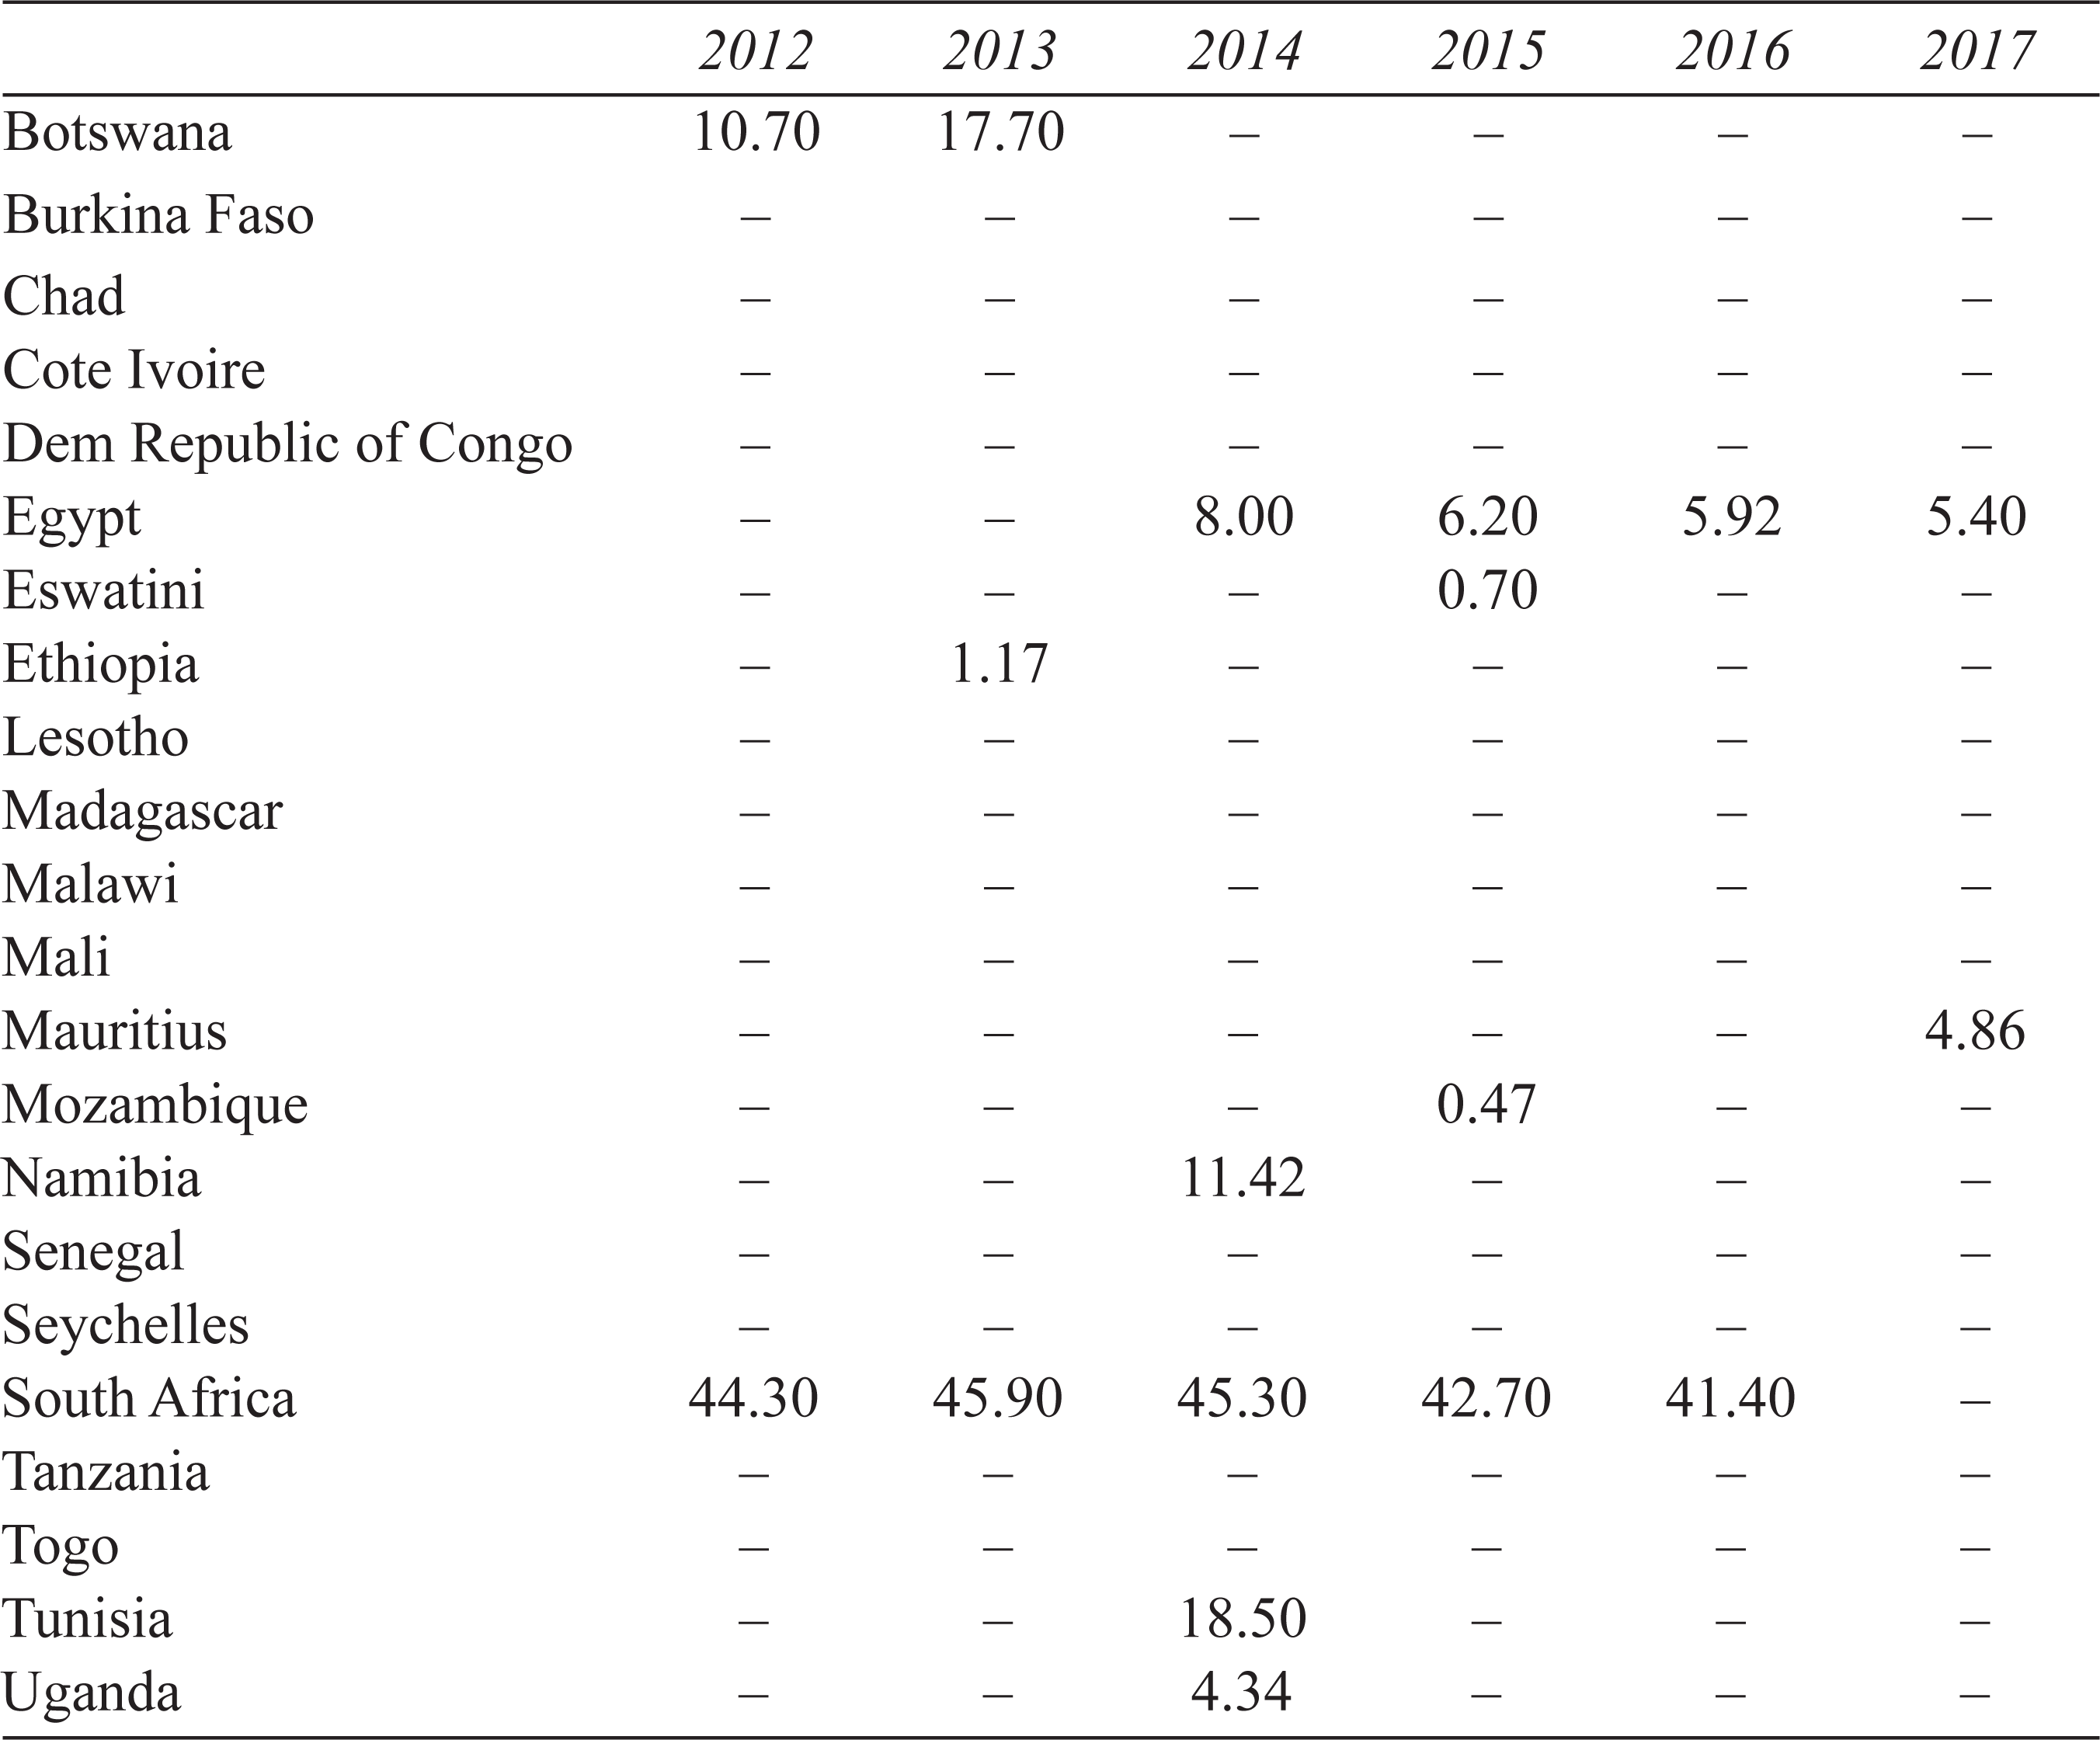
Another innovation activity is R&D, that may be conducted in universities, public research organisations and the business sector. The standard measure of R&D intensity is the GERD: GDP (Table 8) that presents GERD: GDP for the twenty-two countries for which the UNESCO Institute of Statistics has obtained data. The data shows three striking features. First, with one exception, the 1980 target that countries should attain the GERD: GDP level of 1% has not been achieved; second is the patchiness of the data; third is that only Egypt, South Africa and Tunisia have been able to maintain regular measurement of GERD. Table 9 lists business expenditure on R&D (BERD) as the percentage GERD of countries for which UIS has recorded values that meet its norms. The numerous empty fields show that only ten countries have been able to tabulate a value for BERD. Of these, only South Africa and Egypt declare a data series. Other than South Africa, the size of BERD is miniscule in comparison to GERD, that must therefore only represent public sector R&D.
GERD: GDP, 2012–2017
BERD as % GERD, 2012–2017
There are a number of plausible reasons for these disparities. One might be that the business sector performs no R&D. This could be the case in some countries where industry is weakly diversified and is confined to producing standard goods, for example, cement, milling or entry level textiles. Another could be that manufacturing industry is in the hands of the state or state organs such as the military, in which case BERD would be negligible. In the view of the author, BERD occurs in many more countries than declared in Table 9. There is a problem of definition and response, generally in the service sector and ICT in particular. This claim rests on the observation that service sector companies necessarily rely on database systems and company-specific software, especially for mobile platforms. Who authors this software? How much is unique? How much counts as R&D according to the Frascati Manual definitions of §2.4.1?
Working Together
Translating innovation activities into goods and services in markets is another matter, that in part depends on the regulatory frameworks. The World Bank (2019) conducts its ‘Doing Business’ surveys by seeking the opinions of captains of industry and legal practitioners from the now 190 participating countries. The ‘Doing Business’ score is derived from items such as the time required to start or close a business, availability of electricity, tax requirements, the permit regime and so on. New Zealand (1), Singapore (2) and Denmark (3) lead the scoreboard. Africa’s top seven countries are Mauritius (20), Rwanda (29), Morocco (60), Kenya (61), Tunisia (80), South Africa (86), and Zambia (87), suggesting that much may be done to enable business activity. It stands to reason that if ‘Doing Business’ is made more difficult by regulatory overload, firms will operate in ways that reduce risk and be disinclined to venture into the uncertain terrain over innovation or R&D. The ‘Doing Business’ approach is not without its critics. So, McCormack (2018) suggests that its reductionist premises are flawed, lacking cultural specifics and context; Lee et al. (2009) aver that the ‘Doing Business’ approach seeks to improve alignment with the ‘Washington Consensus’ deregulation approach; disputes within the World Bank concerning the reliability of the survey saw the resignation of chief economist and future Nobel Laureate, Paul Romer. As with other rankings, cautious interpretation, informed by metadata, is required.
One mechanism intended to reduce the cost of doing business is that of Special Economic Zones, that are proliferating across the continent, often seeking to emulate Shenzhen in China. In contrast, there are many versions of science and technology parks and innovation hubs; some are high technology PROs; others are real estate ventures. A number are in the development stage: at Maluana (Mozambique), Abuja Technology Village Free Zone (Nigeria), Konza Technopolis (Kenya) and Silicon Waha (Egypt). Alongside are smaller media lab environments. Examples are the Namibia Business Innovation Institute, Cairo’s Hackerspace and the Cogite Coworking Space in Tunis. It is too early to tell what might emerge from these efforts.
Technology transfer is a recurring theme in innovation and research policy. Attempts to bring academia and industry closer together include the location of innovation hubs or science park adjacent to universities and the establishment of technology transfer offices. NGOs promoting technology transfer are the Southern African Research and Innovation Management Association (SARIMA), with her East and West African sisters, EARIMA and WARIMA.
New Partnership for Africa’s Development (NEPAD) has introduced Japanese ‘kaizen’ methods, driven Grand Challenges Africa through the Alliance for Accelerating Excellence in Sciences in Africa, and developed common health status indicators.2,3, At regional level, a draft Southern African Development Community (SADC) framework on STI surveys and indicators has been prepared, and work has progressed on the African Medicines Regulatory Harmonization.
There are many other collaborations across the continent that support research and innovation. These include the African Academy of Sciences (AAS), the Association of African Universities, Forum for Agricultural Research in Africa, African Medical and Research Foundation, African Educational Research Network and the African Research Universities Alliance. Other contributors are the International Council for Science (ICSU) Regional Office for Africa, the Coalition for African Research and Innovation, the UK-SA Newton Fund and Global Challenges Research Fund and the EU Horizon 2020 programme including the European and Developing Countries Clinical Trials Partnership. To these may be added the French South African Institute of Technology, the Finland-funded Southern African Innovation Support Programme, the Japan S&T Research Partnership, International Astronomical Union Office of Astronomy for Development and the Square Kilometre Array project. German GIZ is a strong supporter of the Pan African University. AGNES is a new research network between Germany and Africa, while the Korea International Cooperation Agency has regional offices across Africa. Fame Lab, Slush, World Café and Innovation Summit events are blooming. Networking plays its part in diplomacy, especially as the open science agenda gains pace.
Numerous award and incentive schemes are in place including the Third World Academy of Science-Abdool Karim award, the Olusegun Obasanjo Prize for Scientific Discovery and Technological Innovation of the AAS and the American Geophysical Union Africa Award for research excellence in space science. The L’Oréal-UNESCO Women in Science Awards recognises excellence among women scientists: Europe, Africa and the Arab States, the Asia/Pacific, North America and Latin America. The Innovation Prize for Africa makes a shared award of USD150,000 for outstanding achievements and ‘We Are Africa’ rewards innovations in the Southern African creative industries, travel and conservation, while in the ICT space is the AppsAfrica.com award.
Synthesis
What is then the state of research and innovation policy? A number of countries’ studies are to hand, through the work of the Science Granting Councils Initiative (SGCI), UNESCO GO-SPIN, the earlier Assessment of National Innovation Systems (ANIS) studies of Botswana, Namibia and Zambia, and the Islamic Atlas of World Science and Innovation (IAWSI, 2014). In general, analyses of country science or innovation policy naturally apply to specific years. To such studies may be added multi-country annual surveys of the World Bank, WEF, GII, UNCTAD and UNESCO.
Of the first group of studies, the summary report of the SGCI is of particular relevance in cataloguing the status of STI policy across seventeen SSA countries (CREST, 2014), with the corresponding political economy study of fourteen SSA countries (Science Policy Research Unit [SPRU], 2017). To these may be added the GO-SPIN studies: Botswana (2013), Malawi (2014), Zimbabwe (2014) and Rwanda (2015) and Mozambique (2021). For the North African Arab States, one may access information on science policy for Morocco (ESCWA, 2016a), Tunisia (ANIS, 2013; ESCWA, 2016b), Egypt (ASRT, 2015), Sudan (ESCWA, 2016c) and for the Arab World in general (ESCWA, 2017).
Regarding science policy per se, the definitive study is that of CREST (2014) that finds that the installation of a centralised government department responsible for STI policy and governance for SSA countries in general only took place in the second generation after independence. Science policy has therefore had a little time to evolve and adapt. Even so, twenty-seven countries now have a policy or strategy intended to drive STI for national goals. STI policy implementation is held back by a chronic lack of resources, suggesting a lack of commitment on the part of governments; policy achievement is rated as low; measurement capacity is underdeveloped. STI prioritisation and agenda setting tends to exclude business and civil society, with resulting concerns as limited valorisation of R&D results.
On the positive side, two-thirds of countries strengthened their quality of governance, improved basic services and expanded economic opportunities. Fagerberg and Srholec (2017) found out that good governance is a strong explanatory variable alongside technological capability in their modelling of economic development.
The Human Development Index has shown a slow but steady rise, with a decline in absolute poverty. On the downside, many live under conditions of fragility. Net secondary level enrolment ratios are still too low, especially in SSA where girls are under-represented, and attaining SDG 4.3 remains elusive. Many youths are out of school, with consequent low participation in post-secondary technical and vocational education and training (TVET).
On the side of business, the Tripartite Free Trade Area holds promise for attaining regional integration on a North–South axis. Mauritius (25) and Rwanda (41) are now ranked among the top fifty for ‘Ease of Doing Business’. The GII identifies Kenya, Rwanda, Senegal, Uganda, Mozambique, Malawi, Tanzania and Burundi as ‘Innovation Achievers’. Over 2005–2015 patent applications grew at an average rate of 3.1%. When normalised to population size, Morocco is the most active country. In registration of trademarks per million, South Africa is the continental leader, while for design applications, it is Tunisia that is ahead. There is increasing registration of plant cultivars in Kenya, Morocco and South Africa, with the latter being most active for resident awards.
There has been a broad increase in higher education enrolments with compound annual growth of 3%. On the global stage, average five universities joined the Times Higher Education top 500, while six universities are listed in the ARWU top 500.
The global financial recession notwithstanding, notwithstanding, GERD: GDP has remained steady, with growth in the R&D personnel headcount and gains in gender equity. There is also evidence of networking and mobility of researchers and innovators within Africa and beyond. Scientific publication outputs have grown for all regions, with the strongest growth in North Africa, and the Central, East and Southern Africa systems showing field-weighted citation impact above world average. Research activity in Algeria, Tunisia and South Africa in ‘water resources’ is above the world average, and research from Algeria, Egypt, Morocco and South Africa is highly ranked on the new Nature Index. The NEPAD Flagship programmes continue to build knowledge and the next generation of scientists. In particular, the African Institute for Mathematical Sciences has continued to grow its footprint of excellence.
Manufacturing at 10% of GDP has yet to displace agriculture as a site of human activity and prosperity, and there is a continued dominance of commodity exports, with most economies being factor driven. Cross-border trade, excluding re-export of manufactured imports, remains below expectation.
Progress towards the SDGs is highest for the North African states with SSA faring less well: SDG-9 (Industrialisation) showing a very low score in general, and both SDG-10 and SDG-16 speak about inclusion being red flagged.
Concluding Remarks
This overview poses questions regarding Africa’s responses to the inter-related challenges of sustainability, health security and the emerging fourth industrial revolution. Africa’s response to the inter-related challenges of sustainability, health security and the emerging 4IR? The survival of the biosphere lies central to all development goals. Africa, the long continent that straddles the equator from 38°N to 38°S, naturally exhibits considerable climatic variation and biodiversity. The continent is water-stressed and drought prone, even as large tracts of arable land do not contribute to food security. Thus far, the Sustainable Development Solutions Network Africa SDG Index and Dashboard finds ‘a lack of understanding on what it will take to reach the SDGs, very little consideration for the financial resources that will need to be mobilised, and who will provide the necessary funds’ (UNSDSN, 2019, p. 3). North Africa performs the best, and Central Africa performs the worst. Countries perform comparatively well in sustainable production and consumption and climate action (SDGs-12 and 13), but poorly on human welfare (SDGs-1 to 7 and 11). On aggregate, thirty-four countries are roughly ‘halfway’ towards achieving the SDGs.
Lest this disappoint, there are positives. The energy gap is being filled with large renewable energy projects implemented from Morocco to South Africa, wind turbine farms in Egypt, Ethiopia, Kenya and South Africa, and solar arrays in Tunisia and Tanzania.
As to food security, agricultural R&D remains neglected in Africa’s nascent innovation systems, yet agricultural value added per hectare of agricultural land almost doubled between 2012 and 2015. Agriculture will continue to be the largest consumer of water, calling for appropriate crop selection, precision irrigation, substrate development and cover, intercropping, and groundwater control. These innovations require ICT platforms and ongoing application development, such as for farm management (Modisar, Botswana), or information on weather patterns (Kilimo Salama, Kenya). High mobile penetration and improved broadband are key enabling factors to the roll out of ICTs.
Algeria, Egypt, Ethiopia, Morocco, Nigeria, South Africa and Tunisia are members of the satellite club, with research expertise in related fields. The South African MeerKAT radio telescope, precursor to the Square Kilometre Array, is already serving as a training ground for understanding and using Big Data, that is a cornerstone of the 4IR.
One of the ongoing challenges is Africa’s demographic change which will see the emergence of the largest youthful workforce on Earth. Given education system weaknesses, burgeoning developments in artificial intelligence, autonomous vehicles, automation, the Internet of things and robotics, future livelihoods may not be taken for granted. The 4IR, be this as a continuation of the long ICT revolution with its 140-year path from Morse to Microsoft or a radically disruptive process, will bear on the attainment of the SDGs (WEF, 2019).
How have the STISA priority areas fared? There has been movement towards the eradication of hunger and achievement of food security in that absolute poverty levels have declined and crop yields show marginal improvement. In the domains of the prevention and control of disease, the strong focus of sub-Saharan science systems on the health sciences, especially in public health, is noteworthy, but insufficient to deal with pandemic.
In this context, reference is made to the Global Health Security Agenda (GHSA) that builds country capacity to deal with infectious disease. The GHSA highlights shortfalls in attaining the World Health Organization International Health Regulations (2005), and the World Organization of Animal Health (OIE) Performance of Veterinary Services Pathway. Attainment of the International Health Regulations empowers governments to protect the population against pathogens or other disasters. Zoonotic disease, such as CoV-2, is among these. WHO (2019) lays out the necessary benchmarking tool that informs the Joint External Evaluation (JEE) process. For their part, African states have committed high participation to the JEE, with 45 states having engaged with this learning process (WHO, 2021).
To date, the impact of COVID-19 in Africa (South Africa excepted) has been lower than anticipated. This provisional success has been attributed to prior experience of dealing with epidemics, notably malaria, Ebola and HIV, and the learning from the JEE process. The terrible impact of COVID-19 in South Africa points towards the gap between R&D efforts, the production and development of vaccines, and the social dynamics that accompany pandemic. A country research system may contribute to the scientific literature, but the focus of that effort and its potential translation into preventative and curative measures requires focus, critical mass and depth of R&D.
The low levels of BERD, coupled with the apparent difficulties in its measurement, speak to what Soete and Freeman (2007) referred to as disarticulated innovation systems. Indeed, the disconnect between research and innovation requires sensitive management, with a reorientation that places innovation topmost in policies and budgets, rather than trailing after research. Reality is that most innovation in firms arises from ideas generated by their own staff; and it is rare indeed that open-ended basic research will be at the heart of innovation in firms. In effect, the rhetoric of innovation has too often found expression in research for scientists’ own agendas. While there must be some room for curiosity-driven research, applied research and experimental development are better suited to meet the development agenda.
Some actions that might flow from the appraisal include investment in talent, systems and infrastructure, with the higher education share of GDP rising to 1% by 2025.
Launching national dialogue among all research and innovation system actors, civil society included, on the relationship between innovation and research, and society at large might go some way toward creating a shared understanding. Particular attention is required to understand the obstacles which the entrepreneurs and innovators face in accessing or creating markets and value chains.
The deep capacity in electronics, computer science, automation and telecommunications of the leading research nations of Africa—along with expertise in the agricultural, environmental and social sciences—can open prospects for the circular economy, expand social media, and use and contribute to Big Data, autonomous vehicle’s use and development, and cybersecurity.
Footnotes
Declaration of Conflicting Interests
The author declared no potential conflicts of interest with respect to the research, authorship and/or publication of this article.
Funding
The author received no financial support for the research, authorship and/or publication of this article.