
Abstract
Kenya’s government has identified science, technology and innovation as key for its national development plan and has started to refurbish its research environment. In this article, we use the world system approach to discuss the largely peripheral relations of Kenya’s science systems to the global science system and to identify indications for Kenya becoming a semi-peripheral scientific player itself within Eastern Africa. While the publications are dominantly oriented towards the Global North and while foreign sources fund nearly half of Kenya’s research and development (R&D), the country starts to become an important country for its neighbours. However, Kenya is still facing an unstable system of integrating significantly more graduate students. These are seen as essential to provide for a sustainable knowledge base that is required for the country’s socio-economic goals. We point to the lack of robust and recent data on R&D in Kenya as an impediment to evidence-based policy-making.
Introduction
Before 2005, Kenya together with Morocco, Nigeria and Tunisia belonged to a group that accounted for 26% of Africa’s publications (Gaillard et al., 2005). The group shared the existence of a vibrant scientific community, specialisation of research and representation in a number of scientific research fields. However, it was also this group that was affected most by severe crises in the higher education and research sector since then (Gaillard et al., 2005). Today, these countries seem to have recovered. Nigeria, Tunisia, Morocco and Kenya still belong to the top seven African countries if measured by publication output. However, the conducive environment for doing science is yet to be consolidated in some of these countries. In this article, we focus on Kenya as a key scientific player in the Eastern African region.
From a general overview, Kenya’s prospects are promising. The country hosts important international and regional scientific organisations. Its government places science on its agenda and, for instance, recently joined the Square Kilometre Array Observatory as a partner country. Kenya’s universities and government research bodies are joining international research networks and engage in intra-African collaborations. Its economy is partly driven by computer science and innovation, attracting foreign investments and brandings such as ‘Silicon Savannah’ (Bright & Hruby, 2015; Harsh et al., 2018). Microsoft chose Kenya to host one of its development centres that according to its press statement will help training young engineers and develop technologies for local needs (Reuters, 2019). However, Kenya’s scientific system is still facing significant challenges, including low numbers of locally trained PhD graduates, dependence on international funding for research and development (R&D) and unstable university research and teaching environments. These factors threaten the sustainability of R&D as well as its innovation capacities.
Following, we focus on the Kenyan science system and assess what its position in the global and African scientific environment is and as to whether it has achieved the status of a key scientific player in the East African region. We suggest that applying world system theory and its refined differentiation along core, semi-periphery and periphery countries helps to understand Kenya’s current position. After the conceptual outline of the core–periphery model, we use science policy development, R&D investment, PhD training policies and bibliometric indicators to assess Kenya’s international scientific position and capacities.
Situating Semi-peripheries
We approach the Kenyan science system from the perspective of world system theory, suggesting that it helps to shed light on the relative position of Kenyan’s researchers and research organisations in their international scientific environment. World system theory as developed by Wallerstein (1974, 2004) attempts to explain the spread of the capitalist economy and its effects of revolutionising societies throughout the world as well as to describe the relative positions of regions within the global system. Core elements of his approach are interregional relations and the transnational division of labour to understand the mode of production, the flow of raw and refined goods, and the accumulation of surplus value at places where high value is added. Research systems of countries and regions can be analysed in a similar manner once they are seen as inherently linked to global economic production (Hountondji, 1978; Schott, 1998; Schubert & Sooryamoorthy, 2010). In an analogy to the concept of ‘economic dependency’ (Amin, 1970), Hountondji (1978) drew an analogy between the global economic and scientific labour division to estimate the relative position of African researchers. Just as in economics, the position of the researcher in Africa seems to be to merely produce data that are then being used for theory building and publications in core scientific centres, adding scientific surplus value. Hence, without own means of production, African researchers remain limited in developing own scientific infrastructures and agendas answering to local, national and regional R&D needs.
‘Scientific dependency’ arises when organisational features in peripheral countries are not comparable with their core counterparts, hence creating inequalities in infrastructure, networking, training and research opportunities. The accumulated effects of long-term investment in science and technology, and their conversion into marketable products in countries, such as the USA or the European Union contributed to their powerful positions within the science systems. Observers have noted that these advantages lead to scientific domination through a number of factors: Core countries hold a central position in scientific networks that allows more control over knowledge flows. Rules and mechanisms of scientific production on a global scale are set in core countries, to which scientists have to adhere to if they want to take part in global scientific development. Dominating the global agenda also implies that dominant scientific actors are shaping the research agendas at the local level of peripheral states because in the labour division the latter’s researchers often function as subcontractors. Moreover, the affluent position of core countries helps attracting talent from peripheral countries, contributing to work migration of highly trained individuals (Olechnicka et al., 2019, pp. 102–107). The effects for most African science systems can be deduced from the described factors of dominance: dependency on technical equipment from the North; the fact that African publishing houses and libraries as well as universities are under-resourced and that African scientists, therefore, need to be more mobile to participate in high-quality research environments than their travelling Western colleagues. The extraverted nature of scientific practice in African societies also becomes visible in the orientation towards a Northern audience in science journals, the frequent exportation of un-analysed data to laboratories and the existence of internationally funded research centres that are mostly disconnected from local universities as ‘virtual islands of excellence’ (Hountondji, 1995). Moreover, the international scientific labour division and the practices of subcontracting research to African scientists can lead to the overemphasis of applying concepts and models evolving in core countries or global enterprises (e.g., Mamdani, 2007). The focus on applied science as a limitation in peripheral countries is furthered by national governments and international donor policies that demand rapid development solutions, pushing more explorative approaches aside that could generate theoretical insights and methodological developments as own contributions (Hountondji, 1995; see also Connell, 2014).
However, Wallerstein and others have criticised a simplifying dichotomy of colonised and coloniser or centre and periphery and turned to the more complex image of ‘multi-layered centre-periphery relations’ (Hwang, 2008; see also Delvenne & Kreimer, 2017). These more complex relations include the evolving of multiple new core scientific regions contributing to scientific contributions and sharing in the rule, and agenda-setting of core countries. However, while a simple dichotomy is not in place, an equalising effect of networked global scientific production is also not visible, limiting the explanatory reach of network analysis. ‘The network structure of global scientific collaboration does not imply that horizontal relations among countries prevail. On the contrary, the system can be described as hierarchical’ (Olechnicka et al., 2019, p. 103). This observation suggests that we should consider the positive effects of international scientific networks for scientists while not ignoring the network’s hierarchies and continuous scientific dependencies. We suggest looking at Kenya’s science system through the lenses of the centre-periphery model with two questions: What is Kenya’s current position in the globalised scientific production system regarding disciplines and international collaboration? And what role does the country have as a scientific player for the East African region, given its strong position on the African continent as one of the top scientific producers.
Methodology and the Available Data
This article draws from an analysis of national policies and of data made available through the UNESCO Institute for Statistics (UIS). Furthermore, we analysed the Web of Science (WoS) publication data housed at CREST. Additionally, we use available PhD enrolment information from government reports and analyses. The desk review and UNESCO UIS data assist us in drawing a picture of recent policy developments and underlying spending pattern of government as one indicator to determine the relative position of Kenya’s science system within the global scientific environment. The policy development portrays some of Kenya’s efforts to create a supportive environment for local researchers and students. However, the expenditure patterns for science show that Kenya lacks larger amounts of endogenous funds and that exogenous funds are crucial to realise scientific production and international collaboration. This can be regarded as one key indicator for scientific dependency.
We apply bibliometric analysis to describe several scientific developments, including the share of disciplines and research fields of Kenya’s scientific production as measured by publication output, the scope and target of international collaboration as another indicator for scientific dependency. Moreover, bibliometric data are used to assess the internal relations between often internationally funded research centres and national universities to test for the ‘virtually free-floating institutes’ that are locally disconnected. Finally, we analysed the international collaborations with its neighbouring countries, giving us first indications for Kenya to function as a key scientific system in the region. All data were collected from the WoS database, tested as well as analysed (Lutomiah, 2019).
The data in this report on R&D investment require a cautionary note. Despite the recent update of data by UIS, the image of Kenya through the lenses of its data remains an outdated one since Kenya reported last in 2010. This lack of reliable data in the frequently used UNESCO database is representative of many African countries. Only few countries seem to have the capacity to collect and distribute key figures to describe their science system. However, we decided to work with the available data to get an indication for Kenya’s development since the 2000s. Data referring to years after 2010 are partially drawn from other reports. Bibliometric data have become a standard in describing the scientific output, its distribution and recognition and to capture collaborative characteristics within disciplines and between individuals, institutions and countries (Borgman & Furner, 2002; Ivancheva, 2008; van Leeuwen, 2005; van Raan, 2005). The WoS data must also be qualified as its coverage of Africa and other developing countries is not as good as the rest of the (northern) world (Mongeon & Paul-Hus, 2016; Ràfols et al., 2016). Due to a lack of accessible alternatives, we decided to use this often cited data to approximate the output and collaboration pattern of Kenya’s scientists with the necessary caution.
Is Kenya a Key Scientific Nation in East Africa?
Kenya can be argued to be a key scientific nation in the East African region, given several characteristics. Kenya hosts several international stakeholders and organisations, which places the country as a key research hub in East Africa (Fosci et al., 2019). Similarly, Kenya is home to the headquarters of several international organisations and research think tanks, such as the Royal African Society, the Pan-African University, the African Population Health Research Centre and the African Economic Research Consortium, among others (Fosci et al., 2019). A recent study shows that Kenya has ‘at least 14 international public research funding organizations and four private funding organizations that are currently active in the country’ (Fosci et al., 2019). The UK has about nine active research-funding organisations operating in Kenya, which can be attributed to its historical ties with the country. Apart from the research funders, Kenya also hosts predominant research intermediaries, such as the African Academy of Sciences, the Inter-University Council of East Africa and the African Building Capacity Foundation (ABCF) (Fosci et al., 2019). These influential research funders, research intermediaries and international stakeholders position Kenya as predominant research hub in East Africa and on the African continent as well.
Kenya is claimed to be a target destination of international students (from abroad and in the region), given its economic growth and the recent expansion of its higher education sector. By 2016, Kenya had a total of 4,782 foreign students compared with South Africa’s 45,142, which is the top destination for international students in Africa. Although most of the international students are untracked many are believed to be hailing from the neighbouring countries, that is, Uganda, Tanzania, Somalia, South Sudan and Rwanda, among others. The Kenya National Qualifications Authority has set targets of increasing the number of international students from 5,000 to about 30,000 students in the next five years by targeting the students in the region (Waruru, 2019). One motive to increase the number of international students is to generate new sources of fees for university education, including doctoral education.
Science Policy Developments
Kenya is said to have ‘one of the fastest-growing sectors’ in higher education, including research (Barasa & Omulando, 2018), with the most competitive system according to regional standards (Tijssen, 2007 as cited in Barasa & Omulando, 2018). The research environment rapidly grew from its first national university in 1970 and a few international research institutes to seventy-four accredited universities and further national and international research centres in 2017 (Commission for University Education, 2016).
However, the Kenyan scientific community experienced a severe crisis after having grown from the first university and governmental research facilities until the 1980s. Starting in the second half of 1980, the Kenyan system went through events that caused its loss in international visibility and local problem-solving capacities. This crisis affected the country’s universities, governmental research centres as well as regional and international research centres alike. Eisemon and Davis (1997) identified a higher enrolment negatively affecting research and supervision capacities because the government did not increase funding of universities and research centres at the same time as key factors. The lack of funding also led to fewer new appointments of researchers and to an increasing reliance on consultancies for international donors to finance research activities and to increase personal salaries. While universities were including students beyond capacities, government research institutions also had to readjust their research programmes to adapt to broader demands and to raise new revenues to sustain their research (Eisemon & Davis, 1997).
During the last two decades, the Kenyan government has re-invested into its higher education and research system. This was most likely because of a substantial increase in gross domestic product (GDP) between 2002 and 2008, and because of science policy shifts after 2007. Then President Mwai Kibaki inaugurated the Kenyan Vision 2030, an economic development plan, which comprises science, technology and innovation (STI) as one of ten sectors to deliver to the national development. Many subsequent government science policy documents and many university’s research policies refer to this goal (e.g., Mukhwana et al., 2016).
Kenyan agencies, such as the National Research Fund, trace its policy goals even further back to the African Union’s (AU) aims to harness science and technology in African countries. The corresponding section on STI in Kenya’s policy refers to many of the AU’s demands, including efforts to increase public and private investment into STI and to direct research towards the national priorities and to safeguard their quality. Research funds were consolidated in 2008/2009 to respond to the goals, and a comprehensive reorganisation took place with the Science, Technology and Innovation Act of 2013. The National Research Fund is operative since December 2015 and expected to manage 2% of GDP each year provided by the Kenyan treasury, in addition to any other fund, donation or endowment. Funds are distributed in competitive bids (Ministry of Higher Education Science and Technology, 2012; The Republic of Kenya, 2013). This newly planned capacity of government oversight suggests that an improvement since the 1990 and 2000s crisis also led to ineffective coordinating bodies in many African countries due to the lack of political support and budget (Gaillard et al., 2005). Yet, it remains to be seen whether the new governance structures lead to less dependency on external sources and research agendas.
The amount a country invests in R&D as a prerequisite for innovation, welfare, innovation and other expected benefits has become another often used indicator to describe relative positions in the global science system. Since the landmark Lagos Plan of Action in 1980, African heads of governments called for an investment of 1% of GDP in R&D, a goal that was repeated by the AU (African Union Commission & NEPAD, 2005). According to its 2013 science policy, Kenya aims to invest 2% of its gross national product in R&D. By 2010, the gross expenditure for research and development (GERD) as proportion of GDP was 0.76% which represents a doubling in investment from 2007 (0.36%) (UNESCO, 2015), this figure is higher than that of any other country in the East African region, however, still low that the country’s target of spending 1% of GDP on R&D. Higher education, government institutions and foreign sources provided the biggest growth of R&D funding. During the last decade, Kenya has seen two funding trends: On one hand, the national business and private non-profit sectors have drastically reduced their R&D investment share, most likely because of the world economy crisis in 2008. 1 At the same time, the government and the higher education sector have marginally decreased their share. On the other hand, funding from external sources nearly tripled during the same period from 17.62 to 47.14% as a share of GERD (337,671,692 USD PPP in 2005 constant prices). With this high increase, foreign funders provide nearly 100% more funding for R&D than the government. While other African countries rely even more on foreign sources for their R&D, Kenyan scientists can also be considered as dependent regarding exogenous funding to realise their research goals.
Research Careers and Young Researchers
Given the amounts dedicated by universities to research from their own funds, both the science granting council and the university board with their respective interests must be seen as complementary influential for the R&D sector (Barasa & Omulanda, 2018). Universities go beyond this interest with their tasks to train future generations, including scientists. This puts the focus on the university’s endogenous capacities to train and retain researchers as a means to become less dependent on exogenous expertise and to train future generations of researchers.
R&D as well as translation into products or services are based on trained and experienced persons and their distribution across different sectors. Both research and supervision of undergraduate and graduate students depend on this group, including researchers and research supporting staff. In 2010, Kenya counted 1,489 researchers and research support staff per million inhabitants, 1,029 of them working as full-time equivalent researchers. This leaves Kenya with higher reported number of R&D staff per million inhabitants in comparison with Uganda (59.2) and Tanzania (63.5). 2
Doctoral candidates and master students are counted as researchers if they participate in the activities that define researchers (OECD, 2015). Kenya has set itself the aim to increase the number of PhD-trained teaching staff at universities and to produce at least 1,000 PhD graduates per annum needed for the country to achieve its socio-economic goals of becoming a middle-income country by 2030. However, the number of doctoral graduates remains below the national benchmark for the doctoral graduation completion rate of 20% per cohort within a stipulated period of three years. The current completion rate stands at 11% (about 369 graduates) and the average time of completion is six years (Barasa & Omulanda, 2018). Between the period of 2012 and 2015, Kenya’s main public universities produced 1,187 PhD graduates with the highest numbers produced by Kenyatta University (349), Jomo Kenyatta University of Science and Technology (260), Moi University (196) and University of Nairobi (UON) (117). The remaining 265 PhD graduates were spread across the other public universities. In 2015, Kenya’s public universities produced 390 PhD graduates an increase from 205 in 2012 (Commission for University Education, 2016). Several reasons have been claimed to explain these PhD low graduate rates, including challenges of student’s life and work balance, funding constraints, lack of research facilities and equipment, and shortages of qualified supervisors (Barasa & Omulanda, 2018, Matheka et al., 2020).
A key requirement of the provision of quality PhD training is qualified academics. As of 2016, statistics from Kenya’s Commission of University Education showed that less than half (about 34%) of the academics at Kenyan universities have a PhD qualification while more than half (53%) have a Master’s qualification (Commission for University Education, 2016). These statistics suggest that there are inadequate numbers of academic staff in Kenya’s universities required to facilitate the supervision of PhD students, hence the low PhD graduation rates. The situation at universities is further constrained by attempted policy implementation that only staff holding a PhD is eligible to teach and that current staff is to be enrolled in PhD programmes.
Kenya’s Scientific Collaborations and Field Strengths
In the following section, we use bibliometric data to shed light on Kenya’s global position in science. The first part leads us to postulate Kenya as being in a peripheral position (world share of publications, share in African outputs, contributions of international research centres and linkage of research centres and universities). In the second part, we look at the position of Kenya within the region (collaborations according to publication with neighbour countries), indicating a semi-peripheral status or the forming of a core within the periphery.
Kenya ranks seventh in Africa’s list of publication production (Beaudry et al., 2018, p. 14) and has been described as the ‘leading research economy in the east of the continent’ (Adams et al., 2014). The country’s output of articles and reviews published in the WoS Clarivate analytics steadily increased from 480 publications in 2000–2512 in 2019. This increase represents an average annual growth rate of 8.9% over this the period of 2000–2019 as compared with a growth rate of 1.8% in the preceding decade (1990–1999). This rate of increase surpassed the world’s growth rates in the recent seven years from 2013 to 2019 period. This also shows that Kenya’s share of world output has more than doubled from 0.07% in 2000 to 0.14% in 2019. Despite the increase in scientific output and share of world output, Kenya has declined in its ranking in the world relative to other countries: from position 60 in 2000 to position 64 in 2019. A large proportion of these publications are produced by public research institutes, higher education institutions and international research organisations as dominant producers of Kenya’s science. The biggest contribution of scientific output between 2000 and 2019 come from the University of Nairobi (UON), the Kenya Medical Research Institute (KEMRI), International Livestock Research Institute (ILRI), Moi University, Kenyatta University (KU), Jomo Kenyatta University of Agriculture and Technology (JKUAT), Egerton University, International Centre for Insect Physiology and Ecology (ICIPE) and World Agro-forestry Centre.
The fields that dominate the research output of Kenya are the health sciences, the natural sciences and agricultural sciences and, to a lesser extent, the social sciences. The disaggregation of publication output between 2000 and 2019 by scientific field shows that all scientific fields had positive growth rates with engineering and humanities recording the best performance overall. Particularly, clinical and public health, basic health and biological sciences, agricultural sciences are fields with high outputs of recorded publications. The bibliometric results also show that agricultural sciences, health sciences and social sciences are the fields with a high relative field strength (RFS), 3 that is, the broad domains where the RFS index value is >1. The RFS indicator of all the broad domains has increased except for the natural and agricultural sciences, which have decreased their relative output for the period analysed (2000 and 2019). Kenya appears weakest in terms of RFS in the broad domains of humanities and engineering, and applied sciences. The RFS indicator shows that Kenya is strong in the following sub-fields (where the RFS index >1): agricultural sciences, basic sciences, biological sciences, clinical and public health, earth sciences and sociology.
A higher share of internationally co-authored papers can be said to correlate with higher visibility and appreciation through citations. Taking into account field-specific citation behaviour, we note that also the citation impact of Kenyan-authored papers as measured by the mean normalised citation score (MNCS 4 ) for a two-year window period, slightly increased from 1.00 in 2000 to 1.19 in 2019. For the period of 2000–2019, Kenyan-authored papers maintained relatively high MNCS values, that is, above 1 (‘the gold standard’) for a two-year window period. Overall, all fields have increased their impact through citation, especially the humanities (from 0.15 in 2000 to 1.14 in 2018), the natural sciences (from 0.77 in 2000 to 1.28 in 2018) and engineering and applied technologies (from 0.27 in 2000 to 0.94 in 2018). Despite the social sciences, humanities and engineering and applied technologies having a relatively small share of Kenya’s research output, these three fields equally recorded relatively high citation impact.
Kenya’s Internationally Co-authored Publications by Scientific Field
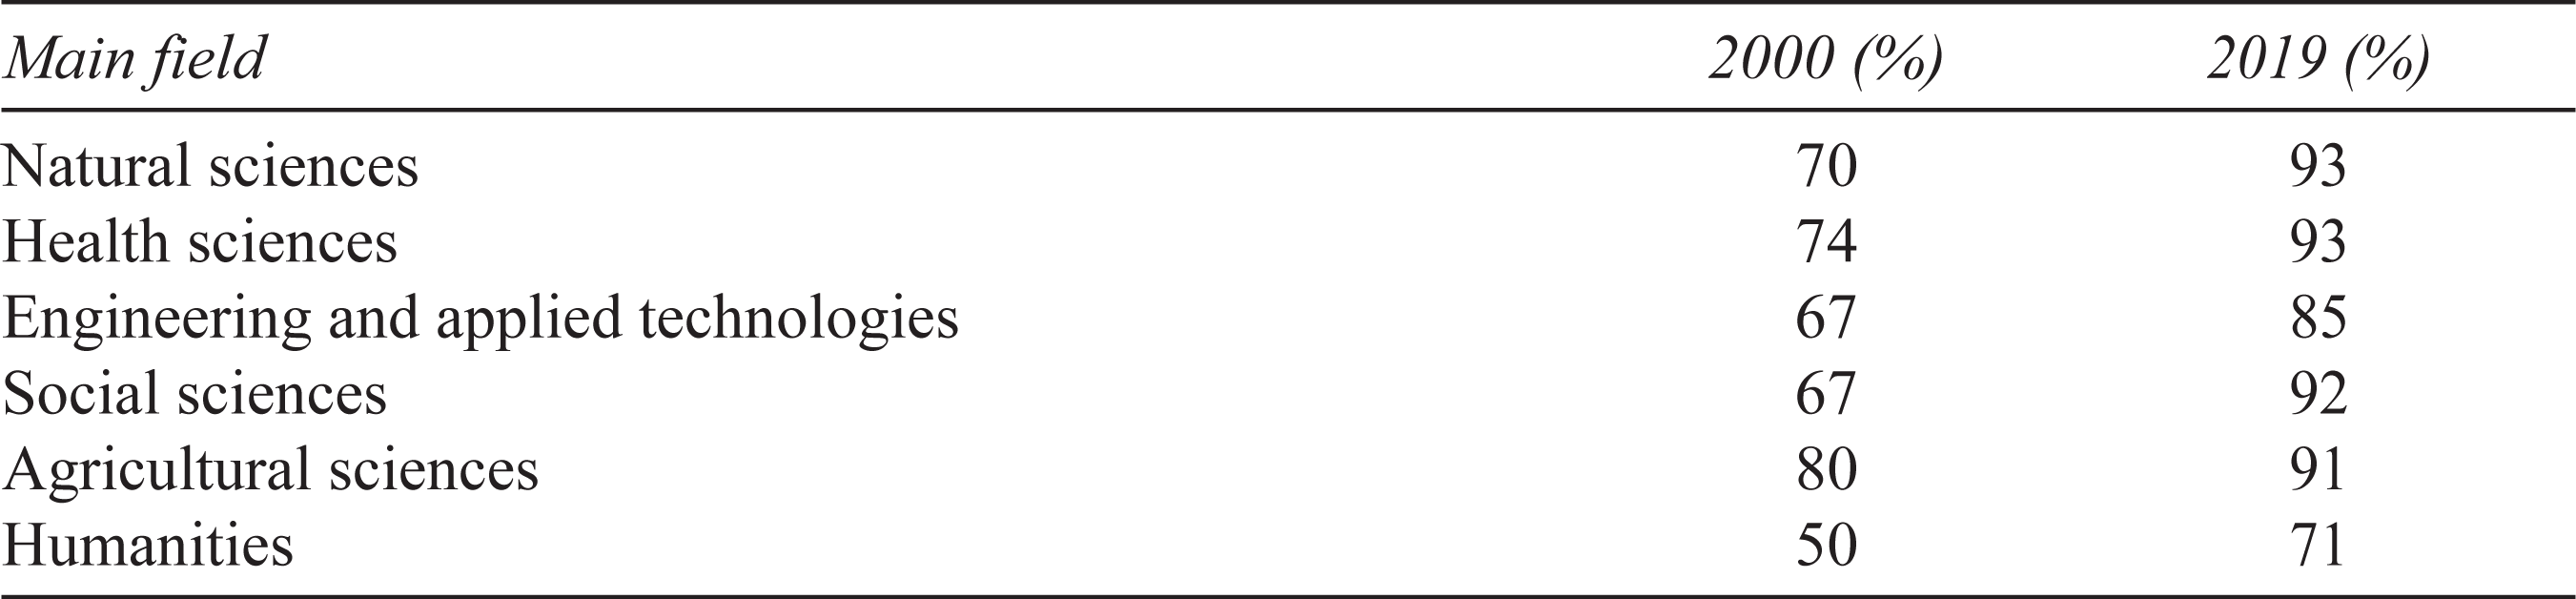
The bibliometric analysis also reflects international science collaboration when studying the institutional networks of co-authors. Table 1 shows that international collaboration increased across the fields between 2000 and 2019, irrespective of the field. Kenyan scientists increasingly collaborate with the rest of the World and particularly the countries outside Africa (highest increases in the past 15 years). Overall, international collaboration increased from 67% in 2000 to 82% across all fields in 2019. Associated with this, the bibliometric data show a huge decline in national collaboration (20.88% in 2000 to 7.88% in 2019) as well as single-authored papers (10.20% in 2000 to 1.9% in 2019) over the years. Similarly, the bibliometric data show that collaboration with other African countries is almost negligible (an average of about 6.47% between 2000 and 2019) as well as the single-authored papers (an average of about 5.89% between 2000 and 2019). In general, a majority of Kenya’s papers fall into two major groups: co-authored papers with authors from institutions within Kenya comprising about 13.61% of all papers and papers co-authored with authors from countries outside Africa comprising about 75% of all the papers produced between 2000 and 2019.
Scholars (Mouton et al., 2019) suggest that collaboration trends of a specific type of collaboration (i.e., international collaboration) should be looked at in relation to the trends in the other types of collaboration. Mouton et al. (2019) note that high proportions of internationally co-authored papers for a given country on one hand and lower proportions of national collaboration on the other end could imply ‘a weak national science system’. Moreover, collaboration patterns vary considerably by field. Single authorship is more dominant in the humanities, while multi- authorship is more common in the health sciences and the natural sciences (Melin, 2000). The plausible explanations for the high proportions of collaboration for engineering, health, natural and social sciences could be the large clinical trials and large international projects and studies, in which Kenya is involved as a network node. Moreover, fields, such as health and agriculture, have experienced a higher investment in international funding and hence more visibility in publication output.
A comparison of Kenya with other African countries shows that Kenya’s world share in 2019 of 0.14% is below the world average of 1.0%, although the world share has doubled in the last 19 years. As far as the African publication output is concerned, the comparator countries on the Africa continent continue to dominate Africa’s publication contribution: South Africa contributes the highest share (28.2%) of all African output followed by Egypt (19.6%), Tunisia (9.2%) and Nigeria (6.1%).
A Semi-periphery by Co-publications
In our introduction, we assumed that Kenya can be seen as an emerging semi-peripheral science system. This would not exclude that Kenya itself is deeply oriented towards the core scientific countries as shown by Schubert and Sooryamoorthy (2010) for the case of South Africa. The outward orientation through collaborative publication becomes visible when regarding Kenya’s collaboration intensity, which lists North American and European countries on top for the period of 2000–2019. The only African country high on the list is South Africa. A semi-peripheral status becomes evident when looking at the orientation of neighbouring peripheral science systems towards Kenya, which becomes attractive for education and scientific collaboration itself. Given the high amounts of researchers and absolute investment in R&D due to Kenya’s higher GDP and the country’s standing in the region, we expect it to be equally attractive for the East African community.
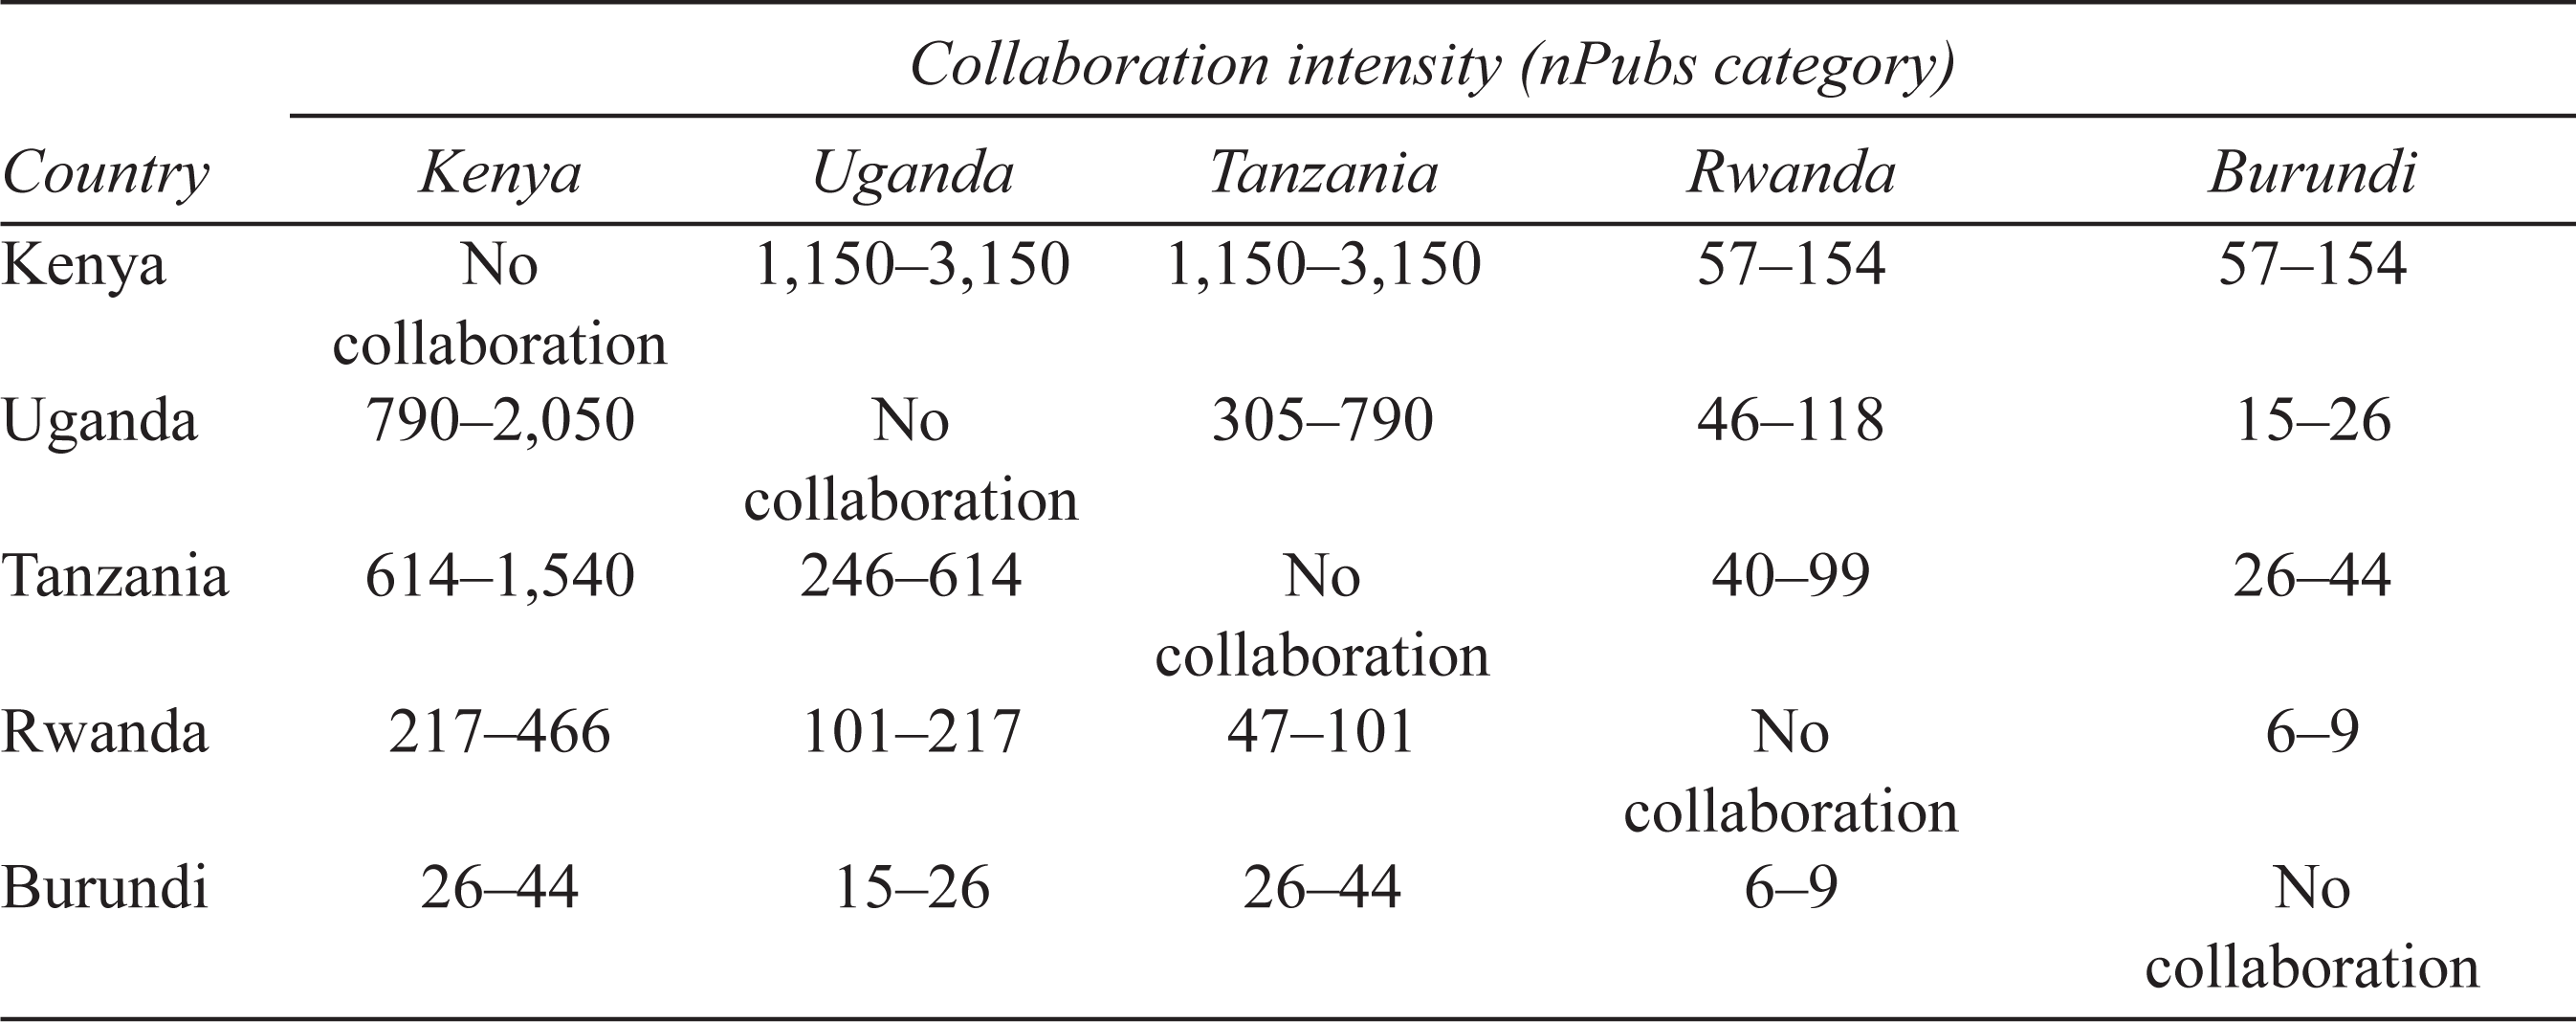
Article output shows that for the five-year period (2011–2015) analysed, all the countries of the Inter-University Council for East Africa (IUCEA) contribute 7.9% to the African overall output. Of this share, Kenya contributes about half (3.5%) followed by significant contributions from Uganda (2.1%), Tanzania (1.8%) together with small contributions from Rwanda (0.4%) and Burundi (0.1%) (Beaudry et al., 2018). Another set of data shows, Kenya’s collaboration with Tanzania and Uganda intensified between 2000 and 2019, with a collaboration intensity of 1,150–3,150 papers for the period. Kenya’s neighbouring countries have become her third most important collaborators together with China and Australia. For the period of 2000–2019, within East Africa, Kenya was the top collaborator for Tanzania with a higher collaboration intensity of 614–1,540 papers, compared with Uganda which had a lesser collaboration intensity of 246–614 papers. The same results apply to Uganda whose top collaborator is Kenya with a collaboration intensity of 790–2,050 papers, compared with Tanzania which recorded a lesser collaboration intensity of 305–790 papers as shown in Table 2. Based on the collaboration intensity data, this suggests that Kenya is a key player in relation to publication output and collaboration in the East African region.
Collaboration Intensity in the East African Region 2000–2019
Conclusion
Kenya’s government has set out to transform the country’s economic base with the help of R&D and higher education. In our article, we looked at the current state and traced some of the recent changes measured by publication outputs. Furthermore, we observed the increased capacity of the coordinating bodies and the commitment of the government.
Our first motivation was to outline the relations of Kenya in regard to the global science system and other African national science systems. This interest comes with the question of whether Kenya still needs to be described as a peripheral, dependent country. Kenya’s share of world scientific publication has doubled between 2000 and 2019, its visibility has benefitted from more international collaborations in all scientific fields. At the same time, while its share of collaborations with non-African countries has increased, the collaboration within the country and within the entire African region has stagnated in relative terms, reflecting the broader trend of African countries. The international collaboration pattern shows that Kenya’s science system is closely connected to the Global North and with South Africa being the top African country among its collaborators. The publications of international research institutes contribute to this trend by strengthening the international networks they are situated in. Also in regard to PhD training, enrolment and completion rate, Kenya remains dependent on the education opportunities of PhD graduates abroad and with the help of international donors.
The second motivation concerned the regional status of Kenya, which is the biggest producer, has the highest ratio of researchers to population and invests more in absolute terms, very much reflecting its economic status in the region. We have shown, that despite the marginal intra-African collaboration, Kenya is not only in absolute terms the biggest knowledge co-producers in the East African region, but also in relation to its neighbouring countries. It is more likely that scientists from Uganda, Tanzania, Rwanda and others will collaborate with Kenya than among each other. This is in line with diffusion theories, which use trade relations, common language and proximity as explanatory factors. The intra-regional collaboration intensity can serve as an indicator for the status of an emerging scientific semi-periphery, together with the pull factors of increased technological research capacities that are being established in Kenya at the moment by large international companies. However, this might be confined to a small set of scientific fields Kenya is strong in and which encourages scientific and economic use and added value to goods. According to Wallerstein’s approach, only then will a semi-periphery be likely to emerge. Due to a lack of data, it was impossible to identify the relations of non-Kenyan master and PhD students being attracted to Kenyan universities and research institutions.
The article included a warrant concerning imperfect data. This is not particular to the Kenyan science governance systems; however, it can be taken as an example. While the bibliometric data from WoS were useful to estimate the relations of Kenyan researchers to a certain extent, it does only reflect a global integration but less so a regional one. The selection of journals and the known biases of WoS contribute to the fact that not more collaborations in more regional or local journals were identified. Moreover, a robust and more recent comparison of investment in R&D and in researcher characteristics with its neighbouring countries is prevented by the fact that Kenya’s last data entry into – the often frequented – UIS was in 2010. To arrive at a better approximation of Kenya’s current state of science through these indicators would require new and reliable data provided by the government. This is not only true for the need to identify gender-related imbalances and discriminations within the science system (Ozor et al., 2014), but also for other evidence needed to design STI policies which contribute to the national development plans.
Footnotes
Declaration of conflicting interests
The authors declared no potential conflicts of interest with respect to the research, authorship and/or publication of this article.
Funding
The authors received no financial support for the research, authorship and/or publication of this article.