
Abstract
Building on the strategy-as-practice perspective, this exploratory study addresses an overlooked line of inquiry into the forms, differentiators, and performance differences of micro-activities underpinning business model innovation (BMI) in an emerging market in the backdrop of dominating studies on conceptualisations, descriptions, antecedents, and preconditions to BMI. Cluster analysis of 127 managerial-level employees’ responses gathered through a survey uncovered three forms of micro-activities underpinning BMI unique to the firms’ economic activity: finance-driven, offer and customer-driven, and multiple-epicentre-driven. The common focus on customer relationships element across the clusters confirmed the uniqueness of the BMI approach in an emerging market. One-way Analysis of Variance (ANOVA) confirmed the performance differences among the clusters. The interdependency of BMI dimensions and the approaches to aligning BMI dimensions are proposed for future research.
Business model innovation (BMI) is a promising approach for firms to create new value for customers in volatile business environments (Mihardjo et al., 2018; Roaldsen, 2014) and identify and refine the operational competencies needed to outcompete competitors (Abraham, 2013). The economic environment faced by businesses is moving rapidly towards open markets, mobile labour, and information abundance leading to fluid resource markets and hyper-competition which set speed, surprise, and innovation as the key bases of competitive advantage (Johnson et al., 2003). This situation makes sustainable advantage lie in micro-assets that are hard to differentiate and difficult to trade and affect both the level and frequency of strategic activities. Against this backdrop, product and process innovations are not sufficient to ensure financial performance and sustainability simultaneously (Clinton & Whisnant, 2019) but BMI. Thus, strong attention has been received by BMI from both researchers and practitioners in recent years (Bhatti et al., 2020; Clauss, 2017; Sjödin et al., 2020).
According to the strategy-as-practice perspective (Carter et al., 2008; Do Vale et al., 2021) or activity-based view of strategy/micro-strategising perspective (Johnson et al., 2003), business model-based responses to market demands and competitive environment are executed through dynamic capabilities formed and driven by micro-level strategic and organisational activities (Achtenhagen et al., 2013). The value created by a firm lies increasingly in the micro-activities of managers and others in organisations (Johnson et al., 2003). Thus, an empirical understanding of the micro-activities that make up strategy and strategising in the practice of BMI is essential as it opens the ‘black box’ of strategy to study the actual process of strategising. Yet, until recently, the focus of the literature had been on antecedents and preconditions to BMI (e.g., Bhatti et al., 2020; Hock-Doepgen et al., 2020; Li & Zhuo, 2021; Roaldsen, 2014; Sosna et al., 2010; Van Den Heuvel et al., 2020; Waldner et al., 2015; Zhang et al., 2020) and conceptualising and describing business models (Do Vale et al., 2021). Hence, this study argues that this concentration on the degree of BMI (e.g., Velu, 2015) and efficiency and novelty (e.g., Zhu et al., 2019) provides only a more static interpretation of BMI and fails to explain the processes and practices constituting strategies driving the actualisation of potential value creation leaving them undisturbed in the black box of organisational processes. To address this issue, this exploratory study builds on the strategy-as-practice perspective (Do Vale et al., 2021; Johnson et al., 2003) and questions (a) what forms of BMI micro-activities can be found in an emerging market context? If so, (b) what business model constructs discriminate between different forms of BMI micro-activities? and (c) are there performance differences among such forms of BMI micro-activities?
Hence, this exploratory study contributes to BMI research from the strategy-as-practice perspective emphasising a still-developing area of business model research to show how business models are shaped, adapted, and renewed as a part of strategy processes (Achtenhagen et al., 2013; Do Vale et al., 2021). By so doing, this study responds to the call for empirical research exploring organisational processes and structures in BMI by Foss and Saebi (2017). Studying the practices of firms in the BMI process is more insightful (Baumgartner & Mangematin, 2019; Do Vale et al., 2021; Johnson et al., 2003) as it ‘drills deep down inside the organisation’ (Whittington, 2006) with a granular approach instead of static snapshots of organisation emerged through mere descriptions of business models and assessments on the degree of BMI. Further, traditional business strategy conceptualisations are limited to typologies such as incumbent vs. front runners (e.g., Sund et al., 2021) and old firms vs. young firms. Yet, in reality, firm approaches go beyond the dichotomous classifications and it is impossible to expect all incumbent firms in an industry or a service sector to follow similar approaches (Ruggiero et al., 2021). Therefore, the identification of distinct, internally consistent sets of firms by analysing the micro-strategic activities and forms/configurations in BMI as opposed to uncovering the broader building blocks (Demil et al., 2015; Tykkyläinen & Ritala, 2020) and relationships that hold across all organisations provides an increased and timely understanding of this organisational phenomenon of BMI (Ketchen et al., 1993). Such a detailed analysis of micro-level practices constituting the day-to-day activities of organisation life and relating to strategic outcomes of an organisation will offer practical and actionable guidance to managers.
Moreover, this study extends the BMI discussion to an overlooked context, that is, Sri Lankan firms. Sri Lanka stands at the fourth place in most innovative economies in the Central and Southern Asian context (World Economic Forum, 2019) and is also considered as a Bottom-of-the- Pyramid market (e.g., Schuster & Holtbrügge, 2012; Simanis & Duke, 2014). Much of the BMI research focuses on developed regions (e.g., McDonald et al., 2019; Ruggiero et al., 2021; Spieth et al., 2020; Sund et al., 2021; To et al., 2019; Van Den Heuvel et al., 2020) or BRICs nations such as India (e.g., Angeli & Jaiswal, 2016; Saqib & Satar, 2021) and China (e.g., Bao et al., 2020; Su et al., 2020). A notable exception to this is Bhatti et al. (2020). In a recent study, Saqib and Satar (2021) find that companies in these emerging markets do not have revolutionary products and services but instead unique business models that rarely predict success in another country context and are less replicable given that the diversity across the countries within emerging markets. These unique business fabrics and the nature of entrepreneurial cultures need to be uncovered to inform effective research and managerial policy practices. Given the business model configurations provide insights into organisational patterns (Jang et al., 2020), such managerial practices in diverse cultural and economic contexts may provide a model for existing and future businesses. Therefore, this study enriches the understanding of the nature of firms’ business strategy in a transition economy, encouraging more sustainable capabilities for responding to changing market contexts.
What follows is a concise discussion of the theoretical underpinnings of this study. Following this, a detailed explanation of the methodological approach of this study is presented. Analysis and discussion are then presented, concluding with an examination of the implications and limitations of the study.
Theoretical Background
Business Model and Business Model Innovation
A business model is a structural template explained by the three central dimensions, including value creation, value proposition, and value capture (Clauss, 2017; Morris et al., 2006; Spieth et al., 2020) or a conceptual representation (Massa et al., 2017) of how firms run and develop their businesses (Baden-Fuller & Haefliger, 2013; Clauss, 2017; Massa et al., 2017; Zott & Amit, 2013). It ‘is used to describe a company’s unique value proposition (the business concept), how the firm uses its sustainable competitive advantage to perform better than its rivals over time (strategy), and whether, as well as how, the firm can make money now and in the future (revenue model)’ (Morris et al., 2006, p. 28). Designing a new or reconfiguring the existing activity system of the business model is known as BMI (Gebauer et al., 2017; Zott & Amit, 2013).
Entrepreneurial responses to market turbulence are devised through BMIs (Jang et al., 2020; To et al., 2019). Thus, the business model becomes central to achieving enterprise sustainability by strategically improving performance with a long-term orientation (Schaltegger et al., 2012). However, ‘business models are not first designed and then implemented, but are more usefully thought of as strategy-as-practice; incrementally emergent and ever-changing’ (Mason & Spring, 2011, p. 1033). Therefore, managers and scholars must pay attention to the ‘management practices that perform, realise, and evolve the business model as it happens’ (Palo et al., 2019).
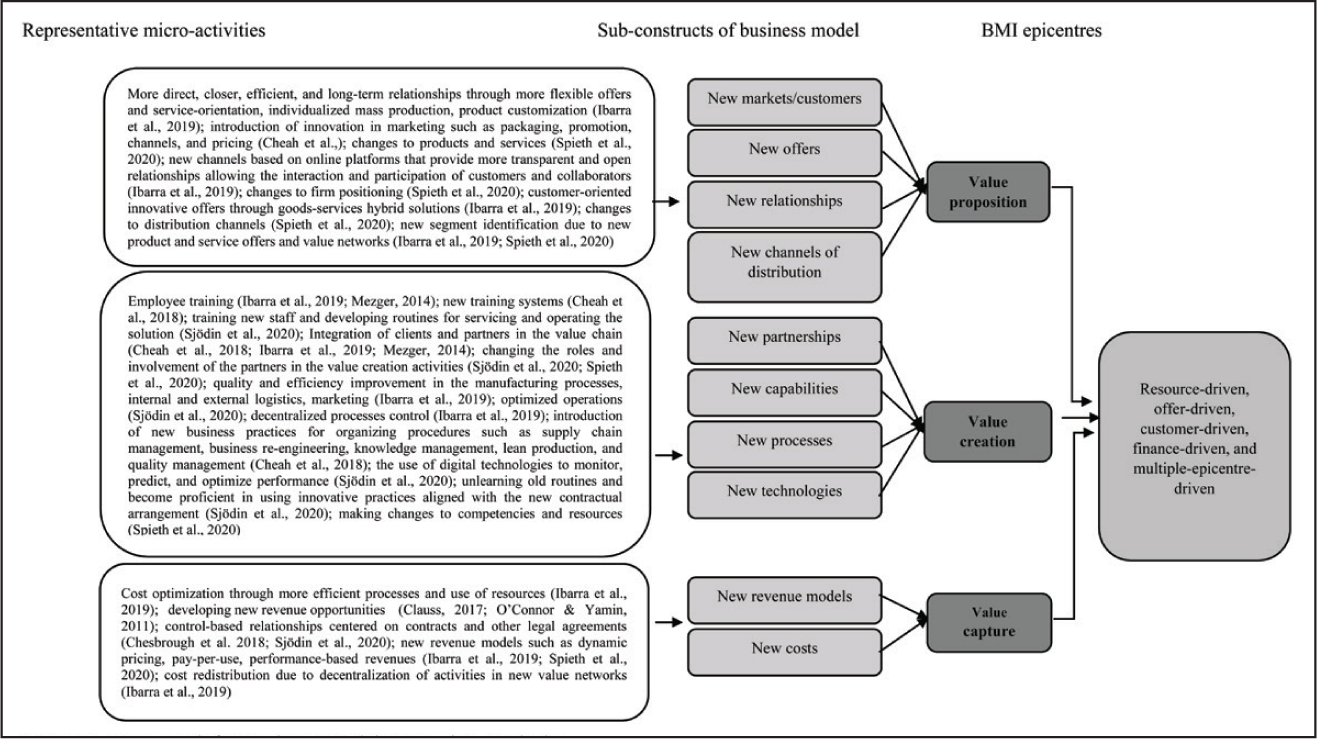
Yet, given the dominant focus on conceptualisation and description of BMI and especially, the degree of BMI with explanatory studies addressing antecedents and preconditions to BMI, insight is still lacking into what kind of micro-strategising actions are employed in adapting and developing business models to achieve sustained value creation by firms, as well as which activities facilitate such successful strategising (Achtenhagen et al., 2013; Baumgartner & Mangematin, 2019; Do Vale et al., 2021; Foss & Saebi, 2017). Therefore, this exploratory study is grounded on the strategy-as-practice perspective (Achtenhagen et al., 2013; Do Vale et al., 2021; Johnson et al., 2003) and follows the approach taken by the seminal work in business model literature (e.g., Morris et al., 2013) to present the analytical framework shown in Figure 1 theorising and guiding this exploratory study.
Framework for Business Model Innovation Analysis.
Business Model Innovation in Strategy-as-Practice Perspective
According to the dynamic capabilities view (Teece, 2007), the strategising of the business model is achieved through critical capabilities that create value for customers. Continuous development of new capabilities and enriching and reconfiguring existing capabilities are essential in highly uncertain environments. Thus, according to the strategy-as-practice perspective, these capabilities or the strategy and strategising in practice are made up of myriad, micro-activities that managers perform and manage in the day-to-day life of a firm in executing BMI (Achtenhagen et al., 2013; Johnson et al., 2003). An understanding of these micro-level strategic actions is needed for managers to reconfigure the business model effectively. It is because the primary task of a manager in reconfiguring a business model is to identify the similarities and differences among the existing configurations of business model components that enable identifying the ideal configuration leading to higher performance (Jang et al., 2020).
According to the strategy-as-practice approach, strategy is an activity and it ‘is not only an attribute of firms but also an activity undertaken by people’ (Carter et al., 2008, p. 86). The combination of ‘those actions, interactions, and negotiations of multiple actors and the situated practices that they draw upon in accomplishing that activity’ are known as strategising (Jarzabkowski et al., 2007, pp. 7–8). Practice indicates the actual activity, events, or work of strategy (Johnson et al., 2003). Thus, in research strategy-as-practice is ‘concerned with the doing of strategy; who does it, what they do, how they do it, what they use, and what implications this has for shaping strategy’ (Jarzabkowski & Paul Spee, 2009, p. 69).
Reconfiguration of Business Model
The reconfiguration of the three central business model components in BMI is grounded on micro-level activities executed by firms (see Figure 1). In BMI, firms will deploy these micro-level activities organised along the individual model components: value proposition, value creation, and value capturing (Baden-Fuller & Haefliger, 2013) to reconceive within new business frameworks delivering novel values and processes to resonate with market contexts and requirements (Zott & Huy, 2007).
The value proposition dimension of a business model indicates the solutions offered to customers and the mechanisms of how they are offered (Clauss, 2017; Morris et al., 2006). It comprises the sub-constructs of new markets/customers, new offers (products/services), new relationships, and new channels of distribution (Clauss, 2017). Firms try to enter new markets or redefine the current markets by looking for customers who are able and willing to pay for what they offer (Baden-Fuller & Haefliger, 2013) to solve their customers’ problems or satisfy their needs in new or better ways (Clauss, 2017). Firms attempt to deliver the promised value to customers through new channels such as combining online and offline channels, bricks-and-motor-star shops, and directly contacting customers. Customer relationships trigger business model changes by providing information about the market changes and needs (Chesbrough, 2007).
The value creation component explains the activities of value generation (Chesbrough, 2010) aimed at increasing the utility of a product to customers (Carvalho & Jonker, 2015). This dimension comprises new partnerships, new capabilities, new processes, and new technologies (Clauss, 2017). Relational rents that cannot be developed by an existing firm on its own are identified and exploited through new partnerships (Dyer & Singh, 1998). The processes, for instance, aimed at manufacturing flexibility, support the efficiency of the business model and novelty-centred business model designs (Wei et al., 2017). Technological developments such as the use of digital systems and platforms promote the introduction of innovative solutions (Sjödin et al., 2020).
Value capture is the difference between revenue and cost retained by the organisation (Carvalho & Jonker, 2015) and indicates the firm’s approach to secure profits from value creation and distribution of generated profits among participating actors (Chesbrough et al., 2018). These activities enable providers and customers to determine how the additional value created should be distributed between provider and customer (Sjödin et al., 2020), ensuring that a maximum portion of the value is captured or appropriated by the firm (Chesbrough et al., 2018; Clauss, 2017).
There are five approaches to changing a business model based on the focused epicentre of the model components: resource-driven (focused on key partners or existing resources); offer-driven (focused on value proposition); customer-driven (focused on new markets and segments); finance-driven (focused on cost structure and revenue model); and multiple-epicentre-driven (focused on key partnerships/existing resources, value proposition and customer segments) (Osterwalder & Pigneur, 2010). In employing these changes to innovate the business model, firms tend to adopt substantially varying strategies and ‘display a succinct number of configurations of strategies’ (Crum et al., 2020, p. 11). Yet, the dominant explanatory studies on the degree of BMI find that ‘radical BMI often happens across industry boundaries, an element that cannot be captured in the traditional classification of economic activity (Waldner et al., 2015, p. 24)’. This further confirms our argument in this study that studies on BMI in terms of ‘degree of innovation’ fail to uncover the micro-mechanisms underpinning BMI and the limitations of traditional dichotomous firm classifications. Further, despite studies measuring ‘the performance consequences of different degrees of [BMI], they have not investigated the consequences of particular types or patterns of such innovations, i.e., configurations of business model components’ (Waldner et al., 2015, p. 24).
Therefore, this study builds on the strategy-as-practice perspective to open the ‘black box’ of strategy and study the actual process and activities of strategising in BMI. To this end, a two-stage cluster analysis was employed on an exploratory research design where Figure 1 outlines the theoretical base and guides the analysis of this study. In doing so, this study argues that the output depends on the process and lens, on levels of analysis on the formulation and on the people involved in shaping the process (Baumgartner & Mangematin, 2019). This ‘close understanding of the myriad, micro-activities which make up strategy and strategising in practice’ (Johnson et al., 2003, p. 3) helps to grasp the actual strategic and organisational activities that facilitate the shaping, adapting, and renewing of business models (Achtenhagen et al., 2013).
Methodology
Sample
This research focused on garnering insights from management on the key activities involved in the BMI along the three dimensions within the Sri Lankan companies. Therefore, a random sample of managers was drawn from the registration database (as of February 2020) of the Institute of Management of Sri Lanka (IMSL) and the Sri Lanka Institute of Marketing (SLIM), the premier professional bodies in Sri Lanka in respective disciplines that are incorporated by acts of parliament. This study bases its empirical approach on innovation literature that emphasises the importance of management respondents in providing a sufficiently holistic view of the operational level of the organisation and the overall strategic direction set by senior executives (Sok et al., 2013; To et al., 2019). Therefore, survey data from 127 managerial-level employees (e.g., Marketing Managers, Production Managers, HR Managers, and Financial Managers) in Sri Lankan companies registered in the above database were used for this exploratory study.
Data Collection Instrument
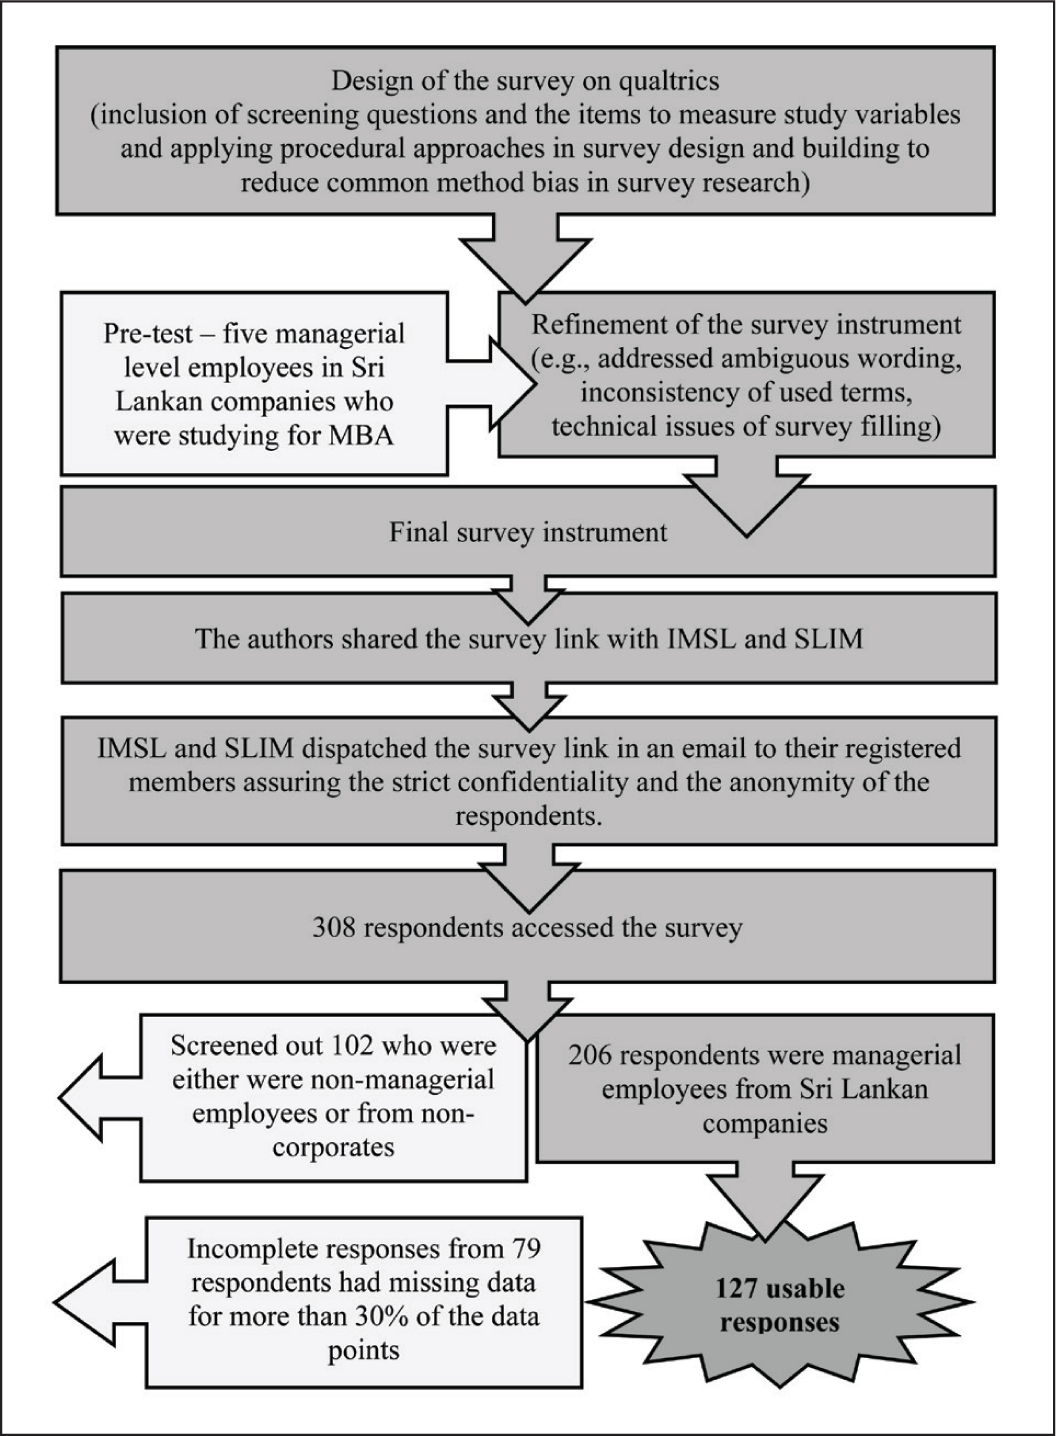
The data collection process is shown in Figure 2. The survey built on the Qualtrics survey platform (Eggers et al., 2013; Mehlhorn et al., 2015) included two screening questions and items measuring the key business model activities of Sri Lankan firms.
Data Collection Process.
Screening questions ensured the participation of managerial-level employees genuinely from Sri Lankan corporates, not from other organisations (e.g., Lepoutre et al., 2013). The first screening question asked, ‘what type of an organisation are you working for?’ with options of ‘non-governmental organisation, government department, public limited company, and private limited company’. The second screening question asked about the management level of responding employee’s position: ‘at what level of management do you operate in this organisation?’ with options of ‘C-Suite (i.e., CEO, CFO, COO, etc.), top/senior management, middle management, operations management, supervisory position and non-managerial’.
Procedural and statistical approaches were taken to reduce the Common Method Bias (CMB) of single respondent data as recommended by Podsakoff et al. (2003). Procedural approaches included the use of an ethics Participant Information Sheet following Human Research Ethics Committee guidelines and approval to clarify the study purpose (Jordan & Troth, 2020); measuring study variables using existing scales; ensuring low evaluation apprehension by respondents through maintaining respondents’ anonymity and confidentiality during the data collection; stripping the ambiguous and irrelevant terms in measurement items through a pre-test; and providing additional explanations for any vague terms (Podsakoff et al., 2003). Further, proximal separation was built into the items by mixing them among the major variables measured in the survey (Jordan & Troth, 2020; Podsakoff et al., 2003). Data integrity compromising issues potentially emanating from lower self-regulation of online survey methods were addressed by arranging Qualtrics survey settings to avoid multiple enrolments of respondents; being cautious about the length of the survey; increasing the variety of question formats to break the monotony; avoiding the use of questions that needed extensive recall, and providing respondents with adequate and clear instructions (Joinson, 1998).
Pre-test
A pre-test of the survey was conducted with the involvement of five managerial-level employees from Sri Lankan firms who were studying for a Master of Business Administration degree at the University of Peradeniya (de Vaus, 1995). They were asked to comment on any issues in filling out the survey, inconsistencies in terminology, and the relevancy and usability of the survey items. Feedback mainly included ambiguous wording, inconsistent use of terms, and technical issues related to filling out the survey. Authors jointly went through the whole survey, discussed the feed- back, and refined the survey items to ensure reliability (de Vaus, 1995; Judd et al., 1991; Malhotra & Grover, 1998), measurement, and construct validity (Lyon et al., 2000) of the measurement items.
Main Survey
The main data collection was carried out during the period from December 2019 to March 2020. Following the consent and approval from IMSL and SLIM to disseminate the survey among the registered members of those two institutions, the authors shared the survey link with IMSL and SLIM. Subsequently, IMSL and SLIM dispatched the survey link in an email to their registered members on behalf of the research team, assuring the strict confidentiality and anonymity of the respondents. Three hundred and eight respondents had accessed the survey, and out of them, 102 either were non-managerial employees or from non-corporates and hence, screened out. Another 79 responses had missing data for more than 30% of the data points and were hence treated as incompletes. Given that this missingness is ‘person-level’, unbiased missing data treatments available under systematic missingness such as ML and MI cannot be applied in the absence of observed values (Newman, 2014). This situation makes no available missing data techniques that can yield unbiased parameter estimates (Newman, 2014) and hence, removed from the data set. Therefore, only 127 responses were usable for further analysis of the study. Table 1 summarises the demographic profile of these respondents in the study.
Demographic Profile of the Respondents Their Affiliated Firms.
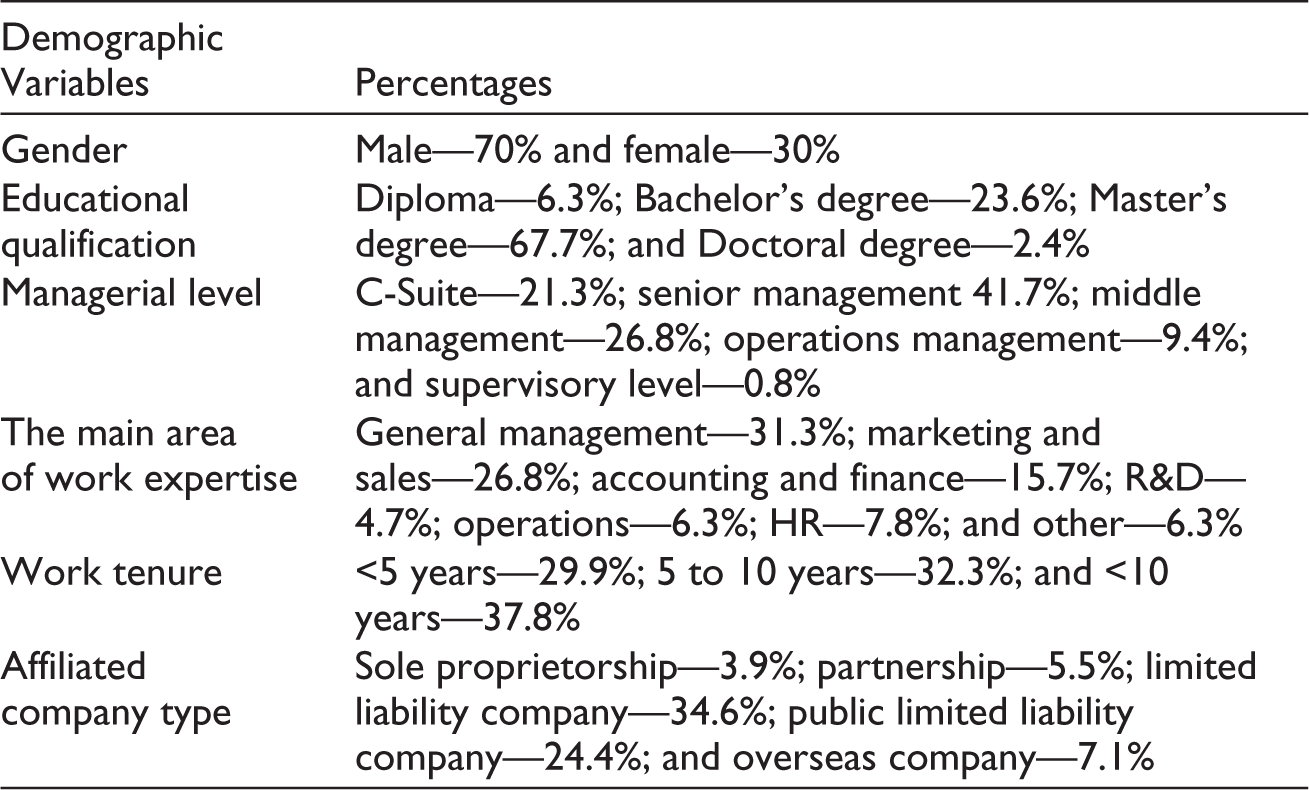
Accordingly, 70% of the respondents are male; approximately 68% hold a Master’s degree; approximately 42% are in the senior management levels; approximately 32% serve in general management-related areas, while another 27% work in marketing and sales-related positions; approximately 38% accounts for a working tenure of more than 10 years at the same company; and approximately 35% of their affiliated companies are Private Limited companies in Sri Lanka.
Measures
Following survey research methods (de Vaus, 1995) and BMI research in entrepreneurship and innovation (e.g., Pedersen et al., 2018; To et al., 2019), multiple item measures from existing scales were used to measure the BMI activities, performance (market effectiveness) and environmental uncertainty ensuring the measurement and construct validity (Lyon et al., 2000) and reliability (Judd et al., 1991; Malhotra & Grover, 1998). Items measuring value proposition, value creation, and value capture activities were sourced from Clauss (2017). Responses were provided on a 7-point Likert scale ranging from 1 = ‘strongly disagree’ to 7 = ‘strongly agree’, indicating the respondent’s subjective perception of the practice of value proposition, value creation, and value capture activities of the affiliated firm. Performance was measured based on the respondents’ subjective assessments of three dimensions: profitability, market effectiveness, and customer satisfaction by using items from Vorhies and Morgan (2005). For instance, in the case of market effectiveness, respondents were asked to rate their assessment of market share growth, growth in sales revenue, acquiring new customers, and increasing sales to existing customers relative to their major competitors. The stem of the question was as follows: ‘please evaluate the performance of your business over the past year relative to your major competitors’. Environmental uncertainty was measured by adapting the items from Miller and Dröge (1986). With the question stem of ‘in your major industry in Sri Lanka’, examples for measurement items on this include ‘speed of technological change is very high’ and ‘consumer demographics are changing fast’. Cronbach α test (Malhotra & Grover, 1998) indicated strong reliability levels for value proposition activities (α = 0.94), value creation activities (α = 0.94), value capture activities (α = 0.90), customer satisfaction (α = 0.83), market effectiveness (α = 0.91), profitability (α = 0.95), and environmental uncertainty (α = 0.71). Value capture item, REV4: ‘dependence on the durability of existing revenue sources’ was removed from the analysis due to being lower than 0.4 in its individual item correlation (Hinkin, 2005). As a preliminary analysis, CMB was tested using Harman’s single-factor test (Jordan & Troth, 2020; Podsakoff et al., 2012), where the first factor explained only 39% of the variance, which is below the threshold level of 50% (Hinkin, 2005).
Cluster Analysis
Cluster analysis has strong traditions in entrepreneurship and small business research (Avlonitis & Salavou, 2007; Chevalier et al., 2018; Lado et al., 2013; McMahon, 2001). Thus, in a two-stage cluster analysis process to identify BMI patterns in data (Wennberg & Anderson, 2020), a hierarchical cluster analysis with Ward’s method and Squared Euclidean Distance measures initially determined the appropriate number of clusters (Meyers et al., 2016) followed by forming and validating clusters using the k-means clustering technique. To identify the possible configurations of the BMI, empirical observations were grouped into a restricted number of homogenous clusters through a set of clustering variables which is an observation-centred approach (Hair et al., 2010; Khelil, 2016). To this end, the K-Means cluster analysis with the Quick Cluster routine was used to cluster the data as it generates clear and distinct clusters (Avlonitis & Gounaris, 1999). To assure the meaningfulness of clusters, reliability, and validity were evaluated (Avlonitis & Salavou, 2007). Defining and labelling the obtained clusters involved examining the clustering variables’ average values. To obtain an overall description of the emerged clusters, aggregate indicators for each descriptive variable were created in addition to analysing separately the scores of their respective items to obtain a more detailed description (Khelil, 2016).
Analysis
Cluster Identification
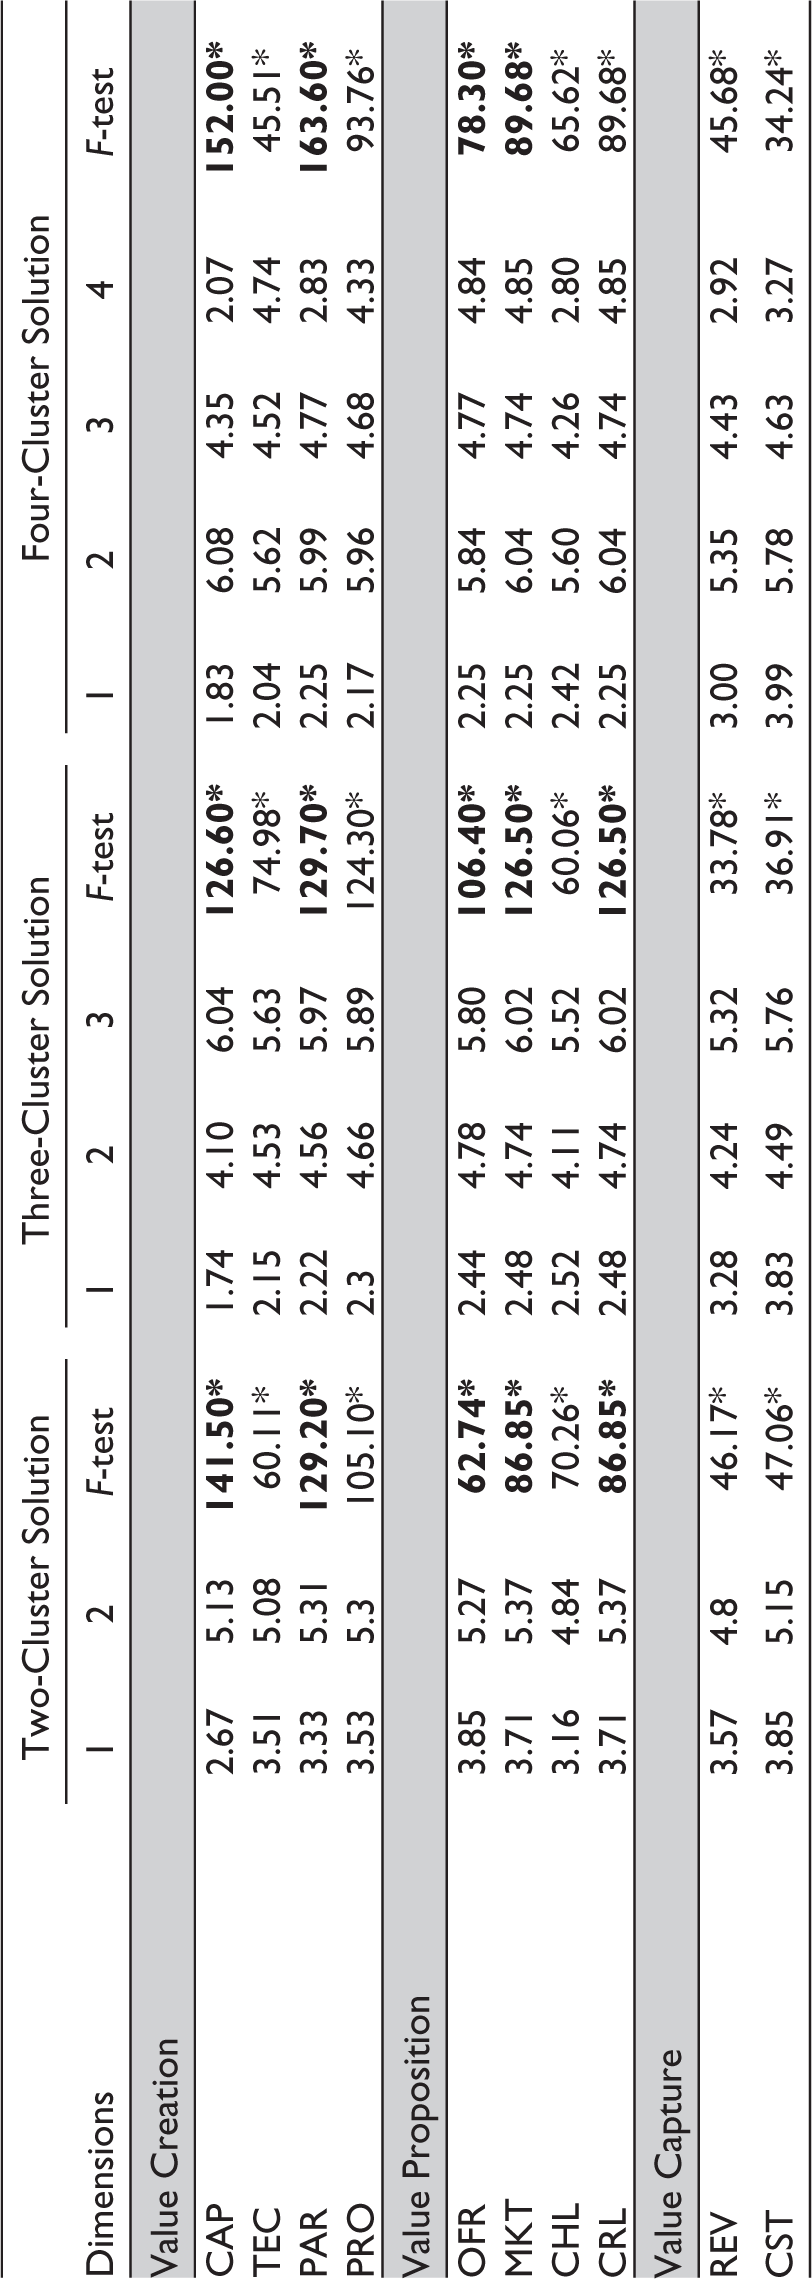
The agglomeration schedule confirmed that the biggest coefficients gap occurred at stage 124, indicating that a three-cluster solution (number of cases–biggest jump stage) will be appropriate for this sample (Hair et al., 1998). To increase the rigor of the analysis, two-cluster solution followed by three-cluster and four-cluster solutions were generated, and the final cluster centres were examined (see Table 1). Considering the maximum external isolation, internal cohesion, and parsimony of explanation (Klastorin, 1983), the three-cluster solution was deemed the most acceptable. All the clusters derived under each solution are statistically and significantly different (F-test; Table 1). However, when moving from a two-cluster solution to a four-cluster solution, it can be observed that new technology, new processes, new markets, new offers, new channels, new relationships, new revenue models, and value cost structures tend to hold a low deterministic role (smaller F-test values) on forming clusters indicating the less variance among the firm approaches in these sub-constructs. New capabilities and new partnership-related activities have been consistently predominant determinants of cluster formation as indicated by the significantly large F-test values (see Table 1).
Cluster Validation
The post-hoc test with Analysis of Variance (ANOVA) was performed to validate the cluster solutions (see Appendix A). Given that there were fewer than three groups for the two-cluster solution, post-hoc tests were not possible to generate and thus, proceeded with three-cluster solution and four-cluster solutions.
The post-hoc test for four-cluster solution confirmed that it is not a stable and consistent solution given that there was no significant difference between Clusters 1 and 4 for new capabilities (ΔX̅ = –0.24, p > .05); Clusters 3 and 4 for new technology (ΔX̅ = –0.22, p > .05); Clusters 1 and 4 for new partnerships (ΔX̅ = –0.58, p > .05); Clusters 3 and 4 for new processes (ΔX̅ = 0.35, p > .05); Clusters 3 and 4 for new offerings (ΔX̅ = 0.073, p > .05); Clusters 3 and 4 for new customer relationships (ΔX̅ = –0.10 p > .05); Clusters 1 and 4 for new channels (ΔX̅ = –0.39, p > .05); Clusters 3 and 4 for new customers and markets (ΔX̅ = –0.10, p > .05); Clusters 1 and 4 for new revenue models (ΔX̅ = –0.08, p > .05); Clusters 1 and 3 for value cost structures (ΔX̅ = –0.64, p > .05); and Clusters 1 and 4 for value cost structures (ΔX̅ = 0.72, p > .05). With this confirmation, looking back at Table 2, it can be seen that new offers (OFR), new customers and markets (MKT), and new customer relationships (CRL) are the major determinants of Cluster 3 as confirmed by the larger F-values.
Summary of Final Cluster Centres and ANOVA Test Results.
Reliability and Validity of Clusters
The sample was randomly split into two halves to evaluate the reliability and validity, following Hambrick (1983) and Avlonitis and Gounaris (1999). One portion comprised 63 responses and the other with 64 responses and analysed them independently. The agglomeration schedule for the first half of the data set indicated the biggest coefficients gap occurred at stage 60, while for the second half of the data set, it was at stage 61, indicating that the appropriate number of clusters for this sample is 3, which is consistent across the two random samples confirming the reliability of the clusters (Hair et al., 1998). Therefore, the three-cluster solution is found to be more consistent and hence, considered for further analysis.
A closer examination of the three-cluster solution indicates that new processes, new offerings, new customer relationships, and new markets are the primary determinants of cluster formation, given their significantly large F-values (see Table 2). Criterion-related validity was assessed by performing a one-way ANOVA test relating cluster membership to external variables, which are theoretically related to the clusters, but not used in defining them (Ketchen & Shook, 1996). To this end, firm performance in terms of market effectiveness and environmental uncertainty were tested, and the results are summarised in Table 3.
One-Way ANOVA Test for Assessing Criterion-Related Validity.
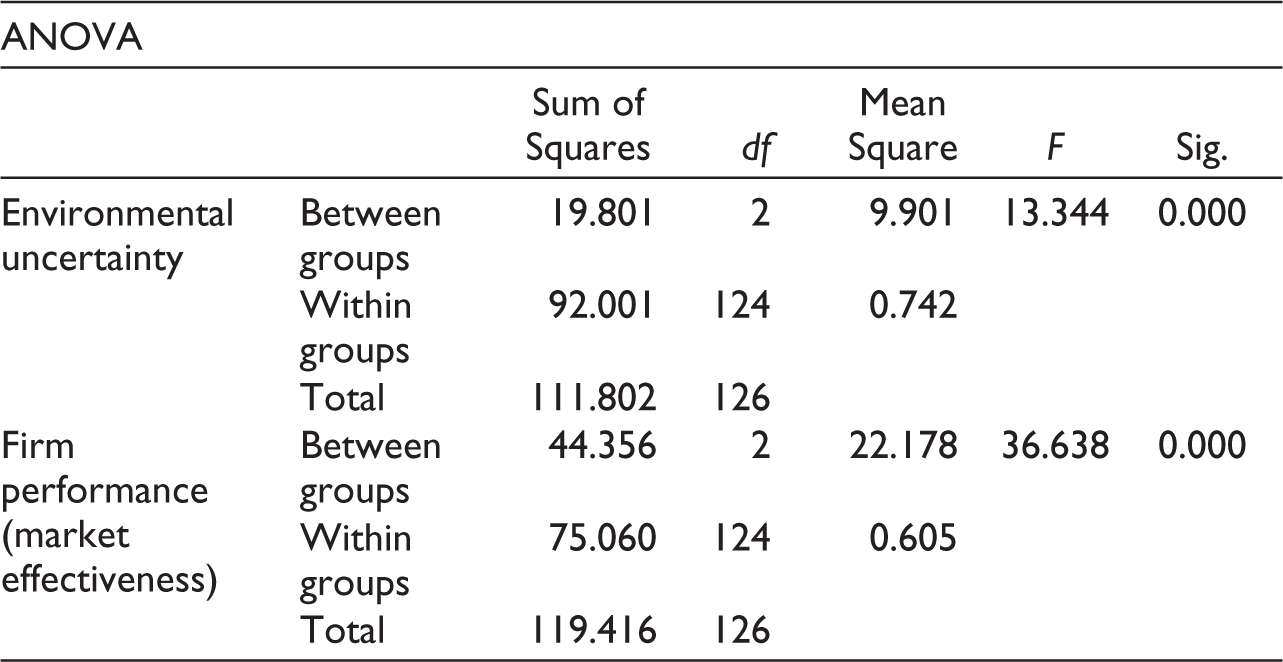
The statistically significant F-statistic of the non-clustering variables confirms the validity of this three-cluster solution (environmental uncertainty: F = 13.44, p < .000; business performance: F = 36.64, p < .000).
Characteristics of the Emerged Clusters
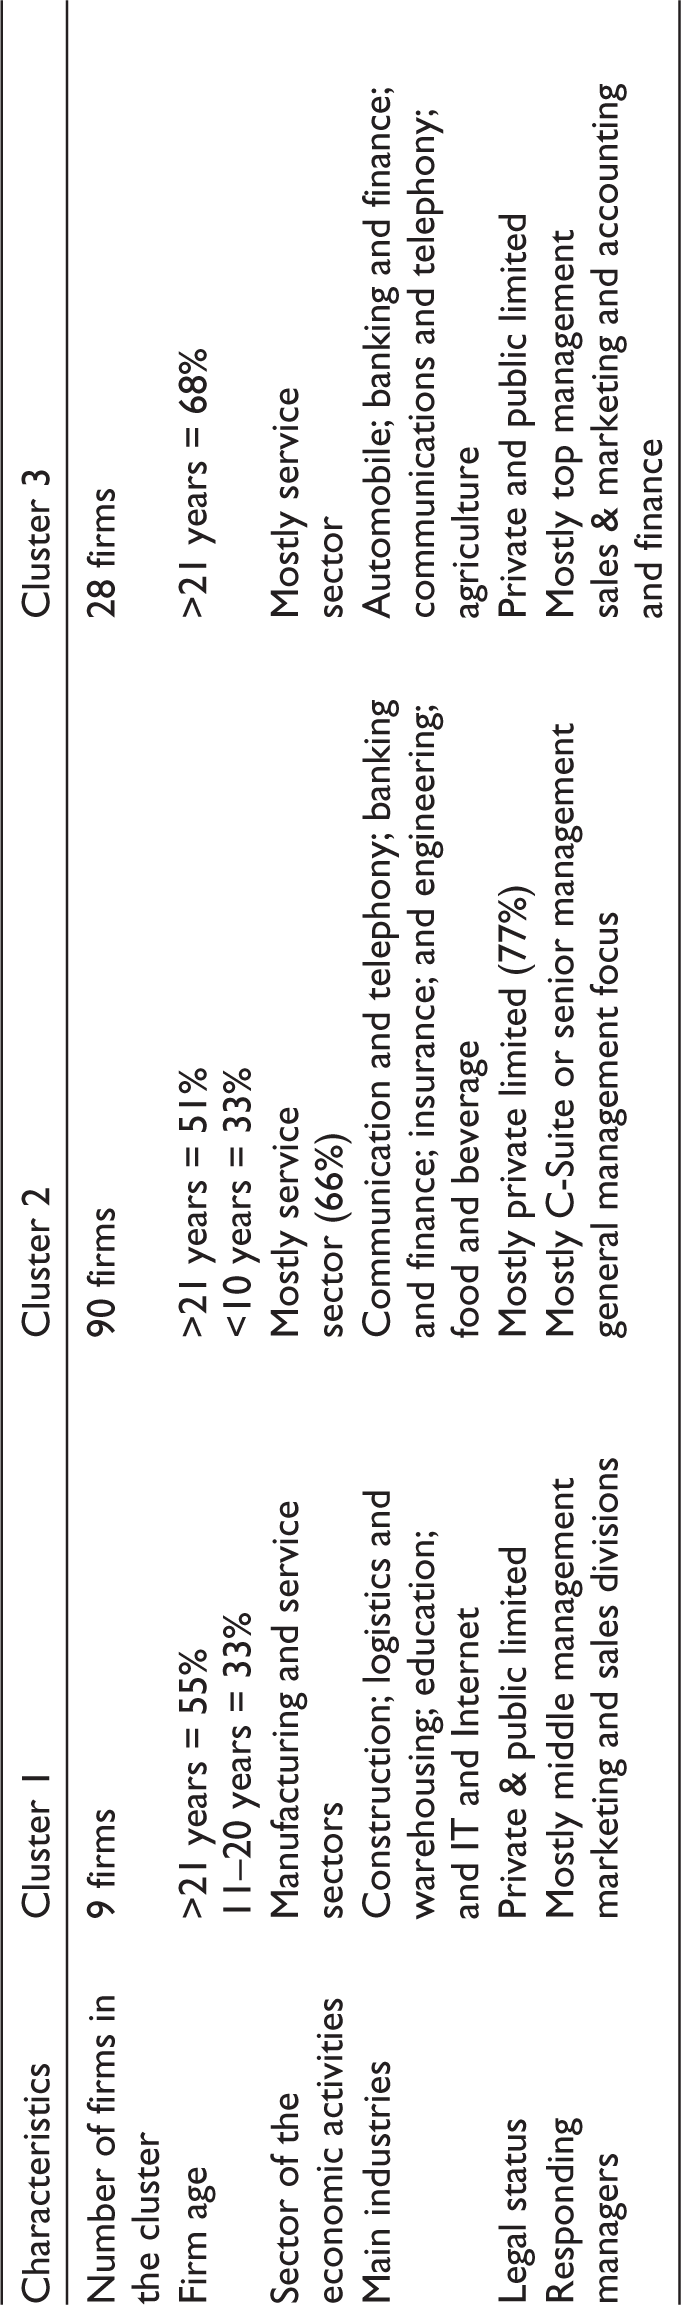
The sectors of the economic activities of the studied sample showed a significant diversity, and thus, the below cluster demographics include industry/service sector, firm age, the legal status of the firms, managerial-level, and area of work of the responding managerial-level employees (see Table 4).
Demographic Profile of Clusters.
The detailed micro-activities of each business model sub-construct as shown in Figure 1 are presented in Table 5.
BMI activities of Cluster 1 mainly focus on value capture with a higher focus on CST dimension. The top three focuses in BMI sub- constructs include REV, CST, and CRL. CST1: price-quantity strategy (X̅ = 4.78), CST2: attempts to save manufacturing costs (X̅ = 3.91), and CST3: alignment of production costs with market prices (X̅ = 3.42) are the primary activities in their approach to BMI (Table 4). Thus, Cluster 1 firms are labelled ‘finance-driven’ firms (Osterwalder & Pigneur, 2010) because of their higher emphasis on CST1, CST2, and CST3. While offers and markets are not particularly strong concerns of these firms, a focus on CRL and CHL and improving operating efficiency are being emphasised to some extent by Cluster 1 firms (TEC1, TEC2 and PAR4) perhaps as a response to their low overall performance level.
With 90 firms, Cluster 2 includes Regarding BMI activities, Cluster 2 mainly focuses on value proposition with the highest focus on customer relationships. New markets (MKT) and new offers (OFR) are the next in the order of focus of this cluster (see Table 5). OFR1: regularly addressing new, unmet customer needs (X̅ = 5.16), CRL1: new service offerings that are targeting customer retention (X̅ = 5.05), and MKT3: the constant search for new customer segments and markets (X̅ = 5.03) have been the three primary activities in this cluster. Thus, Cluster 2 firms are labelled ‘offer and customer-driven’ firms (Osterwalder & Pigneur, 2010), given their strong emphasis on new offers (OFR), new markets (MKT), and new customer relationships (CRL). Cluster 3 scores high on all three main dimensions, this cluster is mainly driven by value creation and value proposition with a higher focus on new customer relationships, new capabilities, and new markets. Considering the value proposition dimension, customer relationship-focused activities of CRL1: New service offerings targeting customer retention (X̅ = 6.20), CRL2: Innovative/modern actions to increase customer retention (X̅ = 6.23), and CRL3: Taking actions to strengthen customer relationships (X̅ = 6.33) have become the main activities resembling both offer and customer-driven approaches. Regarding the value creation dimension, CAP1: Employee training (X̅ = 6.23), PAR3: Evaluating the benefits of outsourcing (X̅ = 6.23), and PRO1: Ability to improve internal processes (X̅ = 6.15) are the key activities these firms have focused on mainly indicating a resource-driven approach. Therefore, Cluster 3 firms are labelled ‘multiple-epicentre-driven’ firms (Osterwalder & Pigneur, 2010), given their strong emphasis on retaining customers.
Micro-Activities Related to Sub-Constructs of the BMI Dimensions and One-Way ANOVA Test.
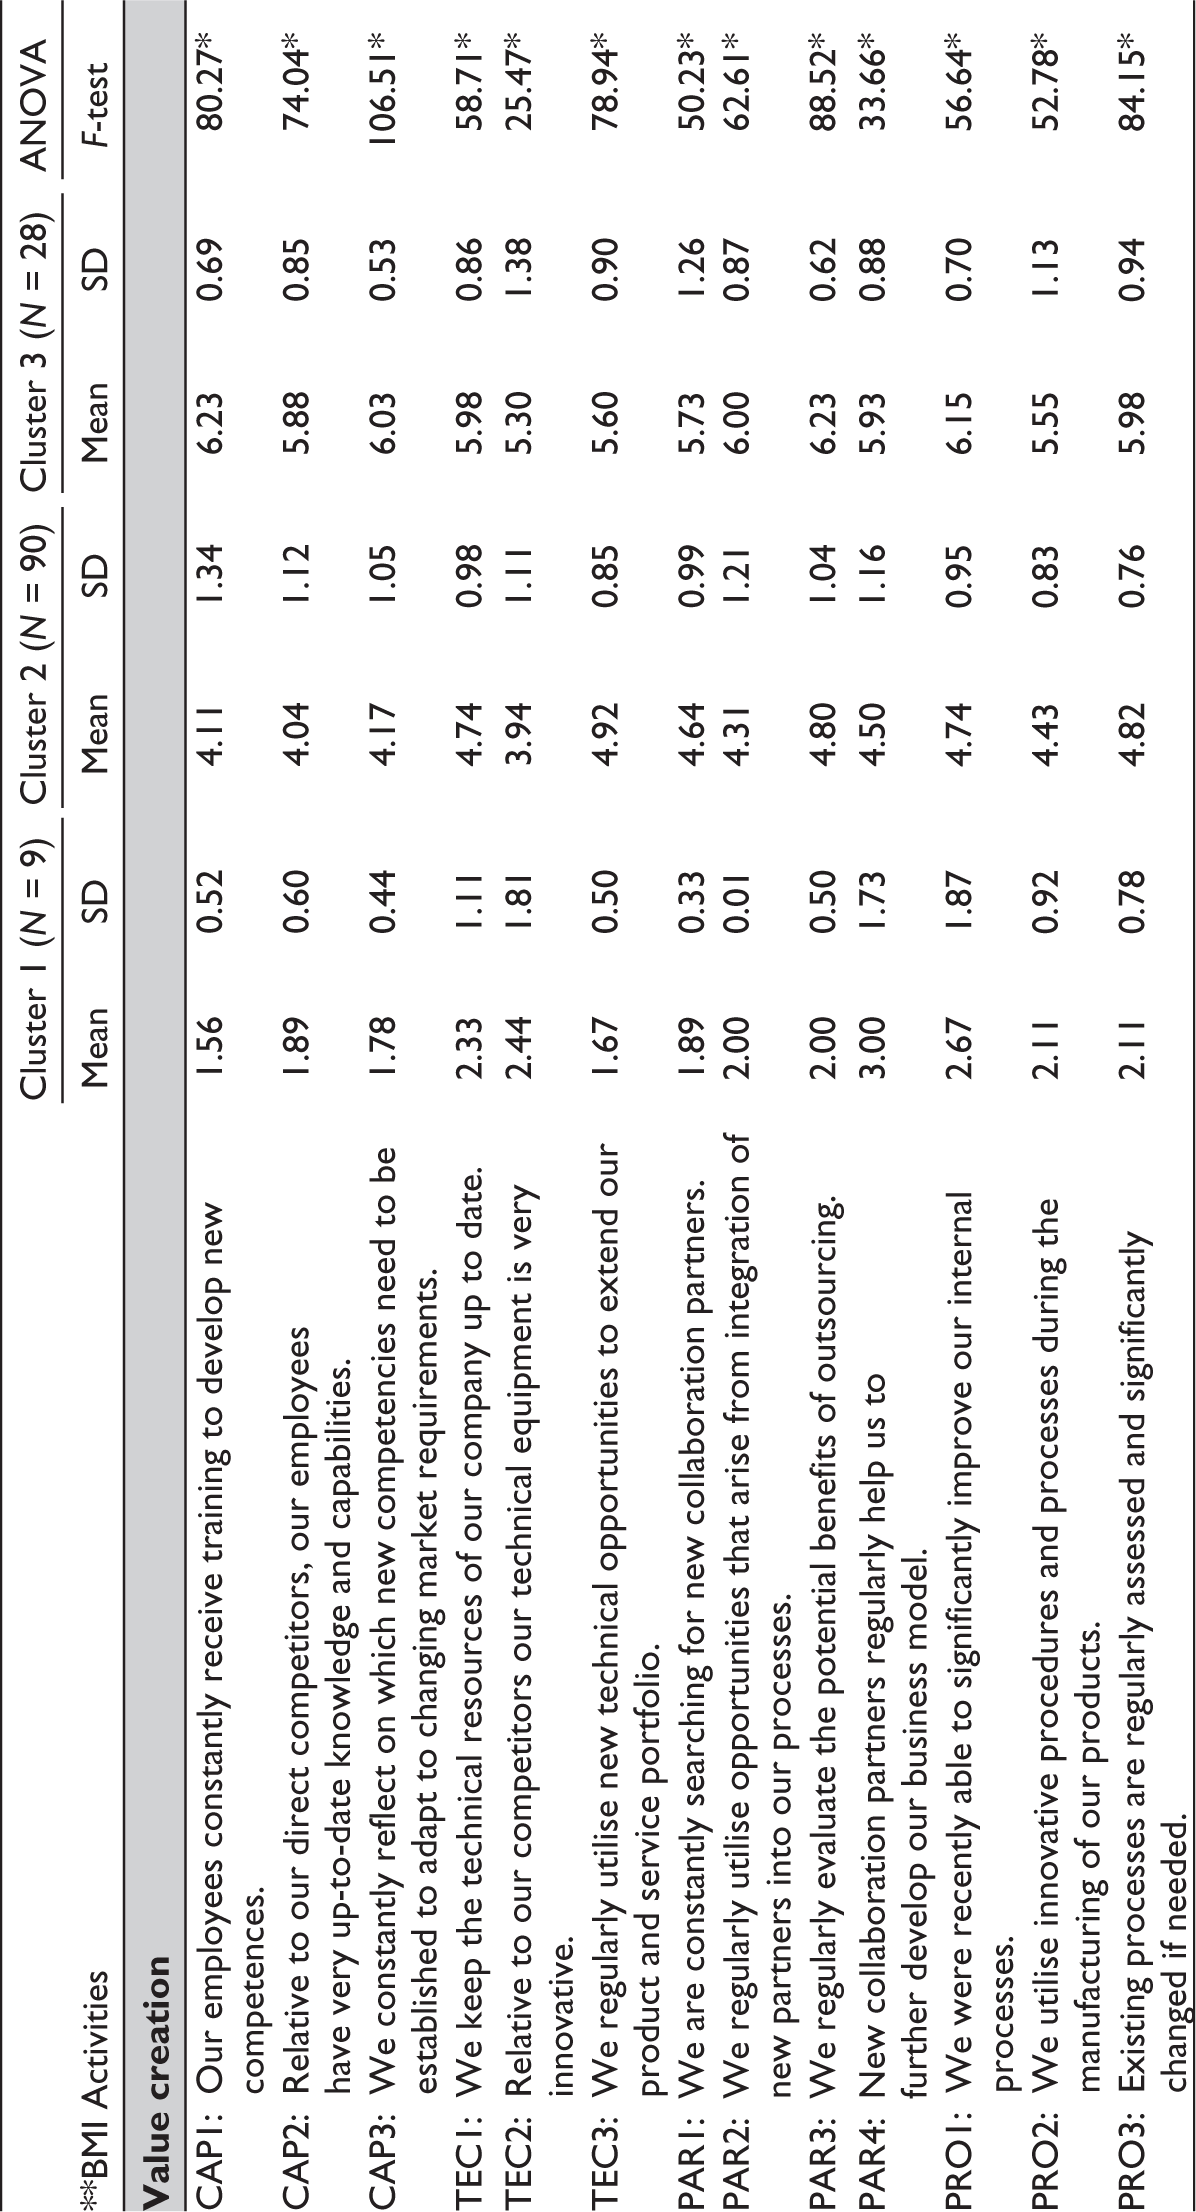
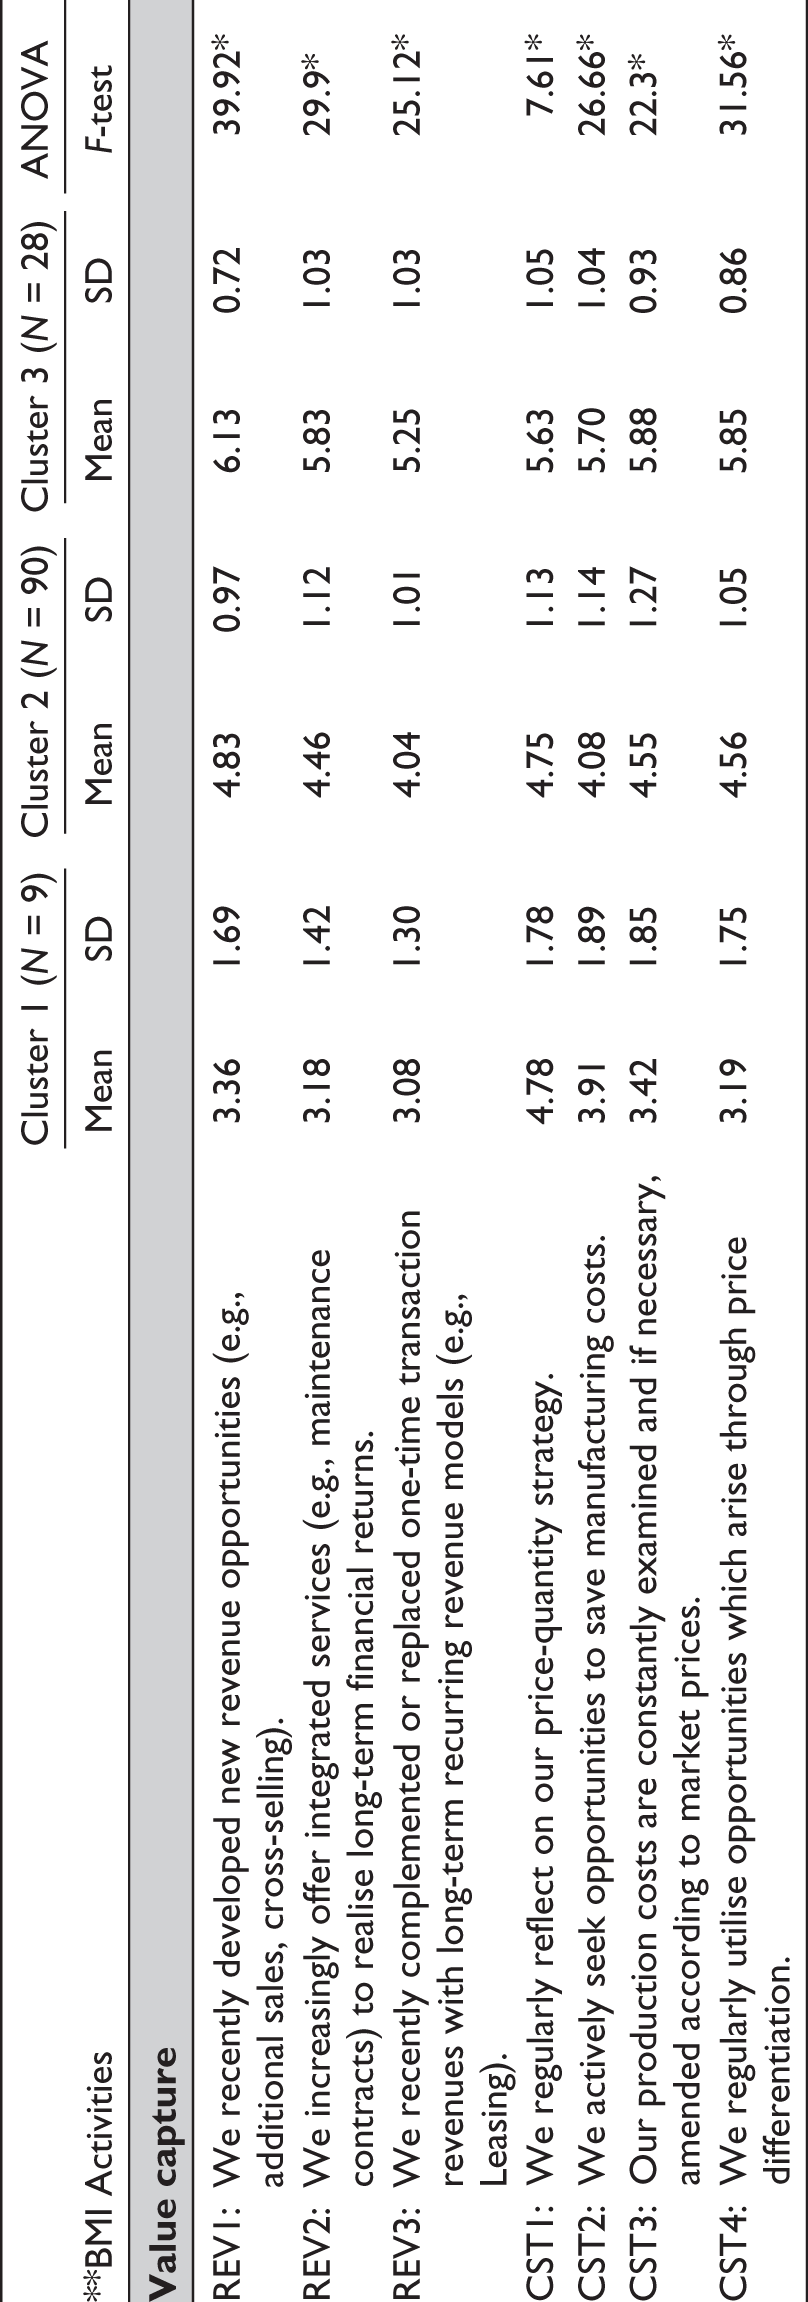
Notes: *p < .000
**Please note that the full statements of the listed BMI activities are included in Appendix C. A shorten statement is used here for space management purpose.
If, X̅ = <3 = ‘low’
If, 3 < X̅ > 5 = ‘medium’
If, X̅ > = 5 = ‘high’
Performance Differences of the Emerged Clusters
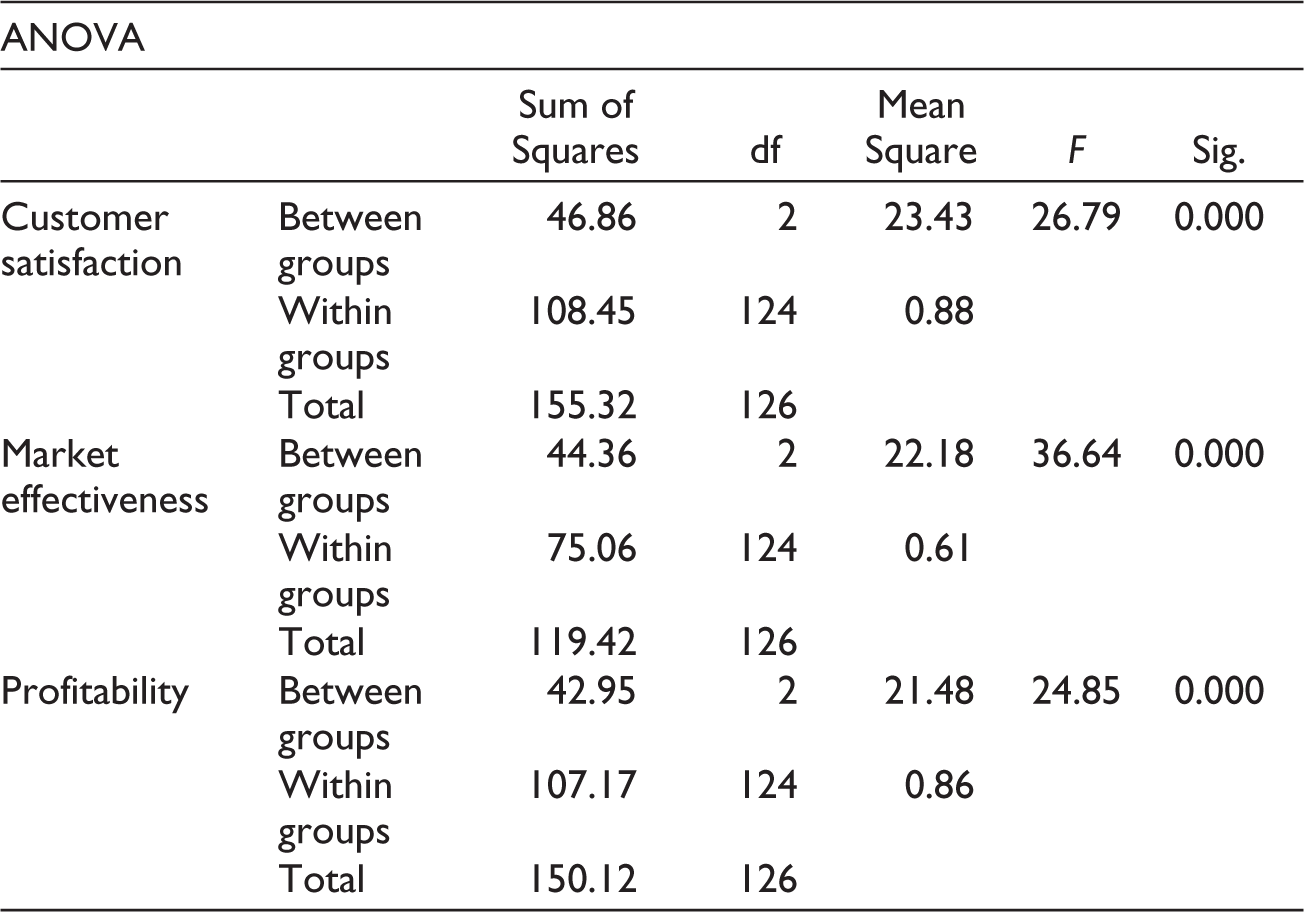
The above analysis indicates the possibility of significant differences in the performance levels among the three clusters. The performance differences were drawn in a multiple bar graph (Figure 3) and verified in a post-hoc test of ANOVA (Table 6) to shed some light on potential links between different business model configurations and performance heterogeneity.
One-Way ANOVA Test for Differences in Performance Dimensions Among Groups.
Performance Differences Among the Three Clusters.
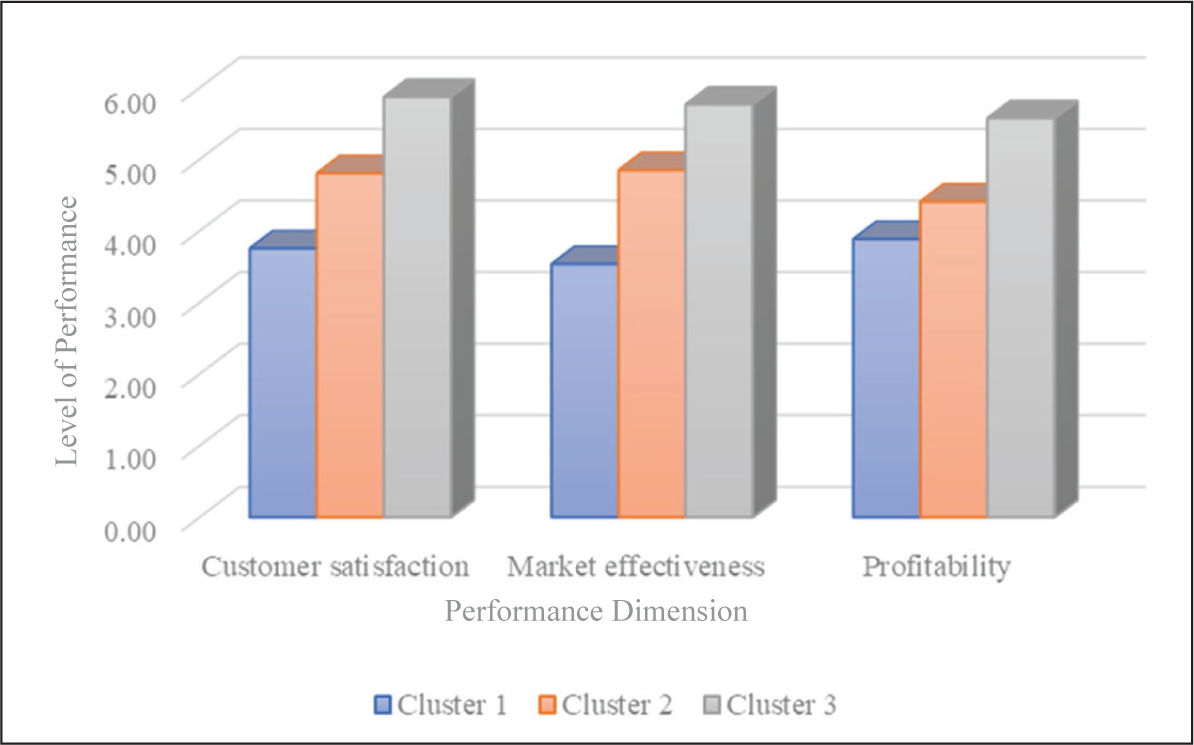
While Clusters 1 and 2 score medium level, Cluster 3, as the highest performing group, scores high on all the three dimensions of firm performance (see Figure 3). Further, finance-driven Cluster 1 scores its highest on profitability (X̅ = 3.89) dimension while offer and customer-driven Cluster 2 achieves its highest on market effectiveness (X̅ = 4.85). Multiple epicentre-driven Cluster 3 with both value creation and value proposition emphasis achieves its highest on customer satisfaction dimension (X̅ = 5.88). The one-way ANOVA confirmed that all three performance dimensions are significantly different among the three groups (Table 6). Post-hoc test for multiple comparisons of performance differences further confirmed that all other comparisons are significantly different except for Clusters 1 and 2 on profitability dimension (see Appendix B).
Discussion
Identification of BMI clusters in the Sri Lankan companies was achieved based on a two-stage rigorous hierarchical cluster analysis. The results of this rigorous process uncovered the presence of three different forms of BMI micro-practices among Sri Lankan firms: finance-driven, offer and customer-driven, and multiple-epicentre-driven. Further, new offerings, new customer relationships, and new markets become the primary business model constructs of distinguishing these BMI forms. Moreover, statistical analysis indicated that the strategy patterns chosen by each BMI form of firms appear to have created significant performance differences.
Forms of Micro-Activities in BMI and Key Differentiators
While Cluster 1 predominantly focuses on micro-activities related to value cost structures and new revenue models (finance-driven approach), Cluster 2 focuses mainly on new offers, new customers and markets, and new customer relationships (offer and customer-driven approach). Micro-activities of new capabilities, new customers, new markets, and new customer relationships (multiple-epicentre-driven approach) are the dominant focus areas of the best-performing Cluster 3. This means that Cluster 1 mainly concentrates on the viability (value capture) of the business model while Cluster 2 emphasises the desirability (value proposition) of the business model. Both desirability (value proposition) and feasibility (value creation) have become the focal points of BMI in Cluster 3. The higher focus on value capture strategies by Cluster 1 indicates that this is a more traditional group of enterprises (Osterwalder & Pigneur, 2010) while the other two clusters take a more disruptive approach to BMI by focusing on activities related to multiple components of the business model. Hence, this exploratory analysis of ten business model sub-constructs organised along the three widely accepted BMI dimensions from a micro-strategising lens enriches our understanding of BMI by empirically confirming the fact that firms weigh business model components differently in BMI. This is an empirical validation of the assertions made by Jang et al. (2020) and Rayna and Striukova (2016).
This variation among the clusters may have emerged due to the differences in the demographic profiles of the firms. For instance, the level of competition, industry structure, and life cycle stage of the industry may create differences in the way firms pursue BMI (Waldner et al., 2015). A closer examination indicated that to a significant extent, the forms of micro-activities identified by this study are unique to those firms depending on the sector and the industry of the firm’s economic activity (see Table 4). Cluster 1 firms are predominantly in manufacturing and service-related industries, while Clusters 2 and 3 are mainly in the service industries. An explanation for this is that the start-ups in emergent industries may exploit potential opportunities by experimenting with their business models during the very early stages of the businesses (Winter & Szulanski, 2001) while for the firms in the mature industries BMI becomes a necessity (Sabatier et al., 2012). For instance, the financial, insurance, telecommunication, banking, and finance sectors in the Sri Lankan economy have been able to record sustained growth during the last 5 years (Central Bank of Sri Lanka, 2020, 2021) while transportation and warehousing activities grew at a slower rate (Central Bank of Sri Lanka, 2019). Hence, contributing to the strategy-as-practice perspective (Mason & Spring, 2011) of BMI, this study confirms that BMI is an evolutionary and emergent process rather than static and planned. Therefore, a valuable path might be to study the contingency effect. A dependency analysis might reveal industry conditions leading to these different forms of micro-activities in BMI. Such research effort will shed more light on contingent performance implications, reveal differences among various industry sectors, and offer additional managerial insights into the successful implementation of effective configurations.
Moreover, although firm age has been a key variable distinguishing firm behaviour in entrepreneurship and BMI research (e.g., Bouncken & Fredrich, 2016; Coad et al., 2016; Latifi et al., 2021), this study finds no considerable difference in terms of the micro-activities underpinning BMI of firms. Besides, the varying degree of importance of the business model dimensions within the different forms may stem from the variation in the managerial-level attitudes and understanding of a wide range of BMI-related activities. Table 3 indicates that the respondents’ managerial-level and work areas vary across the clusters. Manager acceptance of BMI is a key factor affecting the success of the BMI process (Spieth et al., 2020). The involvement of managers in the BMI is heterogeneous and what managers implement in BMI is what they believe in which subsequently influences the design of the business model (Do Vale et al., 2021). Thus, future research underpinned by Upper Echelon theory (Hambrick & Mason, 1984) to question if BMI emerges in the upper echelons or lower levels of the managerial hierarchy in organisations will be a promising area to consider as such ‘research questions are not currently being systematically posed, addressed, and answered, reflecting the emergent nature of BMI research’ (Foss & Saebi, 2017, p. 201).
New offerings, new customer relationships, new customers, and markets are the primary BMI discriminators among these constellations of firms. This indicates that the BMI forms in the study context are determined by the micro-activities associated with the firm’s value proposition that is the foundation of a business model (Morioka et al., 2017). Although value proposition is considered a key component of a business model (e.g., Clauss, 2017; Morris et al., 2013), BMI literature pays relatively little attention to the value proposition dimension as much of the focus has been on value creation and value capture (e.g., Åström et al., 2022; Bouncken & Fredrich, 2016; Sjödin et al., 2020). Therefore, this study confirms the central role played by value proposition-oriented micro-practices in BMI. However, the customer relationships sub-construct has been a common focus across the three clusters despite the varying degrees of emphasis placed on the overall approach to BMI by firms. This may have resulted from the higher degree of customer interaction involved in service business models (see Table 4) in comparison to product business models and thus, might be particularly dependent on customer perception (Clauss et al., 2019). Further, Bottom of the Pyramid (BOP) markets literature points out that the firms in such markets tend to invest mainly in customer relationships and seek more payoffs by combining it with extended offers, that is, ‘increasing the share of wallet’ which is a move from standardised utilitarian product to a customised and aspirational product (Gebauer et al., 2017). Hence, this study suggests that the reality of firm approaches is different from the traditional business strategy conceptualisations such as incumbent vs. front runners (e.g., Sund et al., 2021) and old firms vs. young firms. Hence, an important implication for business strategy researchers is the need for acknowledging that those firm approaches go beyond the dichotomous classifications and analyse BMI approaches through more fine-grained empirical cases.
Performance Differences in BMI Forms
Study findings further uncovered that these three different forms of BMI create statistically significant performance differences. Cluster 1 takes a finance-driven approach and becomes the least performer across the groups. Yet, within Cluster 1, these firms achieve their highest in profitability dimension of firm performance. An explanation for this is that when a firm’s cost of production and the price of the goods or services is lower than the customer’s willingness to pay in a BOP setting, firms can make profits (Howell et al., 2018). The prioritised micro-level activities of this cluster included a price-quantity strategy, attempts to save manufacturing costs, and maintaining alignment of production costs with market prices (see Table 5). These approaches resonate well with von Carlowitz’s (2020) suggestion which makes an important managerial implication for Sri Lankan firms. That is to capture value at BOP despite low price levels, the key iss to find out how to cut costs across all the value-generation activities of the business model or to find out cost- efficient ways of doing business. Moreover, these firms indicate relatively a higher emphasis on channels of distribution. Thus, perhaps they have set them up as ‘isolating mechanisms’ to enhance value capture (Lepak et al., 2007) and created ‘barriers’ to the harsh competition, subsequently leading to positive firm performance outcomes (Aspara & Tikkanen, 2013). Further, the use of new channels of distribution and adopting new partnering models may have helped them create additional access to resources to rapidly scale up when new opportunities arise (Giesen et al., 2007). It also appears that Cluster 1 firms tend to operate on a logic of protecting existing markets and revenue generation as a reaction to perceived cost constraints (Schaltegger et al., 2011). Given the emphasis on channels of distribution, these firms may have adopted the strategies such as bundling and unbundling services and products, or servitisation (Heij et al., 2014) which subsequently can increase revenues.
Cluster 2 takes a mix of offer and customer-driven approaches compared to the other two forms and this is consistent across the three performance dimensions (see Table 5). This is a unique behaviour indicating that firms tend to adapt multiple combinations of micro-level activities across the business model components in innovating their business models. Considering individual constructs of BMI, these firms report their highest in customer relationships while their technological use for product development is relatively higher. Especially in emerging market settings, IT-based technologies and approaches to reduce transaction costs play a significant role in the diffusion of innovations (Howell et al., 2018). Further, according to Rachinger et al. (2019, p. 1145), ‘value proposition, internal infrastructure management, and customer relationships are mainly influenced by digitalization’, and thus, digital methods may improve benefits to customers. This may have been the case behind Cluster 2 in achieving its highest on market effectiveness dimension of performance in both among clusters and within-cluster analyses.
The highest-performing Cluster 3 takes a multiple-epicentre-driven approach and excels in all three dimensions of firm performance. This cluster tends to focus more on value proposition and value creation than value capture which is a finding that supports Aspara and Tikkanen (2013), who find that the firms with a high emphasis on novel value creation but low on value capture have the highest average profitable growth. Especially, micro-level activities underpinning BMI in Cluster 3 relatively have a stronger focus on capabilities, partnerships, processes, and customer relationships. Collaborations and partnerships among stakeholders in the industry are essential to delivering sustainability (Bocken & Geradts, 2020). These firms may attempt to exploit existing core markets (i.e., exploitative innovation) by developing operational efficiency in selected value-creation activities (e.g., Gebauer et al., 2017) using organisational processes and capabilities. This supports the findings by Latifi et al. (2021) who confirmed that efficiency-focused BMI has a significant impact on a firm’s overall performance which is an assertion made by Zott and Huy (2007). The higher the efficiency of a firm’s operations, the better, faster, and cheaper services can be delivered to customers (Latifi et al., 2021). This is analogous to the ‘open innovation’ strategy, which emphasises value creation while minimising the dependence on isolating mechanisms to value capture (Chesbrough, 2006). Thus, the approach of Cluster 3 supports the fact that the success of sustainable enterprise efforts depends on the deployment of complementary activities and facilitating infrastructure (Schaltegger et al., 2011). Thus, Clusters 2 and 3 being service-oriented constellations with a focus on desirability and feasibility elements of the business model make an important managerial implication for Sri Lankan firms taking the Cluster 1 approach. That is, a move from manufacturing to service-focused strategies requires building additional and valuable capabilities for the firm, reshaping value channels, and a revisit to business model foundations. Moreover, given the cost constraints, Sri Lankan firms taking the Cluster 1 approach may still defend their markets and achieve competitive advantage through organisational change processes such as servitisation to make new revenue streams using their traditional goods and service provision.
In addition, the focus on value proposition-based customer relationships by Cluster 3 may be because of the higher concentration of service-oriented firms where relationship selling (Drollinger & Comer, 2013; Jolson, 1997) and value-based selling are key approaches to value creation (Kindström et al., 2015). It further implies that Cluster 3 practices modern marketing concepts at the individual level to foster long-term relationships with customers (Anderson, 1996) based on customer-driven value creation (Jolson, 1997). These may have paved the way for achieving its highest on customer satisfaction dimension which includes customer retention as an item. Customer retention is the central gauge for measuring how well a company creates value for its customers (Reichheld, 1996). Therefore, the behaviour of Cluster 3 has important implications for practice and research. Cluster 3 firms tend to prioritise their focus on value creation and value proposition which has led to the achievement of high levels on all three dimensions of performance. This is because the promised set of benefits indicated by the value proposition is delivered to the customer through value creation activities of the firm, which affect value capture subsequently by reducing the input costs (Biloshapka & Osiyevskyy, 2018). Value creation and value capture are interdependent (Bowman & Ambrosini, 2000), while value proposition influences customers’ willingness to pay which subsequently affects the value capture of a business model (Biloshapka & Osiyevskyy, 2018). For instance, exploring value-enhancement opportunities such as eliminating bottlenecks in operations while also defining the value-capture potential of such actions and prioritising opportunities at the same time allows both customer and the firm to be positioned to profit (Sjödin et al., 2020). Therefore, an important research implication of this finding is that these dimensions need to be jointly considered to obtain an accurate picture of the strategic impact (Sjödin et al., 2020) and analysed to see the changes and interactions in future research (Clauss, 2017). As a managerial implication for Sri Lankan firms, this interdependency indicates that it is important to ensure the alignment between the three dimensions throughout the BMI process (Bowman & Ambrosini, 2000; Foss & Saebi, 2018). Especially the Sri Lankan managers believing in Cluster 1’s approach should actively ensure that value creation, value delivery, and value capture elements are aligned throughout the BMI process. Therefore, future research should focus on testing for potential contingency and configurational effects among the BMI dimensions. In addition, when firms attempt to align the business model components for greater enterprise sustainability, there may be paradoxical tensions emerging within them (van Bommel, 2018), and it can also be a future research avenue building on the findings of this study.
Overall, as a managerial implication particularly for Sri Lankan firms and the firms in the emerging marks in general, these performance differences suggest that a stronger focus on customers and their retention is an important source of value for firms (Gentile et al., 2007); ‘a revenue-producing asset for the firm’ (Anderson & Mittal, 2000, p. 116) and associated with heightened business performance (Deshpandé et al., 2000) in emergent market settings. Understanding these key differences helps managers evaluate each driver’s contribution quickly and correctly to identify the performance dynamics enabling them to design the systems and institutionalise the processes appropriately. The absence of such knowledge and assessment may leave managers blind to risks and opportunities embedded in their current business model configurations, which subsequently threaten the enterprise’s sustainability. Therefore, managers can use these profiles to understand the key business model activities underpinning strong performance to develop a sustainable enterprise development strategy.
Finally, our two-stage rigorous hierarchical cluster analysis (Morris et al., 2013) approach is a response to the call for studies with best practices employing cluster analysis in entrepreneurship research by Crum et al. (2020). This study bases its approach on theory-driven input variable selection, taking adequate measures to validate and determine the reliability of the obtained solution and using ANOVA to confirm the cluster differences with meaningful cluster solutions. This is a methodological advancement in entrepreneurship research as these best practices in cluster analysis have been largely overlooked by entrepreneurship research (Crum et al., 2020).
Limitations
The researcher’s subjective judgment regarding the sometimes-arbitrary choices of certain parameters related to cluster analysis, such as the choice of classification algorithm and the identification of the number of clusters (Ketchen & Shook, 1996), is a limitation of this study. However, to reduce the potential biases, this study has tested for the reliability and validity of the clusters in various approaches, including post-hoc ANOVA tests. In addition, given that this is a survey-based exploratory study, the general limitation of using Likert-type scales applies to this study. Although a lot of the recommended measures to lower CMB have been taken in this study, still the respondents may not have been inclined to score the measurement items at the bottom of the scale, although they consider that their firms rate poorly and thus, preferred to have rated at the top end of the scale. Social desirability bias may have had some impacts on ratings (Nederhof, 1985). Further, although CMB (Herman’s single factor––39%) was not an issue in this study, future studies should consider options for reducing the CMB as much as they can.
Conclusion
In conclusion, this study has shown that the strategic emphasis placed on micro-level BMI activities by Sri Lankan firms, being firms that are operating at the bottom of the pyramid markets, can be highly diverse and differentially related to performance. Further, the study demonstrates that firms deploying micro-activities targeting higher customer relationships outperform other firms in the market. Moreover, firms with micro-activities aiming at multiple epicentres of the business model tend to be successful in overall firm performance. Therefore, consideration of interdependency and alignment between the three BMI dimensions is essential for designing sustainable business models and research studies.
Footnotes
Acknowledgements
Authors would like to acknowledge the support provided by the Institute of Management of Sri Lanka (IMSL) and the Sri Lanka Institute of Marketing (SLIM), the premier professional bodies in Sri Lanka for data collection of the study.
Declaration of Conflicting Interests
The authors declared no potential conflicts of interest with respect to the research, authorship and/or publication of this article.
Funding
The authors have received no financial support for the research, authorship and/or publication of this article.
Appendix
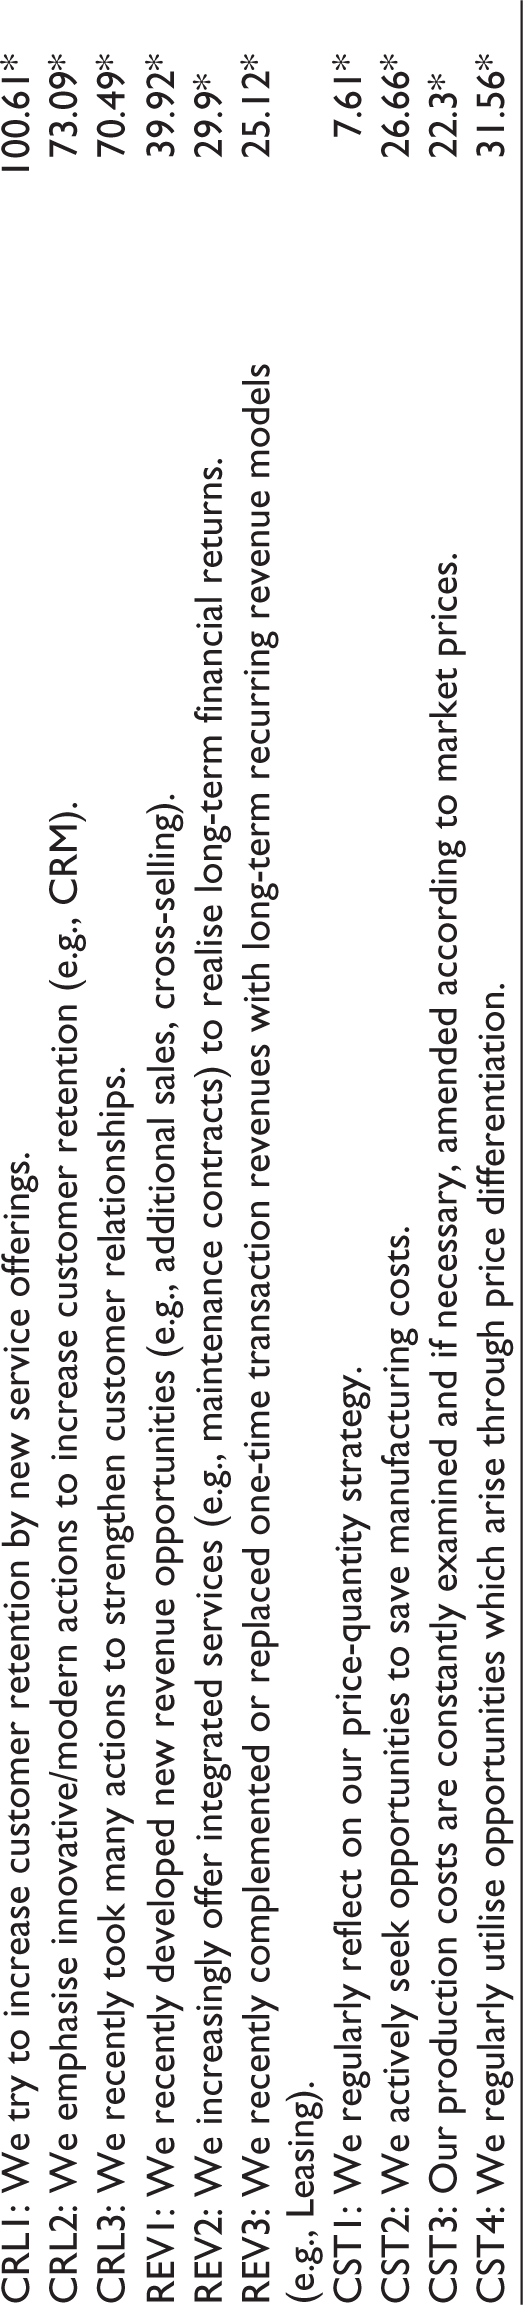
Full List of Items Used to Measure the BMI Activities and Their T-test Results.
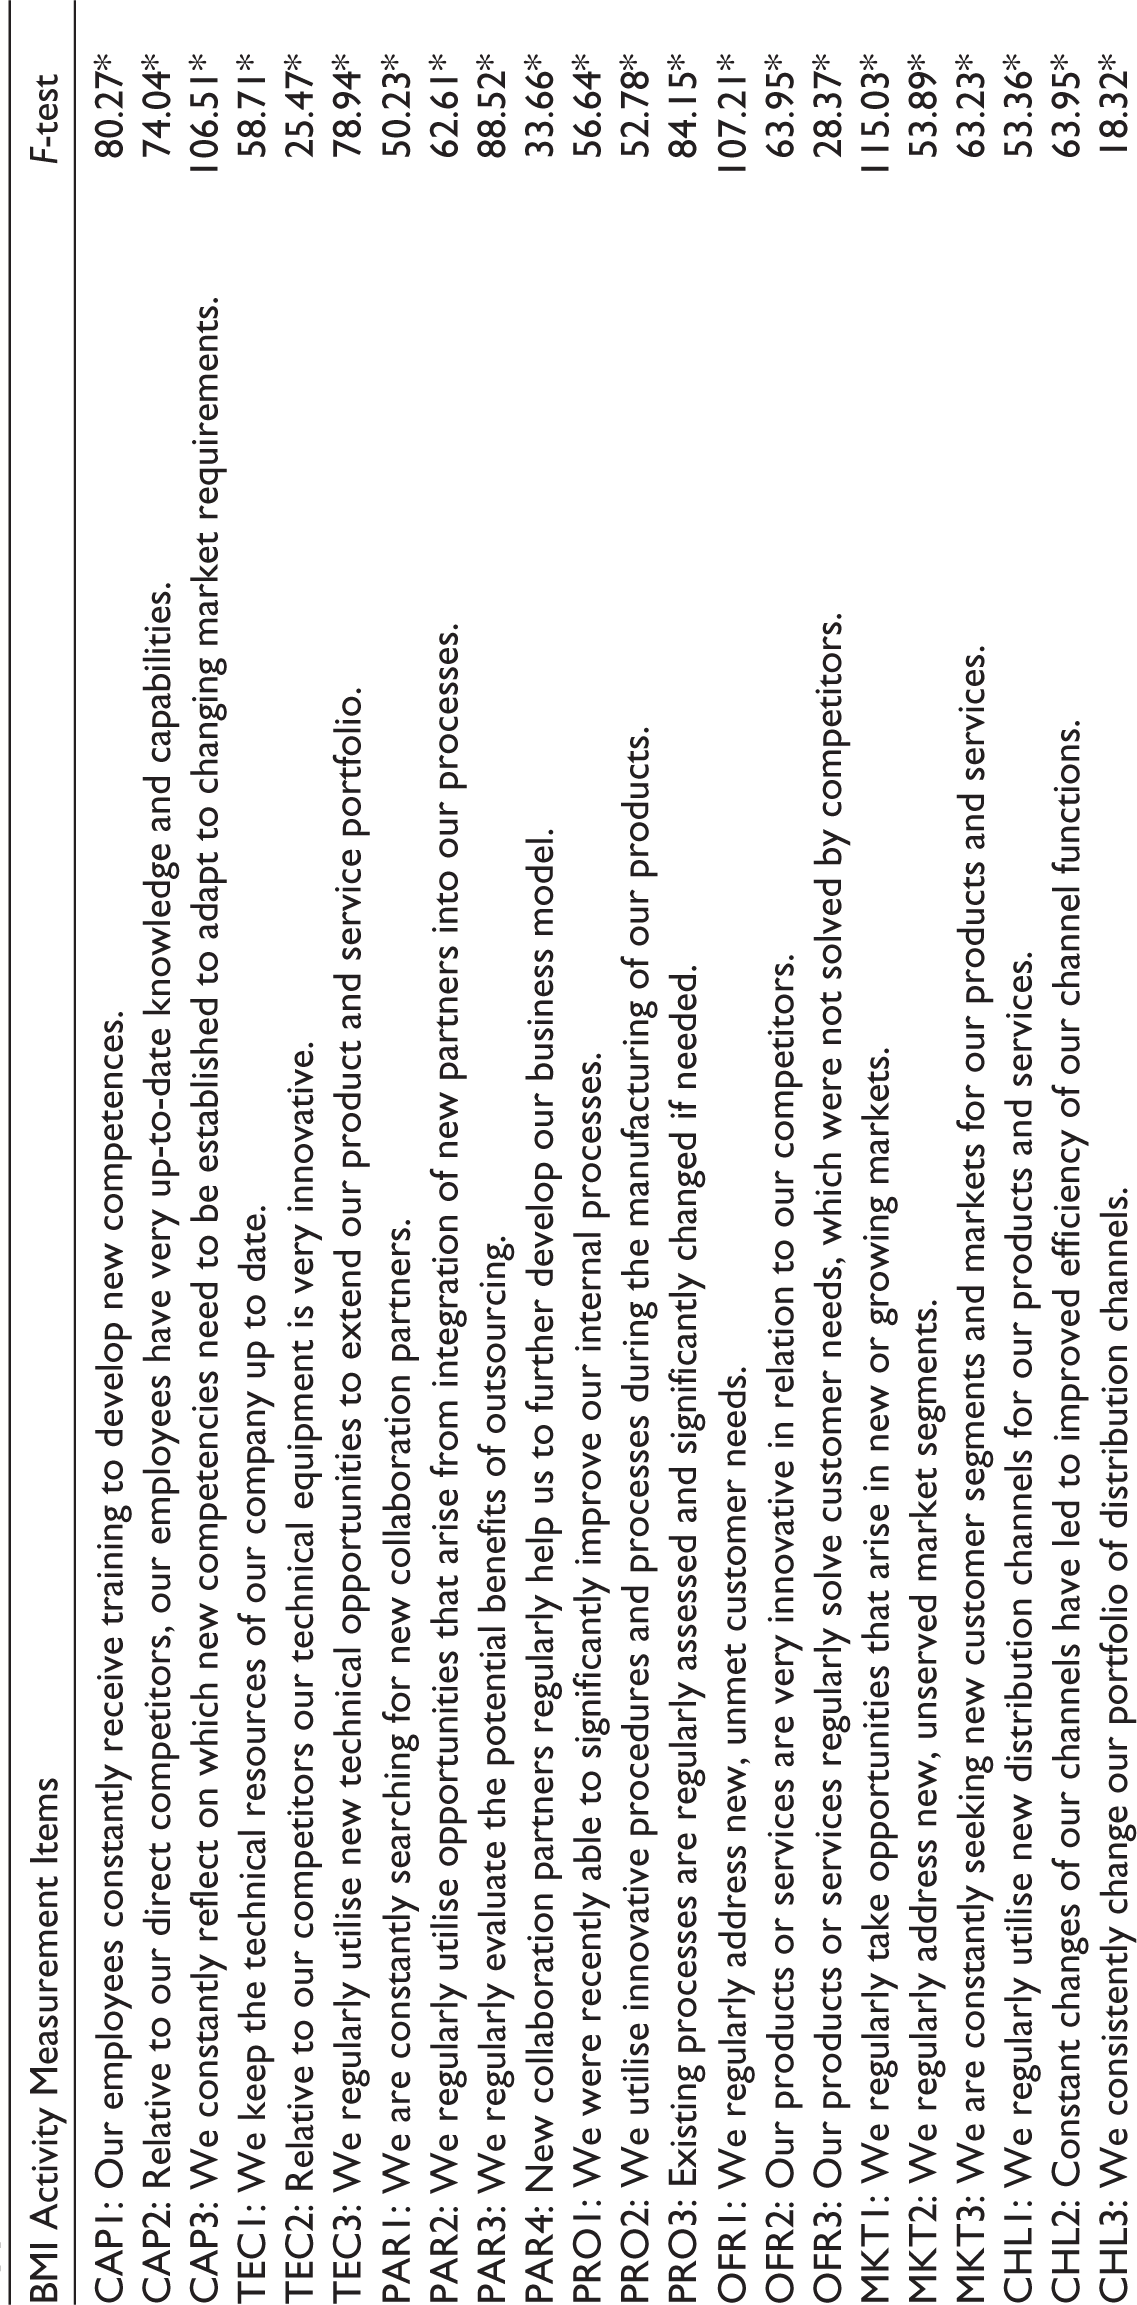
| BMI Activity Measurement Items | F-test |
| CAP1: Our employees constantly receive training to develop new competences. | 80.27* |
| CAP2: Relative to our direct competitors, our employees have very up-to-date knowledge and capabilities. | 74.04* |
| CAP3: We constantly reflect on which new competencies need to be established to adapt to changing market requirements. | 106.51* |
| TEC1: We keep the technical resources of our company up to date. | 58.71* |
| TEC2: Relative to our competitors our technical equipment is very innovative. | 25.47* |
| TEC3: We regularly utilise new technical opportunities to extend our product and service portfolio. | 78.94* |
| PAR1: We are constantly searching for new collaboration partners. | 50.23* |
| PAR2: We regularly utilise opportunities that arise from integration of new partners into our processes. | 62.61* |
| PAR3: We regularly evaluate the potential benefits of outsourcing. | 88.52* |
| PAR4: New collaboration partners regularly help us to further develop our business model. | 33.66* |
| PRO1: We were recently able to significantly improve our internal processes. | 56.64* |
| PRO2: We utilise innovative procedures and processes during the manufacturing of our products. | 52.78* |
| PRO3: Existing processes are regularly assessed and significantly changed if needed. | 84.15* |
| OFR1: We regularly address new, unmet customer needs. | 107.21* |
| OFR2: Our products or services are very innovative in relation to our competitors. | 63.95* |
| OFR3: Our products or services regularly solve customer needs, which were not solved by competitors. | 28.37* |
| MKT1: We regularly take opportunities that arise in new or growing markets. | 115.03* |
| MKT2: We regularly address new, unserved market segments. | 53.89* |
| MKT3: We are constantly seeking new customer segments and markets for our products and services. | 63.23* |
| CHL1: We regularly utilise new distribution channels for our products and services. | 53.36* |
| CHL2: Constant changes of our channels have led to improved efficiency of our channel functions. | 63.95* |
| CHL3: We consistently change our portfolio of distribution channels. | 18.32* |
| CRL1: We try to increase customer retention by new service offerings. | 100.61* |
| CRL2: We emphasise innovative/modern actions to increase customer retention (e.g., CRM). | 73.09* |
| CRL3: We recently took many actions to strengthen customer relationships. | 70.49* |
| REV1: We recently developed new revenue opportunities (e.g., additional sales, cross-selling). | 39.92* |
| REV2: We increasingly offer integrated services (e.g., maintenance contracts) to realise long-term financial returns. | 29.9* |
| REV3: We recently complemented or replaced one-time transaction revenues with long-term recurring revenue models (e.g., Leasing). | 25.12* |
| CST1: We regularly reflect on our price-quantity strategy. | 7.61* |
| CST2: We actively seek opportunities to save manufacturing costs. | 26.66* |
| CST3: Our production costs are constantly examined and if necessary, amended according to market prices. | 22.3* |
| CST4: We regularly utilise opportunities which arise through price differentiation. | 31.56* |