
Abstract
This research is based on Indian banks, examining the mutual relationship between owner concentration (OC; promoters, retail investors (ri), and institutional investors (ii)), Herfindahl–Hirschman Index (HHI), market capitalization (mcap), and net interest margin (NIM). The agency and stewardship theory-grounded study proposes to offer a nuanced understanding of the association between OC, mcap, and NIM. This study measures nonlinear associations among the variables. Static panel data regression is applied to examine the association between OC and bank size and profitability. For the study, data from 23 Indian bank for 11 years (2012–2022) are combined. It is observed that promoter shareholding and HHI have an inverted-U-shaped relationship with NIM; that is, NIM is lower after a certain threshold. Likewise, ii2 and ri2 have a U-shaped relationship, it signifies increase in OC leads to fall in NIM intially, after reaching, but after a certain threshold, NIM increases. Prom2 has an inverted-U-shaped relationship with firm size, resulting in a decrease in market cap after a threshold. While ii2 and HHI2 do not have any notable effect on mcap, ri2 has a U-shaped relationship, which boosts mcap above a certain threshold. This study’s findings help managers and shareholders consider firm size and profitability while deciding the bank owner concentration level. We have not observed any paper assessing and reporting the nonlinear relationship between owner concentration, bank size, and profitability of Indian banks.
Introduction
Banks play a crucial role in driving the economy in emerging markets, as they often support their country’s economic growth and provide loans (Amanda et al., 2020; Vo, 2017). The market structure of banks has changed significantly due to globalization, changing consumer needs, technological breakthroughs, and regulatory changes (Huynh, 2024). The banking system is among the most heavily regulated sectors as a crisis for institution affects the overall economy of a nation. Consequently, banks are expected to maintain a higher corporate governance (CG) standard than other industries (Amanda et al., 2020). CG depends on the proper ownership concentration (OC) and protecting investors’ interests (Mandacı & Gumus, 2010). The relationship between OC and bank performance has been a popular and debatable topic in finance literature (Jiang, 2004). Ownership structure is broken down into two aspects: the composition of ownership and OC. Ownership composition refers to the shares held by the state, institutions, and individuals, whereas OC relates to the shareholding of the top 1, 3, 5, or 10 shareholders (Liu et al., 2020). The work of Jensen and Meckling (1976) demonstrates that the value of firms is positively related to ownership structure, especially that of internal shareholders, whose rising share increases the firm’s value. In line with this, Lai and Solomon (2006) present that blocking shareholders increases competition in the banking sector. Azar et al. (2022) validated the results of Lai and Solomon (2006) by using the generalized Herfindahl–Hirschman Index (HHI) as a proxy of the OC.
In order to increase bank stability, the Reserve Bank of India (RBI) has published new guidelines on OC (RBI, 2016). Sarkar and Sarkar (2012) assert that a minimum of 43% of firms have at least one shareholder who holds over 20% of total shares in India. According to Anuja and Thenmozhi’s (2023) research, India has an insider system with highly concentrated ownership, as opposed to more dispersed ownership in Western nations such as the United Kingdom and the United States. Roy and Chakraborty (2024) assert that OC is essential for firm performance. Meanwhile, Ozili and Uadiale (2017) claimed that CG and ownership structure play a vital role in the profitability of banks. For a bank to thrive, profitability is essential (Yuanita, 2019). There are several ways to assess banking performance. Profitability and size are the ways through which the performance of banks can be measured.
Nevertheless, in the Indian banking system, OC remains a highly discussed subject. OC is a critical element that influences CG, behavior in the market and performance of the banks. Nonetheless, it is not yet given enough attention in the literature, owing to its intricate influences on market capitalization (mcap) and profitability, particularly in the Indian banking industry, where ownership is distinct and dynamic. The interaction of promoters, retail investors (ri), and institutional investors (ii) defines ownership, and the overall influence of these factors on the performance of firms has not been studied. The application of the HHI as a proxy of OC offers a fresh direction to the given study, as it offers a quantitative and solid way of quantifying OC (Huynh, 2024). The application of HHI to the Indian banking sector is still a little explored area despite being extensively implemented in other economic sectors and geographical areas. Therefore, this research utilized the HHI in the measurement of OC as in Brendea (2014), Bruton et al. (2010), Demsetz and Lehn (1985), and Cubbin and Leech (1983). This provides a possibility of filling a substantial research gap and making new contributions to the literature. Financial stability and growth depend on the Indian banking sector, which is a significant sector of the economy. It is significant to learn the impact of OC on mcap and profitability in this industry both academically and practically. Through the study of this relationship, the study will make available information to policymakers, investors, and corporate leaders that will enable them to make an informed decision using the relevant data to enhance their financial performance and competitiveness in the market.
Instead of a qualitative research method, the authors decided to employ a quantitative one, given the fact that the identified research problem could be resolved more appropriately by the application of quantitative research methods (Johnston, 2017). This framework chose secondary data over primary data because of its higher measurement accuracy (Johnston, 2017). Panel data were also preferred within the secondary data category because of its unique advantages over cross-sectional and time-series data (Hsiao, 2007). In their OC and firm performance, Hu and Izumida (2008) suggest that OC can be measured in several ways. This article selected promoters, retail investors, the HHI, and institutional shareholders as the proxies for OC. This study used the HHI to measure OC, in line with Cubbin and Leech (1983), Azar et al. (2022), Demsetz and Lehn (1985), Nashier and Gupta (2023), Bruton et al. (2010), and Brendea (2014). This choice was based on the distinctness of their definitions and the ease of estimation comparatively (Bhimavarapu et al., 2023; Lai & Solomon, 2006; Rastogi et al., 2021). This study aims to assess the nonlinear effect of OC (prom, ii, ri, and HHI), market capitalization (used as firm size proxy), and net interest margin (NIM; proxy of profitability) of Indian banks. This study uses the data of 23 banks from 2012 to 2022 and static panel data analysis to fulfil its objective. This research uses stakeholder and agency theories to evaluate the observed association, which advances our understanding of the association between OC, mcap, and profitability in Indian banks.
The study is significant in that it fills a significant gap in the banking governance literature by investigating the impact of various types of OC on both the size and the profitability of a bank within an emerging market setting. Indian banks have their own institutional, regulatory, and ownership structures, but there is limited empirical evidence that relates promoter ownership, ri, ii, and HHI to mcap and NIM. Basing its arguments on agency and stewardship theories, the study contributes to the current knowledge base on the co-existence of monitoring incentives and stewardship behavior among banks, in which heterogeneous owners are prevalent. The research is innovative in a number of ways. To begin with, first, it looks at many facets of OC, such as HHI, as opposed to aggregate ownership measures. Second, it directly specifies the nonlinear relationships and thus threshold effects, which have been overlooked in other previous studies. Third, it offers solid evidence on the dynamics between governance and performance in a significant sector of the banking industry of a major emerging economy with the help of a long-balanced panel of Indian banks more than 12 years old.
The analysis is revealing of the fact that there is an inverted-U-shaped connection between the variables studied. Prom2 and HHI2 show an inverted-U-shaped connection with NIM, indicating that while a rise in prom and HHI enhances NIM, after reaching a certain threshold, with the rise in prom and HHI, there is a fall in NIM. Conversely, ii2 and ri2 are positively related with NIM (U-shaped), indicating that the rise in the concentration of ii and ri leads to a fall in NIM, but beyond a certain point, a rise in both leads to a rise in NIM. Furthermore, prom2 represents an inverted-U-shaped relationship for firm size, indicating an initial increase in promoter holding, which increases market capitalization (mcap). However, there is a point after which it diminishes. Besides, while ii2 and hhi2 are not statistically correlated with mcap, ri2 exhibits a U-shaped relationship with mcap, suggesting that higher ri leads to a fall in bank size, but after reaching a certain threshold point, it leads to a rise in mcap.
The current study adds to the already existing body of knowledge to a great extent. We have not found any other study about OC’s impact on banks’ size and profitability. Not to speak of nonlinear association, we do not see a linear association between the two. As an outcome, the existing findings are valuable and novel. There are specific implications of the findings of the present study. The article also highlights the influence of investor mix in the size of a bank and its implications in strategic decision-making. It is on the basis of these complex dynamics that investors can make improved decisions, and managers, on the basis of such discoveries, can manage to optimize capital placement and bank structure.
The article is divided into 7 parts. The second part is the theoretical context of the research. The third part is the review of the related scientific works and the overview of the main arguments of the different research studies. The fourth part is the methodology and data collection as they talk about how we went about doing our research. The empirical outcome is provided in the fifth section, the results section. In the sixth part, the discussion is provided and the findings of the article are substantially compared to the existing research. The seventh section is a conclusion of the article.
Theoretical Framework
The banking industry in India has its own regulatory and cultural environment, and OC has played a major role in governance and performance here. Indicatively, promoter-based public sector banks tend to be socioeconomically oriented, while private sector banks are profit and shareholder oriented. Hence, policymakers and investors need to know how OC influences such dynamics. Further details are provided in HHI, which is OC. HHI value is high; therefore, the ownership is more concentrated, leading to strong ownership; therefore, it may also limit the various inputs to the decision-making process. The latest study by Ghosh and Mondal (2024) on Indian banks found that moderately concentrated ownership balances the trade-off of control with flexibility to be optimal for firm performance. This agency and stewardship theory-grounded study proposes to offer a nuanced understanding of the association between OC, mcap, and NIM for actionable insights into the Indian banking industry (Bunyaminu et al., 2025; Dorsaf, 2026).
Jensen and Warner (1988) claimed that an organization’s ownership structure regulates the type of agency issues and the allocation of authority and control. Agency theory, as initially presented by Jensen and Meckling in 1976, establishes potential agency conflicts between managers (agents) and owners (principals). These are mostly diminished in banks with high promoter ownership because the promoters act as principal shareholders (Zeng & Cohen, 2026). However, Yahaya’s (2025) study concludes that increases in institutional investors improve the institution’s performance. As a result, it would reduce agency costs, with more efficient decisions and greater profitability positively impacting NIM Pandey and Sahu (2021). On the other hand, concentrated ownership can also result in entrenchment, whereby promoters seek personal benefits over shareholder value, thereby influencing mcap and profitability. Perrini et al. (2008) propose fresh lines of inquiry for the ownership structure literature that are prepared to examine endogeneity and nonlinearity issues and the varying interests of various shareholder categories. Perrini et al.’s (2008) study findings support the agency theory for assessing the effect of OC on the valuation of European firms. In this regard, Abbasi et al. (2017) performed their study by analyzing listed firms in the Tehran Stock Exchange. Similarly, Mittal and Anjala (2018) concentrated on the firms traded at the National Stock Exchange of India and again offered supporting evidence for large shareholders. Such studies prove that OC is an antidote in dealing with agency conflicts and, hence, better firm-level performance.
The stewardship theory forms a crucial framework for delving into the mutual relationship between OC and the performance metrics (mcap and NIM) of Indian banks. Unlike the agency theory, which assumes a conflict of interest between managers and owners, stewardship theory posits that managers act as stewards, prioritizing the organization’s long-term interests over personal gains (Davis et al., 1997). Mishra and Kapil (2017) examined Indian companies and found that promoter ownership, ii, and ri are not similar in their effects at establishing managerial behavior. According to Kanoujiya et al. (2023), promoters are usually deeply rooted, and their interests tend to be consistent with developing the bank and boosting its profitability; at the same time, retail investors help to diversify ownership. HHI also assists in determining the level of OC, which gives information on the power relation within the firm in terms of size and profitability.
The stewardship theory proposes that high levels of concentration will result in high decision-making and performance as stewards are intrinsically motivated by organizational success. Therefore, a high promoter shareholding might lead to an emphasis on long-term profitability. Similarly, ii positively influences governance with sustained growth in mcap (Olsson & Thao, 2022). Applying stewardship theory to Indian banks’ ownership structure, this study demonstrates how well-aligned ownership can create a congruence between profitability and firm size. This shows how considerations of intrinsic managerial motivation coupled with stakeholder cooperation inform the dynamics behind the performance of the Indian banking sector.
The current research justifiably incorporates agency and stewardship theories to embody the OC and performance of Indian banks. The agency theory clarifies the existence of concentrated ownership by promoters, ii, ri, and HHI in alleviating agency problems, and monitoring intensity, as well as market capitalization and NIM. On the other hand, in the context of Indian banking, the stewardship theory would be applicable since promoters and long-term ii are viewed as steward and focus on firm sustainability and value creation rather than on self-interests. A combination of the two theories makes it possible to interpret the simultaneous exercise of control, monitoring, and stewardship by different types of owners as shaping the financial performance and market results in Indian banks.
Literature Review and Development of Hypothesis
This literature review is divided into two parts. The primary part is linked to the prior literature on OC and bank size. OC and bank size are prevalent in the banking system. The second section demonstrates the OC and profitability literature. This section demonstrates the association between OC and profitability based on the current literature.
Ownership Concentration and Bank Size
The origin of this discussion began with the pioneering study of Berle and Means (1932), as they investigated the modern concept of a firm’s ownership structure. It is realized that the promoters holding the majority shareholding are highly prompted to monitor the firm’s managerial activities and deliver strong governance. Prior studies have proved a positive correlation between OC and firm value and assets (Sakai & Asaoka, 2003; Vintilă & Gherghina, 2012). Elfeituri (2018) observed the MENA region banks and concluded that banks’ size and efficiency reduce the profitability of MENA region banks. However, the concentration of more foreign ownership in these banks leads to an improvement in the profitability and size of banks. Sulong and Nor (2008) observed Malaysian firms and found that managerial ownership and OC have no significant influence on the value of firms. Obamuyi (2013) suggested that the adverse link between bank profitability and size may be caused by higher bureaucratic processes that prevent a bank from working better and thus reduce its profit levels. Chen and Liao (2011) again opined that the inverse connection between bank size and profit reveals the existence of diseconomies of scale: it is argued that here are more chances that bigger banks would provide low profits, whereas smaller banks would produce high profitability. Nashier and Gupta (2023) observed 1,392 BSE firms and revealed that HHI (used as a proxy of OC) improves the firm value and reduce the agency cost of firms. Furthermore, Bunyaminu et al. (2025) assessed 30 Ghana firms using the GMM framework and concluded that OC improves the market value.
Market capitalization involves complex interactions with OC. The outcome of numerous studies concluded that the nonlinear influence of OC (using prom, ii, ri, and HHI as proxy) on the market capitalization of Indian banks is not assessed and rare. Consequently, research is required, so based on this research gap, the first hypothesis is formed:
H1: There is a significant nonlinear association between OC and market capitalization of Indian banks.
Ownership Concentration and Profitability
Yasser and Mamun (2017) used the HHI to measure OC, demonstrating the monitoring role of controlling shareholders and their positive influence on market-based performance and the economic profitability of firms in Pakistan. Ozili and Uadiale (2017) studied Nigerian banks and found that high-equity OC increases the NIM, ROA, and recurring earning power. Cornett et al. (2007) assert that institutional investors prioritize short-term performance over long-term development. However, they might attempt to benefit themselves at the expense of other shareholders. The notion is further supported by Elyasiani and Jia (2010), who found that institutional investors collaborate with the management to take advantage of minority shareholders and lower firm performance in order to support institutional ownership. Roy and Chakraborty (2024) studied Indian firms and claimed that a reduction in promoter ownership increases the firm value and the competition level in the market; subsequently, there is an increase in promoter OC level. Yahaya (2025) observed 150 Nigeria firms and found that institutional investors positively affect the ROA of firms. The study also concluded that institutional ownership improves the governance aspect, reduces the agency issue, and enhances firm performance. On the contrary, Emengini et al. (2025) assessed the effect of OC on the performance of Nigerian banks and exchange groups from 2011 to 2020 using the GMM model. The study outcome revealed that overall, OC does not affect the performance of Nigerian banks. However, Azad et al. (2025) studied 124 banks of 13 MENA nations and concluded that OC improves the performance of banks.
Gupta et al.’s (2022) research on Indian banks concluded that a rise in the OC of banks resulted in a rise in the bank value (ROA and NIM). Amanda et al. (2020) studied the nonlinear association between OC and profitability of 93 Indonesian banks and found a significant association. Perrini et al. (2008) discovered that firm valuation benefits from the OC of the top five shareholders. Conversely, only non-concentrated businesses profit from managerial ownership, implying that the controlling owner may use their position to pick managers who serve their interests to obtain personal gains at the expense of other shareholders.
The findings from various studies concluded that the nonlinear influence of OC on bank profitability using OC proxied by prom, ii, ri, and HHI is not assessed. Therefore, there is a need for a study, so based on this research gap, the second hypothesis is proposed:
H2: There is a significant nonlinear association between the OC and profitability of Indian banks.
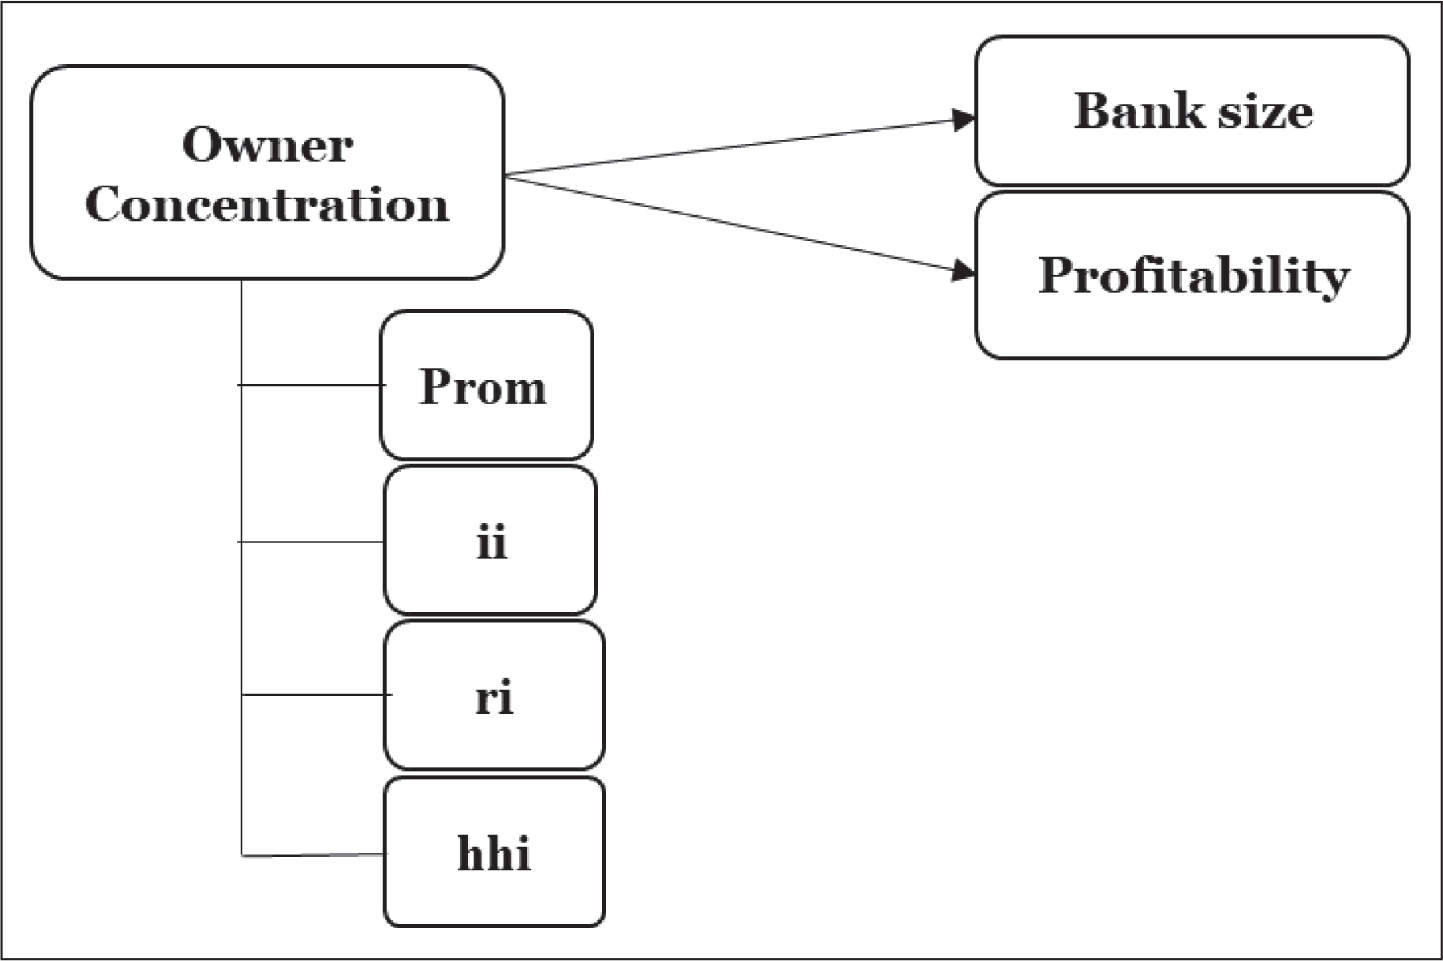
Considering the above-mentioned discussion on theoretical formation and literature review, a conceptual map is presented in Figure 1, which we would like to use for empirical testing.
Data and Research Methodology
Data Collection
This study is centered on the Indian banking sector and involves an empirical examination based on a dataset encompassing 23 commercial banks operating in India. In this dataset, there are 9 banks that are classified as public sector banks and the other 14 are classified in the private sector segment. The choices of these particular banks to analyze were based on the availability of complete and extensive data. The dataset timeframe covers the period between 2012 and 2022, which can be considered quite a significant time period that is necessary to gain a full understanding of OC’s effects on performance and guarantee the achievement of consistent and credible research results (Rastogi, Pushp et al., 2025). The information used in the analytical tool will be obtained through the Bloomberg terminals, the CMIE Prowess IQ database, the RBI database, and the annual reports of the respective banks.
Methodology Adopted and Variable
The study examines the effect of different OCs on the performance of the Indian banking industry. This analysis is done employing the static panel data regression (SPDR) technique. Moreover, the research utilizes the Hausman test as a methodological procedure to ensure that the best model to use in research is the most suitable; that is, it provides an option between the random effect and fixed effect (FE) models. In the event that the outcomes of the Hausman test demonstrate statistical significance, specifically with a probability value of less than .05, it would lead to the inference that the FE model is more appropriate for the research, aligning with the insights of previous studies (Baltagi, 2005; Wooldridge, 2019). Data processing and subsequent analysis of the results are carried out using MS Excel and Stata software tools.


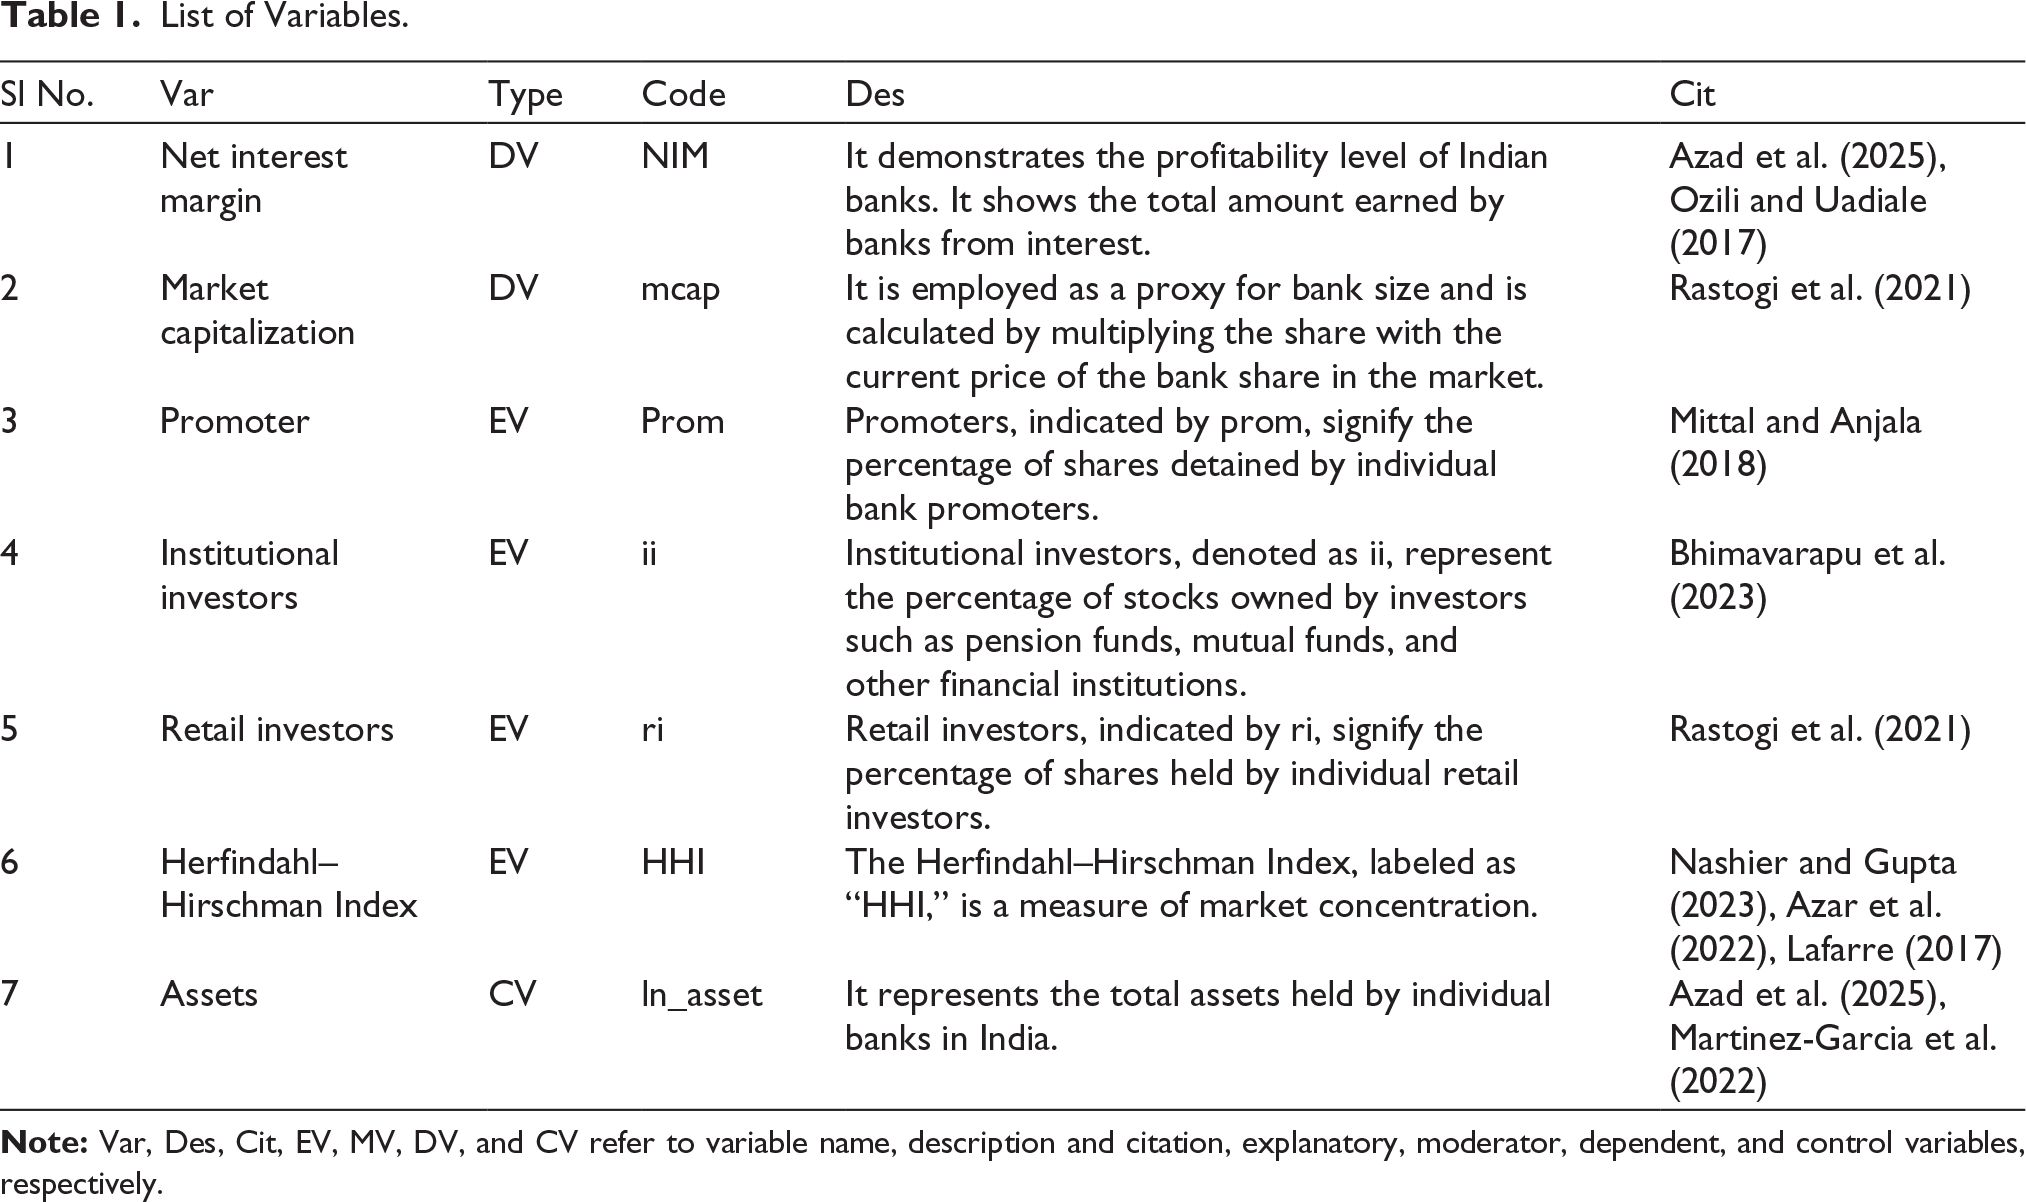
In this calculation, NIM and mcap are used as dependent variables. On the other hand, the variables promoter (prom), institutional investors (ii), retail investors (ri), and HHI are the explanatory variables (Martinez-Garcia et al., 2022). Equations 1–4 display the nonlinear association between NIM and prom, ii, ri, and HHI, respectively, whereas Equations 5–8 display the nonlinear association between mcap and prom, ii, ri, and HHI individually. The symbol i in the study represents the number of banks that are going to be incorporated in the study, whereas t is used to represent the time aspect of the study, which is in years. The unobservable effects are summarized in the variable uit. Assets are considered as a control variable in the study to eliminate extraneous factors. To represent these variables in a well-structured manner, the variables are organized in a tabular way in a systematic manner, as shown in Table 1.
List of Variables.
Results
Descriptive Statistics and Multicollinearity
A detailed summary of the important financial and market performance statistics is contained in Table 2 based on a dataset of 253 observations. These statistics provide useful insights into the financial, competitive, and strategies of banks that can be used in decision-making in different sectors. The standard deviation (SD = 0.641) is very low, indicating that there is an overall performance that most institutions perform in this area. The log of mcap, which is the valuation and the size of the institutions, is averaged to 4.486 although with a moderate SD of 0.696, which shows that market capitalization varies to some extent.
Statistical Summary.
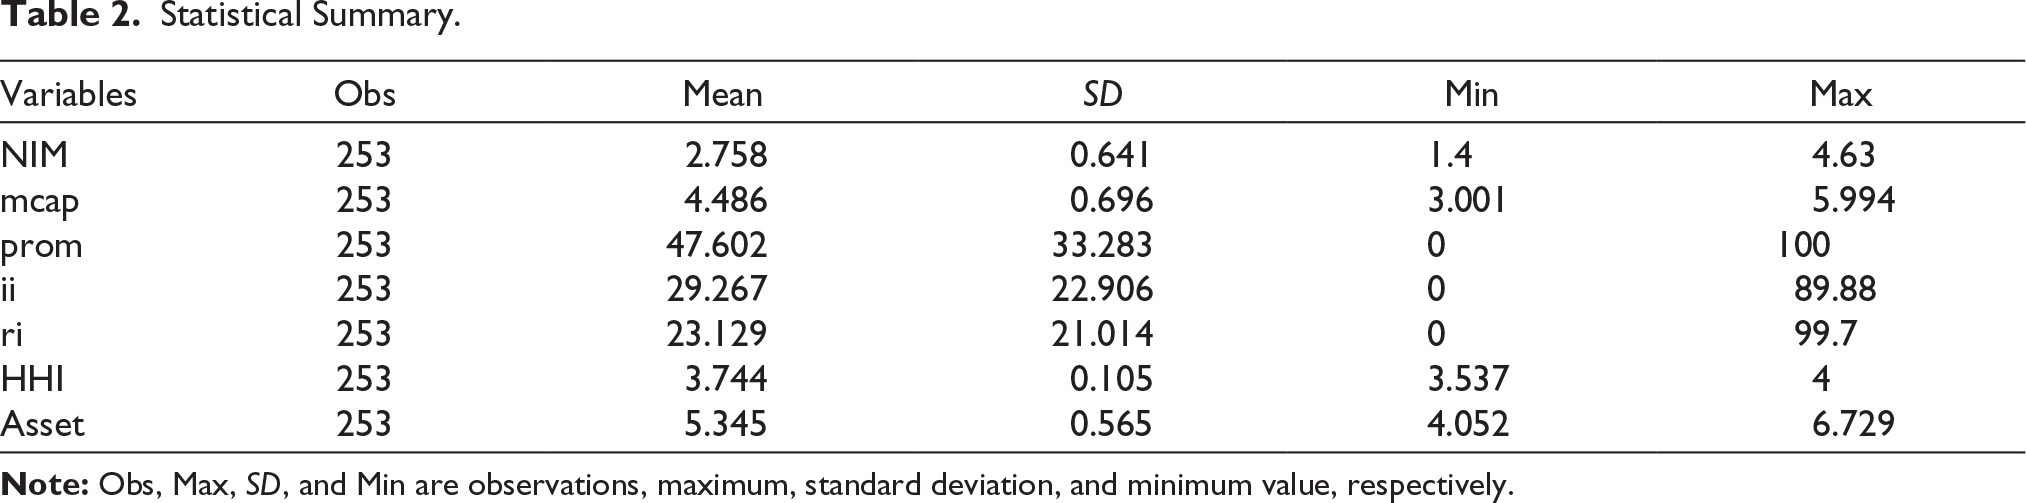
The variable prom has a mean score of 47.602 and SD of 33.283, which illustrates the disparity in prom holdings within banks. This large variation indicates that there is a great diversity in the ownership structure of the sampled banks in that some of them are tightly owned by prom and others have an evenly distributed ownership structure. The average of the ii in our dataset is 29.267%, with an SD of 22.906%. This variation suggests an implication of the institutional investor interest and influence varying in the sample companies. ri represents the share of the stock owned by individual retail investors. The average retail ownership is 23.129 at an SD of 21.014. The average value of HHI is 3.744, and its SD is very less, that is, 0.105. The fact that the variability is low implies that the extent of market concentration among the banks is relatively constant, and this can have some implications on the competition and the market dynamics in the respective industries. The control variable is considered to be an asset, which may influence the financial stability of a company and its possibility to grow. The average value of assets is 5.345, and the SD is 0.565.
Table 3 indicates the correlation of the explanatory variables. According to the investigations presented by Gujarati and Porter (2009), the following recommendation is to make sure that all the correlation coefficients between variables are kept below the threshold of 0.8 in order to prevent the problems associated with the phenomenon of multicollinearity (Brama et al., 2025; Nashier & Gupta, 2023). As all the correlation coefficients of the variables in our dataset are less than 0.8, it may be assumed that the problem of multicollinearity is not a serious issue in the current research (Azad et al., 2025; Rastogi, Pushp et al., 2025; Wooldridge, 2019).
Correlation Matrix.
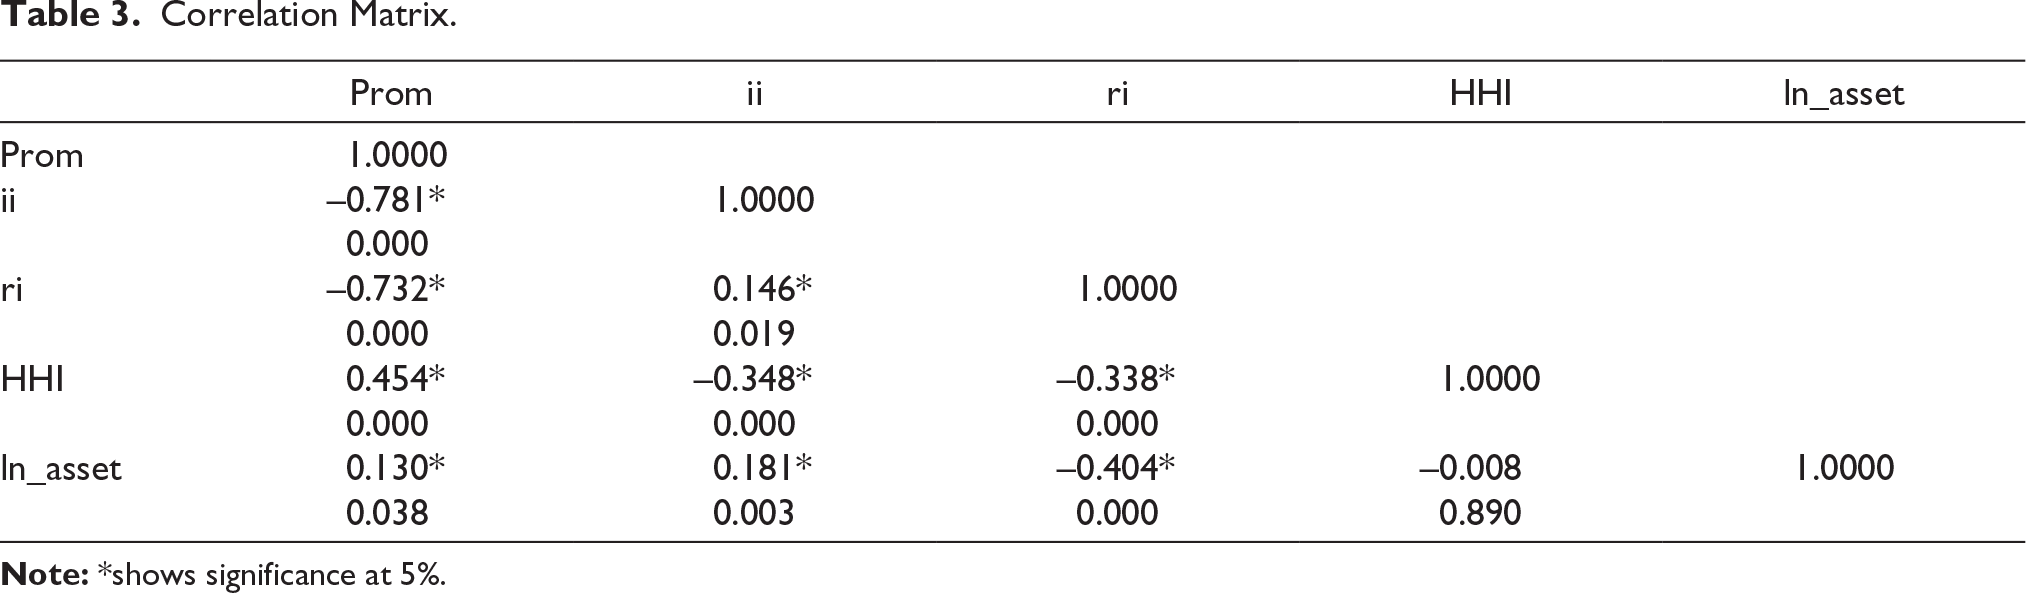
Prom is also found to have a negative correlation with both ii and ri with coefficients of –0.781 and –0.732, respectively. This implies that the higher the percentage of prom shareholding, the lower the percentage of the shareholding by institutional and retail investors. The correlation is positive at 0.454 between prom and HHI. This implies that the higher the degree of holding prom shares, the higher the HHI is likely to be. The larger the HHI, the more concentrated the market is, which could be anticipated in case prom holds a higher share of the company.
Regression Outcome
The panel data estimation uses an expert methodology, which successfully supports the cross-sectional and time-series data of the dataset. In this work, the static model is used as the method for understanding the regression analysis.
Quadratic Model Regression Results
Table 4 shows the outcome of the strict SPDR based on quadratic models. The statistical significance of the quadratic variables, such as Prom2, ii2, ri2, and HHI2, are of interest in all four models and their p values are presented in parentheses. In both Models 1 and 4, the coefficients of Prom2 and HHI2 are negative, which implies that there is an inverted-U-shaped quadratic relationship between prom, HHI, and NIM, individually. The outcome revealed that a rise in prom and HHI leads to a rise in NIM correspondingly, but after reaching a certain threshold level, the rise in prom and HHI leads to a fall in NIM.
Quadratic Model Results.
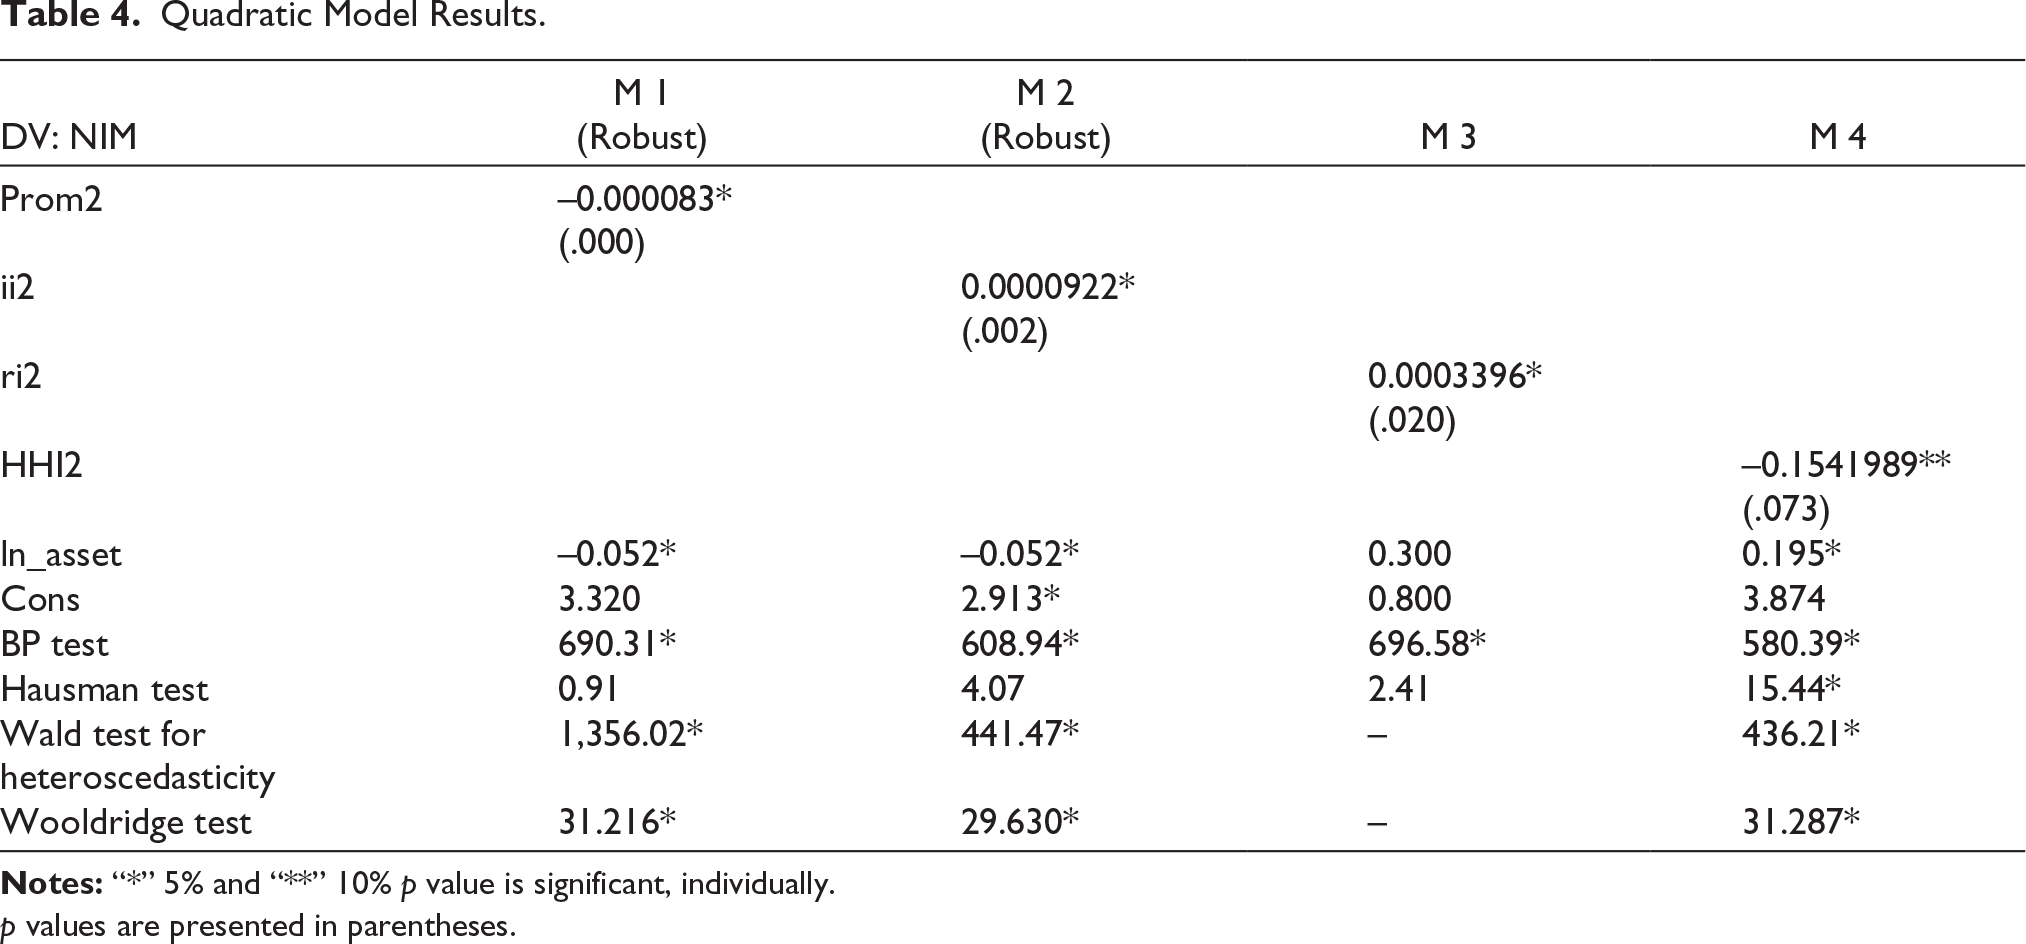
p values are presented in parentheses.
Furthermore, in Models 2 and 3, the nonlinear association of ii and ri with NIM is observed, where “ii2” and “ri2” demonstrate a positive coefficient, which implies that the coefficient is statistically significant at 5% significance level. The outcome shows that they have a “U-shaped association,” which implies that a rise in the concentration of institutional and retail investors leads to a decrease in NIM, but once the threshold is reached, the value of NIM increases. These results show that the quadratic variables influence the formation of NIM significantly.
Table 5 demonstrates the nonlinear association between OC and mcap. Model 5 signifies the nonlinear association between Prom2 and mcap, whereas Model 6 implies the quadratic association between ii2 and mcap. Model 7 signifies the nonlinear association between ri2) and mcap, whereas Model 8 implies the quadratic association between HHI and mcap. In Model 5, the coefficient of the quadratic variable “Prom2” is negative (–0.000046) and statistically significant at the 5% level (p value = .008). There is an inverted-U-shaped relation between prom and mcap. The outcome findings inferred that an initial rise in the promoter concentration in banks leads to a rise in mcap, but after reaching a certain threshold level, the rise in promoter leads to a decline in the value of mcap.
Quadratic Models Results.
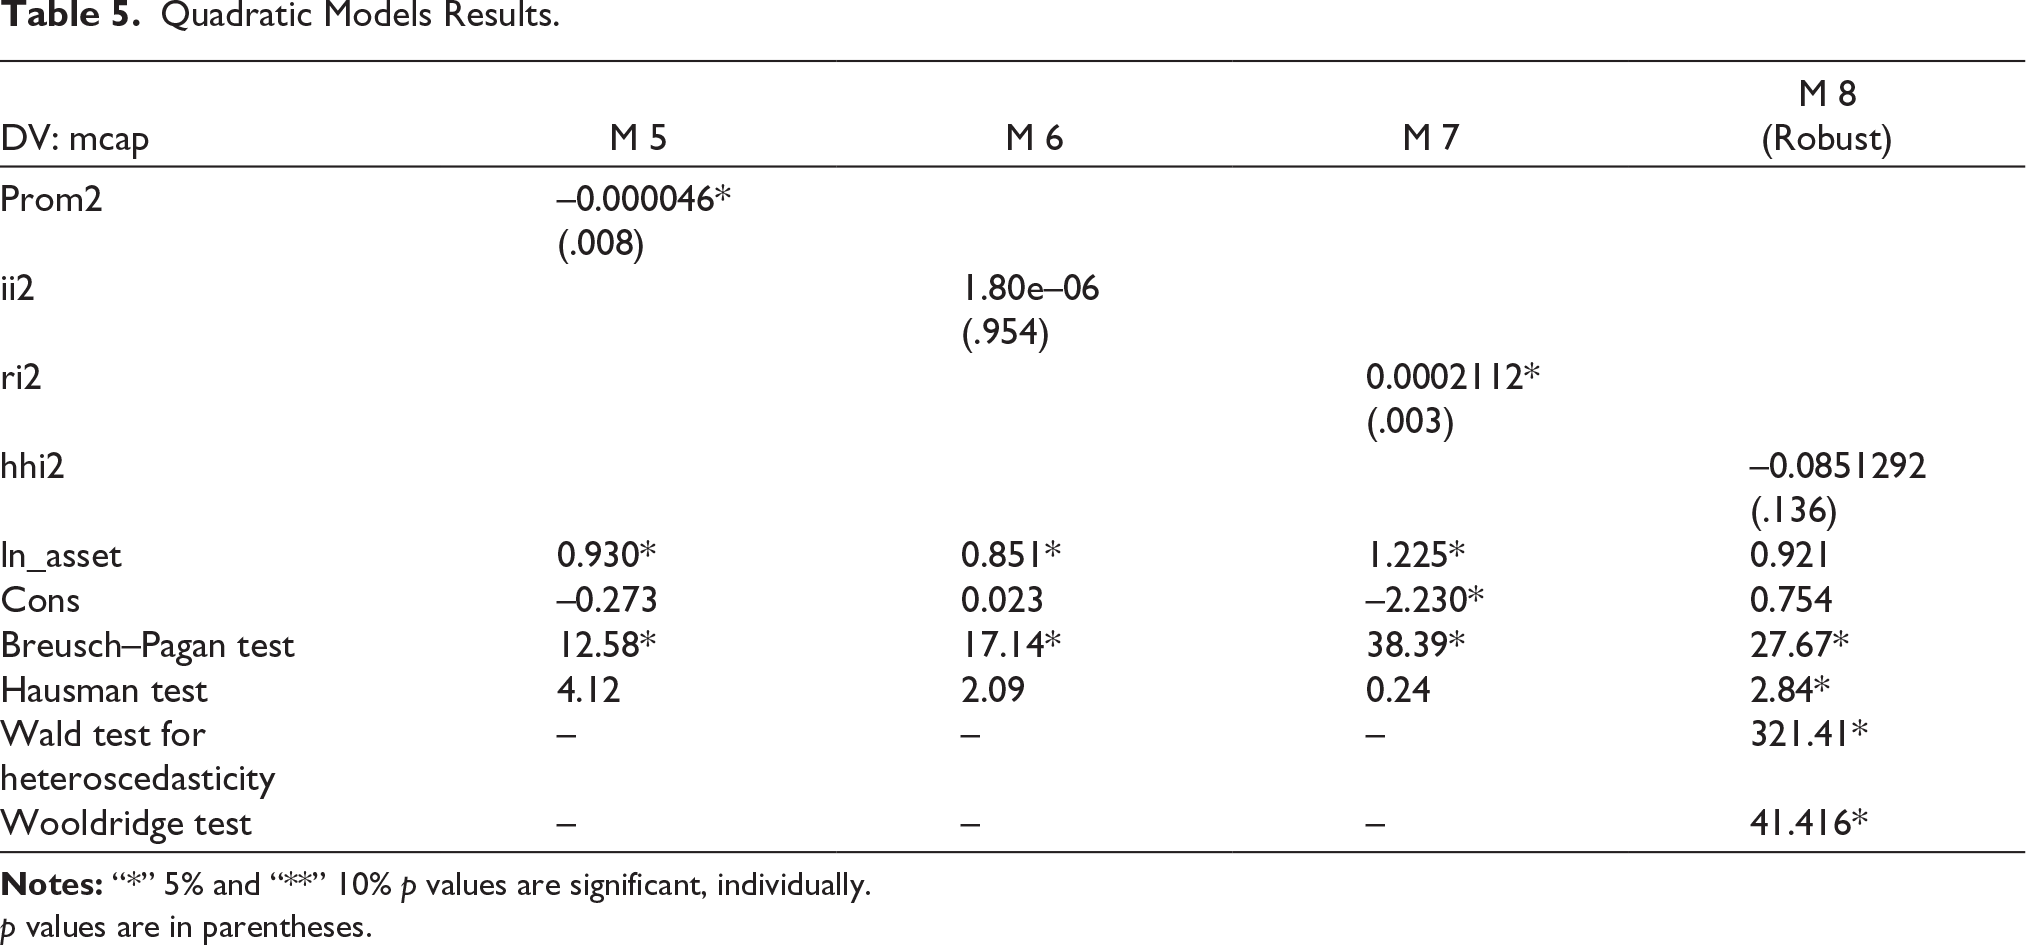
p values are in parentheses.
However, Models 6 and 8 introduce that “ii2” and “HHI2” are not statistically significant, implying a lack of a significant quadratic association among ii, HHI, and “mcap,” individually. The outcome specified that ii and HHI have no nonlinear association with the mcap of banks.
In Model 7, “ri2” is incorporated with a coefficient of 0.0002112, and it is statistically significant at the 5% level (p value = .003). This signifies a positive quadratic (U-shaped) association between “ri2” and “mcap,” suggesting that a rise in the retail investor leads to a fall in mcap, but after reaching a certain threshold level, an increase in retail investor leads to a rise in the value of mcap.
Endogeneity and Robustness
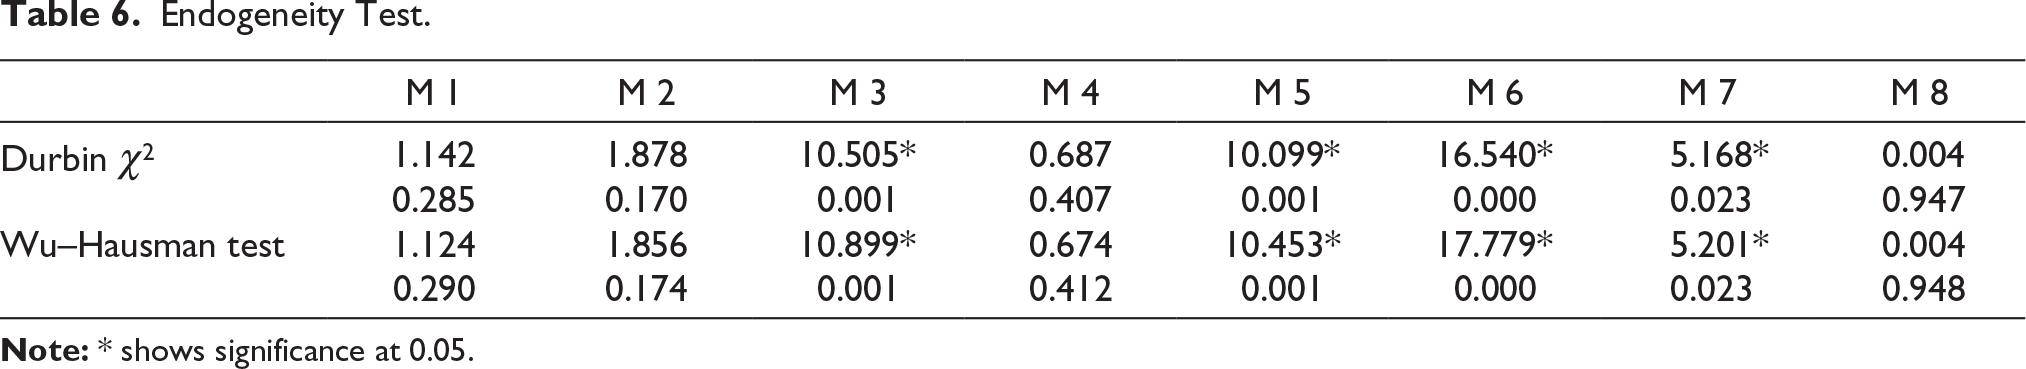
Table 6 presents the results of an endogeneity test with different models labeled as Model 1 through Model 8. Two different tests, the Durbin χ2 test and the Wu–Hausman test, are employed to assess the potential endogeneity of the variables in the models. Endogeneity refers to a situation in which an EV is correlated with the error term in a regression model, which can lead to biased and inconsistent parameter estimates (Khatib, 2025; Rastogi, Pushp et al., 2025). In Models 3, 5, 6, and 7, the Durbin χ2 test and Wu–Hausman test statistics are statistically significant at conventional significance levels (e.g., p value < .05 or .01). This indicates that in these models, there is evidence of endogeneity, suggesting that at least one of the independent variables is correlated with the error term. In contrast, in Models 1, 2, 4, and 8, the test statistics are not statistically significant (e.g., p value > .05), suggesting that in these models, there is no strong evidence of endogeneity (Herhausen et al., 2026; Rastogi, Gautam et al., 2025; Wooldridge, 2019).
Endogeneity Test.
Discussion
Testing of Hypothesis
H1 of the research fails to get rejected as the relationship between prom, HHI, and NIM is such that it is inversely U-shaped, thereby indicating that an increase in prom and HHI initially increases NIM but then decreases with a higher prom OC beyond a certain threshold. Diminishing returns or possibly inefficiencies set in as concentration intensifies. Likewise, the interactions of ii2 and ri2 with NIM are U-shaped. While NIM is a declining function of the shares of these two types of investors (ri, ii), up to certain threshold levels, it turns into an increasing function afterward, as supported by the agency theory. The increase in NIM might reflect the stabilizing or beneficial effect of greater institutional and retail involvement at high levels. The key findings, in general, are a nonlinear association between OC (prom, ii, ri, and HHI) and NIM based on the suggestion that there are optimum levels of ownership structure that are essential in preserving a healthy NIM and balance among stakeholder interests.
The study result does not reject the H2 to indicate the nonlinear correlation between OC (ii, ri, HHI, and prom) and mcap (firm size) partially. Prom2 shows an inverted-U-shaped relationship with mcap, which implies that as prom levels become higher, mcap increases, but then it decreases at a particular point, indicating that beyond a certain point of over-concentration, the effects become diminishing. On the other hand, the correlation is U-shaped with ri2, and this indicates that the firm size would decline with higher ri2, but past this critical value, it would rise, which indicates the long-term benefits of higher ri2. In the case of ii2 and HHI2, there was no statistically significant correlation, with mcap demonstrating that these variables have no significant effects on mcap under the conditions of the research. These results can be used to underscore the delicate process of interaction between the size of firms, ownership, and market outcomes, with the complexity of financial decision processes and strategic ownership.
Implication and Contribution
The implications of the finding of this article are rather significant to investors, managers, and the general picture of the role of OC in the profitability of banks. The negative U-shaped interaction among prom, HHI, and NIM indicates that too much concentration is not good to make profits. The point is to determine the optimal ownership level in order to maximize NIM without having to go down the road of diminishing marginal returns. Managers are supposed to be aware of the potential adverse connotation of high levels of promoter ownership and institute policies that are in tandem with the objectives of the long-term performance objectives. Likewise, ii and ri must strike their compromises on the best scale. According to such investment strategies, they promote and not restrict the performance of banks. It is by virtue of this that the collective bargaining power of ri is valuable; however, ii requires reviewing their power to achieve sustainable returns. This implies that the U-shaped relationship found between ii and ri can make critical observations on managers. Although their ownership increases in the short run, it can weigh heavily on the profitability because of the possible conflict or incompatibility with the operating goals. Conversely, beyond some point, their involvement can be stabilized or can positively change NIM depending on better governance or other congruency.
The management can also think of the ways it can tap the benefits of each of the classes of investors, such as the strategic savviness of ii and the diversification advantages, which can be offered by ri as a sustainable long-term growth plan. Finally, these lessons underline the necessity of having dynamic ownership management in order to maximize the profitability and firm value to the benefit of all stakeholders.
Therefore, an inverted-U-shaped association observed between Prom2 and mcap depicts a scenario whereby an increase in promoter ownership initially boosts bank value, but the level may exceed the point at which marginal returns may occur or even Indian bank value may fall. This also highlights the need to have optimal ownership by promoters in order to find the maximum value in banks, which demonstrates that firms with higher ri may have less impact on market value but after a certain level, ri has a positive effect on the bank value. This is an indicator of the growing role of ri in the capital market and how they can generate the performance of banks. Managers must understand that they have to include and attract ri and encourage free communication as a gesture of trust and long-term commitment.
Further, given that the relationships of ii, HHI, and mcap are not statistically significant, it implies that in certain circumstances, the direct effect of ii on bank value would be smaller. This finding can be interpreted by managers to ensure that the structure of ownership is better aligned with the intended aspirations of the performance of Indian banks. The results highlight the importance of balanced strategic decision-making by the bank management. The existence of nonlinear relationships implies that an increase in some structural or investor-related variables beyond an optimal level may not necessarily lead to an increase in the performance or market valuation of banks. Bank managers are therefore advised to aim at discovering and sustaining the best levels of promotion, investor mix, and market concentration instead of aggressive expansion and concentration strategy. Regular examinations and evidence-based assessment may allow banks to prevent inefficiencies due to their overexposure to a particular group of investors or overpowering market dominance.
Second, the findings provide policymakers the need to ensure that structures are put in place to create stability and efficiency within the banking sector. The effect of key variables is not the same throughout the levels, and therefore, policy interventions must be flexible and adaptive as opposed to being a one-size-fits-all approach. With policies that promote healthy competition, diversified involvement of the investors, and sustainable growth, banks will be able to perform at a level that is closer to their optimal performance.
Third, regulatory agencies like the RBI are able to draw conclusions on enhancing prudential regulation and supervision. The available evidence indicates that structural factors and investor dynamics play an important role in determining the performance of banks, and therefore, the regulators should not be applied merely to the conventional measures of risk but also to market and ownership structures. Regular monitoring of the levels of concentration and involvement of the investors would assist regulators in averting systemic risks. All in all, the implications provide a hint of the need to have the best balance, wise supervision, and knowledgeable rule. Indian banks can improve performance by harmonizing managerial strategies with the appropriate regulatory and policy frameworks, which will help maintain stability in the market and promote the development of the financial sector in the most sustainable way.
Conclusion
This article achieves twofold goals. The first goal is to comprehend the correlation among OC (ii, ri, prom, and HHI), mcap and NIM. The relationship between Prom2 and HHI2 is quite U-shaped, with the first part indicating that they positively relate to NIM and after the threshold the relationship is negative in both cases. Prom2 also presents an inverted-U-shaped relationship with the size of a firm, meaning that there is a point of decreasing benefit on mcap. Ri2, on the other hand, is positively correlated with mcap in an inverted-U shape, but the effect of ii2 and hhi2 is not significant. These findings demonstrate the necessity to have a better investment strategy and balanced OC and suggest that it can adversely affect performance and value above the optimal point. Indian banks find this study significant because it gives empirical evidence that nonlinearity exists among Indian OC, NIM, and mcap. Through the determination of threshold effects, the results allow bank managers and regulators to know when the prom, ii, ri, and HHI increase will increase performance. This is especially the case in the changing banking industry in India, which experiences ownership reforms, increased retail involvement, and competition. This article has a novel contribution in that it uses quadratic static panel models to analyze both NIM and mcap at once and shows that they both have U-shaped and inverted-U-shaped relationships. In contrast to linear studies, it provides the optimal levels of OC and subtle information on strategic decision-making and regulatory policy.
The changes that future research may explore involve more exploring industry and regional differences and including more environmental aspects, such as economic trends or regulatory reforms. There is also a possibility of further extension of nonfinancial aspects, such as ESG scores and CG, which will further widen the scope of the influence of the aspects of governance on performance. Such relationships will be determined by the identification of the time-varying variations that will be possible in long-term studies and dynamic models. However, the article has limitations. It is limited to a particular set of data and time, which is not always applicable across the board. Qualitative aspects such as the quality of leadership or approaches to the market were not taken into account, which might have overlooked some influencing factors. Moreover, the identified thresholds may vary among the firms or markets. This study is limited to the static model; in future research, we will employ a dynamic model and distributional modeling or 3-D graphical representation for more comprehensive outcome and interpretation. Lastly, the analysis does not consider the interaction over time between these variables. These gaps are to be filled in future research, which will give a clearer picture of what drives sustainable performance.
Footnotes
Declaration of Conflicting Interests
The authors declared no potential conflict of interest with respect to the research, authorship, and/or publication of this article.
Funding
The authors received no financial support for the research, authorship, and/or publication of this article.