
Abstract
This research empirically investigates the characteristics and dynamics of the transmission of volatility between India’s stock markets and the countries that provide the majority of its foreign direct investment (FDI), specifically Mauritius, Singapore, the United States, the Netherlands, Japan, the United Kingdom, the United Arab Emirates, Germany and Cyprus. The study has employed EGARCH and DCC-GARCH econometric models, taking into consideration the time period from April 2015 to March 2025. The EGARCH model’s results point to a statistically significant two-way volatility spillover between India and six of its FDI investor nations, alongside a unidirectional volatility spillover observed with three other FDI investor countries. Additionally, for every nation pair examined, the DCC-GARCH model results show the presence of dynamic or time-varying conditional correlations. These findings have important ramifications for academics, portfolio managers, international investors and policymakers in making investment and diversification strategies aiming at return maximization and risk mitigation. This is a unique and innovative work which seeks to find the dynamic volatility transmissions across Indian stock market with its top FDI investor countries, thus making an outstanding contribution to the existing literature.
Introduction
Deregulation of financial sectors as well as technological and communication advancements have led to increased connectivity, globalization and information sharing across the stock markets of the countries. While globalization and integration of stock markets enable a country to have various benefits such as increase in real investment, decrease in cost of capital, more employment, availability of advanced technology and economic growth, they may hype the stock market volatility, especially during the crisis period (Bae & Zhang, 2015). Foreign direct investment (FDI) is thought to be the most stable and safest way for capital to travel internationally, especially in lower-middle income nations. Chowdhury and Arefin (2017) recognized that developing markets are more interesting in comparison to developed markets for global investors because the latter are less integrated with the global economy. FDI represents an indispensable fuel for the development and advancement of many lower-middle income countries, leading to capital formation, employment generation and access to latest overseas knowledge in lower-middle income countries (Hanousek et al., 2011). Lower-middle income nations have historically presented an attractive opportunity for global portfolio investors seeking diversification benefits (Xuan Vinh & Ellis, 2018).
While foreign institutional investment (FII) is often short term, highly volatile and reversible investment into the financial markets of a country, FDI represents the long-term, stable fuel through sustained investments, supply chain linkages and technology transfers boosting the economic development of a country. FDI inflows not only reshape the economic make-up and development of domestic businesses but also foster connections between the home–host stock markets. Stronger FDI connections also enhance the synchronized movement of business cycles between the investing and recipient countries, consequently leading to correlated stock market movements.
FDI drives the volatility transmission across the stock markets through three key channels:
The information channel, which signifies that a shock in FDI home country provides a signal about the financial health of the FDI host country. The portfolio channel, which means that the volatility in the home country stock market leads investors to rebalance their assets across integrated markets. The real integration channel, which means the synchronized business cycles of home–host countries lead to correlated corporate earnings.
Thus, FDI creates a structural interdependence across the countries, making stock market movements more correlated.
India has experienced tremendous inflows of FDI since the financial reforms of the 1990s and has emerged as a top destination for FDI investors due to skilled labour force, low wages, tax exemptions and liberal FDI policies of the country. The top FDI investor nations in India are shown in Table 1, which is based on data from the Department for Promotion of Industry and Internal Trade (DPIIT), Government of India. Table 1 shows the amounts of FDI equity inflows for the financial years 2022–2023, 2023–2024 and 2024–2025. Also, the cumulative FDI inflows from April 2000 to March 2025 are given in Table 1. The ranks are calculated based on the percentage of FDI inflows by these countries in India to the total inflows from April 2000 to March 2025.
FDI Equity Inflows by Top 10 FDI Investors in India (Amount in US$ Million).
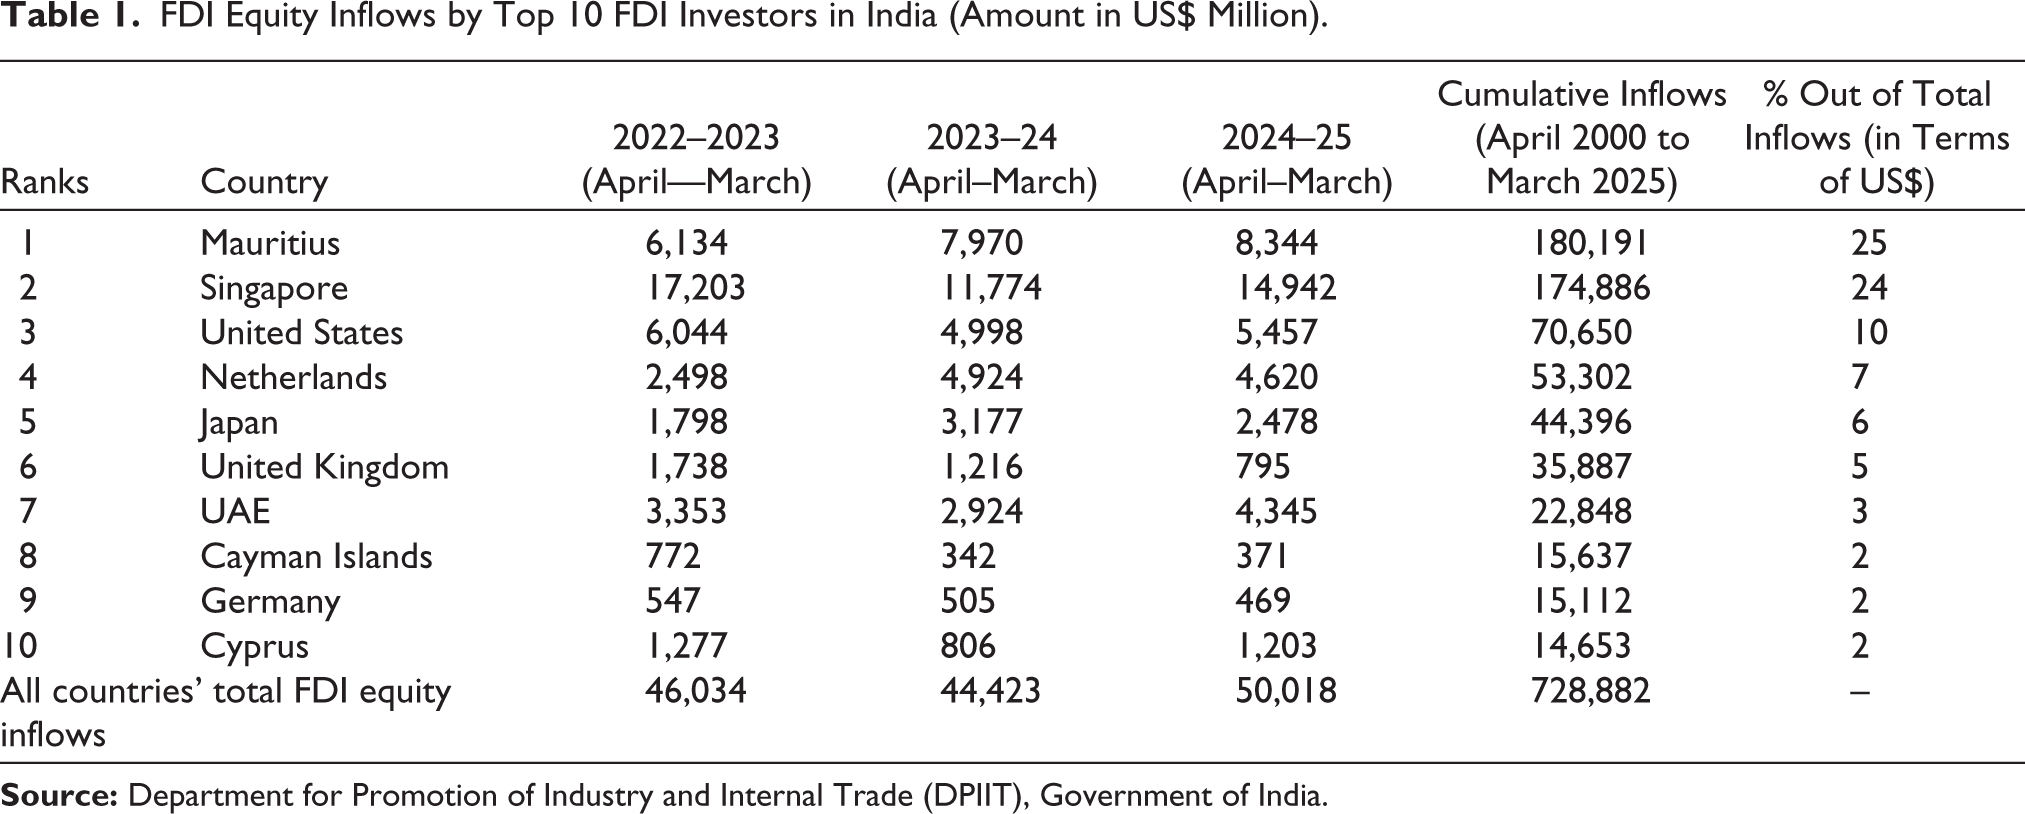
According to the data presented in Table 1, India’s primary FDI contributors are Mauritius, accounting for 25%; Singapore with 24%; the United States at 10%; the Netherlands providing 7%; Japan contributing 6%; the United Kingdom at 5%; the UAE at 3%; and the Cayman Islands, Germany and Cyprus at 2%.
Compared to other international economic activities, FDI arguably possesses the capacity to interconnect economies, thereby integrating global markets. However, limited research has explored the stock market linkages between countries with established FDI relationships. The current study aims to empirically examine the patterns and nature of transmission of volatility across the Indian stock market and those of its primary FDI origins in light of these factors. The stock markets incorporated into this investigation comprise Mauritius, Singapore, the United States, the Netherlands, Japan, the United Kingdom, the United Arab Emirates, Germany and Cyprus, selected due to their prominence as India’s leading FDI contributors, as detailed in Table 1. Stock price data for the Cayman Islands were unavailable, leading to their exclusion from the study. Our selection of top FDI partners (based on the cumulative FDI inflow data) aims to capture the strategic linkages, enabling the dynamic volatility spillover analysis between the stock markets of India and its FDI partners. Comprehending the prospect of volatility spillovers between India and these FDI-contributing nations will enable both domestic and global investors to more effectively predict the Indian economy’s financial and economic trajectory, thereby facilitating the full realization of international diversification advantages.
Research Objectives
The study has the following research objectives:
RO1: To investigate the characteristics of volatility transmission between India and its leading FDI investor nations. RO2: To analyse the evolving dynamics of volatility exchanges between India and its primary FDI source countries.
Research Hypothesis
The following hypotheses serve as the study’s guiding principles in light of the research objectives:
H1: There exists statistically significant volatility spillover between India and its top FDI investor countries. H2: There exist dynamic/time-varying conditional correlations for all the country pairs in the study.
This study employs two econometric models, the exponential generalized autoregressive conditional heteroskedasticity (EGARCH) and DCC-GARCH, to achieve its research objective of capturing asymmetric volatility aspects and estimating the time-varying/dynamic volatility transmissions between India and its primary FDI investors.
The organization of the rest of this article is as follows: the second section covers relevant published literature, and the third section outlines the empirical methodology. The fourth section covers the data sample and its preliminary characteristics, followed by the fifth section, which presents the analysis of results and discussion. The sixth section provides the study’s conclusion and implications, and the final section details its limitations and scope for future research.
Review of Literature
The interactions and volatility spillover effects among different international financial markets are the subject of numerous empirical research investigations. These studies suggest that the results of different studies in this area have not been consistent especially, when the investigations are in connection with emerging countries. Some important studies focusing on studying the volatility spillover across stock markets are given below:
Developed Versus Emerging Markets
There are various studies focusing on the transmission of volatility shocks from developed to emerging markets. A majority of these studies show that often unidirectional spillovers exist from advanced to emerging economies. Shahzad et al. (2017) used macroeconomic and fiscal factors to analyse return and volatility changes across Islamic equity markets and benchmarks in the United States, United Kingdom and Japan. Strong linkages were found by their VAR framework, indicating that Islamic stock markets do not act differently from conventional markets in times of fiscal or economic crisis. Alfreedi (2019) looked into the volatility spillover between established countries (United States, United Kingdom and China) and emerging markets (the UAE and Oman) in the GCC. The study identified significant self-induced shocks and volatility spillover in all analysed markets, with the United States significantly influencing the volatility of the UAE and Oman. It also reported a positive correlation among GCC markets, driven by shared variables. Efficiency, linkages and volatility transmission among major international and Asian stock markets (United States, United Kingdom, Japan, India and China) were investigated by Tripathi and Sethi (2019). Their results showed both long-term cointegration across all countries under study and short-term causal linkages emanating from the United States and the United Kingdom that impacted Asian markets. The transfer of volatility from the developed US economy to the developing ASEAN stock markets was examined by Vo and Tran (2020). Their analysis, which used an extended EGARCH model, found that over a period of almost 15 years, there was a notable transfer of volatility from the United States to these ASEAN markets.
Volatility Transmission During Crisis Versus Non-crisis Periods
The literature emphasizes that stock market integration often intensifies during the crisis or downturn period. Hung (2019) examined conditional correlations and volatility spillover across five stock markets in Central and Eastern Europe, including during the global financial crisis. The study found that cross-market volatility spillover was greater than the volatility dynamics of the individual markets and found statistically significant conditional correlations, demonstrating considerable market integration. Spulbar et al. (2020) investigated integration and spillover of volatility in seven developed and five emerging stock markets. Significant market volatility with leverage effects was found in their investigation, with markets including the United States, Hungary, India, Germany and Canada showing especially significant positive volatility in the wake of the global financial crisis. Using asymmetric GARCH frameworks, asymmetric volatility exchange in developing Asian stock markets was investigated by Habiba et al. (2021). In addition to considerable bidirectional and asymmetric volatility transmission across the majority of analysed markets, their research revealed significant self-induced volatility spillover for each market, highlighting increasing integration during crisis situations. The return and volatility spillover between India and the major Asian (China, Japan, Singapore and Hong Kong) and global (United Kingdom and United States) equities markets was examined by Mishra et al. (2022). They found that poorer co-integration during economic downturns reflected lower investor confidence in lower-middle income countries and emphasized India’s link with the United States and Hong Kong.
Methodological Approaches in Spillover Research
The findings are significantly impacted by the methodological choices of the researchers. Advanced GARCH models dominate the recent research work. Nishimura et al. (2015) applied the FIGARCH model to show how China has a significant impact on the Japanese stock market, especially through Japanese companies that have close relationships to China. The results emphasized that the information exchange was more noticeable in returns than in volatility, and as China’s economy grew, the impact of spillovers became more intense. Peng et al. (2017) in their study employed the Bi-EGARCH model and highlighted that Taiwanese and Japanese stock markets have a steady, long-term volatility relationship. Due to mutual price sensitivity, the markets show reciprocal price leadership and negative volatility spillover, rendering both markets extremely vulnerable to crashes that start in the other.
The Diebold and Yilmaz (2012) spillover index was used by Qarni and Gulzar (2018) to map the transmission of returns and volatility from the Chinese stock market to important trading partners. They discovered that return transmission happened more quickly than volatility and that spillovers became more intense amid the instability on the Shanghai stock exchange. Mensi et al. (2021) employed the generalized VAR framework of Diebold and Yilmaz (2012) and Diebold and Yilmaz (2014) to distinguish between ‘good’ and ‘bad’ volatility in their analysis of asymmetric volatility connections across 16 international stock markets. The United States, India, Korea and Indonesia were identified as major volatility transmitters, and they discovered that ‘bad’ volatility predominated. They also noted that macroeconomic shocks exacerbated volatility asymmetry, especially among growing Asian economies. In order to find chances for diversification, Yadav et al. (2023) used the Granger causality and the DCC-GARCH model to assess the effects of Chinese stock market spillovers on emerging economies. Throughout the whole study period, their research found bidirectional causality between China and Indonesia, with both short-term and long-term Chinese market effects passing to Indonesia’s market, indicating possible diversification benefits.
Apart from these mentioned studies, there are various other studies which have investigated the volatility linkages and co-movements across international financial markets. Studies such as Baele (2002), Bhar and Nikolova (2009), Nath Mukherjee and Mishra (2010), Tripathi and Sethi (2010), Xiao and Dhesi (2010), Yilmaz (2010), Graham et al. (2012), Sakthivel et al. (2012), Zhou et al. (2012), Todorov and Bidarkota (2013), Li and Giles (2015), Mohammadi and Tan (2015), Rejeb and Boughrara (2015), Jebran and Iqbal (2016), Bakry and Almohamad (2018), Obadiaru et al. (2018), Uludag and Khurshid (2019), Ahmed et al. (2022), Irshad et al. (2021) and Sheng et al. (2024) have continuously shown that there are linkages between stock market volatility in the global financial system.
The empirical financial literature extensively covers studies on stock market interconnections. This study is different from the previous studies in three ways. First, the studies exploring the integration of Indian stock market with its top FDI investor countries are limited. This is a unique and innovative work which seeks to find the dynamic volatility transmissions across Indian stock market with its top FDI investor countries rather than with the trading partners. The results of this empirical work will methodically benefit the prospective domestic and international investors in decisions concerning portfolio formulation and diversification in lower-middle income country like India. Second, this study has applied two advanced GARCH models, namely EGARCH and DCC-GARCH, to capture rich aspects of volatility dynamics across these markets. Third, the study’s findings can be generalized because it is based on more recent and relatively lengthier data spanning the period from April 2015 to March 2025. This study aims to close the gap in the literature in this pursuit by offering the empirical validation of Indian stock market integration with its top FDI investor countries by adopting longer and latest data samples and applying advanced econometric methodologies.
Empirical Modelling
In today’s financial landscape, information moves rapidly through stock markets. This swift flow means that changes in stock market index returns, transaction prices and trading volumes can lead to spillover effects, which are typically interactive. Statistically, stock index returns often exhibit a non-normal distribution, characterized by leptokurtosis and fat tails, along with heteroskedasticity and volatility clustering. Consequently, traditional regression models, assuming normality, may fail to accurately capture real market conditions, potentially yielding biased estimations.
Understanding unobservable volatility, Engle (1982) presented the ARCH model to account for time-varying conditional variance, which Bollerslev (1986) then generalized into the more efficient GARCH model. However, GARCH could not account for asymmetric volatility or leverage effects, prompting Nelson (1991) to develop the EGARCH model, capable of detecting these directional shock impacts. To address market co-movements, multivariate extensions emerged, notably Bollerslev’ (1990) CCC-GARCH, which assumes constant correlation, and Engle’s (2002) DCC-GARCH, offering a dynamic correlation estimation for analysing interconnected financial series. Very large correlation matrices can be estimated using the DCC-GARCH model since the parameters governing the correlation process operate independently of the specific series being correlated.
The study utilizes two empirical models:
To comprehend asymmetric volatility spillover effects across stock markets, we use Nelson’s (1991) EGARCH model. To examine time-varying volatility dynamics in the stock returns of the sampled nations, we use the DCC-GARCH model (Engle, 2002).
EGARCH Model
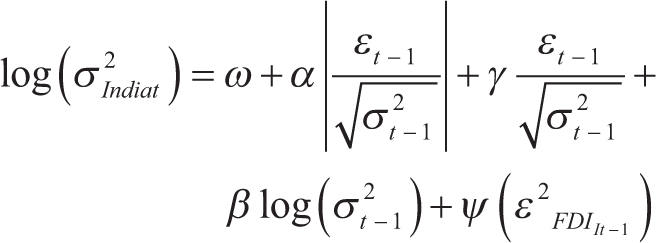
The bivariate EGARCH model, which Nelson put forward in 1991, has been applied in this study to investigate the kind of volatility in the return series as well as to assess the effect of volatility spillover across India and the stock price return series of each of its FDI partners separately. This model extends the standard GARCH model, which is symmetric and thus unable to capture asymmetries or leverage effects, a phenomenon observed as a correlation between past returns and future volatility in a series. The EGARCH model helps in quantifying the asymmetric responses of estimated conditional variance due to innovation or volatility shocks, thereby allowing the testing of long-term and short-term volatility spillover impacts. It is believed that an adverse or negative news has a more pronounced reaction on any financial market than any good or positive news. The EGARCH model facilitates the measuring of the impact of both symmetric and asymmetric shocks on volatilities along with measuring the shock’s magnitude. The conditional variance equation specification of EGARCH model (see Brooks, 2014) is given in Equation 1:
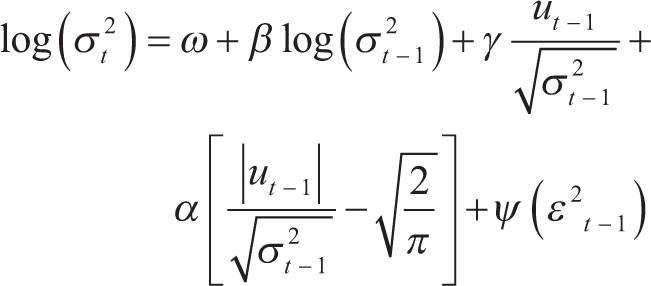
In Equation 1, log (σt2)is the log of the conditional variance. It ensures that variance is positive all the time in spite of the negative parameters. ω denotes the constant level of volatility. β quantifies the volatility persistence and is a function of volatility itself. A higher value of β indicates that the market remains volatile for a long time followed by a shock (Alexander, 2009). The parameter γ captures the asymmetric or leverage impact of volatility, and its negative and significant value shows that asymmetric or leverage effects are present in the model, providing the signal that negative news generates greater market volatility than positive news. The ‘GARCH’ effect, or the model’s symmetric effect, is measured by α, which solely measures the volatility’s response to good news. The cross-market volatility spillover, that is, the transmission of volatility from one stock market to another, is quantified by ψ.
DCC-GARCH Model
R. F. Engle in 2002 introduced the multiple-variate DCC-GARCH model, which is utilized to represent the dynamic relationship across stock market index volatilities. It is an important technique to estimate the time-varying conditional correlation between two or more series exhibiting the real-world conditions, where market integration is not fixed or stagnant but varies based on worldwide economic sentiments. In this model, first, the conditional variance is computed for all series using the univariate GARCH; thereafter, using the obtained standardized residuals, the coefficients of dynamic conditional correlation matrix are estimated. The expression for the DCC-GARCH model is:
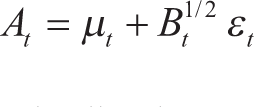
Where εt is the standardized returns vector, Bt is the multi-variate conditional variance, μt is the conditional returns vector and At is a vector of prior observations. The variance–covariance matrix explains the model’s GARCH component as follows:

where 
The matrix Dt is always positive as its parameters are always positive. Also, as Ct represents correlations, its value is ≤1. This matrix is divided into two matrices to ensure that Ct is positive. The DCC-GARCH structure includes the DCC(x, y) structure specification as the second stage, which is expressed as:
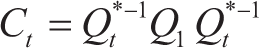
where,
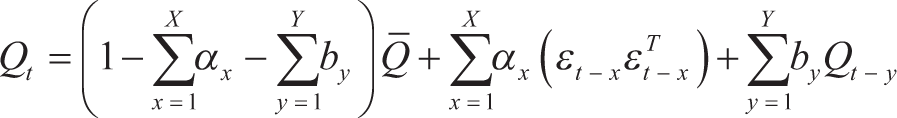
Q1 = qijt is a conditional variance-covariance matrix derived from standardized residuals.
Q̄ = Q̄ is the unconditional covariance matrix of the standardized errors εt obtained from estimating Equation 2.
Qt*–1 = It is the diagonal matrix constructed with the square root of the diagonal elements from Qt.
This study emphasizes on Ct, which is
Data and Preliminaries
Data Sample
The present study is an empirical work based on daily prices of stock indices of India and its main FDI investors, namely Mauritius, Singapore, the United States, Netherlands, Japan, the United Kingdom, the UAE, Germany and Cyprus. The study has utilized commonly accepted benchmark indices for all included countries, as these indices accurately represent their respective overall equity markets.
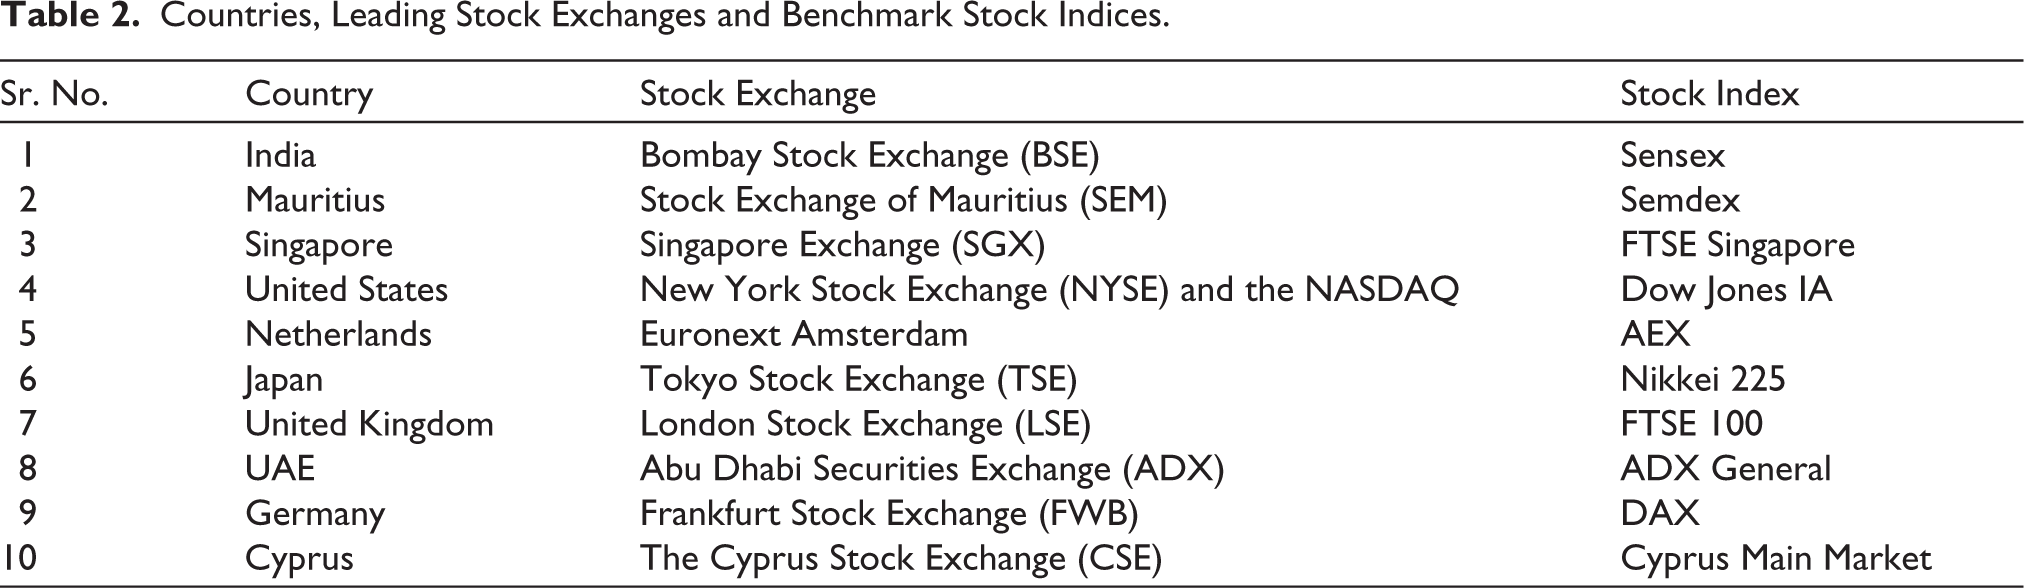
The study has used the benchmark index of India, that is, Sensex, over other broader indices so as to ensure consistency with the benchmark indices of the FDI partner countries. The closing prices of all these indices are collected from two sources, Bloomberg and investing.com. The data collected cover a fairly longer time period from April 2015 to March 2025. Data for all indices are collected in the domestic currency to prevent challenges associated with exchange rate fluctuations. Table 2 provides a list of the stock indices used, along with the corresponding stock exchanges where these indices are traded.
Countries, Leading Stock Exchanges and Benchmark Stock Indices.
Data Preliminaries
Initially, descriptive statistics are computed for the returns of all stock indices. The difference between day ‘n’ and day ‘n − 1’ in the natural log of closing prices is used to compute returns. Table 3 displays the descriptive statistics that were calculated.
Descriptive Statistics of Stock Returns.
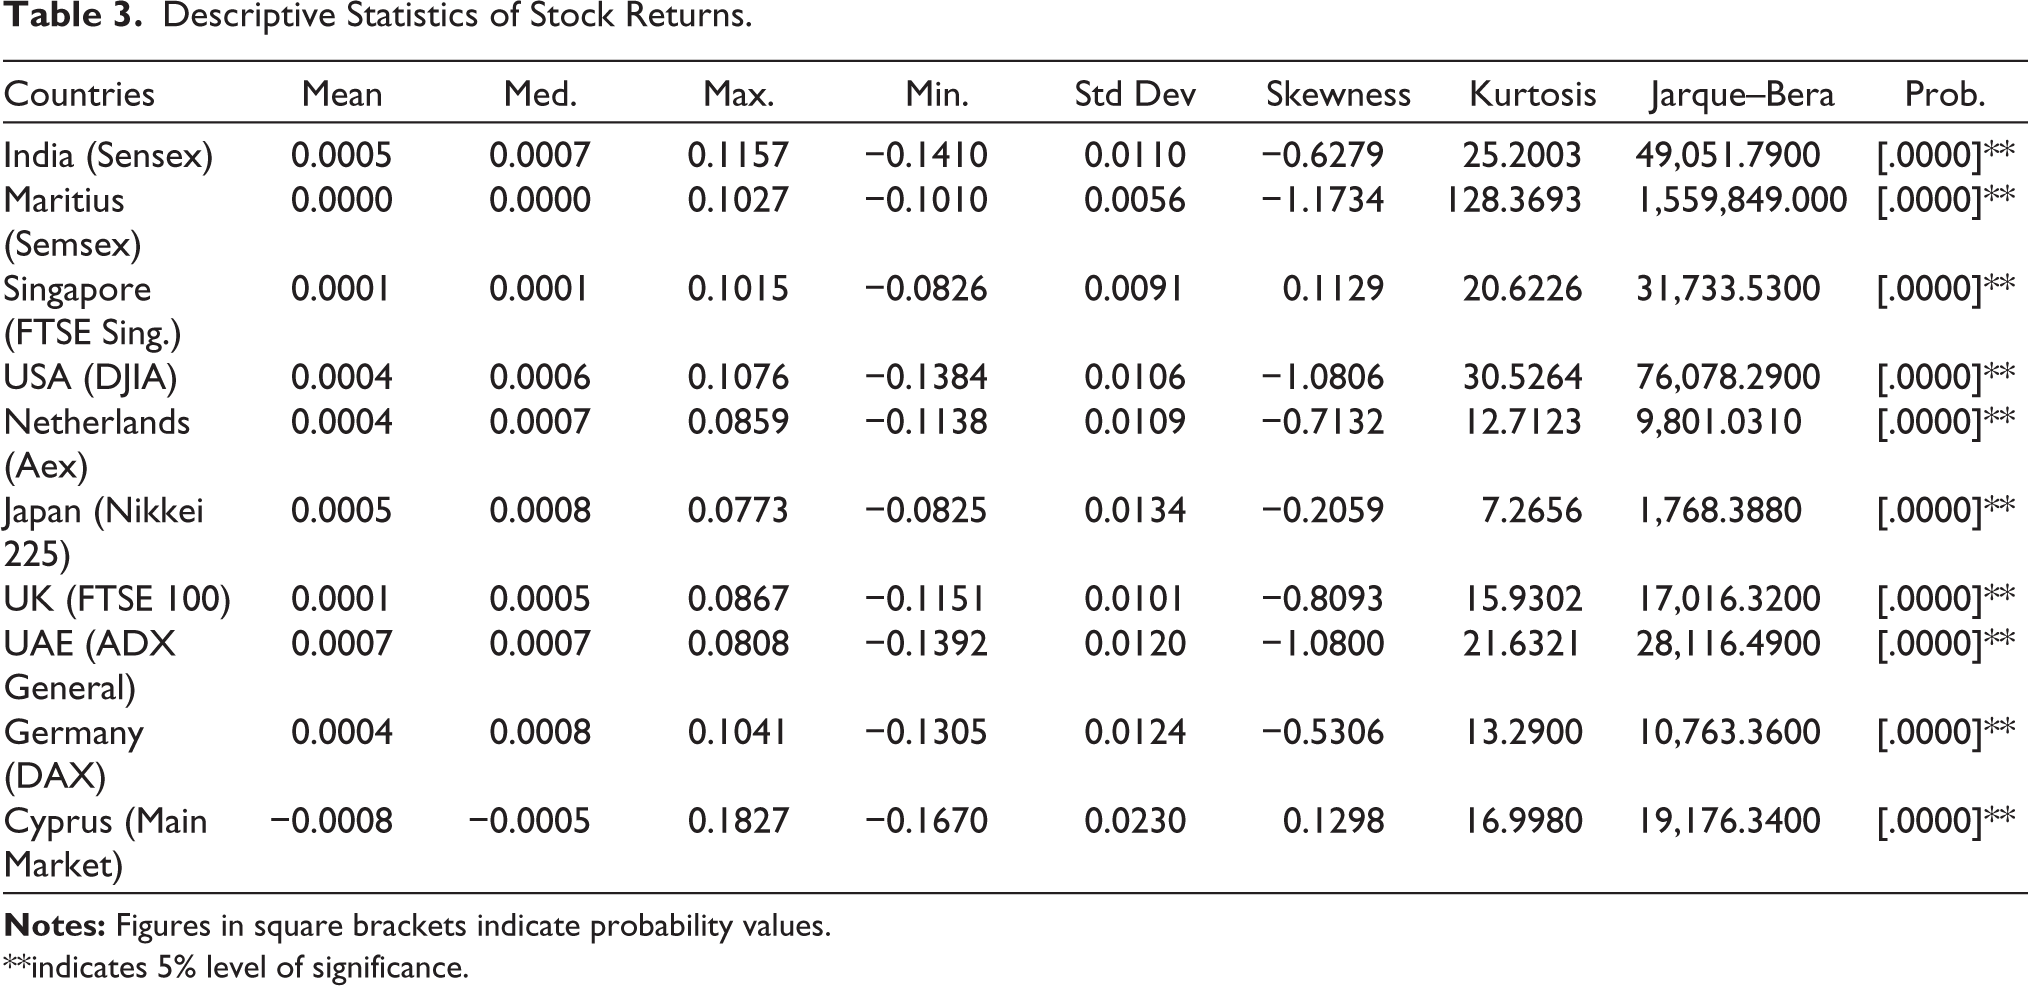
**indicates 5% level of significance.
The outcomes of descriptive statistics for stock index returns of all countries under study are displayed in Table 3. The analysis reveals that all stock return series exhibited a positive sample mean, with the sole exception of Cyprus. According to the standard deviation figures, the stock markets in Mauritius have the lowest standard deviation (0.0056) and Cyprus has the highest (0.0230) daily standard deviation. It shows that the Cyprus stock market exhibits the highest volatility and the Mauritius stock market is the least volatile. Though Cyprus is exhibiting negative returns, still it has been included in the analysis as it adds to the robustness and diversity of the multi-country spillover analysis. In accordance with the kurtosis values, all series demonstrate leptokurtosis, which suggests that their return distributions have fat tails and sharp peaks. For all return series, the non-normal distribution is also confirmed by the Jarque–Bera test statistic.
To check for stationarity in the return series, the augmented Dickey–Fuller (ADF) unit root test has been used with both trend and intercept. By performing an ARCH Lagrange multiplier (LM) test on the residuals derived from the least squares regression, the study evaluates the existence of ARCH effects in the return series. The Spearman’s correlation metric is used to examine how similar the co-movement patterns of the stock market are. Table 4 displays the outcomes of each of these three tests.
Results of ADF Unit Root Test and ARCH-LM Test.
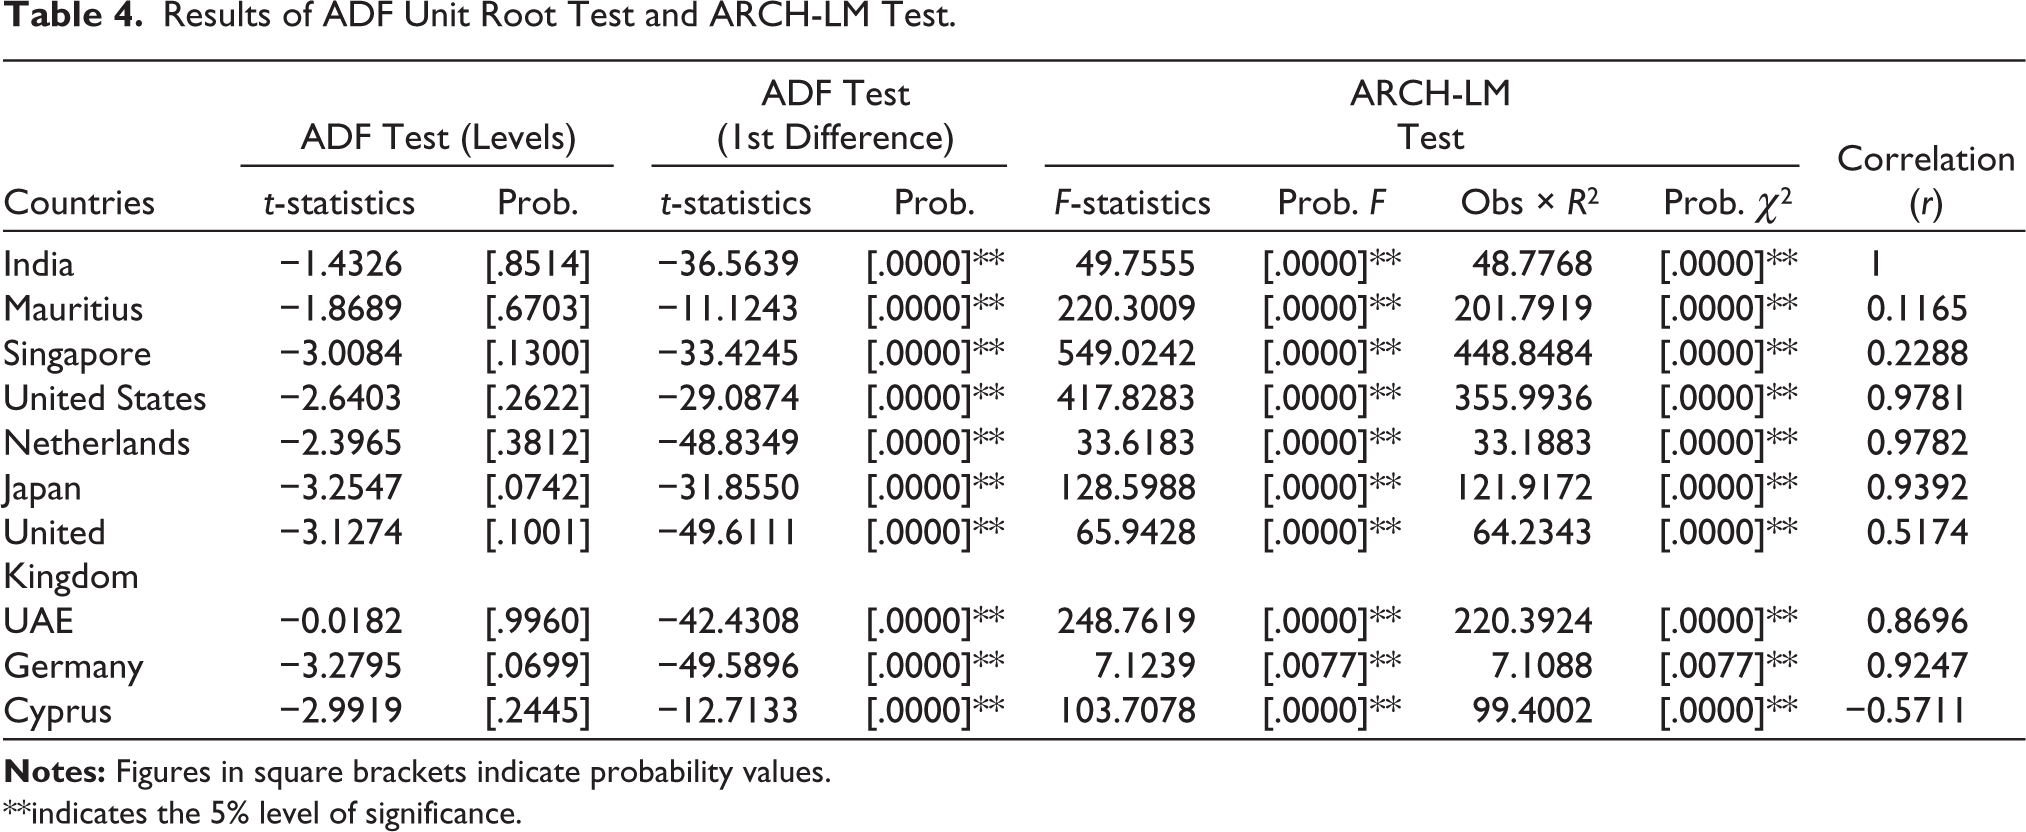
**indicates the 5% level of significance.
Table 4 shows that, according to the ADF test statistic, the return series for all stock indexes are stationary and integrated of the order one. The ARCH-LM test results show the presence of strong ARCH effects across all indices, confirming that the data reveal time-varying volatility clustering and that the residuals remain heteroskedastic. These compelling data support the applicability of GARCH family models for examining the relationships between price volatility in these stock markets.
The co-movement patterns of various markets with regard to India can be significantly inferred from the Spearman’s correlation coefficient (r). According to the findings, India’s stock market has the strongest positive association with those of the United States and the Netherlands, followed by Japan and Germany. On the other hand, there is a negative link between the Cyprus stock market and the Indian stock market. These results imply that the Indian stock market is integrated with the international stock markets.
To check the statistical validity of the model, the study has applied the partial autocorrelation function (PACF) and lag length selection for all country pairs. The optimal lag length is determined using Akaike Information Criterion (AIC) and Schwarz Information Criterion (SIC). For all nine FDI partner nations, both criteria (AIC and SIC) consistently identified Lag 1 as the optimal specification for the return series. The PACF plots further validated the findings, showing that the first lag was significant and subsequent lags suggested no further linear dependency in data. The ARCH-LM test results confirm that the AR(1) specification successfully removed the autocorrelation from the returns, showing that any remaining volatility was due to the time-varying clustering rather than the linear lag effects. Accordingly, the EGARCH (1,1) model has been employed in the study for capturing the dynamic volatility transmissions without the risk of over-parameterization.
The models were estimated using the maximum likelihood estimation (MLE) method assuming the student-t distribution. As the results of descriptive statistics show high kurtosis and non-normal distribution of return series, the above methods will lead to more robust and unbiased volatility spillover estimates. All econometric computations are performed using EViews 13 and R-Studio. To ensure the reliability of the results, the study has also applied the ARCH-LM test to confirm that no heteroskedasticity is left in the residuals and GARCH effects are successfully captured. Also, applying the PACF and lag length selection using AIC and SIC makes the results more reliable.
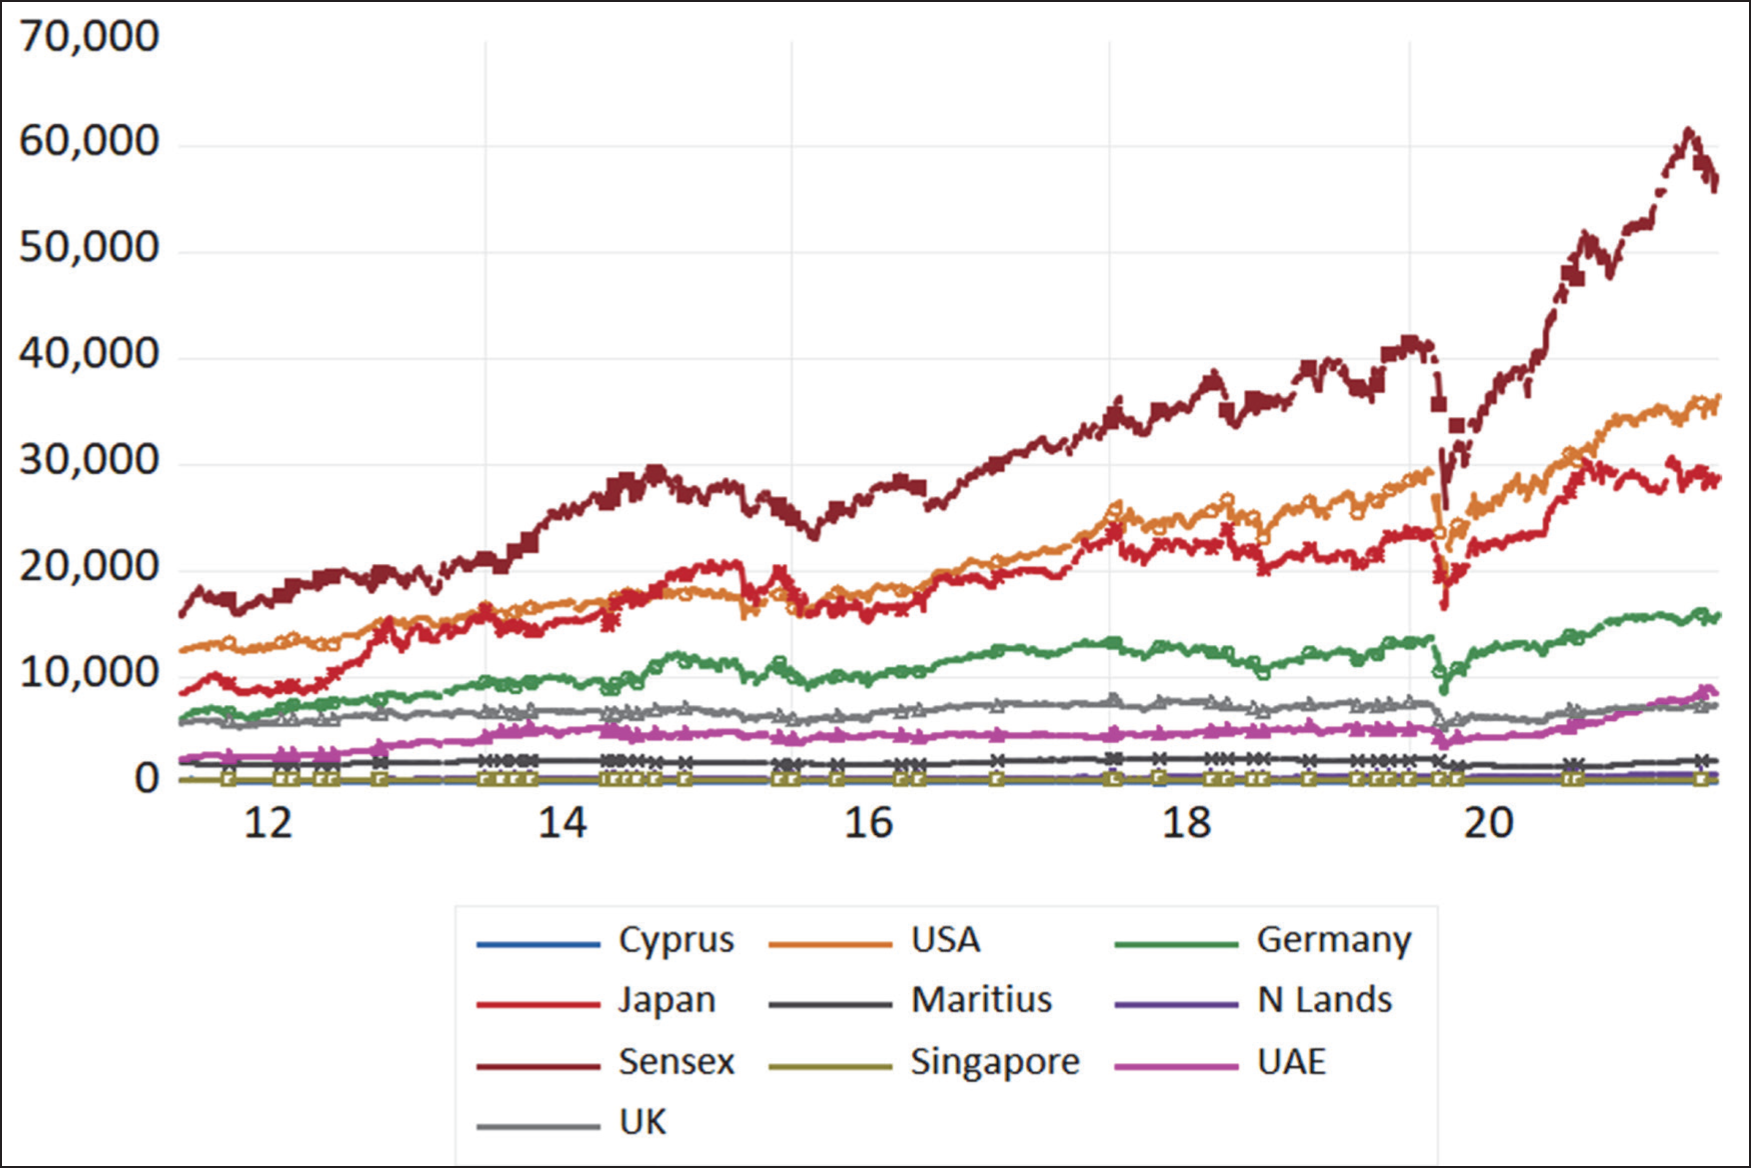
The data of stock market price series of India as well as its nine FDI investor countries are plotted in Figure 1. It can be observed from the figures that all 10 stock markets under study follow approximately similar movements over the study period.
Plots of Daily Data of Stock Prices of India and Its Nine FDI Investor Countries.
Data Analysis and Results
In this section, data analysis and detailed discussion of the empirical results are provided.
Results of the E-GARCH Model
Following the preliminary data tests, a bivariate EGARCH model was utilized to evaluate the asymmetric volatility spillover. This EGARCH model was applied individually to each pair of stock return series, analysing India alongside each of its FDI investor countries. Volatility spillover is analysed in two directions: from India to FDI investor and from FDI investor country to India. This is achieved through two EGARCH equations:
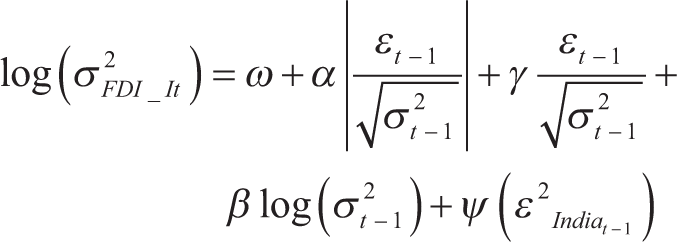
The mentioned EGARCH model gauges the influence of the lagged square error term from one country’s stock market returns towards the conditional volatility of the other country. To estimate this lagged square error term for one country, a mean equation is applied to the other country’s equation. This estimated squared error term is then incorporated into the EGARCH model as an exogenous regressor. The equations’ ψ parameter measures the amount of volatility spillover between the two stock markets; if it is determined to be significant, it signals a significant amount of volatility spillover. Table 5 displays the estimated outcomes of the bivariate EGARCH model.
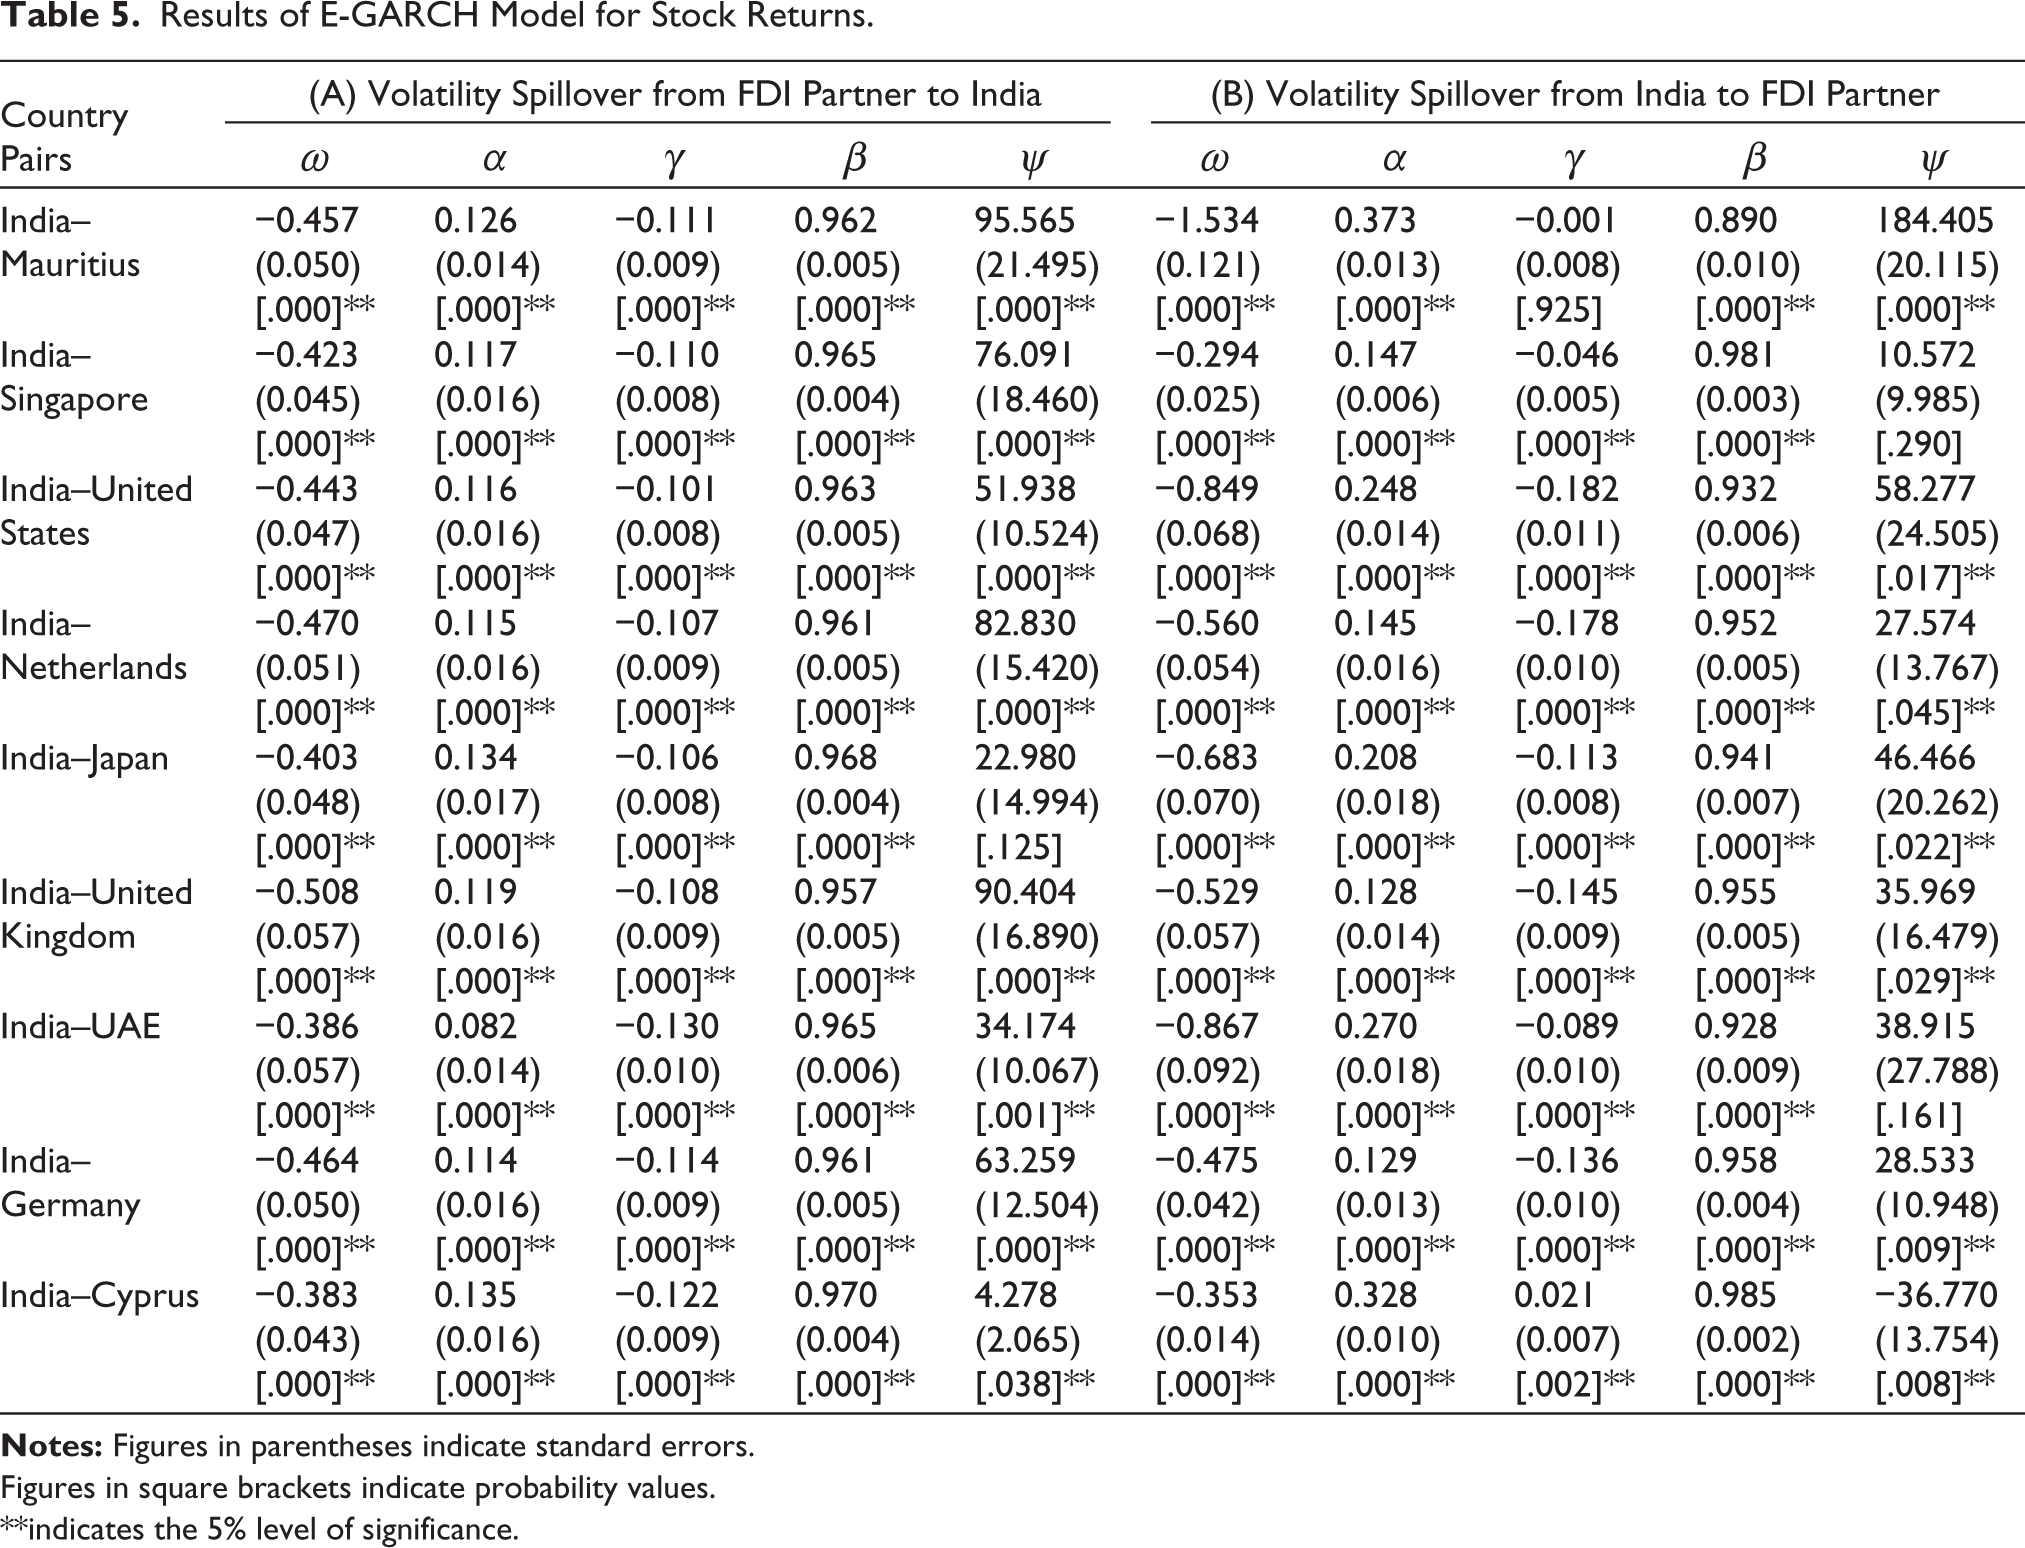
Results of E-GARCH Model for Stock Returns.
Figures in square brackets indicate probability values.
**indicates the 5% level of significance.
For each stock market pair, the estimation results of the EGARCH model are shown in Table 5. The volatility spillover from the FDI investor countries to India is seen in Panel A, on the left. On the other hand, Panel B, which is located on the right, shows how India’s volatility affects its FDI investors. A number of noteworthy findings have been disclosed by our studies. In particular, we discovered statistically significant bilateral volatility spillover between India and six of its FDI investor nations: Mauritius, the United States, the Netherlands, the United Kingdom, Germany and Cyprus. It suggests that the Indian stock market will be more volatile the next day if there is an external shock in these nations. In the same way, an unexpected shock in India will also increase these nations’ volatility the next day. The bidirectional volatility spillover shows that shocks from other markets have an impact on one market’s conditional variance and vice versa. Due to FDI inflows and global trade among these economies, this indicates a substantial level of interconnectedness between the stock markets of India and these six nations. It leads to the conclusion that India is both the transmitter and the receiver of volatility for these countries. The strong integration between India and these six markets suggests that investors may find no significant diversification benefits.
Furthermore, a unidirectional volatility spillover exists from Singapore and the UAE towards India, indicating that any sudden shock or change in these two nations will lead to volatility in India’s stock market the following day. This confirms India’s position as a recipient of volatility from Singapore and the UAE.
Conversely, one-way volatility spillover is present from India to Japan. This implies that Japan’s stock market is responsive to volatility in the Indian market, positioning India as a net transmitter of volatility for Japan.
The volatility patterns observed from the results provide significant insights regarding India’s integration with the global markets. The bi-directional volatility spillover between India and six of its FDI partners, namely Mauritius, the United States, the Netherlands, the United Kingdom, Germany and Cyprus, suggest mature or deep integration. India is not only the recipient of volatility from these countries but is also capable of exporting its volatility back to these major global stock markets, indicating co-movement equilibrium where shocks are shared interactively. A unidirectional volatility spillover from Singapore and the UAE towards India suggests capital hub dependency. Any shock from these markets will impact the capital supply in India, but domestic shocks will not destabilize these global FDI capital-supplying hubs. Interestingly, one-way volatility spillover from India to Japan emphasizes India’s growing importance as a net transmitter of volatility in the Asian region, indicative of India’s regional leadership where Japanese investors are highly sensitive to India’s growth signals.
A comparative analysis of the magnitude of the spillover coefficients (ψ) clearly reveals the intensity of the volatility transmission between India and its FDI partners. Regarding inward spillovers, Mauritius (95.565), the United Kingdom (90.404), the Netherlands (82.830) and Singapore (76.091) exert most substantial volatility spillovers in India, followed by Germany and the United States as moderate intensity partners and the UAE, Japan and Cyprus as low-intensity partners. Regarding outward volatility spillovers, the magnitude of India exporting volatility to Mauritius is the highest (184.405), signifying that Mauritius is super-sensitive to India’s shocks, with India exerting massive magnified impact on the Mauritian market. As Mauritius is the largest FDI supplier to India, it plays a significant role as a specialized investment channel for Indian capital. The volatility weight analysis shows that in the case of countries such as Singapore, the Netherlands, the United Kingdom, Germany and Cyprus, India is the net receiver of volatility, whereas in the case of countries such as Mauritius, the United States, Japan and UAE, India is the net transmitter of volatility.
A noteworthy finding is the negative and statistically significant volatility spillover from India to Cyprus with the spillover coefficient (ψ) being –36.770 and p < .05 in contrast to the positive spillover coefficient for all other studied country pairs. It highlights the ‘decoupling effect’ signifying that when there is a volatility shock in India, Cyprus does not mirror it; rather it moves in the opposite direction. The fact is also validated from the negative correlation coefficient (r) between India and Cyprus (−0.5711), as shown in Table 4, highlighting that both markets are negatively correlated. This unique finding suggests that investors may choose Cyprus for portfolio diversification for risk mitigation as co-movement equilibrium is not shared between these two countries, as is the case with all other country pairs.
The negative and significant value of parameter γ in the case of all studied combinations (except from India to Cyprus) highlights that the volatility spillover mechanism is asymmetric and leverage effects are present, thereby providing clear evidence that during the study period, negative news significantly amplified volatility in these countries more than positive news did. The value of the coefficient β is very high, that is, close to 1, and also significant for all the stock market pairs, meaning that volatility persistence is high with shocks fading away slowly. Thus, it may be specified that current innovations retain their significance for all future conditional variance forecasts.
Therefore, we fail to reject H1, which posits the existence of a significant volatility spillover between India and its primary FDI investor nations. This conclusion is drawn from the presence of either bidirectional or unidirectional volatility spillover observed across all country pairs in our study.
Results of the DCC-GARCH Model
The dynamic, time-varying correlation between the conditional variances of stock returns for India and its FDI investor nations is measured in this study using the DCC-GARCH model. Table 6 displays the DCC-GARCH model’s estimated results.
Results of the DCC-GARCH Model of Stock Returns of India with Its FDI Partners.
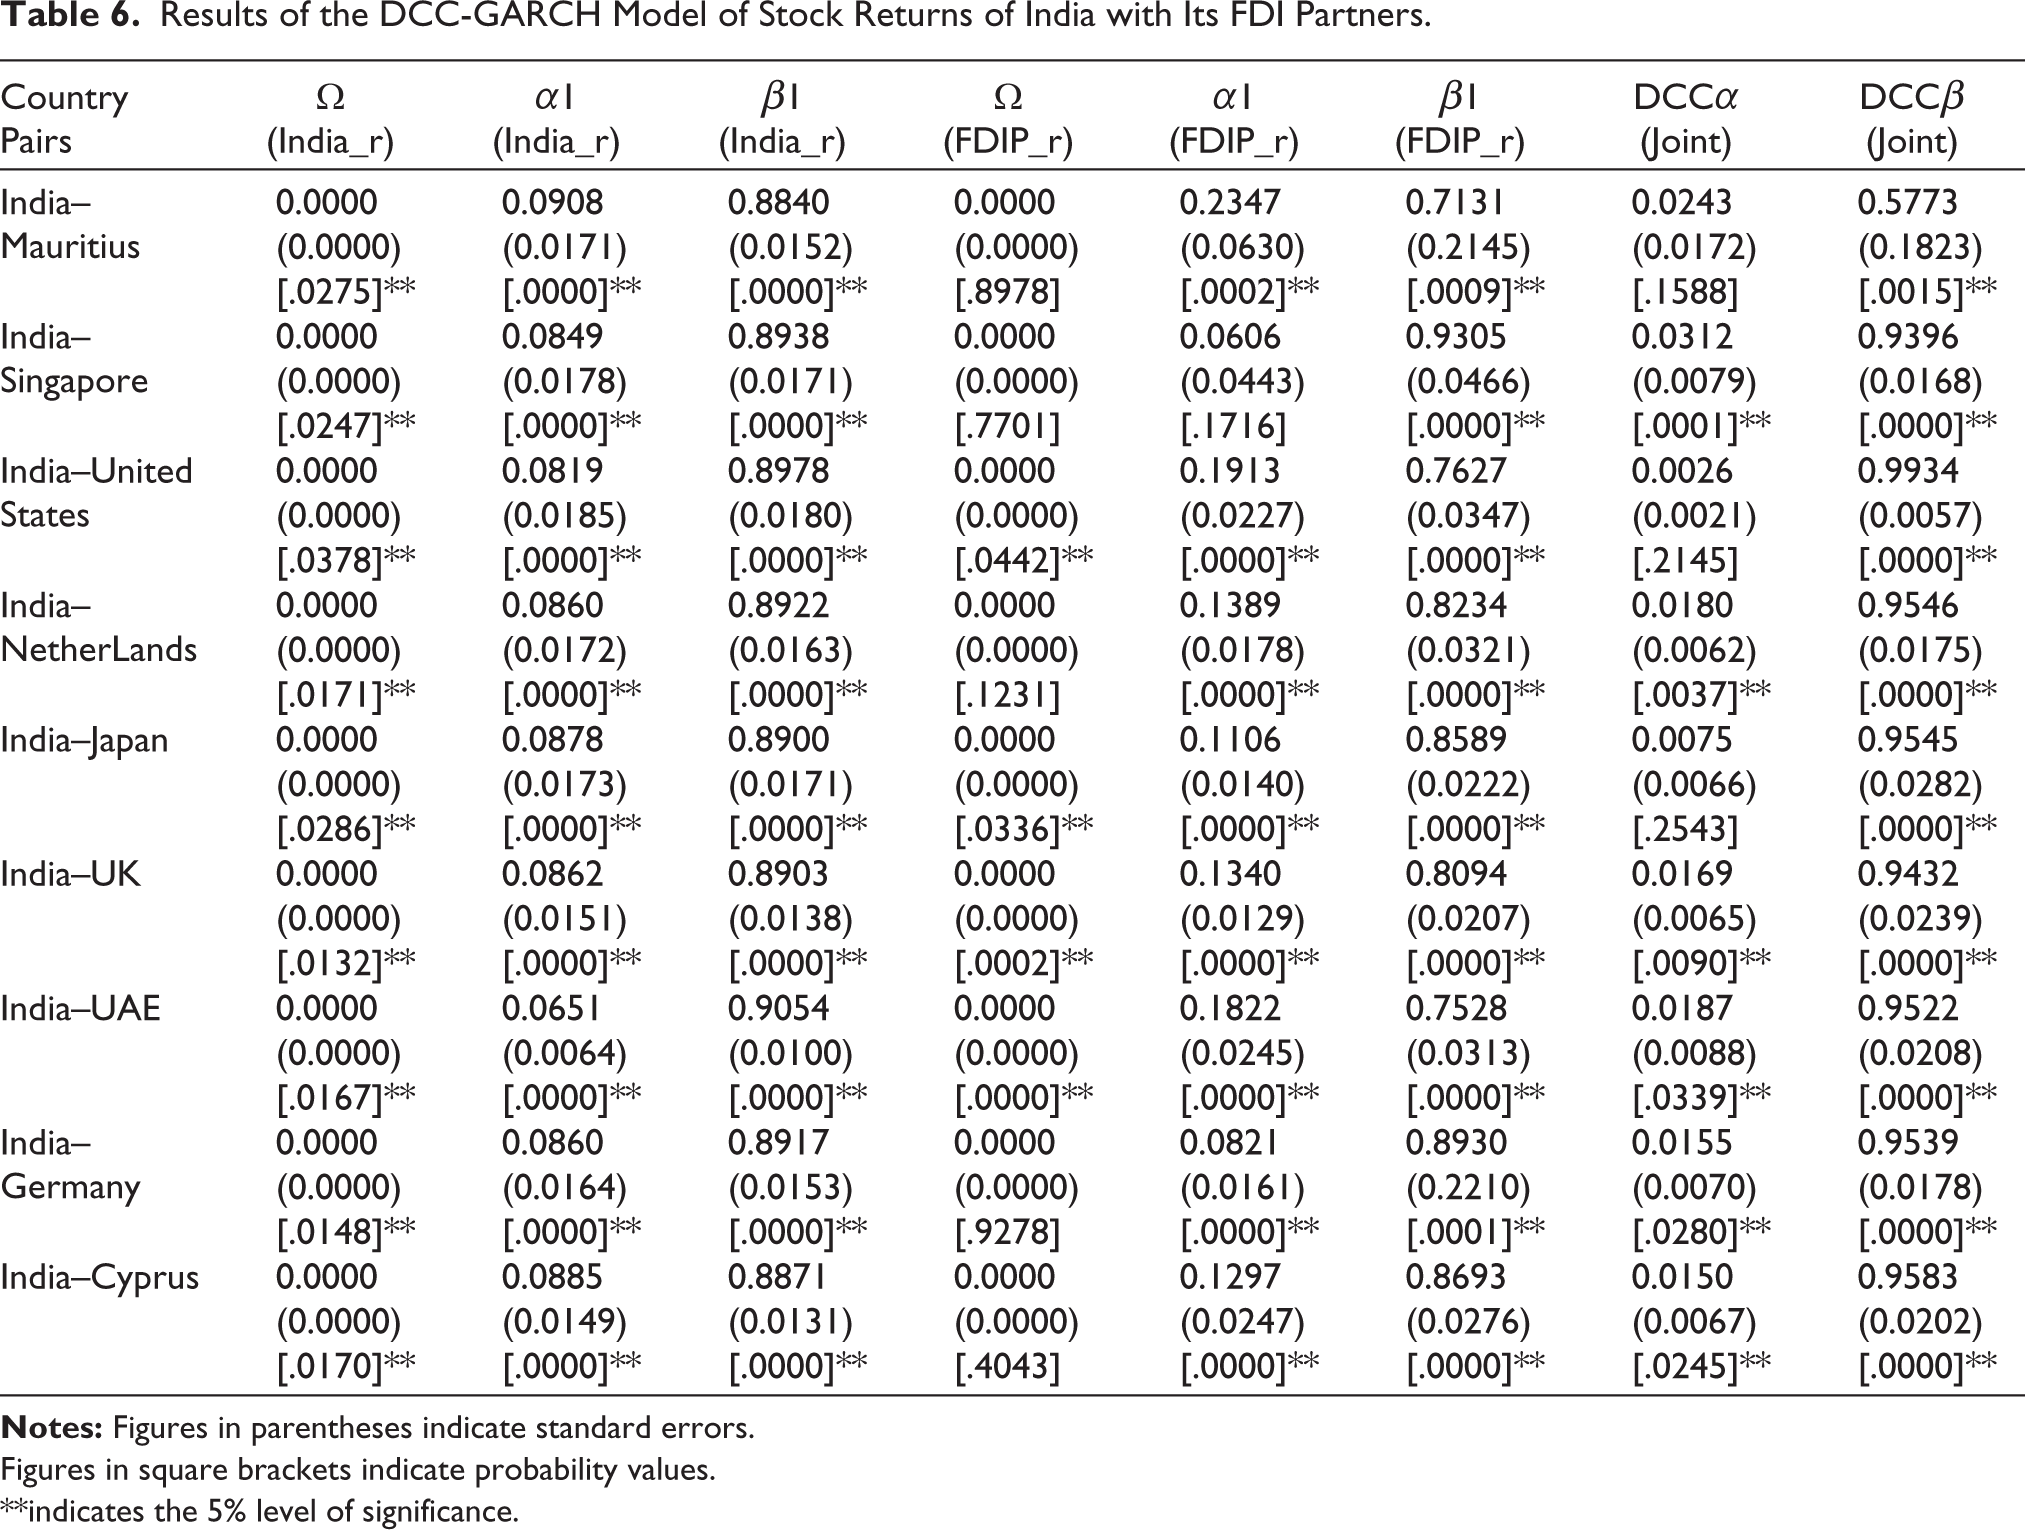
Figures in square brackets indicate probability values.
**indicates the 5% level of significance.
The values of the DCC-GARCH model’s calculated parameters for the nine pairs of stock index returns under study are displayed in Table 6. The univariate GARCH model’s ARCH and GARCH terms are denoted by the parameters α1 and β1, respectively. The findings of the GARCH(1,1) model indicate that the sum total of the α1 and β1 coefficients is nearly equal to 1. This implies that conditional variances have a high degree of persistence, which means that volatility shocks typically endure and dissipate slowly. DCCα (joint) is a significant parameter, indicating volatility spillover due to surprising shocks. In the DCC estimation, DCCα (joint) is significant for six countries, including Singapore, the Netherlands, the United Kingdom, Germany, the UAE and Cyprus, signifying significant volatility spillover from unexpected shocks. However, it is not significant for Mauritius, United States and Japan. DCCβ (joint) captures the degree to which previous correlation affects the transmission of volatility between the conditional variances of the two markets. The coefficients of DCCβ (joint) are found to be positive and significant in the case of all nine country pairs studied. It confirms that dynamic/time-varying conditional correlations are present for all the country pairs used in the study. It leads to the conclusion that a significant volatility spillover is present across the country pairs, and thus, the stock markets maintain co-movement equilibrium. There is significant time-varying co-movement, so when one market has volatility, it causes disruptions in the counter-market. Additionally, the DCCα coefficients are smaller and positive than the DCCβ coefficients, and their sums get closer to 1. It demonstrates that for all pairwise estimations, the conditional volatility has a very persistent nature. The model’s process is also non-mean-reverting, indicating that the dynamic correlation does not return to its long-term unconditional level following a stock market shock. Since this dynamic spillover is present in all of the nation pairs that we looked at, we fail to reject H2, which suggests a strong time-varying/dynamic volatility spillover between India and its top FDI investors.
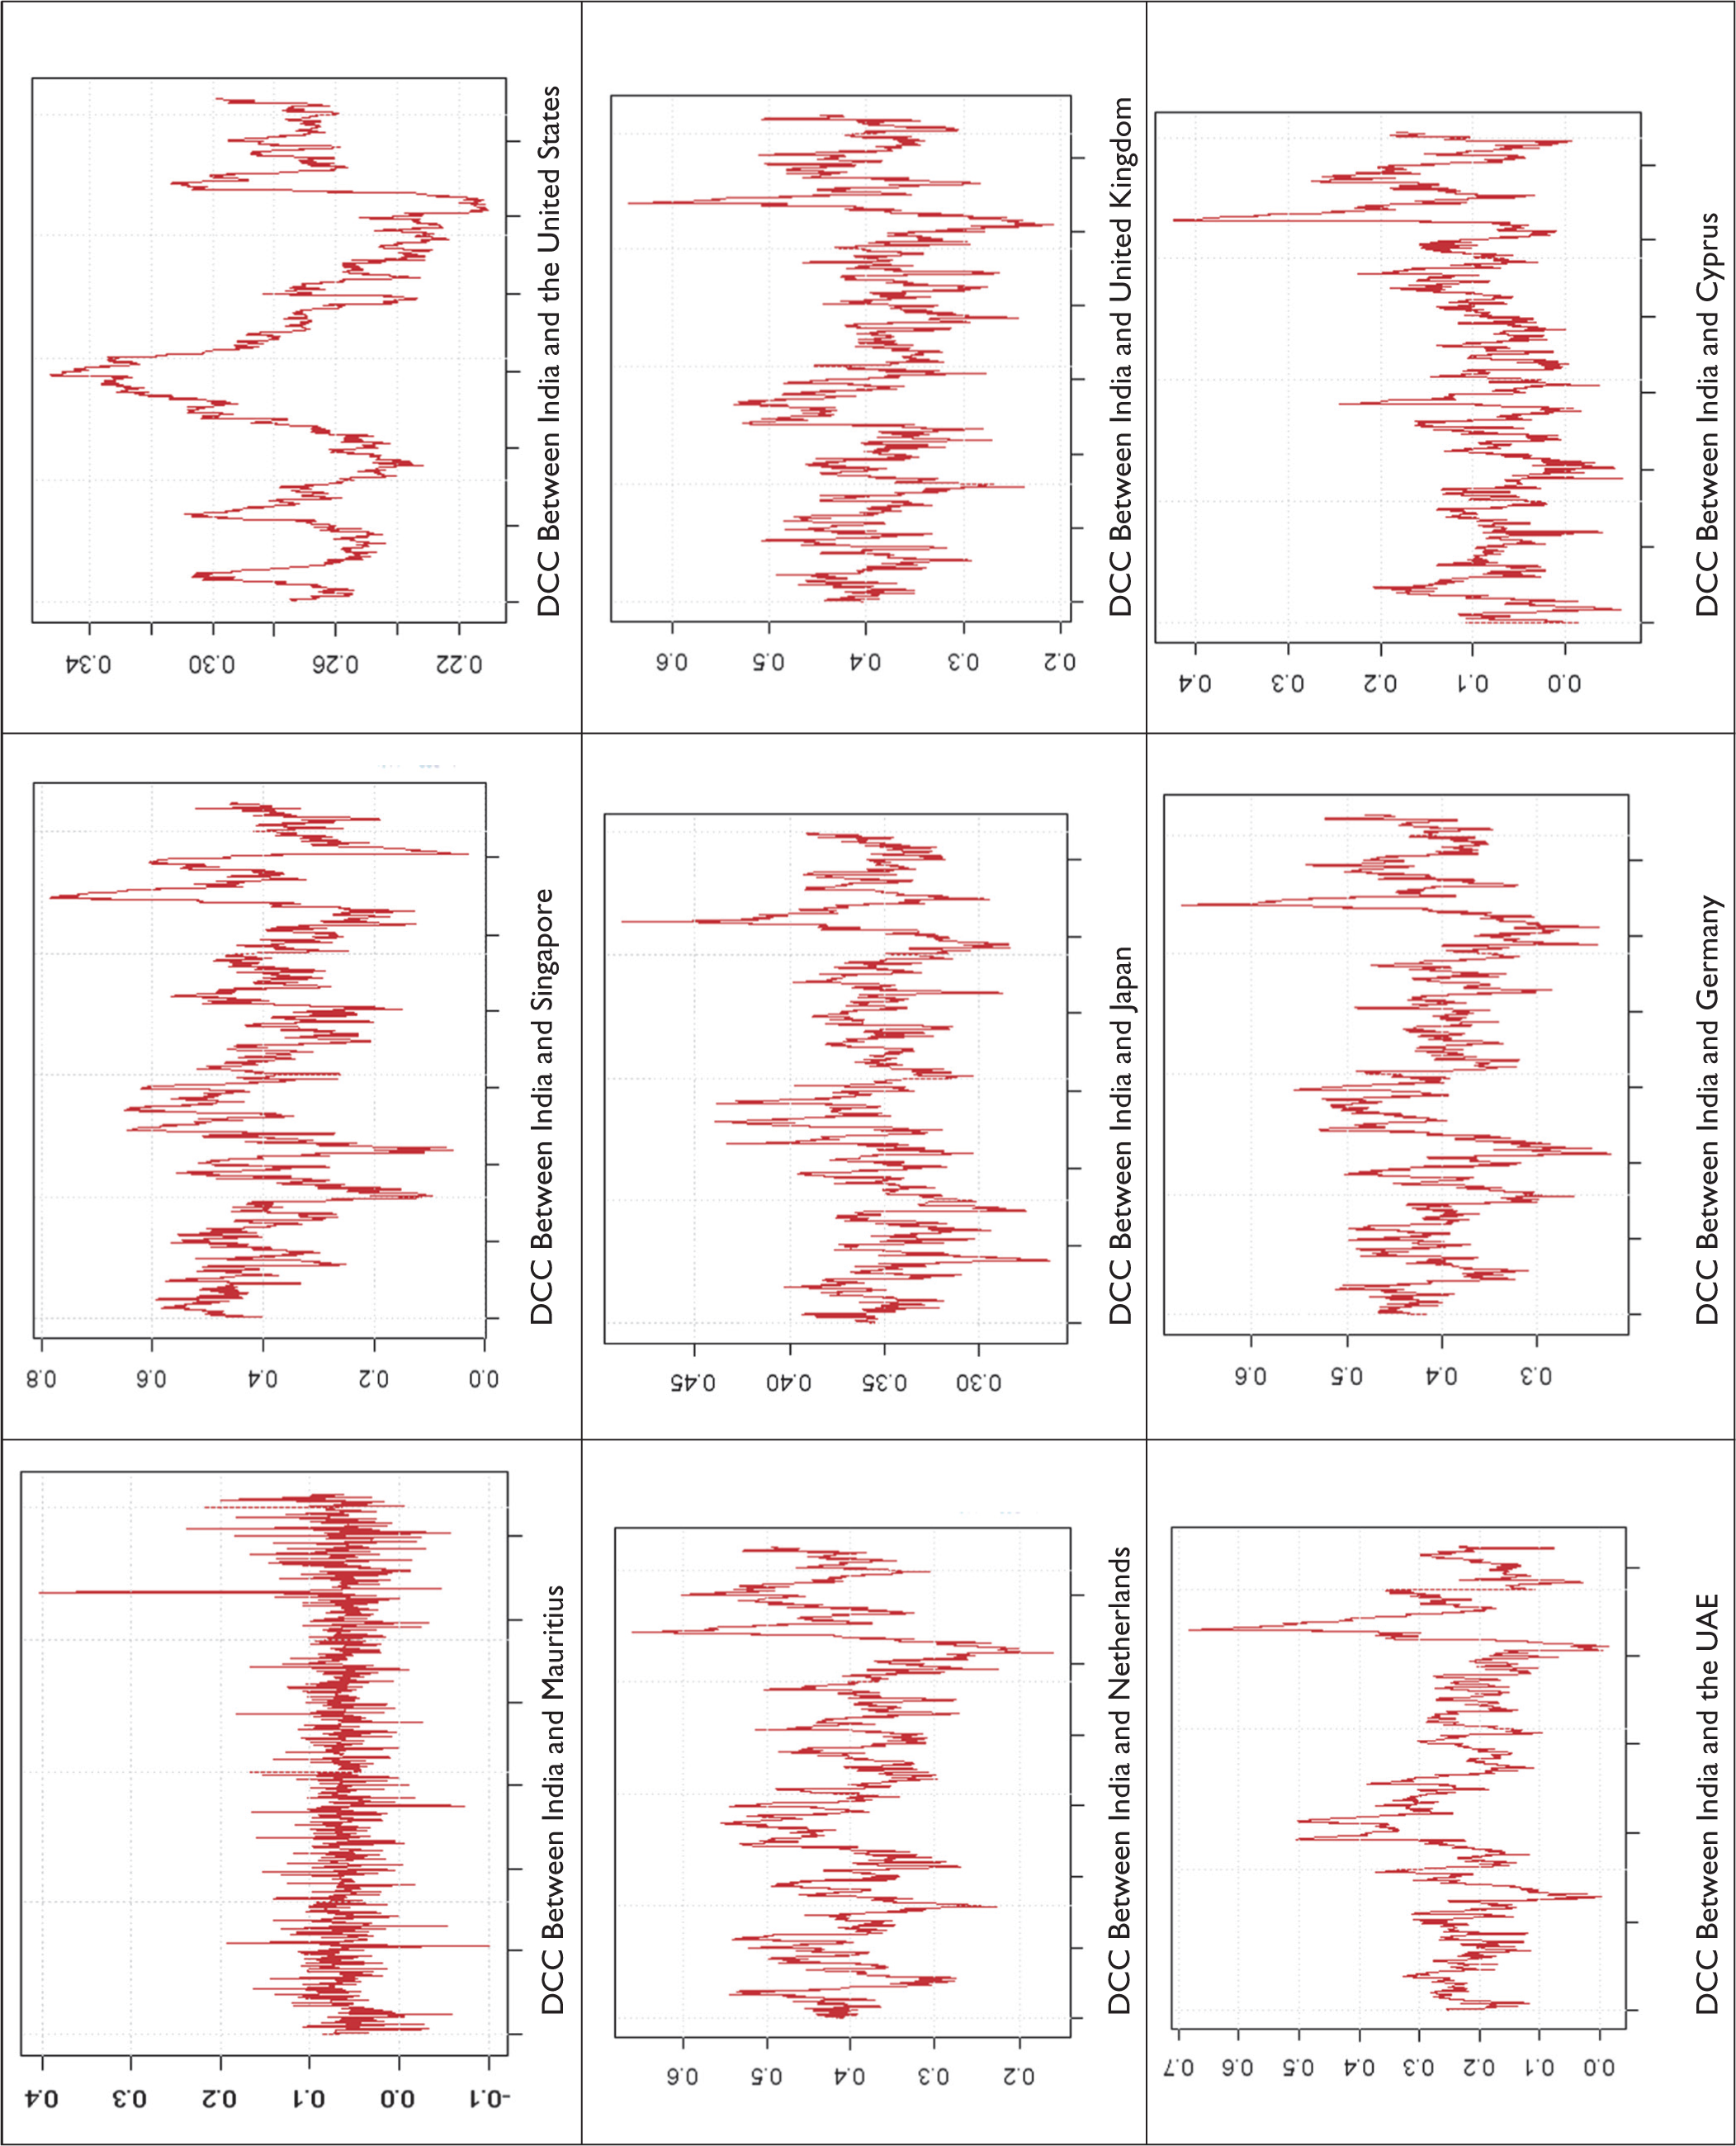
Figure 2 shows the dynamic conditional correlations produced by the DCC-GARCH model in order to further investigate the patterns of pairwise time-varying correlations across all markets.
Figure 2 reveals that time-varying patterns of the correlation dynamic path, which permits the application of DCC-GARCH modelling techniques. The DCC values exhibit a moderate level of conditional correlation existing between India with Singapore, the Netherlands, Japan, the United Kingdom, the UAE and Germany. Low level of conditional correlation is noted between India with the United States and Cyprus. Overall, the dynamic conditional correlation (DCC) is consistently positive for all market pairs examined. This implies that a spike in one market’s volatility will cause the other to rise in proportion and vice versa. This outcome unequivocally points to substantial volatility transmission and interdependence among the examined market pairs during the study’s timeframe.
Time-varying Correlations Between Stock Markets Returns of India with Each of the FDI Partners.
Conclusions and Implications
The nature of volatility transfers between India and the leading nine FDI source countries—Mauritius, Singapore, the United States, the Netherlands, Japan, the United Kingdom, the United Arab Emirates, Germany and Cyprus—is examined in this article. Data from these nations’ benchmark stock market indices, covering the period from April 2015 to March 2025, are used in our analysis. We used two complex econometric models—EGARCH and DCC-GARCH—to collect statistics regarding dynamic volatility transmission across various stock markets after conducting a preliminary data analysis. Our volatility modelling yielded some very convincing results.
India and six of its FDI investor countries exhibit a statistically significant two-way volatility spillover, according to the results of the EGARCH model: Mauritius, the United States, the Netherlands, the United Kingdom, Germany and Cyprus. Additionally, there is unidirectional volatility spillover from two countries, namely Singapore and the UAE, towards India with a unidirectional volatility spillover from India towards Japan. The values of the spillover coefficients indicate that Singapore, the Netherlands, the United Kingdom, Germany and Cyprus are transmitting their volatility to India. Conversely, India is observed to be transmitting its volatility to Mauritius, the United States, Japan and the UAE. Further, the volatility spillover mechanism is asymmetric and leverage effects are present pointing to the fact that negative news notably increases volatility in these countries compared to positive news during the study period. Also, there exists high volatility persistence with shocks fading away slowly.
The results of the DCC-GARCH model demonstrate that dynamic or time-varying conditional correlations are present for all the country pairs used in the study, thus providing evidence that significant volatility spillover is present across the country pairs and, hence, the stock markets maintain co-movement equilibrium. Also, the conditional volatility exhibits a highly persistent nature for all pairwise estimations. In the Case of six countries, namely Singapore, the Netherlands, the United Kingdom, the UAE, Germany and Cyprus the volatility spillover as a result of unpredicted shocks is significant, suggesting that any sudden shock in these economies will augment the volatility of the counter-stock market.
The study’s findings have important ramifications for academics, portfolio managers, international investors and policymakers. Investors and hedgers may have fewer options for diversification given the reported volatility spillover between financial markets. As a result, individuals can design their investing and diversification plans with the goal of minimizing risk and maximizing returns. The results demonstrating the dynamic volatility spillover between India and its top FDI partners suggest that regulators should transition towards ‘Information-based Surveillance’, monitoring asset price movements in major FDI investor nations to anticipate the potential systemic risks that may travel through equity channels (contagion). Also, as the volatility shocks are highly persistent and non-mean reverting, the Central Bank should incorporate these volatility spillover effects into its risk assessment frameworks. For example, a sudden volatility spike in the United Kingdom, the United States or Japan stock markets may indicate a fall in FDI-related capital flows in the near future, requiring pre-emptive liquidity adjustments to stabilize the Indian Rupee. Finally, the results exhibit a high level of integration with current stakeholders, suggesting a need for strategic FDI diversification. By incentivizing investment from nations with lower or negative correlation, India can build a ‘volatility buffer’ that reduces its sensitivity to regional financial crises and ensures long-term economic resilience.
The results of DCC-GARCH demonstrate that co-movement equilibrium between India and its FDI partners is not constant but dynamic, that is, intensifies during the times of market stress. This suggests to international investors and portfolio managers that portfolio diversification is not a constant or ‘set-and-forget’ strategy; rather, it may require dynamic rebalancing. By applying ‘rolling-window’ forecasts and setting thresholds (e.g., reducing exposure to FDI partners when correlations cross a definite point), investors can take the decision to shift the capital towards ‘decoupled’ markets like Cyprus. This vigorous approach warrants that the portfolio remains robust across diverse volatility regimes, thereby protecting returns when international spillovers exaggerate.
Limitations and Scope for Future Research
There are a few limitations of the study. Though Cayman Islands is also a top FDI contributor, the study has excluded this country due to the lack of availability of its historical stock index data, which is a general constraint in international spillover research. The study used country-specific benchmark stock market indices, each of which had a different number of constituents. Global market composite indices were not taken into account for analysis in this study. This could be considered a future study project. Future research can be undertaken on volatility spillover across additional stock markets in different regions, between other markets (commodity, currency, etc.) of different nations, between financial markets and the macro-economy, and using weekly, monthly or high-frequency data. Additionally, future research may specifically examine the impact of key national policy shocks, like the demonetization (2016), on the spillover dynamics among the FDI partners by employing structural break tests or sub-period analysis to isolate episodic volatility from long-term trends.
Footnotes
Declaration of Conflicting Interests
The author declared no potential conflicts of interest with respect to the research, authorship and/or publication of this article.
Funding
The author received no financial support for the research, authorship and/or publication of this article.