
Abstract
This article analyzes the static and dynamic connectedness between Organization of the Petroleum Exporting Countries (OPEC) oil prices and selected Indian sectoral equity indices from January 2011 to November 2022. The returns and volatility spillovers are measured using the method proposed by Antonakakis et al. (2020, Journal of Risk and Financial Management, 13(4), 84), which utilizes the time-varying parameter-vector autoregression model. It is an improvement over the Diebold and Yilmaz (2012, International Journal of Forecasting, 28(1), 57–66) connectedness model. The findings indicate that total connectedness, in terms of volatility and returns, was high during the oil price glut in 2014–2015 and the COVID-19 crisis in 2020. Also, it was found that return connectedness is greater than volatility connectedness. OPEC oil prices being the net receiver of transmissions rather than the net transmitter is another interesting result.
Introduction
In recent years, an expanding body of literature has examined the interplay between oil prices and stock market performance (Driesprong et al., 2008; Herrera & Pesavento, 2009; Park & Ratti, 2008). Oil price fluctuations are incorporated into stock price assessments for several reasons, primarily due to the substantial impact that changes in crude oil prices have on overall economic activity. As a result, shifts in oil prices are expected to influence stock market dynamics directly, given that stock indices serve as indicators of the broader economic environment (Arouri & Nguyen, 2010).
Theoretically, the relationship between oil prices and stock prices is rooted in asset valuation principles, where assets are valued based on the present discounted value of expected future earnings and dividends. This oil-stock price linkage operates through adjustments in either anticipated cash flows or discount rates. Because oil serves as a crucial input for numerous industries, fluctuations in oil prices can alter production costs, thereby affecting corporate earnings and dividends, which ultimately influence stock prices. Additionally, discount rates—which reflect expectations of inflation and real interest rates—can also be influenced by changes in oil prices. An increase in oil prices may lead to higher expected inflation, which in turn could result in higher nominal interest rates. Since discount rates are inversely related to stock valuations, a rise in interest rates typically leads to a decline in stock prices.
This study focuses on sectoral indices instead of aggregate indices, as aggregate measures can obscure sector-specific variations. Sector-level analysis offers a clearer understanding of the nuanced relationship between oil prices and stock returns, which aggregate indices may overlook due to cross-sector correlations (Arouri et al., 2012; Smyth & Narayan, 2018). By examining sector indices, we gain a better understanding of how shocks in the oil market are transmitted to different segments of the stock market (Ahmadi et al., 2016). Moreover, analyzing the Indian stock market at the sectoral level allows us to capture industry-specific relationships and interdependencies.
Given that India relies heavily on imported oil, particularly from the Organization of the Petroleum Exporting Countries (OPEC), understanding how oil price fluctuations impact different segments of the Indian equity market is especially important. While earlier studies, such as that of Chowdhury and Irfan (2022), assessed sectoral interlinkages using a time-varying parameter vector auto regression (TVP-VAR) model, the dynamic and static connectedness between oil prices and Indian sectoral equity indices remains underexplored.
Given the time-varying nature of oil price shocks’ impact on equity indices, analyzing this relationship necessitates a dynamic analytical framework. To address this, we employ the TVP-VAR methodology introduced by Antonakakis et al. (2020), which is integrated with the spillover index approach developed by Diebold and Yilmaz (2014). This combined framework facilitates the examination of the oil-equity nexus in both static and time-varying contexts, enhancing the understanding of its evolving dynamics and contributing novel insights to existing research.
The article is structured as follows: The second section provides a review of the literature on oil prices and stock returns. The third section describes the data and outlines the methodological approach, drawing on the frameworks of Antonakakis et al. (2020) and Diebold and Yilmaz (2014). The fourth section reports the empirical results, while the fifth section offers concluding remarks.
Review of Literature
A substantial volume of research has examined the possible connections between crude oil prices and stock market performance (Filis et al., 2011; Jammazi et al., 2017; Maghyereh et al., 2017; Malik & Ewing, 2009). The majority of studies investigate return spillovers or volatility in returns, with findings suggesting that increases in oil prices have a significant influence on the global economy. Sadorsky (1999) using a VAR framework, demonstrated that both oil price levels and their volatility significantly affect real stock returns. The results indicate that oil price fluctuations account for a larger portion of forecast error variance in real stock returns than changes in interest rates and that shocks in oil price volatility generally lead to asymmetric economic impacts.
Basher and Sadorsky (2006) utilized a multifactor model that integrates both unconditional and conditional risk factors, demonstrating robust evidence that oil price risk exerts a measurable influence on equity returns in emerging markets. Nandha and Faff (2008), through an analysis of 35 global industry indices from DataStream, concluded that an increase in oil prices negatively affects stock returns in most sectors, except for mining and oil gas—findings aligned with established economic theories and Kilian and Park (2009) highlighted that the impact of oil price shocks on stock returns depends on whether the shocks originate from the demand or supply side. To distinguish between these sources, Kilian (2009) developed a structural vector autoregression model that identifies and separates demand and supply shocks in monthly oil price data.
Arouri et al. (2011) investigated the transmission of volatility between oil markets and sectoral stock markets in the US and Europe, finding that sectors with greater reliance on oil—either as an input or output—are more susceptible to fluctuations in oil price volatility. The consensus is that while oil price changes influence some industries, they do not affect all sectors uniformly.
Liu et al. (2023) employed quantile regression analysis to identify asymmetric relationships between oil price volatility and stock market volatility, with these effects being particularly pronounced during periods of extreme market volatility. Their findings reveal significant divergence in these dynamics between developed and emerging markets, thereby questioning the sufficiency of linear modeling approaches. Concurrently, Yang (2025) employed wavelet coherence analysis to illustrate the time-dependent interdependencies between oil and equity markets in the US and China, noting heightened volatility spillovers during episodes of economic policy transitions and financial turbulence. Their results emphasize divergent outcomes for oil-importing versus oil-exporting economies, particularly in contexts of heightened policy uncertainty.
Balash and Faizliev (2024) applied augmented VARX models to detect structural breaks in the volatility of Russia’s energy sector, revealing that geopolitical tensions and sanctions reshape risk transmission networks. Their analysis reveals that global political events primarily drive fluctuations in connectivity, with these changes occurring gradually rather than abruptly. Luo et al. (2024) assessed the spillovers of extreme events from oil markets to China’s financial sector. They found that US monetary policy tightening amplifies these transmissions through international capital flows, affecting China’s financial stability—particularly in equity and foreign exchange markets.
Several studies have employed various econometric methods to investigate the interactions between oil prices and stock markets. Arouri and Rault (2012) used bootstrap panel cointegration and seemingly unrelated regression to examine the long-term links between oil prices and GCC stock markets, concluding that oil price increases generally raise stock prices, except in the case of Saudi Arabia. Broadstock et al. (2014) distinguished between the direct impact of oil price increases—raising production costs and reducing profits—and their indirect effect through increased systematic risk. Jammazi et al. (2017) combined wavelet analysis and an enhanced dynamic causality test to investigate the time-varying causal relationships between oil price shocks and stock returns in oil-importing countries, revealing significant bidirectional causality across various timeframes.
Zhang (2017), using the Diebold and Yilmaz connectedness framework, found that oil shocks have a limited but significant influence on global financial systems. Antonakakis et al. (2018) employed the Diebold and Yilmaz spillover index and Engle’s dynamic correlation model to investigate co-movements and volatility spillovers between oil prices and stocks of major oil and gas companies. Wei et al. (2019) applied a nonlinear threshold cointegration approach, demonstrating that long-term linkages between oil prices and the Chinese stock market shift significantly across different market regimes, especially following changes to China’s oil pricing and exchange rate policies.
Umar et al. (2021) analyzed the static and dynamic connectedness between various types of oil price shocks (supply, demand, and risk-based) and Spanish sectoral indices from 2000 to 2019. Using Ready’s (2018) method for isolating oil price shocks alongside the Diebold and Yilmaz (2014) spillover framework, they found sector- and time-specific differences, especially during the global financial and European debt crises. Financials, telecommunications, industrials, and utilities emerged as the most influential sectors.
Chowdhury (2022) explored sectoral connectedness within the Indian stock market from January 2011 to December 2020 using the TVP-VAR approach. The findings showed that approximately 84% of forecast error variance was attributed to intra-sectoral shocks, with external shocks accounting for just 16%, indicating a high degree of interdependence across sectors. The results also suggest that cyclical sectors tend to be net transmitters of shocks, while non-cyclical sectors are net receivers.
This study examines the dynamic relationship and volatility connectedness between OPEC oil prices and Indian equity indices, with a focus on key sectors, including automobiles, finance, real estate, metals, consumer durables, and FMCG.
Most existing studies on India focus on the aggregate stock market index (such as the Nifty or Sensex) when analyzing the impact of oil price changes, potentially obscuring significant heterogeneity at the sector level. However, as the economic impact of oil price shocks can vary widely across industries—depending on their oil dependency—sector-level analysis is essential for uncovering nuanced transmission mechanisms and vulnerabilities. Previous research often employs static models or conventional rolling-window approaches (e.g., VAR, GARCH) to assess spillovers between oil prices and stock returns. These methods may not adequately capture the time-varying nature of connectedness. While recent international studies have adopted advanced frameworks, such as the TVP-VAR model, to measure both return and volatility connectedness, these approaches remain underutilized in Indian sectoral studies. The TVP-VAR model, as proposed by Antonakakis et al. (2020), provides a more robust and flexible approach to capturing evolving relationships and spillover effects. In this context, this study examines the time-varying return and volatility connectedness across the Indian equity indices comprising various key sectors (such as automobile, finance, realty, metal, consumer durables, and FMCG) and OPEC oil prices. Directly linked sectors (e.g., oil and gas, chemicals) often show predictable, linear relationships, while indirect linkages reveal nuanced transmission mechanisms (Degiannakis et al., 2018). Therefore, directly linked sectoral stocks are not considered in this study.
Data and Methodology
This article explores the potential connectedness between OPEC oil prices and the Indian equity sector indices, differentiating among key sectors of activity such as automobile, finance, realty, metal, consumer durables, and FMCG. Those sectors that are indirectly connected with oil prices are chosen for the analysis. To that purpose, we use daily data from January 3, 2011 to November 25, 2022 obtained from the National Stock Exchange database, and OPEC oil prices data are obtained from Nasdaq Data Link. The sample period has been chosen based on the longest data availability of all series. In line with previous studies, we utilize the return series for each variable since the price series in their level form were found to be non-stationary.
This article uses Antonakakis et al.’s (2020) work, which employs the TVP-VAR model to measure the return and volatility connectedness amongst the target variables. This method eliminates the burden of the generally arbitrarily chosen rolling-window size and which can result in very irregular or flattened parameters, and prevents the loss of important observations. This technique can be used to investigate dynamic connectedness measures for both low-frequency and limited-series data. This methodological framework is based on the foundational work of Diebold and Yılmaz (2009, 2012, 2014), who first introduced the approach for examining dynamic connectedness.
The TVP-VAR(p) model can be written as follows:


Here, zt and ut are vectors of size k × 1, while Ct and st are matrices of size k × k. Additionally, vec(Ct) and vt are vectors of size k2 × 1, and Rt is a matrix of size k2× k2.
The study then computes the H-step-ahead GFEVD using the framework of Koop et al. (1996). In contrast to Diebold and Yilmaz’s (2009) orthogonalized variance decomposition, the GFEVD remains invariant to the sequence in which variables are ordered.
The Connectedness Index Methodology
After describing the TVP-VAR model, in this section, we briefly describe the Diebold–Yilmaz connectedness index methodology, which was developed in a series of papers (Diebold & Yilmaz, 2012). Given the availability of daily returns and realized variances, we employ the generalized VAR and spillover index of Diebold and Yilmaz (2012) to estimate the directional return and volatility spillovers among OPEC oil prices and Indian sectoral indices. This methodology offers two key advantages: (a) it is order-invariant, meaning results remain unaffected by the sequence of variables in the model, and (b) it enables the quantification of spillover directionality (i.e., origin and destination) and intensity (i.e., magnitude) across variables and over time.
VAR(p) Model
Consider an N-variable vector autoregression (VAR) of order p:

where:
xt is an N × 1 vector of endogenous. Φ
i
is N × N autoregressive coefficient matrices. εt is a vector of independently and identically distributed (i.i.d.) errors with covariance matrix Σ.
Moving Average (MA) Representation
The VAR can be rewritten in its MA form:
where the N × N coefficient matrices A
i
follow the recursion:

with A0 = I N (identity matrix) and A i = 0 for i < 0.
We utilize variance decomposition techniques to break down the forecast error variance of each variable into components attributable to different sources of shocks within the system. This approach enables us to determine the proportion of the H-step-ahead forecast error variance in forecasting xi that is due to shocks to xj, ∀j ≠ i, for each i.
Variance Shares
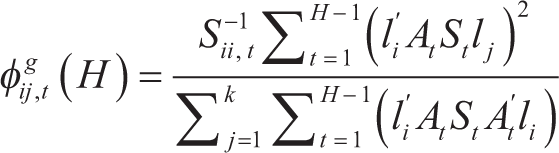
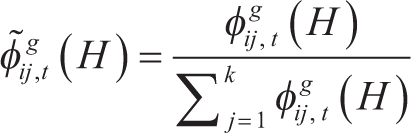
The DY framework uses GFEVDs to quantify spillovers. We define variance shares as the proportion of the H-step-ahead forecast error variance for xi that can be attributed to shocks in xi itself, for i = 1, 2, ……, N. In contrast, cross variance shares—or spillovers—refer to the proportion of the H-step-ahead forecast error variance for xi that arises from shocks to xj, where i, j = 1, 2, ……, N, such that i ≠ j. The scaled GFEVD is obtained by normalizing the unscaled GFEVD so that the sum of elements in each row equals one. This scaling allows us to quantify the effect of sector j on sector i by measuring its contribution to the forecast error variance, which is interpreted as the pairwise directional connectedness or spillover from sector j to sector i. This metric is calculated as follows:
Directional Spillovers
While total volatility spillover metrics provide insights into the overall transmission of shocks across sectoral equity indices, the generalized vector autoregression framework enhances this analysis by identifying the directional flow of volatility spillovers. A key advantage of this approach is that generalized impulse responses and variance decompositions remain invariant to the ordering of variables, ensuring robustness in estimation. Directional spillovers are derived from the normalized components of the generalized variance decomposition matrix. Specifically, the directional volatility spillovers originating from market i and propagating to all other markets j are quantified as follows:

We quantify the directional volatility spillovers that market i receives from all other markets j as follows:

Net Spillovers
The net volatility spillover from market j to all other markets t is calculated as follows:

This equation represents the difference between Equations (8) and (9), yielding the net total directional connectedness. It indicates whether a sector acts as a net source or net recipient of shocks. Total connectedness index (TCI) and corrected connectedness index (CCI):

Another key aspect of the above equation is its ability to estimate the TCI across all sectors, representing the average magnitude of spillovers among them. A high TCI for the overall market indicates a greater degree of interconnectedness. In this study, we enhance the dynamic connectedness measures originally introduced by Diebold and Yilmaz (2012, 2014) with a TVP-VAR, which predicates upon a time-varying variance-covariance structure. This framework allows the capture of possible changes in data more flexibly and robustly. Another essential connectedness measure, the CCI, reflects the average influence that a single variable exerts on all other variables in the system. A relatively high value indicates strong interconnectedness within the network, suggesting elevated market risk, whereas a lower value implies weaker linkages and, consequently, lower market risk. The CCI can be computed by

Discussion of the Results
Static Connectedness
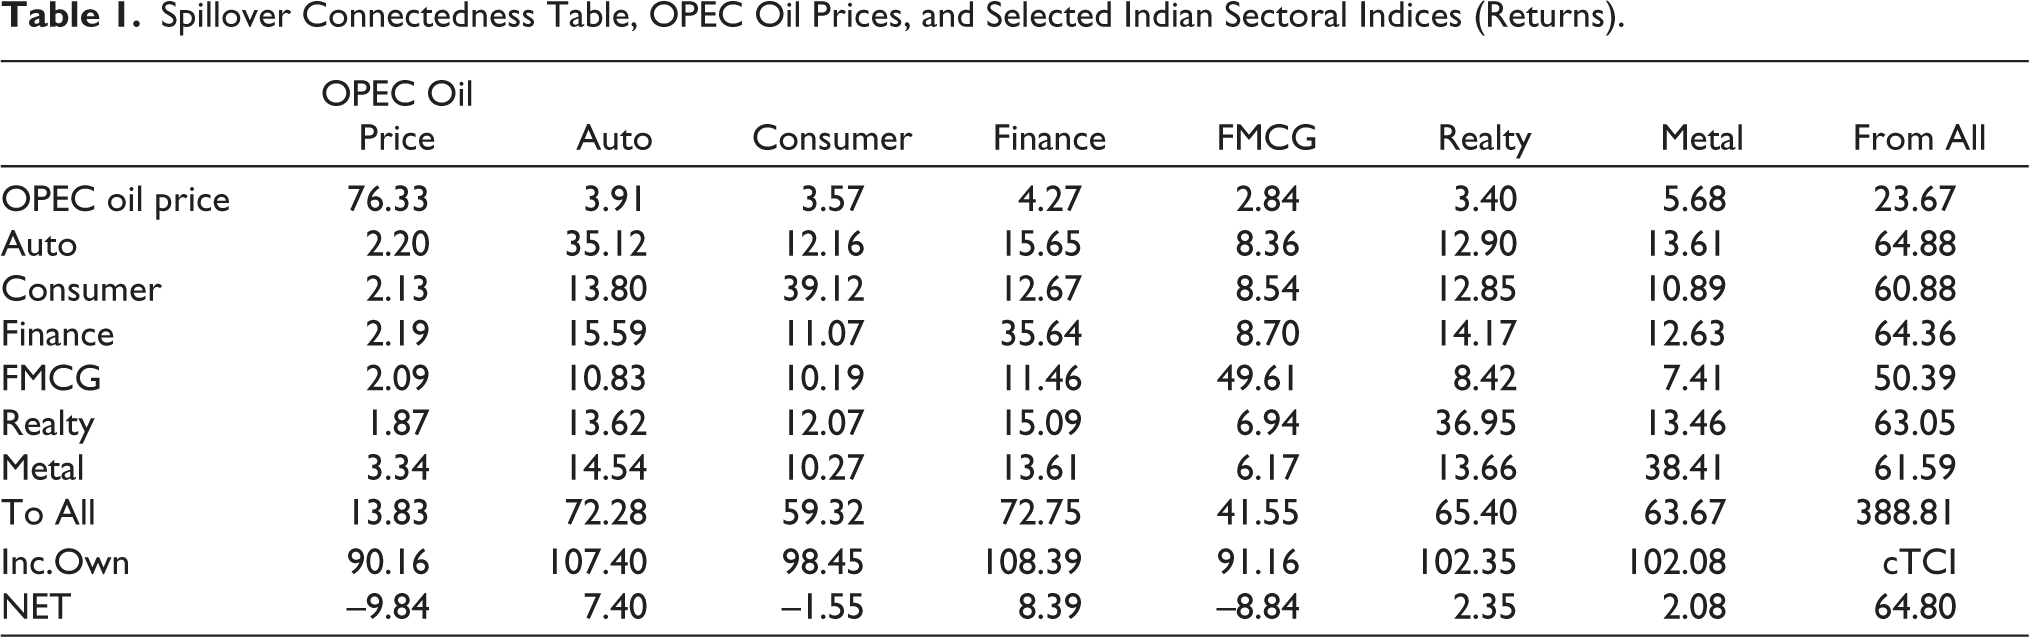
The static (average) connectedness measures for returns and volatility, calculated over the whole sample period, are presented in Tables 1 and 2, respectively. These tables report total connectedness values as well as pairwise directional connectedness metrics, including to-connectedness, from-connectedness, and net-connectedness. All estimates are derived from a VAR model of order 1.
Spillover Connectedness Table, OPEC Oil Prices, and Selected Indian Sectoral Indices (Returns).
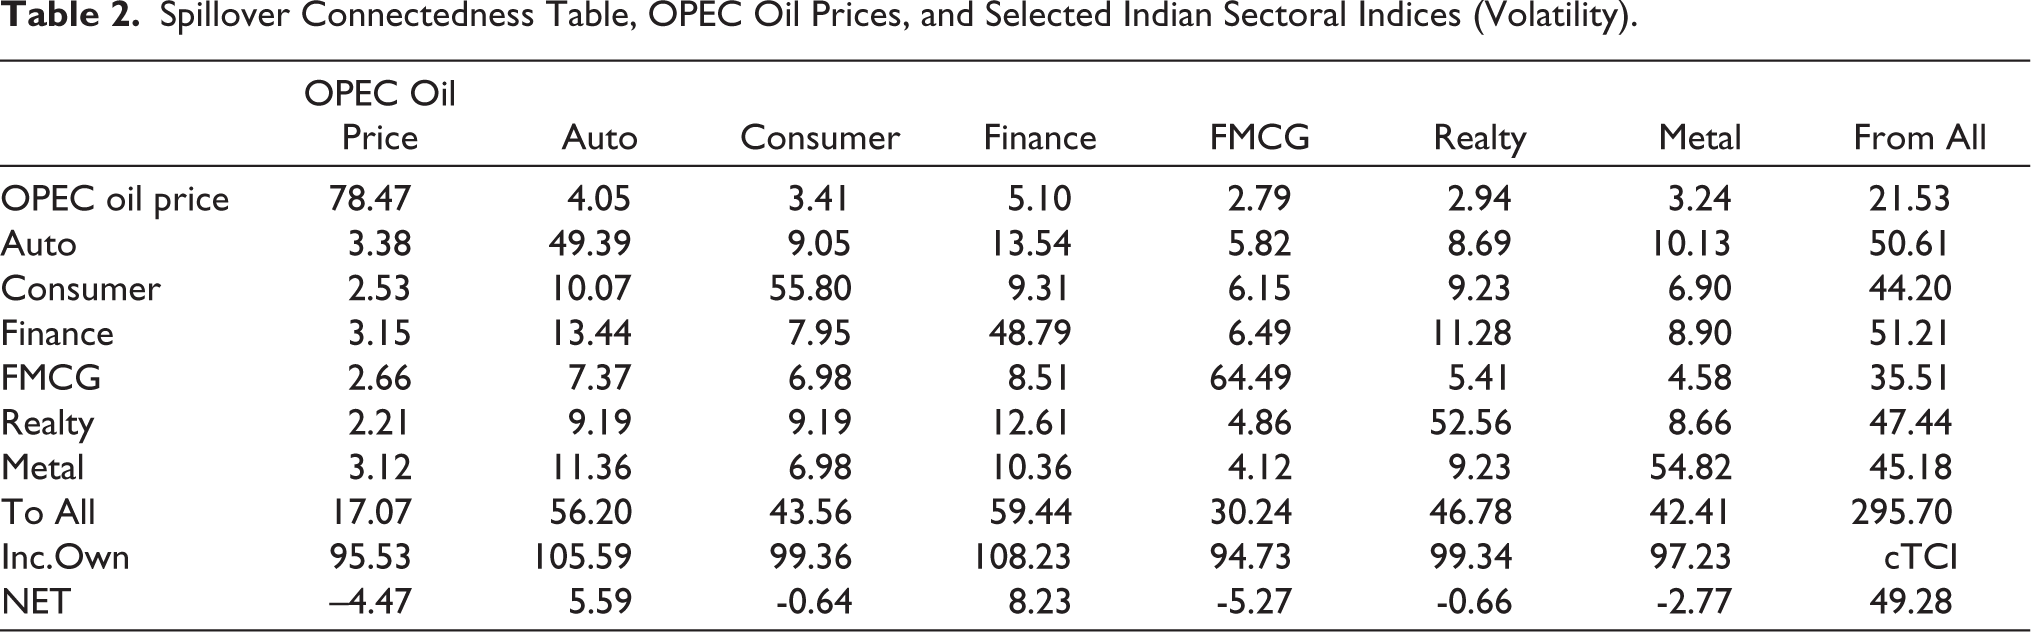
Spillover Connectedness Table, OPEC Oil Prices, and Selected Indian Sectoral Indices (Volatility).
The CCI of the system is notably substantial at 64.8%, as indicated by the value at the bottom of the final column in Table 1. The off-diagonal entries in Table 1 represent the pairwise connectedness between changes in oil prices and returns of Indian sectoral equities. Additionally, the first value in the third-to-last row (labeled “TO”) reflects the measure of directional connectedness of oil price changes (RS) to all sectors in the system and shows that oil price changes transmit 13.83% shocks to all Indian sectoral indices. The highest recipient of oil shocks is the metal sector (3.34%), followed by the automobile sector (2.20%), and the lowest recipient is the realty sector (1.87%). The initial entry in the final column of the table represents the overall directional connectedness for all sectors collectively transmitting 23.67% shocks to OPEC oil prices, wherein metal (5.68%) is the largest transmitter of shocks toward OPEC oil prices.
It is interesting to note that among sectors, finance (72.75%) and automobile (72.28%) are the primary transmitters of shocks to the system. Also, finance (64.36) and metal (61.59%) are the major recipients of shocks from the system.
To differentiate between net transmitters and net receivers, we examine the “Net” connectedness measure—calculated as the difference between the “To” and “From” values—for each variable, as presented in the final row (NET) of Table 1. A positive net value indicates that a variable acts as a net transmitter (or dominant source), while a negative value signifies that it is a net receiver. Based on this metric, the oil market is identified as a net receiver of shocks from the Indian sectoral stock markets, with a net value of -9.84%.
Table 2 contains the spillover matrix of volatility using the measure of the absolute return. They show that the total volatility connectedness is about 49.28% spillovers, which means, on average, throughout the whole sample period, 49% of the volatility forecast error variance comes from transmissions. For instance, in Table 2, the oil market spills 17.07 %, and the automobile and metal sectors are the major receivers of oil price volatility. The oil market receives a 21.53% spillover of volatility from the Indian sectoral stock markets.
Finance and the automobile sectors are the major contributors. The oil market becomes more likely a net recipient of volatility originating from Indian sectoral stock markets rather than a net spiller. This indicates that sectoral market volatility is transmitted to the oil market.
The significant summary result is that return spillovers are more than the volatility spillover.
Dynamic Connectedness
The unconditional average total spillover across all implied volatilities in the system is 64.80% for returns and 49.28% for volatility. However, under conditional analysis—that is, at specific time points—the dynamics of volatility spillover may diverge significantly depending on the information available at that time. To account for this variability, the analysis transitions from a static full-sample framework to a time-varying rolling window approach. This methodological shift enables an examination of how connectedness evolves dynamically over the sample period, as visualized through spillover plots that capture temporal fluctuations in interdependencies.
Figures 1 and 2 show the plots of total spillover for a rolling window of 200 days and a 12-step-ahead forecast error-variance decomposition and exhibit the total spillover movement over time.
Total Spillover Plot for Returns of OPEC Oil Prices and Indian Sectoral Indices.
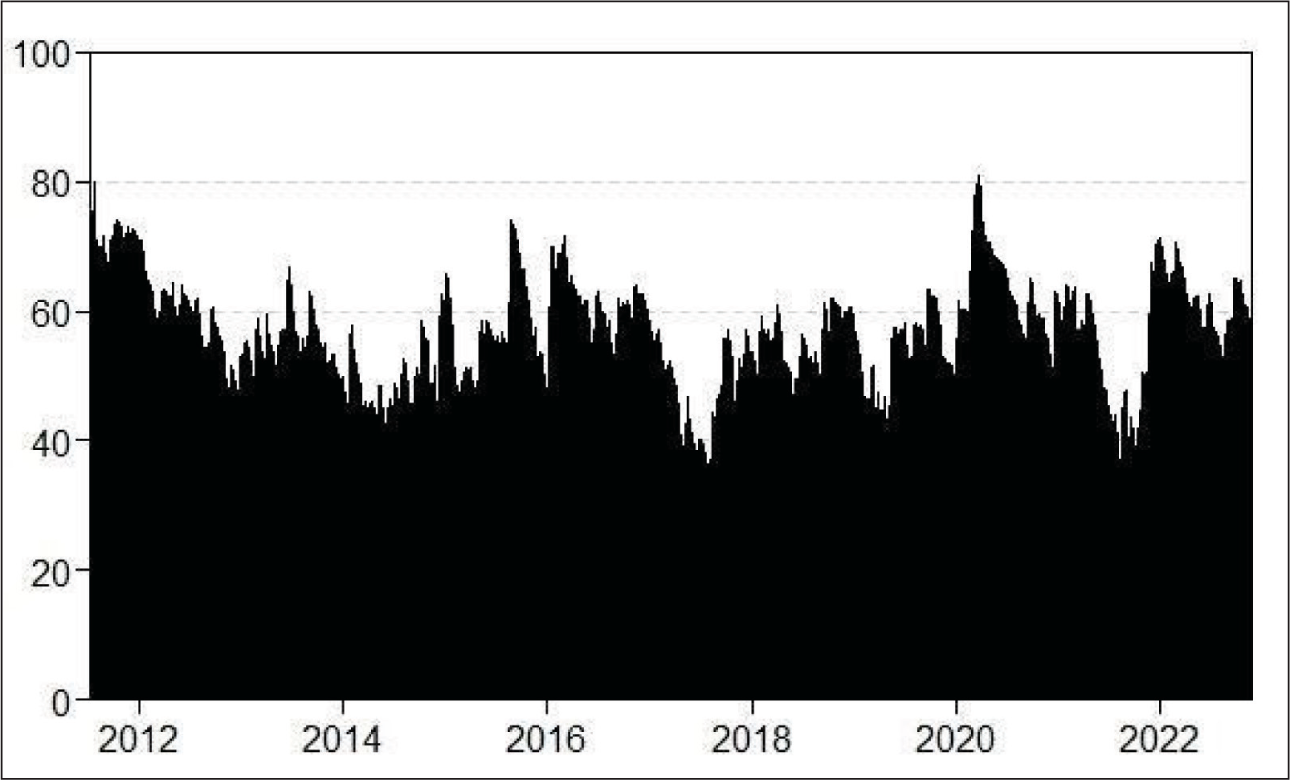
Figure 1 provides a total spillover plot for returns, and Figure 2 provides a Total spillover plot for the volatility of OPEC oil prices and selected Indian sectoral market indices. From Figure 1, it is evident that returns spillover is more than the volatility spillovers. Return spillover is the transmission of returns among stock markets. The process and degree to which instability in one market has an impact on other markets is referred to as volatility spillover.
Total Spillover Plot for Volatility of OPEC Oil Prices and Indian Sectoral Indices.
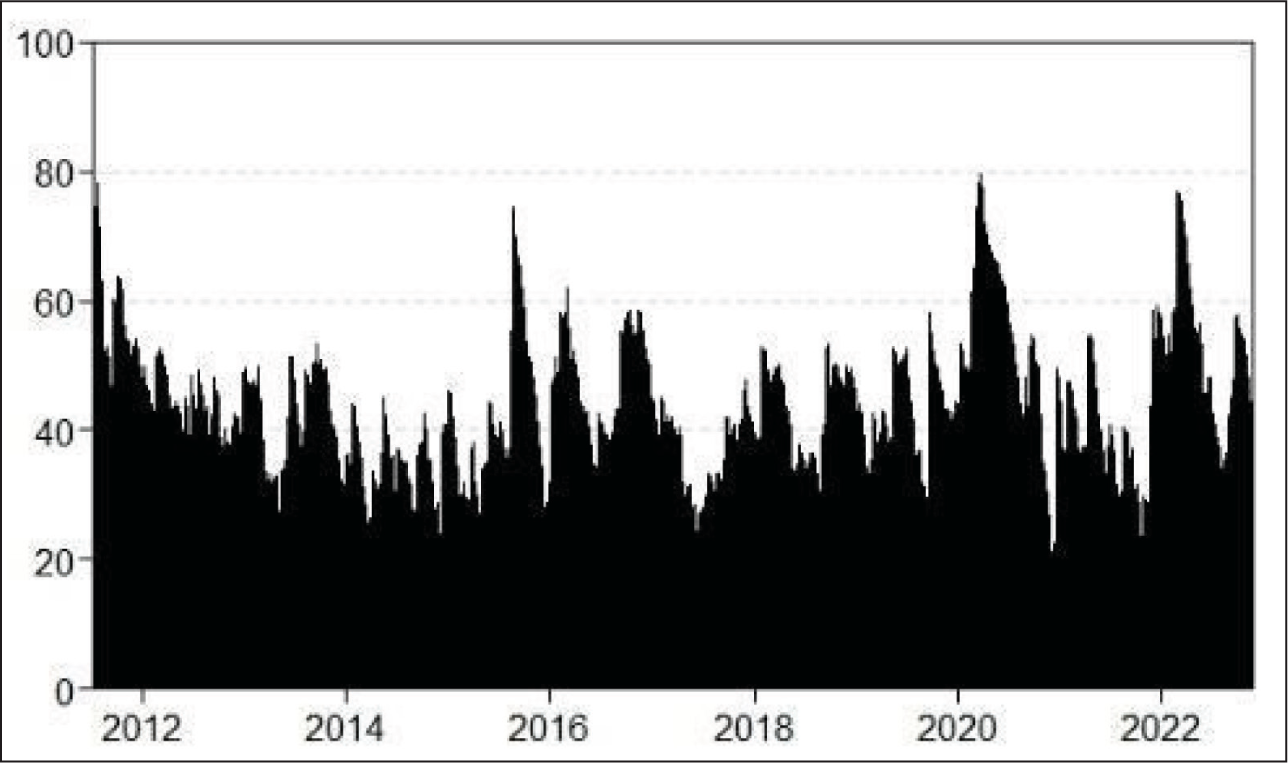
During 2015–2016, total spillover—both in returns and volatility—reached approximately 75%, coinciding with a period characterized by an oil supply glut and a global economic slowdown. These conditions contributed to heightened risk transmission between oil prices and the Indian sectoral market. Notably, this period also saw oil prices decline by 60% from their mid-2014 peak to August 2015.
The COVID-19 pandemic caused an enormous demand shock in the oil sector, which caused oil prices to plummet. The oil price war that erupted between Saudi Arabia and Russia in March after the two countries were unable to reach a consensus on oil production levels contributed significantly to the subsequent decline in oil prices. During this period, oil prices fell by 60% from their peak in mid-2014 to August 2015. OPEC’s slow response to the decline in demand to reduce oil production added to the volatility and fall in oil prices the oil industry experienced during the early part of the year. Even though OPEC agreed to cut production, by May 2020, crude oil prices had fallen to some of their lowest levels in more than 20 years.
Directional Spillover Plots
Thus far, we have only discussed the total spillover plot, which is informative but does not capture directional dynamics. Directional information is provided by the “Directional TO others” row (summed as Sgᵢ•(H)) and the “Directional FROM others” column (summed as Sg•ᵢ(H)).
A notable aspect of the rolling-window analysis is the extent to which oil prices act/react throughout the period under study. Figure 3 shows the contribution of OPEC oil price changes and the system’s contribution to oil price changes. The rolling-window analysis of oil shocks presented here suggests that Indian sectoral markets serve as useful predictors of oil price changes rather than simply being influenced by fluctuations in oil prices.
Directional Spillover Plots of OPEC Oil Prices.
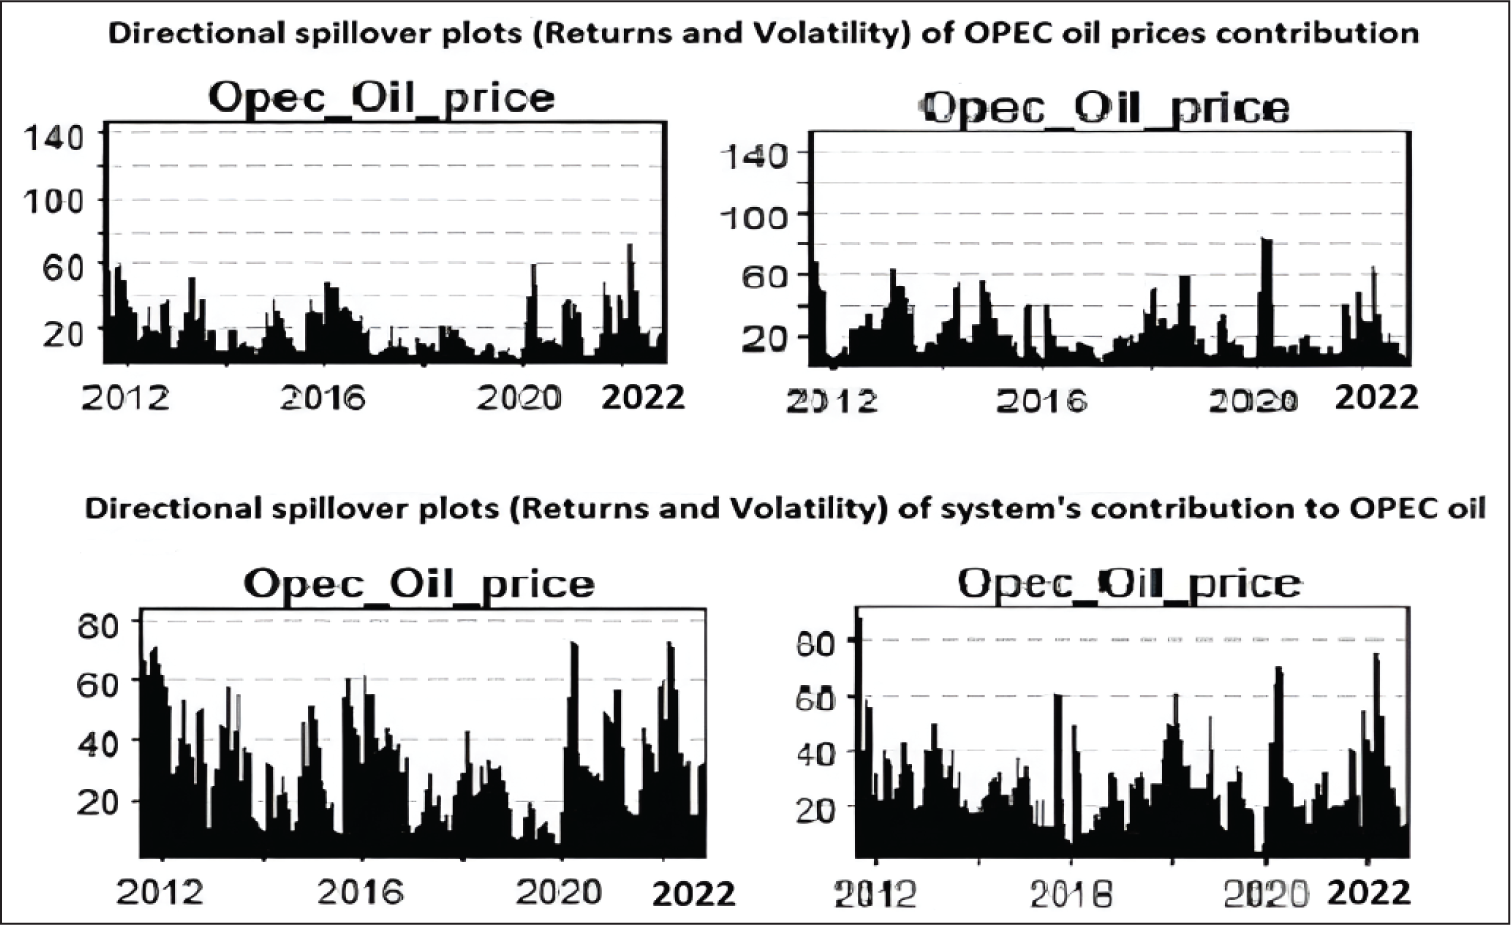
From the directional spillover plots of returns and volatility from other sectors, it is evident that the finance and automobile sectors are the largest receivers of shocks throughout the study period. The result corresponds to the static connectedness results.
Figures 4 to 7 illustrate the directional spillover plots for both returns and volatility across different sectors. It is clear that the finance and automobile sectors consistently serve as the primary transmitters of shocks within the system over the entire sample period.
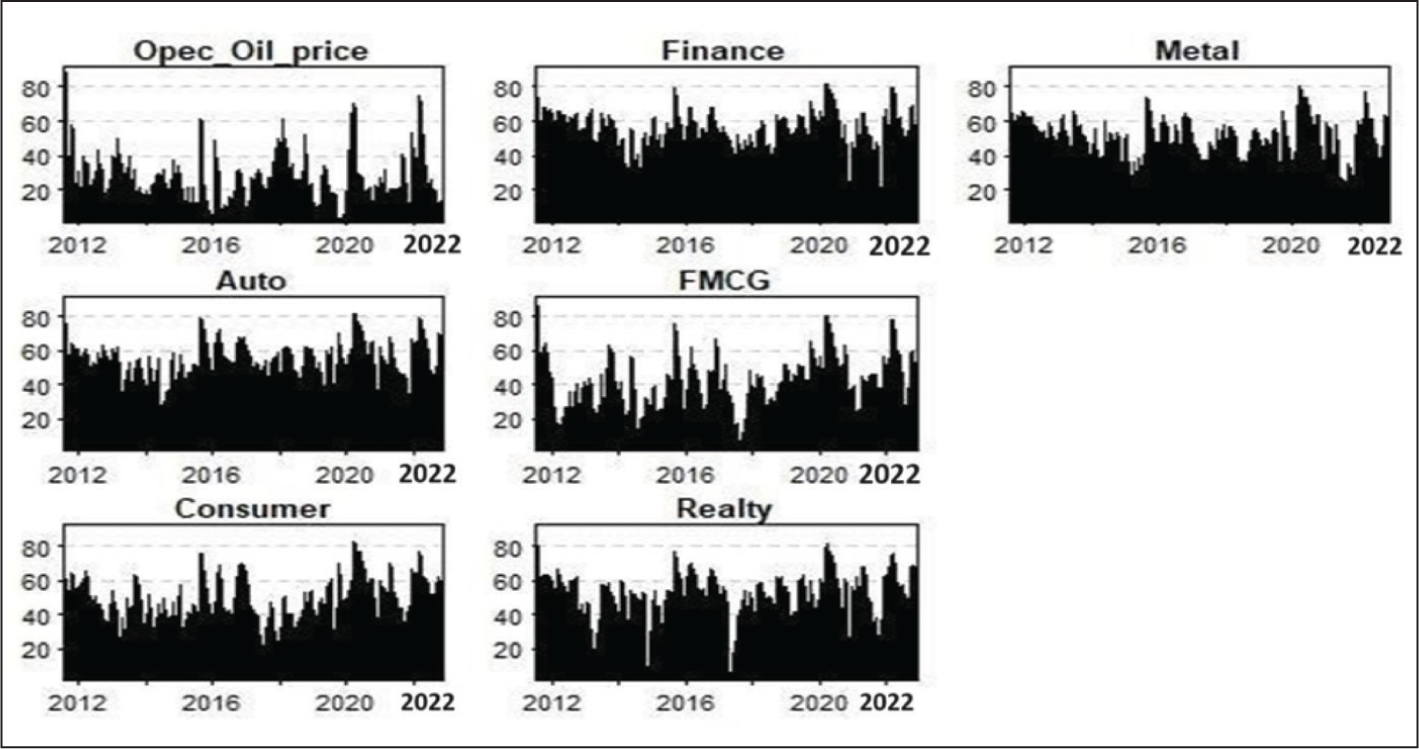
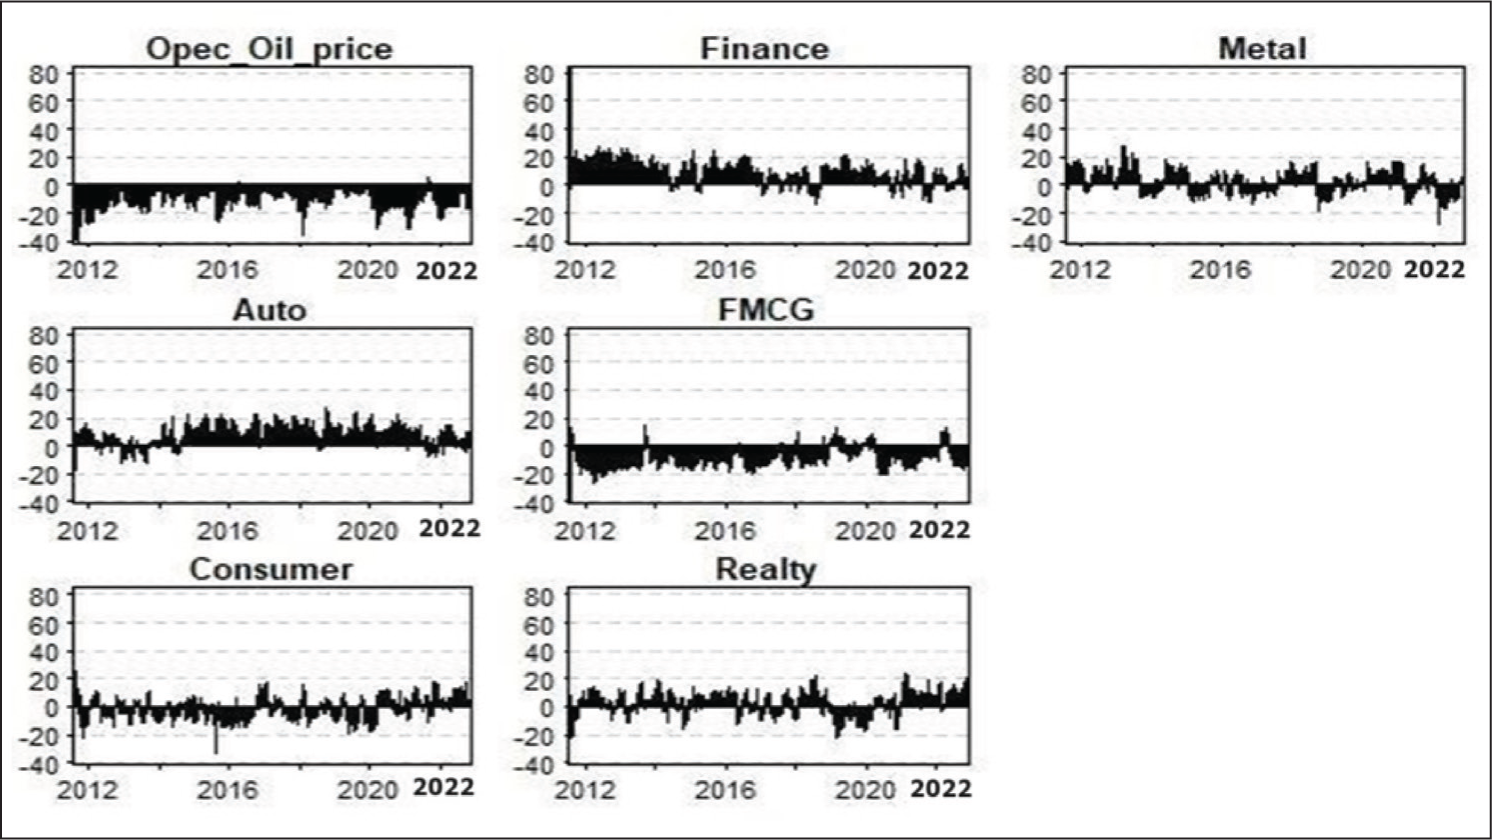
Directional Spillovers (Returns From).
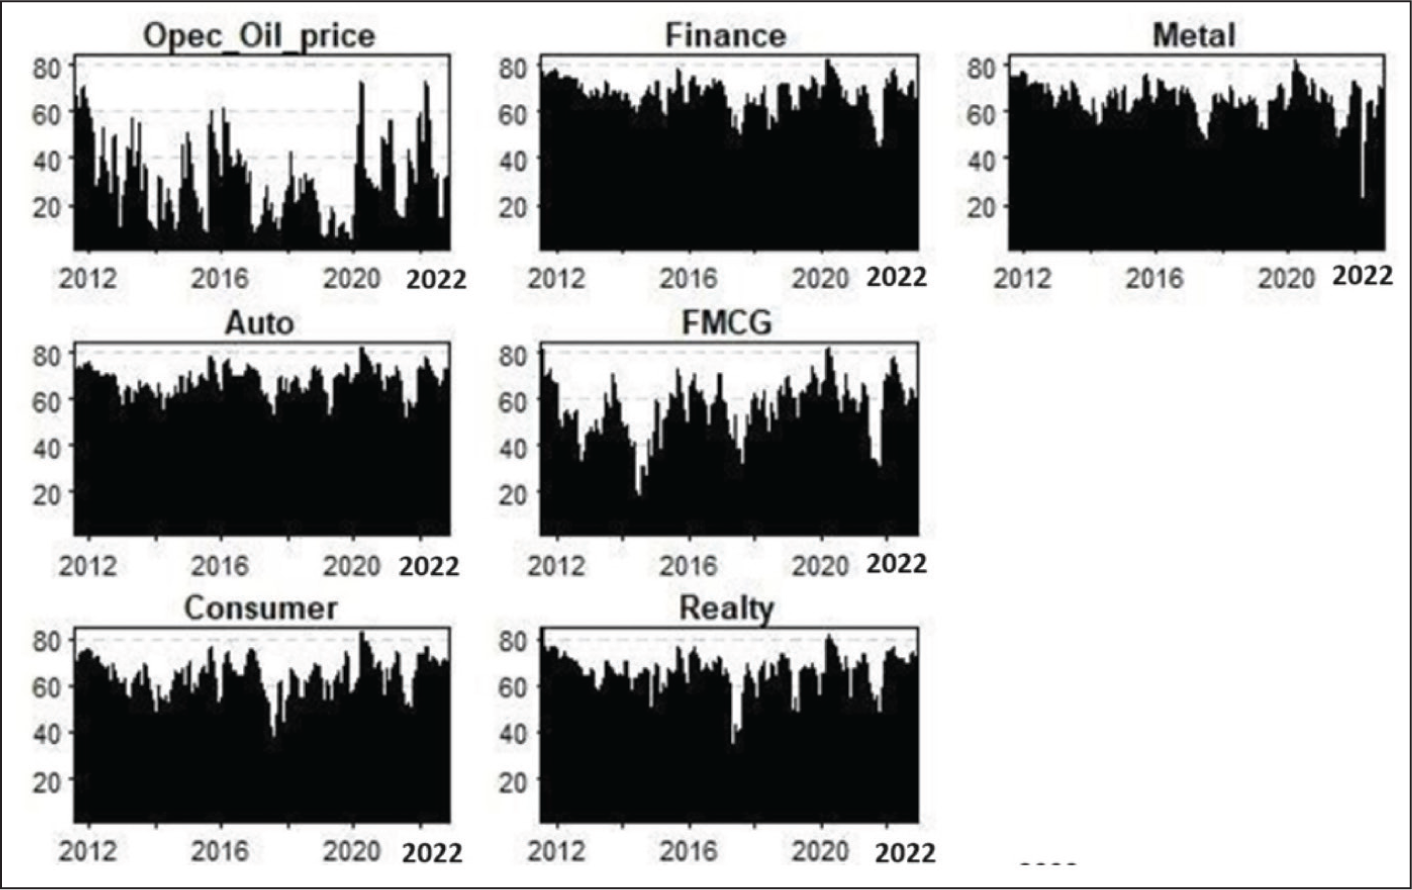
Directional Spillovers (Volatility From).
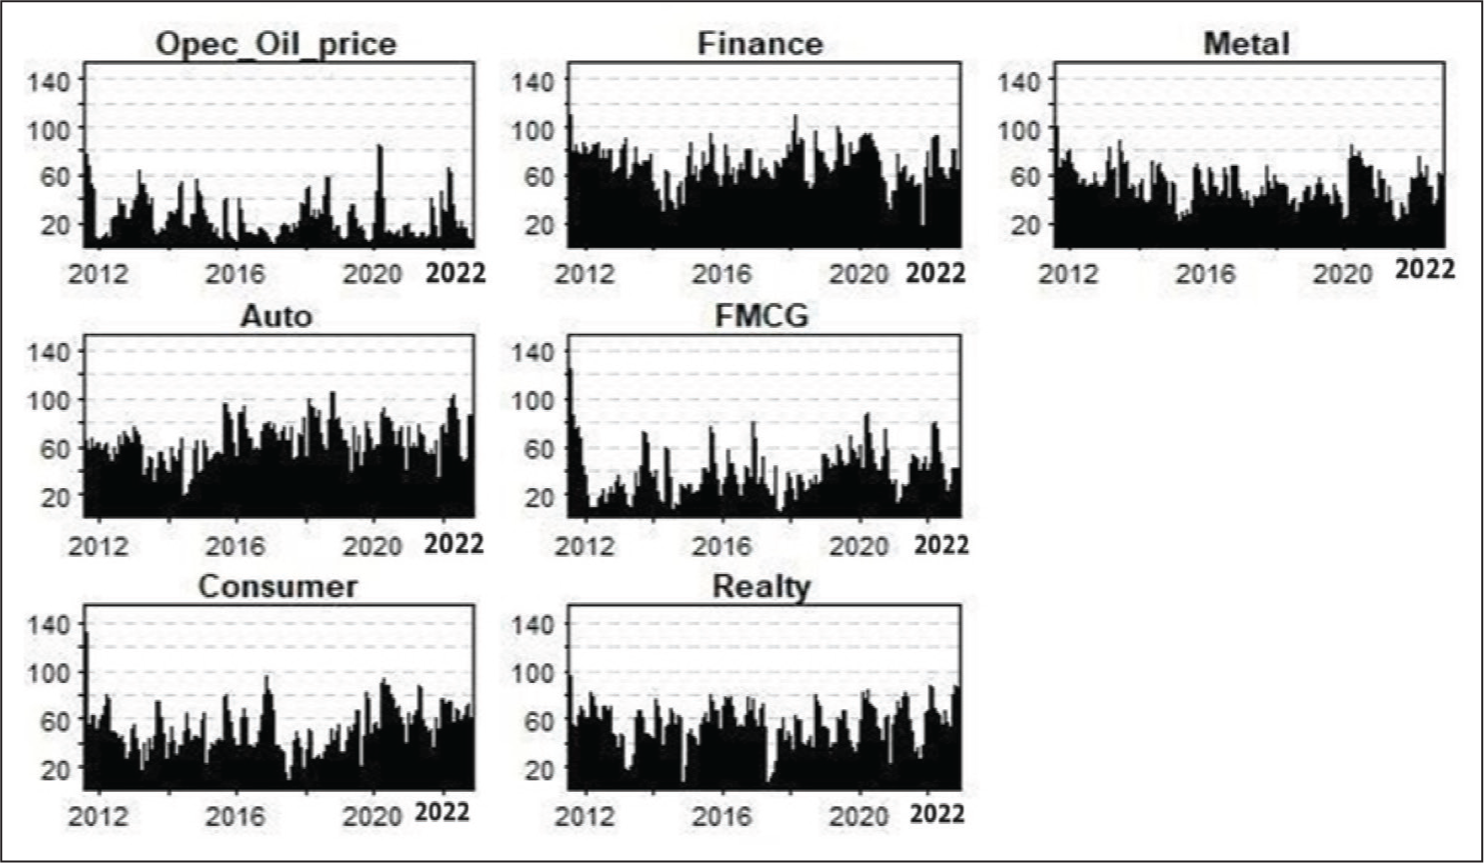
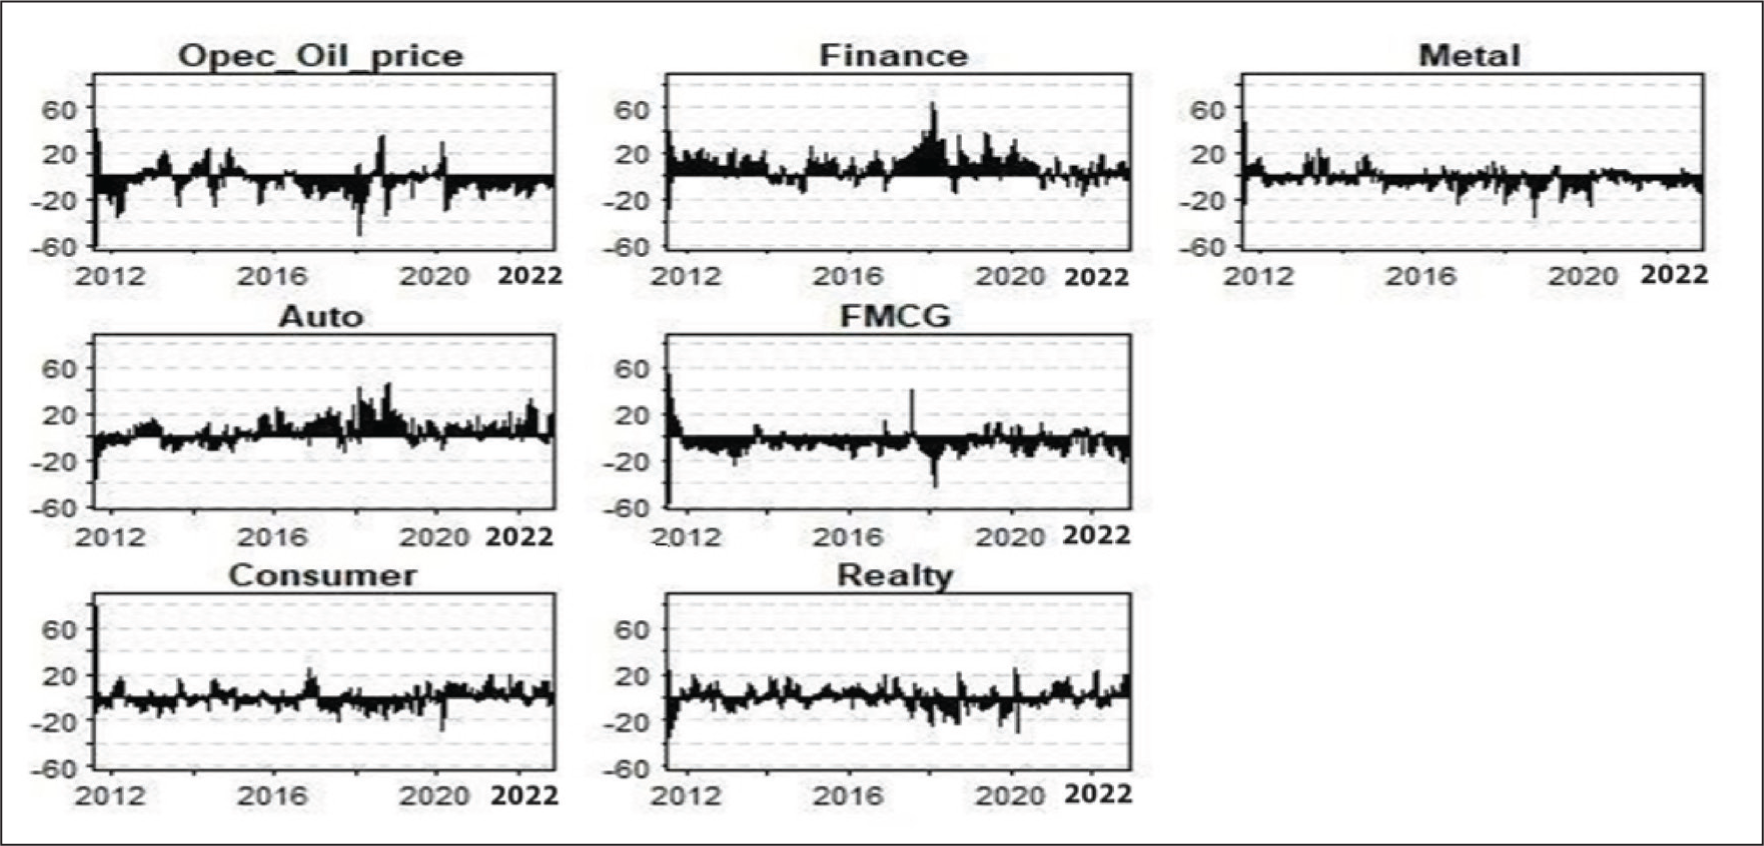
Directional Spillovers (Returns To).
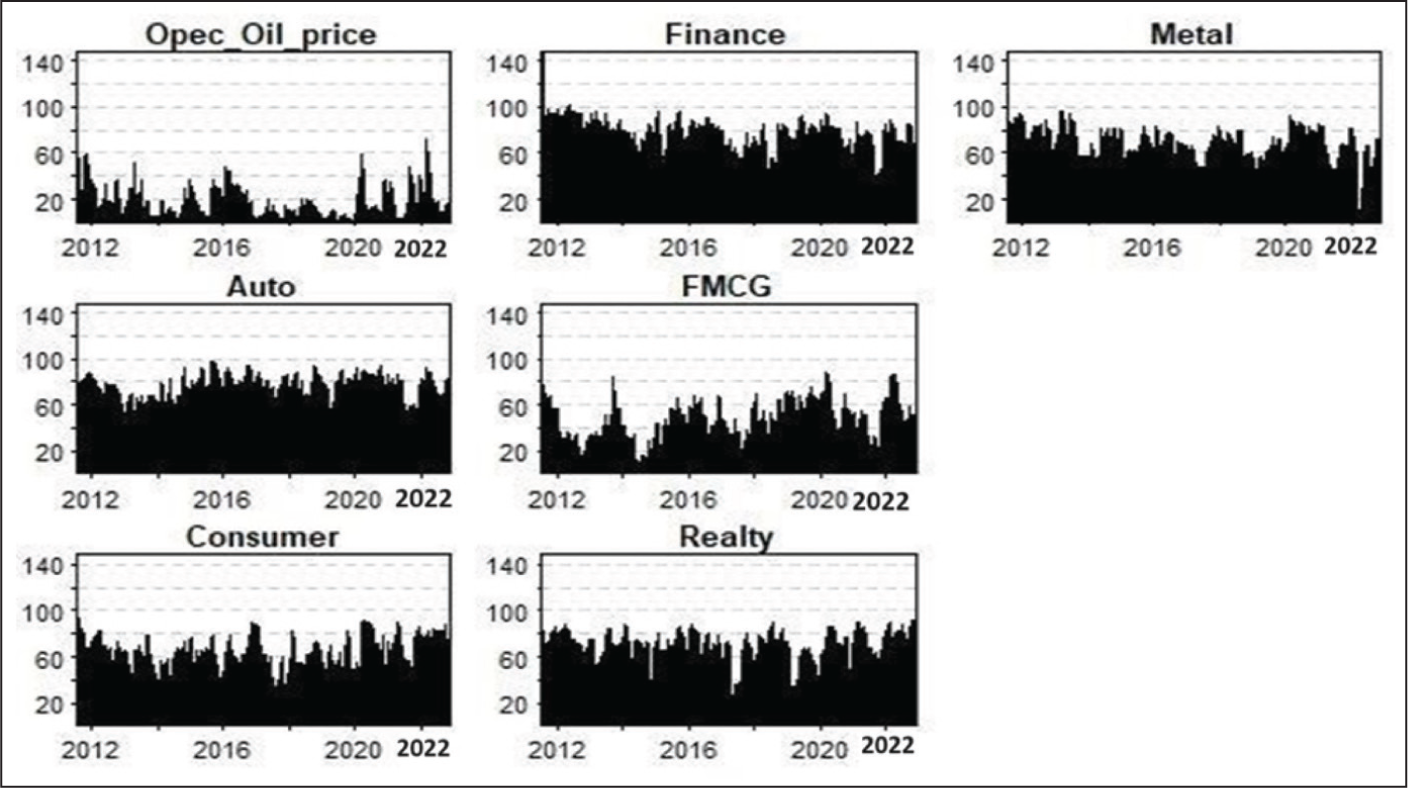
Directional Spillover (Volatility To).
Net Directional Spillovers
The net directional spillover plot displayed represents the difference between the sum of the “Contribution from” column and the sum of the “Contribution to” row.
As seen from Figures 8 and 9 above, OPEC Oil prices and FMCG mostly remain net receivers of shocks, whereas the finance and automobile sectors are mostly net transmitters in terms of returns during the period. The metal, consumer durables, and realty sectors acted as both sources and recipients of net return transmissions.
Net Spillover Plot (Returns).
Net Spillover Plot (Volatility).
Net Pairwise Dynamic Connectedness
Lastly, we examined the net pairwise spillover indices, which provide insights into the transmission of return and volatility shocks between individual sectors and oil prices from a pairwise viewpoint. We plotted the net pairwise spillover indexes in the Figure 10. First of all, pairwise spillover indexes vary in broad ranges, meaning that pairwise connectedness relationships show considerably different magnitudes across e pairs. If the NPDC spillover index is positive (negative), the former is the net information transmitter (receiver), and the latter is the net information receiver (transmitter).
Net Pairwise Directional Connectedness (Returns).
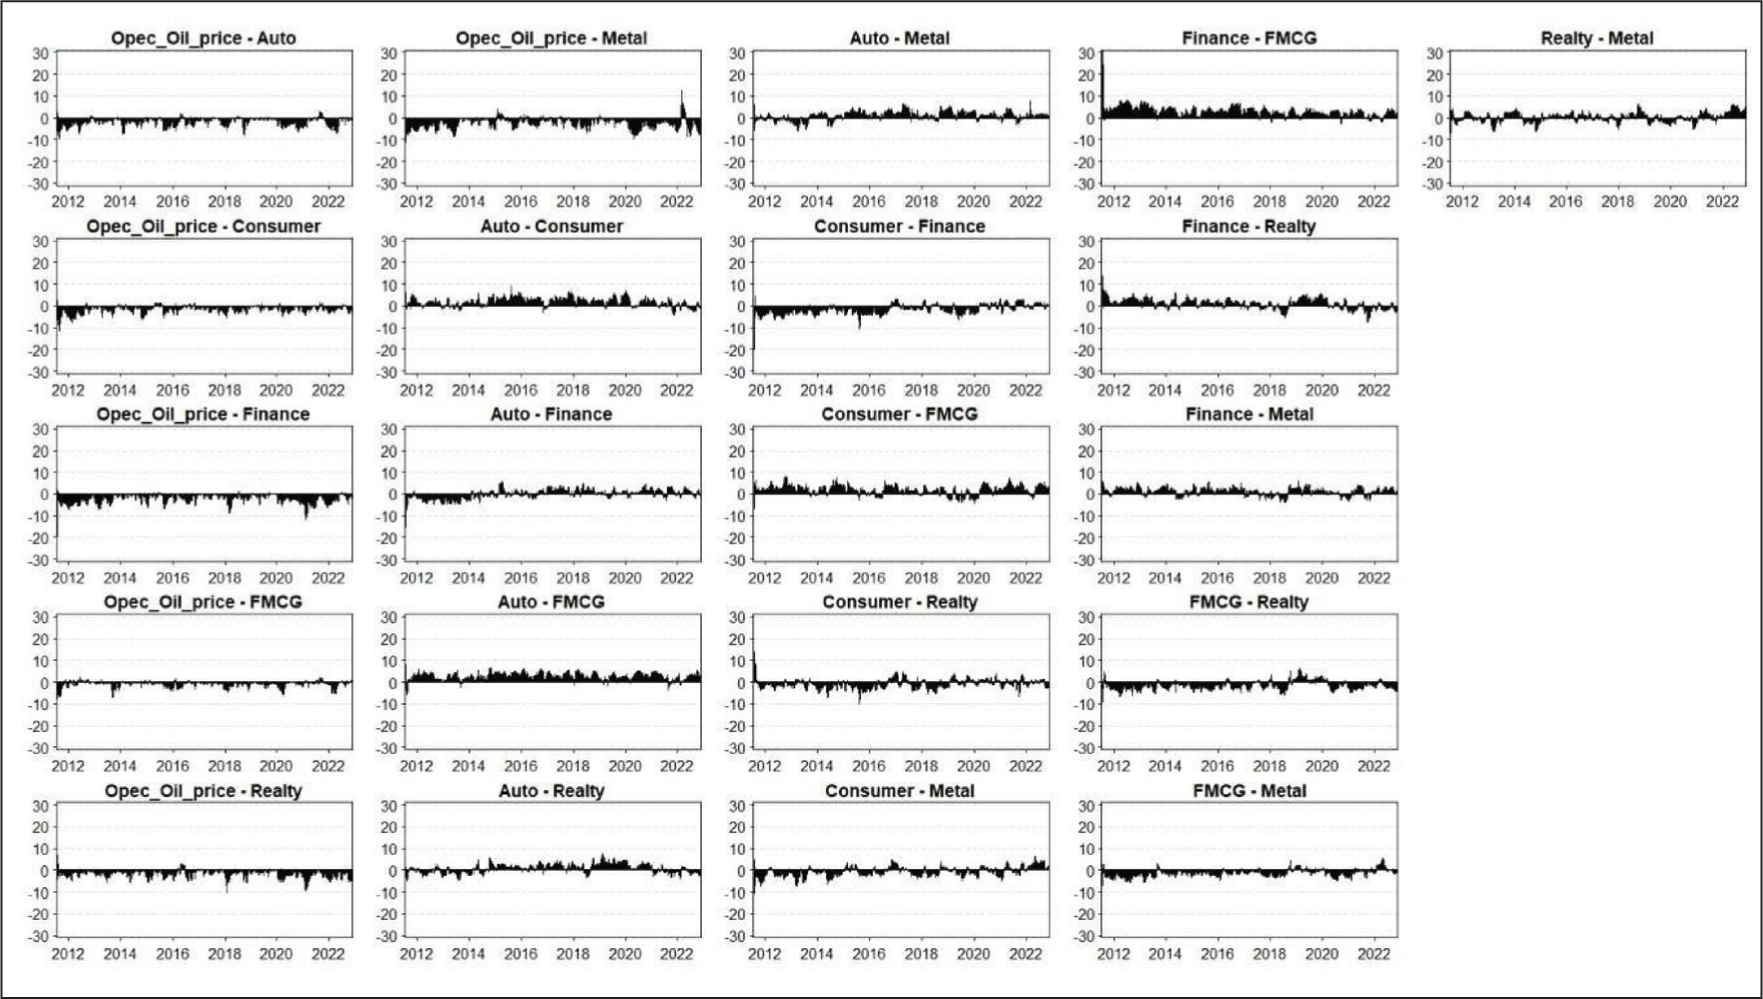
It is evident from Figure 11 that OPEC oil has a prominent returns spillover from the automobile, consumer durables, finance, FMCG, realty, and metal sectors. Also, the automobile sector has prominent spillovers to FMCG and consumer durables. Similarly, finance and realty transmits return spillover to FMCG.
Net Pairwise Directional Connectedness (Volatility).
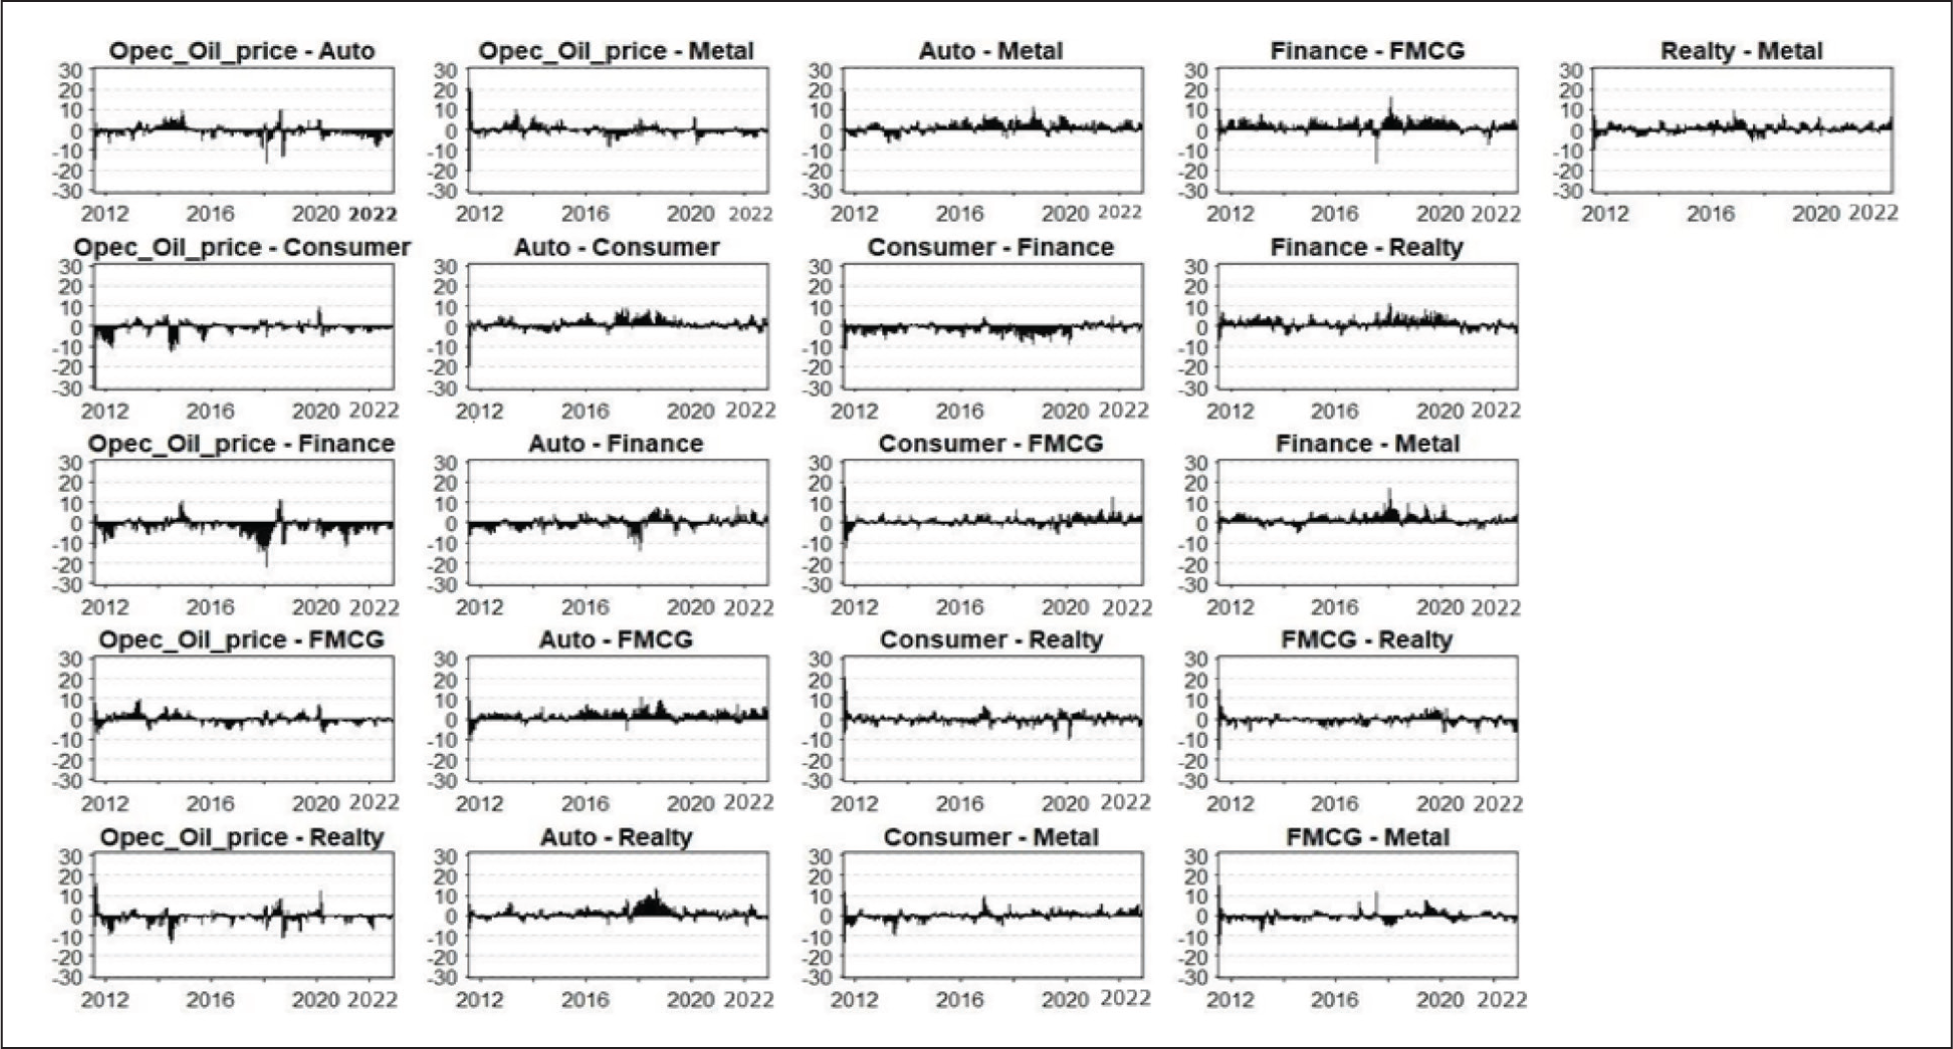
However, such a kind of trend is not so explicitly visible in the case of volatility pairwise connectedness plots.
Conclusion and Discussion
This study investigates both the static and dynamic connectedness between OPEC oil prices and selected Indian sectoral stock indices using the TVP-VAR methodology introduced by Antonakakis et al. (2020), based on daily data spanning from January 3, 2006 to November 25, 2022. The analysis reveals that overall static connectedness is substantial, measuring approximately 64% for returns and 49% for volatility. Notably, during the 2014–2015 oil crisis and the COVID-19 pandemic in 2020, total connectedness increased to around 75%. A key finding is that OPEC oil prices function primarily as a net recipient of shocks rather than as a net transmitter. This finding is in accordance with the result of Umar et al. (2021) which presents compelling evidence that the oil market, particularly its risk and demand shock components, acts as a net receiver of shocks from Spanish equity sectors. The static connectedness analysis reveals that while oil risk and demand shocks do contribute to the variance of equity returns, they are also significantly influenced by the equity markets, clearly designating them as net receivers of system-wide shocks. The study provides robust evidence of a reverse shock transmission mechanism, wherein the oil market—typically viewed as an influential driver of financial market behavior—can, under specific economic conditions, become reactive to developments in equity markets (Umar et al., 2021). When we consider the total connectedness of OPEC oil prices and Indian sectoral stock indices in our study period, there exists more connectedness during the crisis period, but considering directional, net, and pairwise spillovers, such a trend is not visible.
The insights regarding the interconnectedness between oil prices and fluctuations in Indian sectoral equity returns carry important implications for investors, portfolio managers, and policymakers. Sector-level findings are particularly valuable for informing portfolio diversification and risk management strategies, as they reveal patterns and trends that may be obscured when analyzing aggregate market data.
Footnotes
Acknowledgements
The author would like to thank Dr. Anoop S Kumar (Assistant Professor at Gulati Institute of Finance and Taxation), for his valuable feedback.
Declaration of Conflicting Interests
The author declared no potential conflicts of interest with respect to the research, authorship, and/or publication of this article.
Funding
The author received no financial support for the research, authorship, and/or publication of this article.