
Abstract
Environmental, social, and governance (ESG) investing assists individuals in matching their investment decisions with their personal beliefs, thereby encouraging businesses to adopt responsible practices. This study applies the Fama–French five-factor model to investigate two ESG risk premia using a dataset comprising daily stock prices from Center for Research in Security Prices, MSCI World ESG Focus Index returns, and S&P Petroleum Index returns, spanning June 2011 to March 2021. Firm-level ESG scores were sourced from MSCI, and monthly Fama–French factors were obtained from the Kenneth R. French Data Library. Two ESG factors were constructed: one defined as the disparity between the MSCI ESG Index and the S&P Petroleum Index and the other as the difference between high-ESG firms and low-ESG firms rated by MSCI. Results reveal substantial and statistically significant ESG risk premia under the first definition, with an increase in excess returns. However, the second definition showed no statistically measurable risk premia. These findings suggest that investors may benefit from avoiding traditional fossil fuels as the energy sector transitions toward renewable solutions.
Keywords
Introduction
Over the last decade, investors have increasingly focused beyond traditional financial metrics to identify opportunities for achieving excess returns. The Environmental, Social, and Governance (ESG) framework evaluates corporate sustainability and societal impact, aspects often overlooked in conventional asset pricing models (Fama & French, 2018; Kumar, 2023; Renneboog et al., 2008). Koning Beals (2020) emphasizes that investors use ESG to assess a firm’s long-term sustainability and societal contributions. This shift has been accelerated by climate change concerns and workforce diversity initiatives (Holder, 2017; Newburger, 2021). As a result, sustainable investing surged, with asset managers integrating ESG principles rising from 10% in 2016 to over 70% by 2018 (Stanley & Bloomberg, 2019), contributing to over $250 billion in sustainable fund assets by 2020 (Hale, 2021). The Fama–French five-factor model, which extends the Capital Asset Pricing Model (CAPM) by including size, value, profitability, and investment factors (Fama & French, 2015), does not explicitly incorporate ESG factors, leaving a gap in understanding whether ESG represents a priced risk factor. This study builds on previous research by integrating ESG factors into asset pricing and critically assessing the methodological limitations of past ESG studies, which often yield mixed evidence (Berg et al., 2022; Dorfleitner et al., 2020; Gregory et al., 2021; Lioui, 2018 2018a, 2018b). Some studies show that high ESG-rated firms outperform, particularly smaller companies (Dorfleitner et al., 2020; Gregory et al., 2021), while others, especially those using post-global financial crisis data, find no significant ESG risk premium (Berg et al., 2022; Lioui, 2018a, 2018b). Many studies rely on biased ESG ratings from providers like MSCI or Sustainalytics (Amel-Zadeh & Serafeim, 2018) or focus on specific regions or industries, limiting generalizability (Friede et al., 2015). The relationship between ESG and financial returns varies significantly across sectors and geographies (Bolton & Kacperczyk, 2021; Khan et al., 2016). This study investigates two ESG definitions: MSCI ESG Index Minus S&P Petroleum Index (EMP Factor)—a market-based ESG measure. High ESG Firms Minus Low ESG Firms (MSCI ESG Ratings)—a firm-level ESG factor. Findings show that defining ESG as the MSCI ESG Index minus the S&P Petroleum Index yields a robust and significant risk premium, with a one-unit change in ESG beta leading to an 8.7% increase in excess returns in size-decile portfolios. This supports the view that ESG is a priced risk factor, particularly in industries with high environmental exposure (Fama & French, 2015; Khan et al., 2016). However, defining ESG through firm-level MSCI ratings results in no statistically measurable risk premium, indicating that static ESG scores fail to capture ESG’s financial impact. Further analysis at the one-digit SIC level reveals that ESG premia are not uniform across industries. Only firms in the petroleum industry (SIC Code 1) show a statistically significant positive relationship between ESG and excess returns, reinforcing that ESG matters most in industries with direct environmental risks (Bolton & Kacperczyk, 2021). Investor preferences for ESG can drive demand-based price effects, leading to higher valuations for ESG-focused firms (Pedersen et al., 2021). However, this effect is not universal, as investor priorities vary across regions (Scholtens & Sievänen, 2013). A key limitation of ESG research is its reliance on static ESG scores, which may not reflect corporate ESG performance over time (Khan et al., 2016). Many ESG ratings, such as MSCI and Sustainalytics, provide only a snapshot of sustainability efforts, failing to capture long-term improvements (Amel-Zadeh & Serafeim, 2018). This is particularly problematic in transitioning industries, such as energy, where firms shift toward renewable energy (Bolton & Kacperczyk, 2021). For investors and portfolio managers, these findings suggest that ESG factors can enhance returns, particularly in industries with high environmental risks. The strong ESG risk premium in petroleum implies that reducing exposure to fossil fuels and reallocating capital toward ESG-aligned firms may yield financial benefits. However, since ESG does not uniformly contribute to excess returns, sector-specific ESG investing is more effective than a one-size-fits-all approach. Policymakers can encourage ESG integration by standardizing ESG reporting frameworks and offering tax incentives for sustainable investments. The significant fund inflows into ESG products in 2020 highlight growing investor interest, reinforcing the need for transparent ESG metrics (Hale, 2021). Developing more dynamic ESG evaluations can ensure that ESG factors are properly priced in financial markets, allowing investors to make informed decisions and encouraging firms to enhance sustainability practices (Pedersen et al., 2021; Scholtens & Sievänen, 2013). This study contributes to ESG literature by demonstrating that ESG factors influence asset pricing, but their impact varies by industry and definition. While ESG premia are significant in high-risk environmental sectors, firm-level static ESG ratings fail to capture excess returns. Future research should focus on real-time ESG metrics and their long-term impact across economic conditions, ensuring more accurate ESG pricing in financial models (Auer, 2016; Friede et al., 2015; Revelli & Viviani, 2015). Searchum Index produces significant risk premia, particularly in energy-related sectors. However, firm-level static ESG ratings fail to capture a consistent relationship with excess returns, emphasizing the need for dynamic ESG evaluation methods. These findings reinforce the idea that ESG investing can enhance returns, but only in industries with significant environmental risks. Investors should consider sector-specific ESG dynamics and avoid relying solely on static ESG scores. Additionally, policymakers should promote standardized ESG reporting and incentives for sustainable investments to ensure that ESG factors are accurately reflected in financial markets. Future research should focus on developing real-time ESG metrics and exploring the long-term impact of ESG investing across different economic conditions.
Literature Review
The modern foundation of asset pricing began with the CAPM based on Sharpe (1964) work, which used a regression analysis to relate market returns to individual security returns. The CAPM model was later iterated on by Fama and French in 1993 with the three factors, which considered size, book, and the market terms from the CAPM model. Fama and French found that these three coefficients created a more explanatory model, demonstrating the relationship between value companies (high book to market) and small companies experiencing more significant excess returns (Fama & French, 1992). In addition to adding the two factors, Fama and French also incorporated the two-pass sort methodology, which isolates portfolio sensitivity and risk premia in a multi-step regression process (Bennani et al., 2018; Kleibergen & Zhan, 2015).
Fama and French (2015) innovated the five-factor model in 2015 by adding two additional regressors: investment and profitability. The five-factor model analysis found that adding the investment and profitability factors made the value factor redundant (Fama & French, 2015). The reliability of the factors has been shown by replications on international exchanges and has been found to hold in Germany, China, and Japan but did not hold for Australia (Fama & French, 2017; Newey & West, 1987; Racicot, Rentz, Tessier, & Théoret, 2019; Roy & Shijin, 2018). The Fama–French five-factor model is the standard in asset pricing and is the basis for many academic research projects that extend the five-factor model to address additional unpriced factors (Dirkx & Peter, 2020). Gregory et al. ( 2021) use a sixth factor as an ESG factor to analyze if the ESG effect played a significant role in determining risk premia and found a significant and positive risk premium of the factor sustainability.
Literature on ESG investing has become a quickly growing academic interest, with researchers finding both strong evidence for a non-priced ESG factor and no evidence of a noticeable ESG factor. In addition to Gregory et al.’s (2021) paper, several other authors have used the Fama–French model to address the question concerning ESG and risk premia. To set up an ESG Fama–French model, many academic journal articles use an index as a positive ESG portfolio and another index as a negative portfolio to create the ESG factor (Díaz et al., 2021; Zaremba & Czapkiewicz, 2017). Gregory et al. (2021) use the S&P ESG Index as the high ESG index and the S&P Petroleum Index as the low index to create a factor by subtracting the returns from the high ESG portfolio from the low ESG portfolio. Dorfleitner et al. (2020) collected Thomas Reuter’s controversies and combined ESG scores for 2,500 companies. With the ranked ESG score data, the authors then create two portfolios by separating the top decile score and the bottom decile scores, which act as the ESG and contra-ESG portfolios. Small companies with high ESG scores, particularly those avoiding controversies, are often initially underpriced by the market but tend to outperform similar-sized companies with poor ESG records over time, as authors recognize their sustainability and lower risk profile, leading to higher stock returns. Although authors have found positive evidence, other authors have found no such evidence of a relationship. While some studies, such as those by Gregory et al. (2021) and Dorfleitner et al. (2020), have found positive relationships between ESG factors and excess returns, others, like Berg et al. (2022) and Lioui (2018a, 2018b), have found no significant relationship. This inconsistency may stem from differences in how ESG factors are defined and measured. For instance, recent studies by Pedersen et al. (2021) and Bolton and Kacperczyk (2021) emphasize that the lack of standardized ESG metrics across studies makes it difficult to compare results. The study addresses this gap by employing two distinct definitions of ESG risk premia: one based on the difference between the MSCI ESG Index and the S&P Petroleum Index and another based on firm-level ESG ratings from MSCI. Dependence on static ESG ratings, which do not account for changes in corporate behavior over time, Khan et al. (2020) argue that ESG performance is not static and that firms often improve their ESG practices in response to regulatory and market pressures. Similarly, Eccles et al. (2020) highlight that the financial impact of ESG factors may vary over time, particularly during periods of market volatility or economic downturns. The study addresses this gap by analyzing a dataset that includes significant market events such as the COVID-19 pandemic.
Industries, such as energy and mining, are more directly impacted by environmental concerns; others, such as technology and healthcare, may be more influenced by social and governance factors. Zerbib (2020) and Cheng et al. (2021) have called for more granular analyses of ESG performance across different sectors. The study addresses this by examining ESG risk premia at the one-digit SIC level. Amel-Zadeh and Serafeim (2020) argue that the lack of robust methodologies in ESG research has led to inconsistent findings. The study addresses this by employing the Fama–French five-factor model, which is widely regarded as the gold standard in asset pricing.
Berg et al. (2022) and Lioui (2018a, 2018b) investigate the MSCI ESG rating data to construct equal-weighted portfolios as far back as 1991 and perform a Fama–French analysis and find that in a post- GFC test, there is no excess return for a long vital ESG and a short poor ESG factor. Lioui (2018a, 2018b) does note that there is a relationship between the size and the coefficient for the ESG factor.
Additionally, some authors have examined the excess returns on ESG portfolios and assessed the effects over calendar years. Work from Bennani et al. (2018) explored the post-GFC landscape for ESG investing and found that in North American stocks from 2010 to 2013, investing with ESG screening reduced excess returns; however, from 2014 to 2017, the authors found that ESG screening created 3.3% excess returns annually (Fish et al., 2019; Hale, 2021; Holder, 2017; Nofsinger & Varma, 2014). There is a limited understanding of how investor influences the relationship between ESG factors and financial performance. Bebchuk and Tallarita (2020) and Scholtens and Sievänen (2021) have highlighted the role of investor preferences in driving demand for ESG-focused investments. However, there is still a lack of empirical evidence on how these preferences translate into financial outcomes. The study addresses this by analyzing fund flows into sustainable investment products, which have grown significantly in recent years. The current study addresses several critical gaps in the ESG literature, including the lack of consensus on ESG risk premia, the temporal dynamics of ESG performance, sector-specific effects, methodological limitations, investor behavior, and regulatory implications.
Methodology
Sample Selection
The study’s sample consists of 12,194 unique stocks, covering daily stock prices from Center for Research in Security Prices (CRSP) between June 2011 and March 2021. The dataset includes firms with at least 68 months of data on average per security. The sample was selected to ensure a broad representation of ESG-focused and non-ESG firms, incorporating MSCI ESG scores, MSCI World ESG Focus Index returns, and S&P Petroleum Index returns. By merging ESG ratings with stock return data, the study ensures comprehensive coverage for analyzing ESG risk premia.
Data Sources
The study integrates data from four primary sources: CRSP provides daily stock price data for firms in the sample. CAPIQ Compustat supplies daily return data for the MSCI World ESG Focus Index (representing high ESG firms) and the S&P Petroleum Index (representing low ESG firms). MSCI offers firm-level ESG scores, which classify companies based on sustainability and corporate responsibility performance. Kenneth R. French Data Library provides Fama–French five-factor model data, including market risk premium (MKT), size (SMB), value (HML), profitability (RMW), and investment (CMA). These datasets were merged and cleaned to create a comprehensive time-series panel dataset, which was then collapsed to a monthly level for analysis.
Study Variables
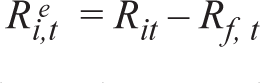
The study incorporates several key variables to analyze ESG risk premia within the Fama–French five-factor model framework. The dependent variable is excess stock returns Rit – Rf, calculated as the monthly stock return minus the risk-free rate. The independent variables include two ESG factors: the EMP Factor (ESG Minus Petroleum) EMPt, defined as the difference between the MSCI World ESG Focus Index and the S&P Petroleum Index returns, and the MSCI ESG Factor ESGt, constructed by subtracting the returns of low ESG-rated firms (bottom 10%) from high ESG-rated firms (top 10%) using MSCI ESG scores. To control for other return drivers, the study includes the Fama–French five-factor model variables, namely the market risk premium MKTt, size factor (small minus large) SBMt, value factor (high minus low) HMLt, profitability factor (robust minus weak) RMWt, and investment factor (conservative minus aggressive) CMPt. Additional variables include market capitalization, used for sorting stocks into size deciles, and beta (β), which measures systematic risk. Firm-level ESG scores, assigned by MSCI on a scale from AAA (highest) to CCC (lowest), provide further insight into ESG performance, while sector classification (SIC codes) is used to examine industry-specific ESG risk premia, particularly in sectors like energy and petroleum. These variables enable a comprehensive assessment of ESG’s role in asset pricing and its impact on excess returns.
Analysis and Methods
The data and methodology for the article are broken into two sections; first, a preliminary study is conducted using a broad-based ESG factor constructed from two market indices to confirm a statistical relationship between ESG and excess returns. Next, another ESG factor is constructed using the MSCI ESG dataset to isolate additional ESG risk.
In the first stage of the analysis, an ESG factor is created by taking two market indices and subtracting their daily returns in an attempt to isolate ESG-based risk. The formula for this factor is represented in Equation (1), and for the remainder of this analysis, this ESG factor will be referred to as the EMP factor (ESG minus petroleum). This method of creating a factor is based on the famous French model used by the other four factors in the five-factor model. This analysis used the MSCI World ESG Focus Index as the high ESG portfolio and the S&P petroleum index as the low ESG portfolio (Bennani et al., 2018; Pal, 1980; Racicot, Rentz, Kahl, & Mesly, 2019). The choice of the petroleum index was based on Frynas (1994) and Gregory et al. (2021), where the authors demonstrated the index’s sensitivity to contra-ESG factors (Frynas, 1994). The petroleum index provides a good contra-ESG portfolio, as the petroleum industry is in direct opposition to environmental goals that are “E” components of ESG. A similar analysis could also be run with other market indices. The S&P Mining Index is another popular index that also performs very poorly for environmental and social concerns (Kapelus, 2002; Lioui, 2018a, 2018b). A third index that also could represent a contra-ESG portfolio is the $VICE ETF. This financial product tracks the market for alcohol, drug, gaming, and betting industries, which have all been shown as clear contra-ESG industries (Gibson Brandon et al., 2021; Grougiou et al., 2016; Pastor et al., 2019).

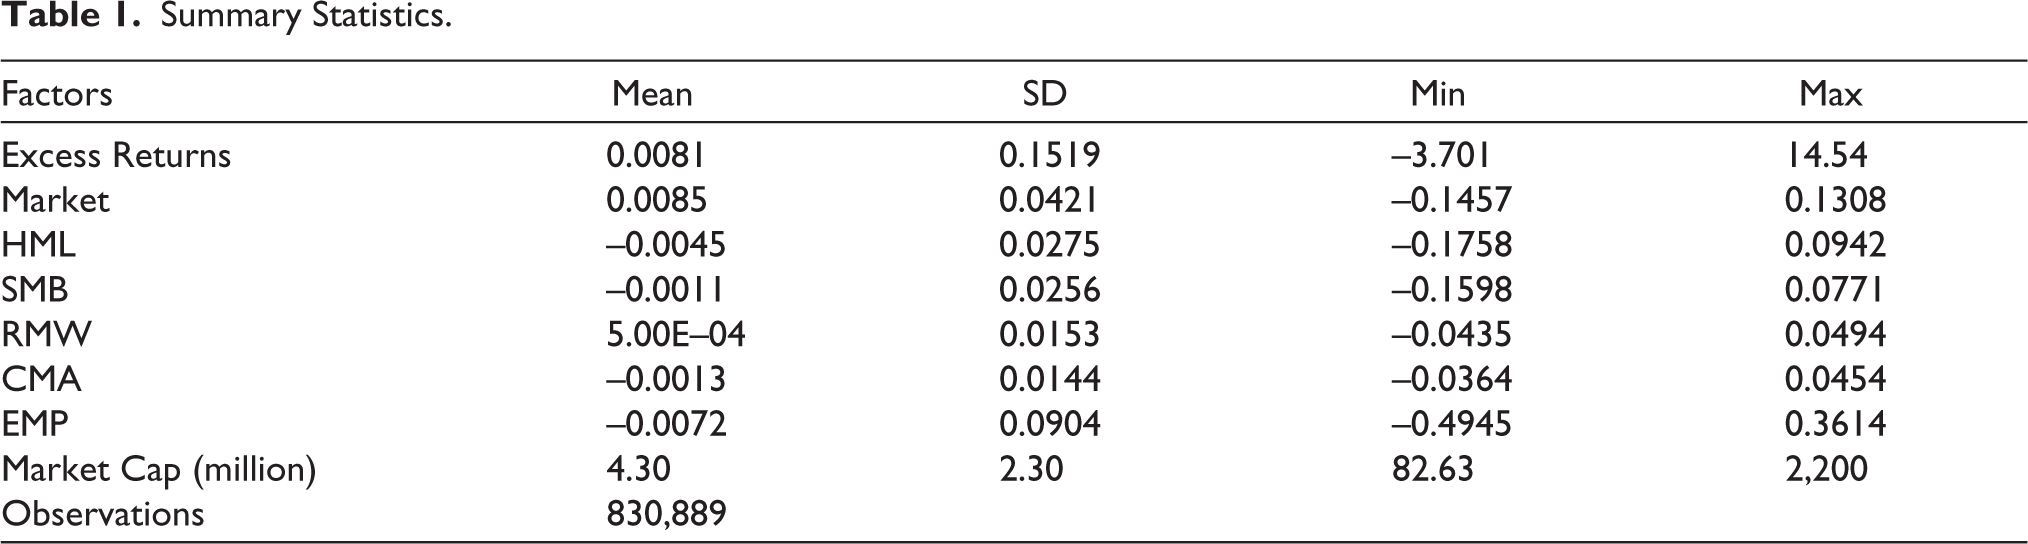
The EMP (ESG minus petroleum) factor is constructed by subtracting the daily returns of the S&P Petroleum Index, representing a low-ESG portfolio due to its environmental impact, from the daily returns of the MSCI World ESG Focus Index, a high-ESG portfolio, as shown in Equation (1). This approach isolates ESG-related risk by capturing the return differential between firms with strong sustainability practices and those in the contra-ESG petroleum sector. To conduct this analysis, daily data were collected between June 2011 and March 2021. June 2011 marks the initiation of the MSCI ESG index; as such, this is the beginning of the sample period for this article. Daily individual stock return information from CRSP was merged with the daily ESG factor returns. The resulting merged data were collapsed on months to create a monthly return figure by summing all the daily returns, implying simple additive returns rather than log-transformed returns, as detailed in the methodology for aggregating daily data into monthly figures. This approach is consistent with studies like Fama and French (2015), which use simple returns for factor construction and regression analysis in asset pricing models, ensuring comparability and simplicity in capturing total return dynamics over time. Next, the Fama–French monthly factors were merged into the dataset for each firm for each month. After aggregating the factor and individual firm return, there were 830,889 observations of monthly return data for 12,194 unique stocks. The merged and cleaned dataset had an average of 68 months of data for each security. Table 1 provides summary statistics for the data in the first analysis stage.
Summary Statistics.
In the second stage of the analysis, the definition of the ESG factor is changed to isolate additional ESG risk. In the first part of the analysis, the contra-ESG portfolio’s main concern cantered on environmental risk. To increase exposure to social and governance while maintaining exposure to environmental risk, a portfolio is constructed from MSCI ESG ratings. MSCI provides public ratings for 546 firms and issues a rating from AAA to CCC, where AAA is the highest ESG rating and CCC is the lowest ESG rating. In the sample of MSCI ratings, 16 companies were AAA, 88 companies were AA, 118 companies were A, 170 companies were BBB, 108 companies were BB, 40 companies were B, and 5 companies earned a CCC rating. Each of these ratings was assigned a matching numeric score (1–7) and was merged using the CRSP name file to their corresponding kypermno value by matching ticker information. The data were merged into the monthly return dataset described at the end of the first analysis. To create an ESG factor with the MSCI rating, numeric ratings were split into deciles, and a high minus low ESG factor was generated by taking the top 10% of ESG firms and subtracting that from the bottom 10% of ESG firms, as described in Equation (2). For the remainder of this analysis, the MSCI ESG factor will be referred to as the ESG factor or the MSCI ESG factor.

As discussed in the literature review, there are numerous models for assessing asset pricing and excess returns. The study used an extension of Fama and French (2015) article and the analysis method is built on the Fama–French five-factor model and relies on the two-pass sort. First, the research explains the methodology for assessing the sensitivity and risk premium for the ESG factor created from the MSCI ESG Index minus the Petroleum Index. Next, we discuss the methodology for MSCI ESG rating ESG factors and conclude with a brief description of the Newey West errors and the setup of assessing statistical significance.
The first part of this study focused on sorting each security into decile groups based on beta and size. The size and beta decile ratings are provided by CRSP and are merged on the individual firm level for each month of data. The study uses firm-level ESG scores from MSCI, which are static snapshots from April 2021, applied across the entire June 2011 to March 2021 analysis period. This approach is chosen despite its limitation because MSCI’s publicly available ratings for 546 firms provide a consistent, albeit static, measure of ESG performance despite its static nature and effectively support the analysis of ESG risk premia. Next, the first pass for the two-pass sort was conducted by running the regression of excess returns on market risk premia, the four Fama–French factors, and the EMP factor as described in Equation (3). This regression was run twice: once on the beta-ranked portfolios and again on the size-ranked portfolios. The first pass provides insight into the factor’s sensitivity on the decline index.
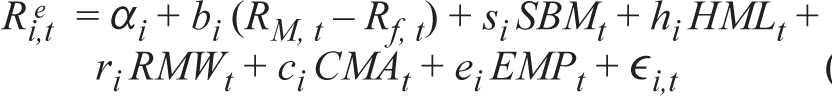
where
Next, the research used output data from Equation (3) to run the second regression in the two-pass sort described in Equation (4). The second pass represents the risk premia for each of the six factors in the model, where λ represents the coefficients of the factors Market Risk Premium, SBM, HML, RMW, CMA, and EMP. This second pass was performed for both beta- and size-based portfolios.

The second regressions focus on establishing a link between MSCI ESG ratings and excess returns. Similar to the first set of regressions, a two-pass sort methodology was utilized using both size- and beta-ranked portfolios. To create the ESG factor for this set of analyses, the ESG factor was used. The process of implementing the regression follows the same basic form as the one for the MSCI ESG Index and Petroleum Index ESG factor by first running a pass on the portfolio by size (beta) decile and following that with a cross-sectional analysis to quantify the risk premium.
Finally, in determining the statistical significance of each coefficient, it is essential to discuss the Newey West error. The Newey West error is a replacement for the standard error in a traditional OLS regression. The advantage of the Newey West is the ability to account for serial correlation within the model.
Results
Table 2 represents a matrix of values for the first pass in the Fama–French two- pass sort, described in Equation (3). The row axis is the distinct size deciles, where 1 is the smallest 10% of companies by market cap companies and 10 is the decile with the largest 10% of companies by market cap. The column axis includes estimated coefficients for the five Fama–French and EMP factors. HMLt is the difference between the returns on diversified portfolios of the high and low book-to-market stocks. SMBt is the return on a diversified portfolio of small stocks minus the return on a diversified portfolio of big stores. RMWt is the difference between the returns on diversified portfolios of stocks with robust and weak profitability. CMAt is the difference between the returns on diversified portfolios of the stocks of low and high investment firms. EMPt differs between MSCI World ESG Focus Index returns and the S&P Petroleum Index. The results in Table 2 demonstrate that for HML, CMA, and EMP factors, there is a size-based relationship wherein the more significant the size decile, the smaller the sensitivity effect is on the factor. This relationship indicates that investors are returning a premium by investing in ESG companies over the contra-ESG counterparts and that this relationship is strongest for small companies. Dorfleitner et al. (2020) state that most excellent size-based sensitivity is for small firms. The results from this statistical test are significant at the 5% level for the EMP factor for all of the portfolios except the smallest and largest size portfolios. However, several of the Fama–French factors are also not significant for the largest and smallest portfolios. This finding indicates that these tail portfolios behave differently and may require winsorizing rather than a reflection of the factor’s significance.
The First Pass of the Two-pass Sort where Size Deciles Break Up the Portfolios.
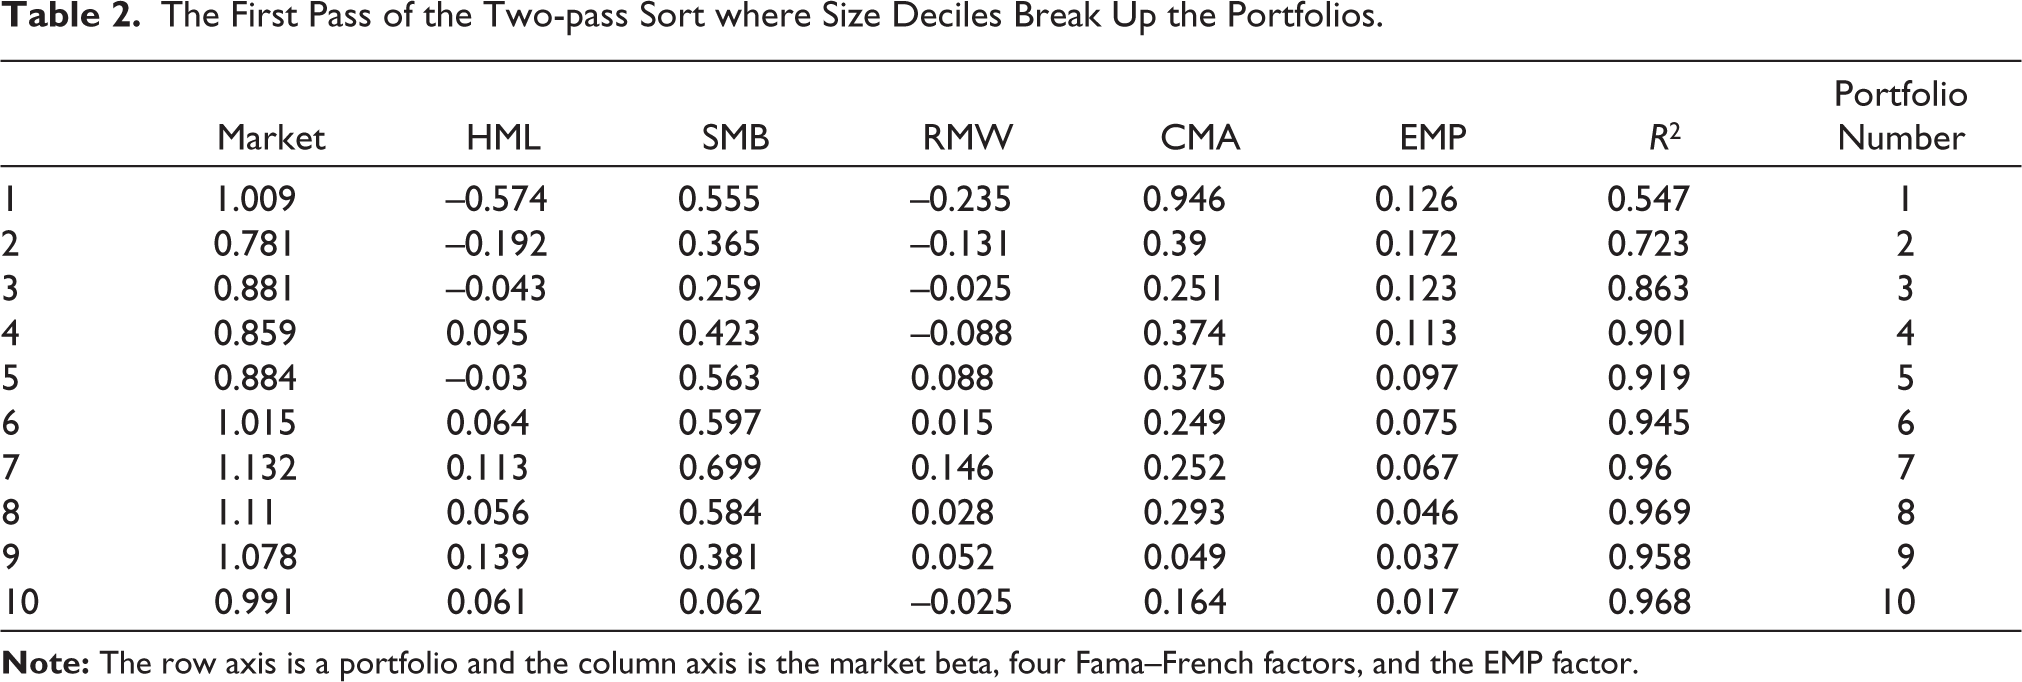
Table 3 demonstrates the risk premia for each factor using the second step in the two-pass sort for size decile portfolios. The dependent variable is the average monthly excess return, and the independent variables are factor sensitivities from the first pass, including Market, HML, SMB, RMW, CMA, and EMP, with significant risk premia for Market, SMB, CMA, and EMP. The EMP factor shows a 7.36% increase in excess returns per unit of beta. The market factor, the SMB factor, the CMA factor, and the EMP factor are all positive and statistically significant at the 1% level. The other two factors have a negative sign and are not statistically significant at the 10% level. The EMP factor demonstrates that a 1-unit change in beta corresponds with an 8.7% increase in excess returns. Although this is by far the smallest coefficient of the four statistically significant factors, this term is still economically meaningful and represents a risk premium that can be achieved by investing in high-ESG firms. Overall, the model fits the data reasonably well with an R2 value of 87.5%, which is lower than some previous literature using the petroleum index but still indicates a well-fit model (Gregory et al., 2021).
The Results for the Second Pass of the Two-pass Sort with the EMP Factor.
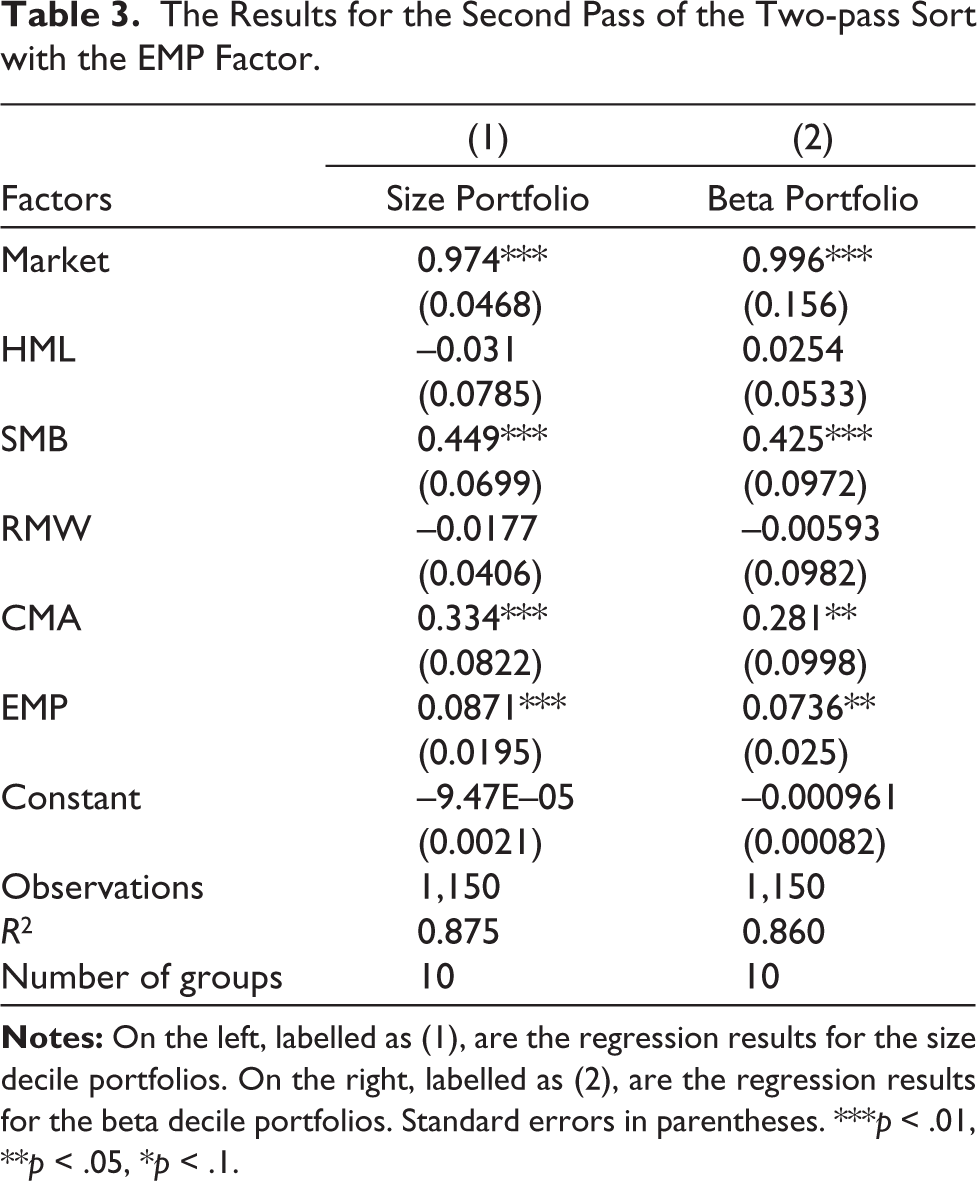
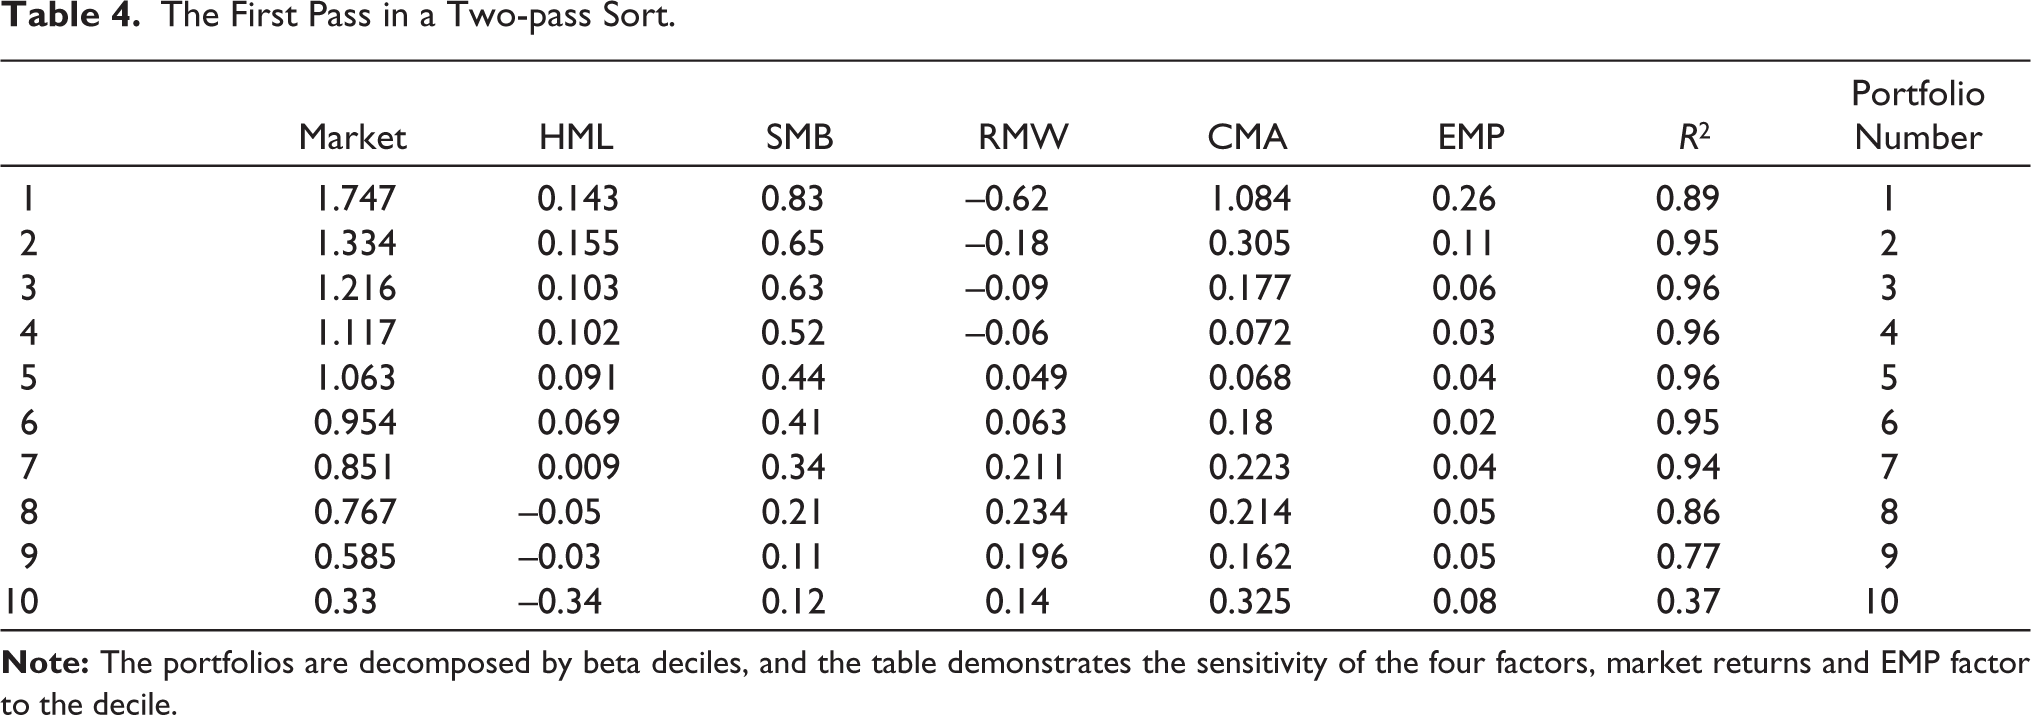
Table 4 details the relationship outlined in Equation (3) in the methodology where the row axis is the beta decile. In this table, the beta decile 1 comprises the companies with the lowest market beta. Similarly, beta decile 10 is the portfolio of companies with the most significant market beta values. Unlike the size decile portfolios, the beta decile portfolios do not have consistently hostile relations with respect to decile. Instead, the relationship appears to have a dome shape where portfolio 6 has the most minor positive sensitivity to the EMP factor, and larger or smaller beta portfolios appear to have a more considerable sensitivity to the EMP factor. Similar to the size decile analysis, the EMP coefficients are all highly significant, with every portfolio having significance at the 5% level.
When considering the second phase of the two-pass sort for the beta decile portfolios, the similarities to the size decile continue wherein market returns, SMB, CMA, and EMP exhibit positive risk premia, and the other two factors remain statistically insignificant. The EMP coefficient indicates that a 1-unit change in beta would result in a 7.36% change in excess returns for a high-ESG company. This result is slightly smaller than the result from the size portfolio but still demonstrates a statistical relationship in the same order of magnitude and suggests the ESG factor can provide excess returns. The beta decile model is a strong fit with an R2 value of 86.0%.
The First Pass in a Two-pass Sort.
The two-pass sort indicates that there is a measurable relationship between the EMP factor and excess market returns. The research analyzed the robustness by first comparing the results of the two-pass sort with the ESG factor to the same analysis without the factor. Next, the research investigates the time-related relationships between ESG and excess returns by implementing a dummy variable for the year and repeating the two-pass sort methodology.
Moving on to the second analysis stage, an ESG factor was constructed from the MSCI ESG ratings to capture a more holistic view of ESG risk, and this factor was created by taking the top 10% of MSCI ESG-rated companies and subtracting them from the bottom 10% of firms rated by the MSCI. The above methodology was repeated for the regression analysis and regressed two sets of two-pass sort regression analyses, one on beta-sized portfolios and another on size-based portfolios. In the first-pass results for the MSCI ESG factor, the beta portfolio demonstrated a decrease in sensitivity as the beta deciles increased. However, the size-based portfolios did not experience any pattern; some of the coefficients were positive, while others were negative.
Table 5 represents the second stage in the two-pass sort regression output. The dependent variable is the average monthly excess return, and the independent variables include factor betas for Market, HML, SMB, RMW, CMA, and MSCI ESG, with significant premia for Market, SMB, and CMA, but the MSCI ESG factor is insignificant, showing no risk premium. Similar to the regression with the EMP factor, the market return, CMA, and SMB remain statistically significant. However, neither the size-based nor beta-based portfolios demonstrate a statistically significant coefficient for the ESG factor. This lack of statistical significance indicates that the MSIC ESG factor is priced into one of the other statistically significant factors and should not produce any excess returns. Further solidifying that the factor is not economically significant is the high R2 value for both of the portfolios, which indicates the firm fit of the model.
The Results for the Second Pass of the Two-pass Sort with the ESG Factor Generated from the Top 10% of MSCI ESG Scores Minus the Bottom 10% MSCI ESG Scores.
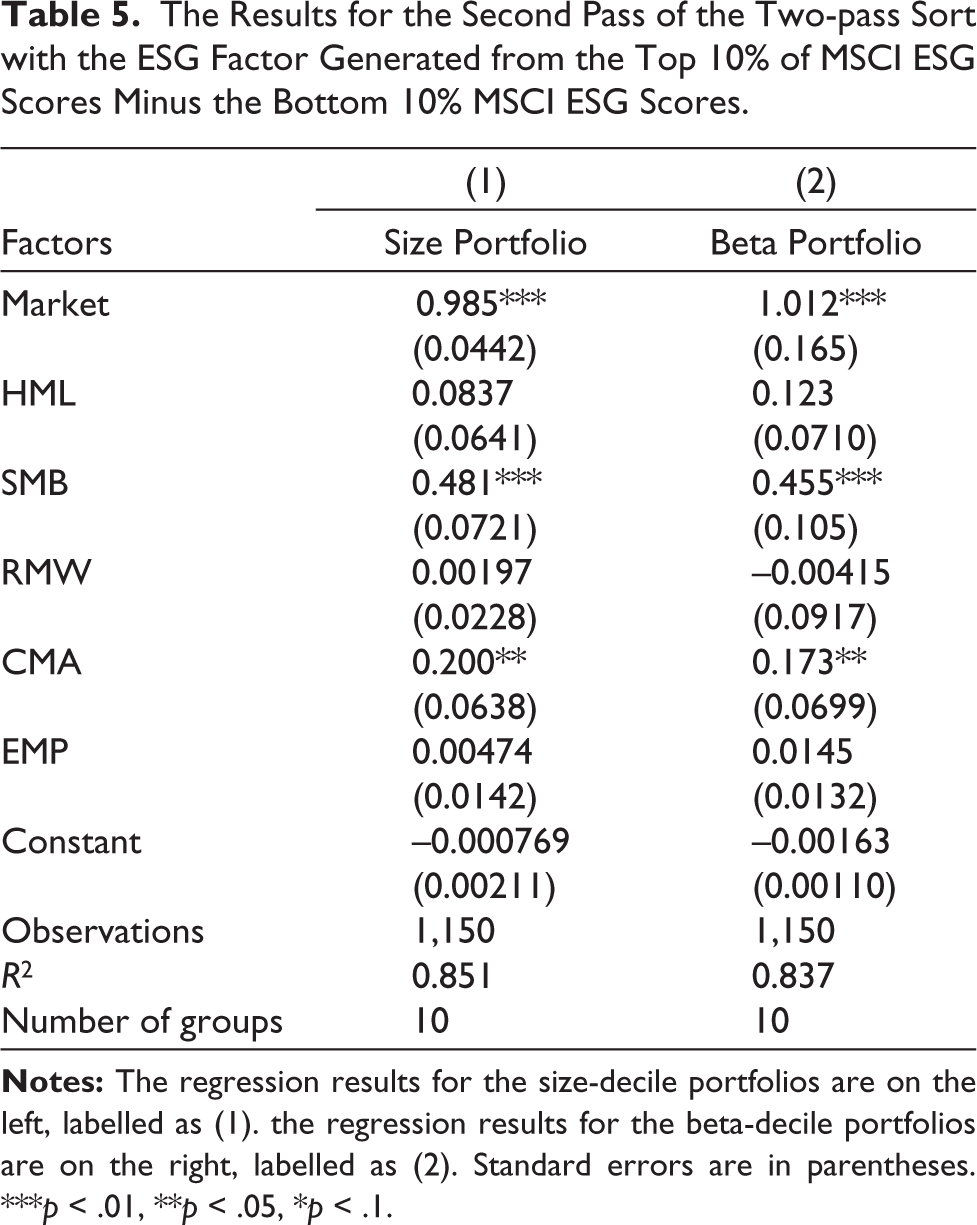
One potential reason that there is no statistical significance for the factor is the limitation of the MSCI data. MSCI only provides current MSCI ESG rating data. As such, a company that used to be a poor ESG firm that has improved to be a strong ESG company will only be categorized as a strong ESG company, which will not accurately address the ESG performance.
The following addresses the data concerns by reducing the time frame and observing if the coefficients increase in significance. Further, to address additional robustness concerns, we will run another two-pass sort on individual industries to see if there is uniformity to the risk prima response to the MSCI ESG factor. The beta portfolio in Table 3 uses the EMP factor, showing a significant 7.36% risk premium; however, Table 5 uses the MSCI ESG factor, with an insignificant 1.45% premium. The EMP factor’s dynamic, market-based approach contrasts with the MSCI ESG factor’s static ratings, affecting their explanatory power.
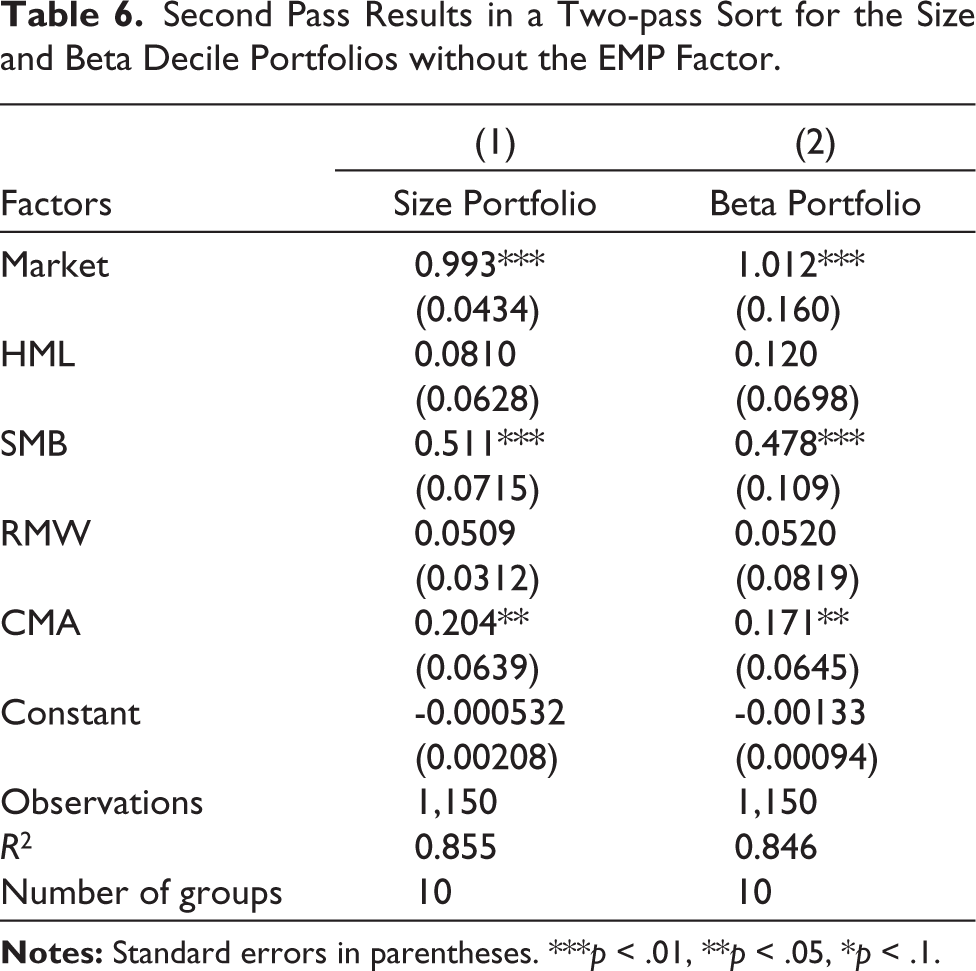
As discussed, additional tests are required to ensure the robustness of the methodology. The first robustness check will run a repetition of the two- pass sort where the ESG factor is calculated as the MSCI ESG Index minus the Petroleum Index (EMP). Table 6 confirms the statistical significance of the market term, the SMB term, and the CMA term. Beyond the coefficients, the results also demonstrate a slightly lower R2 for both the Beta decile and the size decile variants, demonstrating that the EMP term contributes to the explanation of excess returns. In addition, the constant term for both size and beta decile portfolios increased in magnitude due to omitting the EMP. As the coefficient term gets closer to zero, the factors better describe the excess return and relationship and eliminate all other sources of unexplained excess returns.
Second Pass Results in a Two-pass Sort for the Size and Beta Decile Portfolios without the EMP Factor.
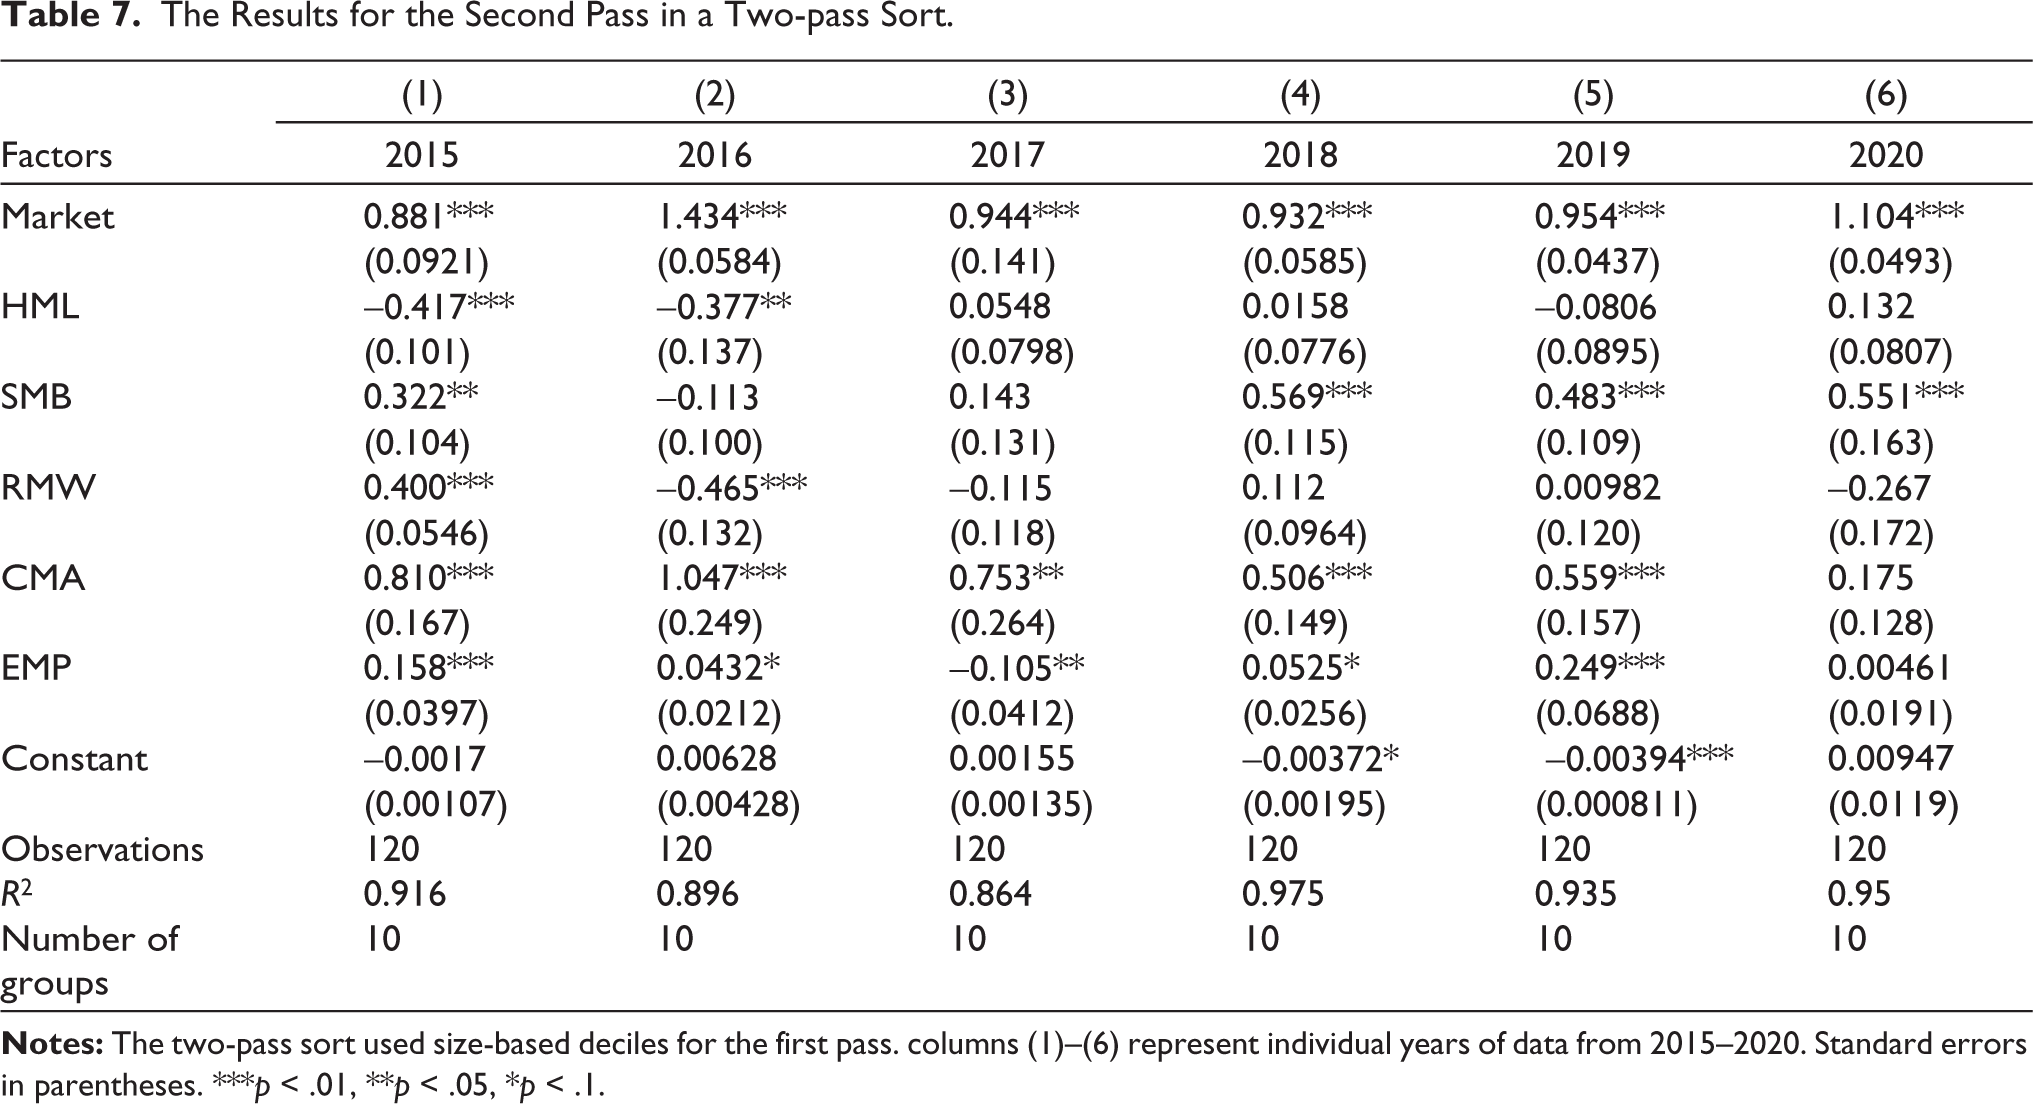
Another robustness check that is essential to consider is the time-based effects on the model. Although the demonstration was made that the EMP factor is statistically significant and explains part of our model, it is essential to understand if this is ubiquitous across time in the sample or if the ESG factor has shifted in risk premia over time. To address this robustness concern, we have repeated the two-pass sort with the size decile portfolio by adding a time-based dummy variable. Table 7 details the results from this regression. In 2015, 2016, 2018, and 2019, there is statistical significance for the EMP term and a positive association between EMP and excess returns. The ESG factor showed the most statistical strength in 2019, with the greatest excess return. In 2019, a one-unit change in beta would result in a 25.9% increase in excess returns. These results are consistent with Bennani et al.’s (2018) decomposing risk premia over time for 2015 and 2016. The coefficient value of the EMP term in 2017 holds a negative relationship, as a one-unit change in ESG beta reduced excess returns by 10.5%. In 2020, there was a positive relationship. However, the coefficient is not statistically significant. The CMA factor, which has been statistically significant at the 1% level for all other tests, also does not appear to be statistically significant for 2020. The 2020 calendar year represents a bit of a deviation from typical trends, likely due to the more significant market condition from the COVID-19 pandemic rather than the EMP factor’s long-run behavior. In addition to this set of robustness checks, it would be beneficial to repeat the series of tests replacing the S&P Petroleum Index with the S&P Mining Index as the contra-ESG portfolio. Both of the proposed indices fall under the first digit SIC code 1 and are exposed to similar ESG risks; however, the additional test can isolate risk premia and test if the factor is capturing the petroleum industry effect or a robust ESG factor.
The Results for the Second Pass in a Two-pass Sort.
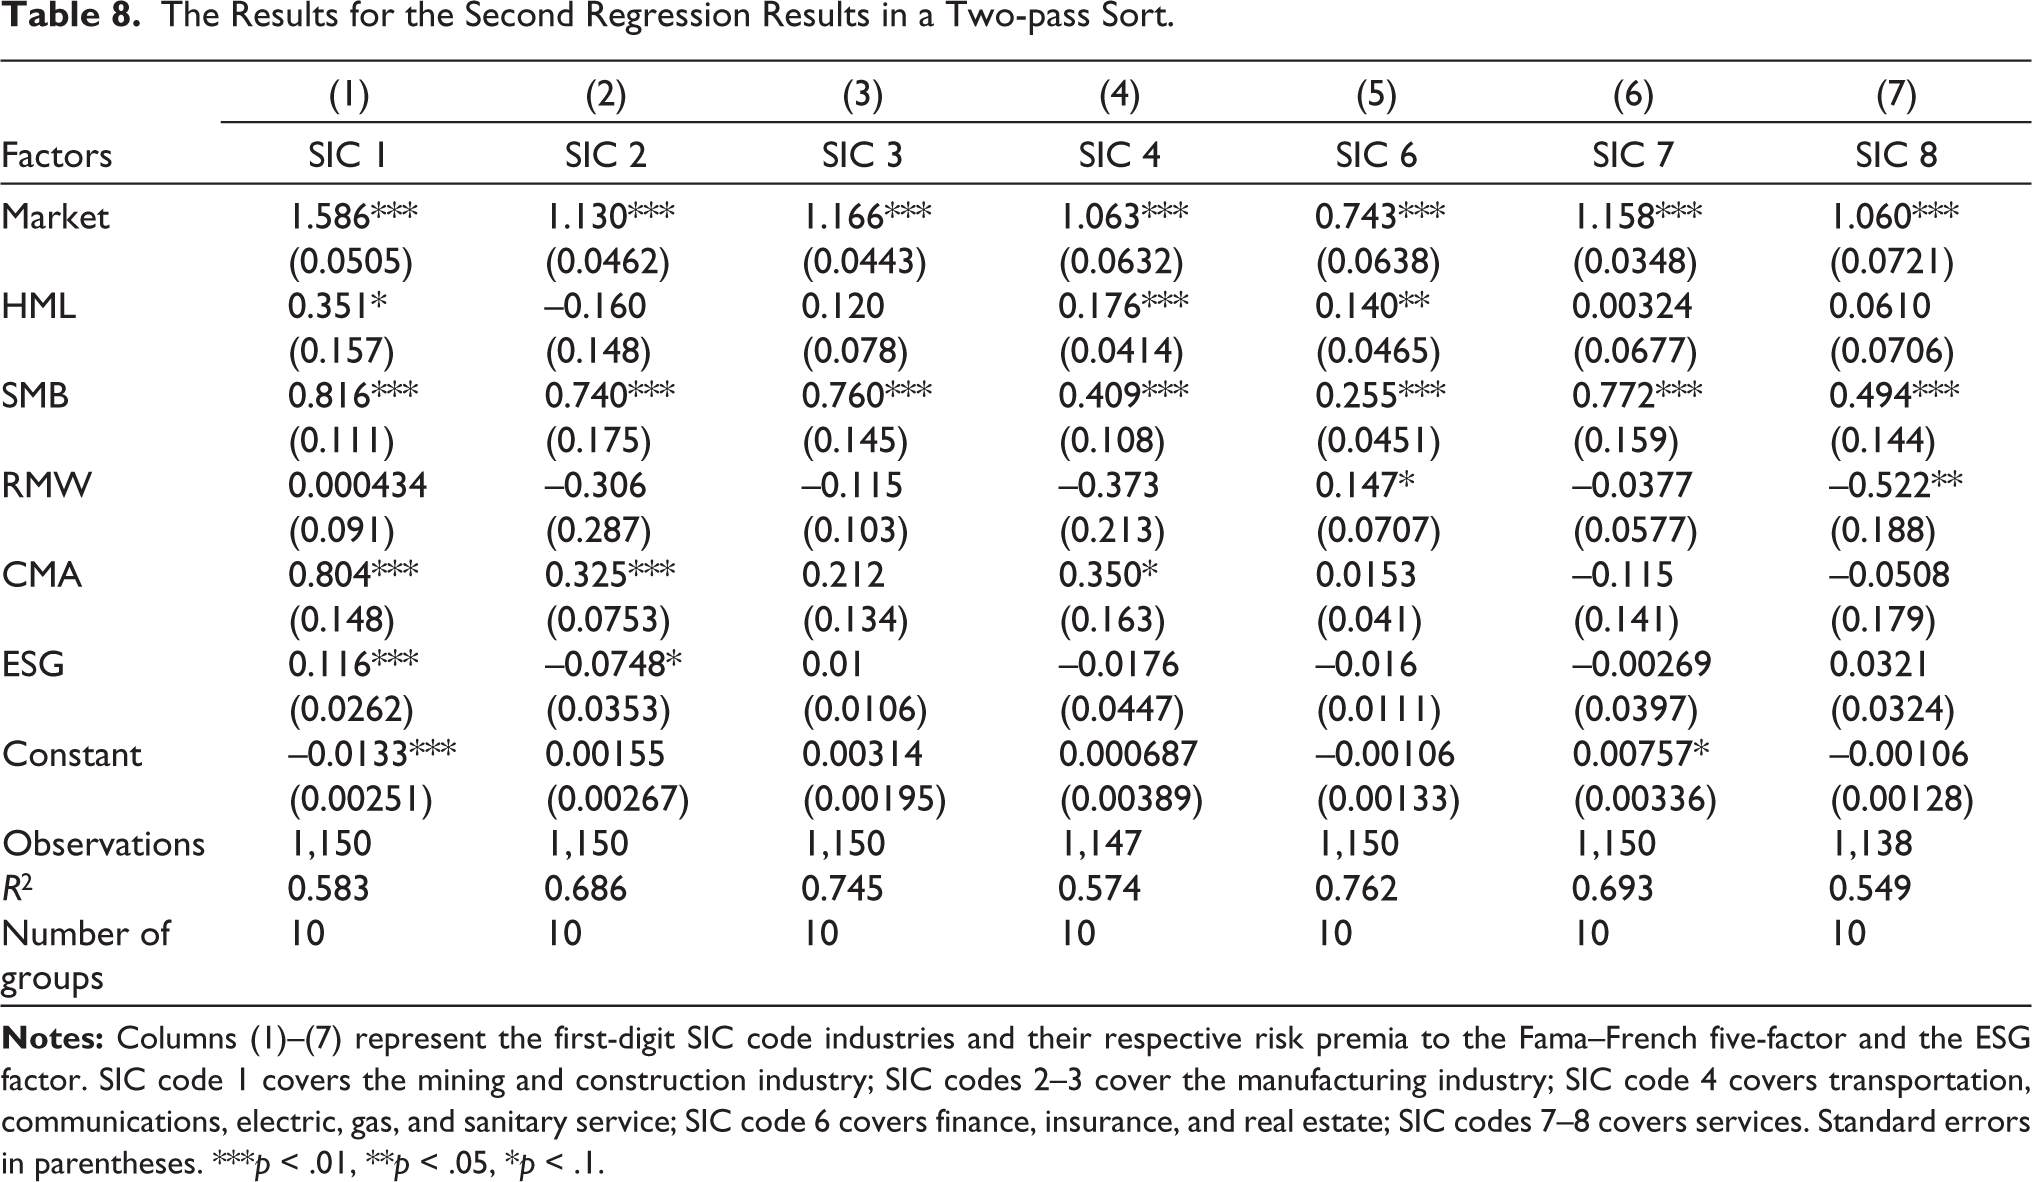
Moving on to the second set of robustness checks with a slightly different definition of the ESG factor. As described in the methodology and the results, the study created another definition for measuring the effect of ESG by subtracting the best 10% of firms from the bottom 10% of firms as defined by MSCI ESG scores. As demonstrated in the findings section, there was no measured statistical relationship between this factor and the excess returns. To further break down this relationship, the study decomposed the excess returns on a first-digit SIC level to assess if some industries are more sensitive to ESG factors than others. Some industries are likely to be inherently ESG unfriendly and might not be substantially affected by an ESG factor. To create this analysis, the author repeated the two-pass sort methodology from the results using the size decile portfolios and isolated the returns for each of the first-digit SIC code industries and regressed the ESG factor described in the results on this subset to assess the different effects the factor has on each industry. As the MSCI ESG rating dataset for this analysis did not have robust data for industries with first-digit SIC codes 0, 5, or 9, we elected not to analyze these SIC industries, as the construction of the factor did not account for them. Table 8 demonstrates the results from this new set of regressions. For all of the available SIC portfolios, the market term and the SMB term are highly statistically significant at the 1% level, which is consistent with the results from both the EMP and the initial MSCI ESG rating analysis. The ESG factor response to each industry is not uniform. Industries with first-digit SIC codes 3, 4, 6, 7 and 8 have small non-statistically significant coefficients. The first-digit SIC code 2 demonstrated a statistically significant negative relationship with the ESG factor, demonstrating that the high ESG beta portfolio would harm excess returns. However, the first-digit SIC code 1 demonstrated a highly statistically significant positive coefficient. A one-unit increase in ESG beta would result in an 11.6% increase in excess returns for first-digit SIC industry 1. These results confirm results from part 1 of the analyses with the EMP factor, as the SIC code 1 encompasses the petroleum industry. Future tests should be constructed to ensure that the ESG factor picks up on more than negative excess returns from investing in the petroleum industry.
The Results for the Second Regression Results in a Two-pass Sort.
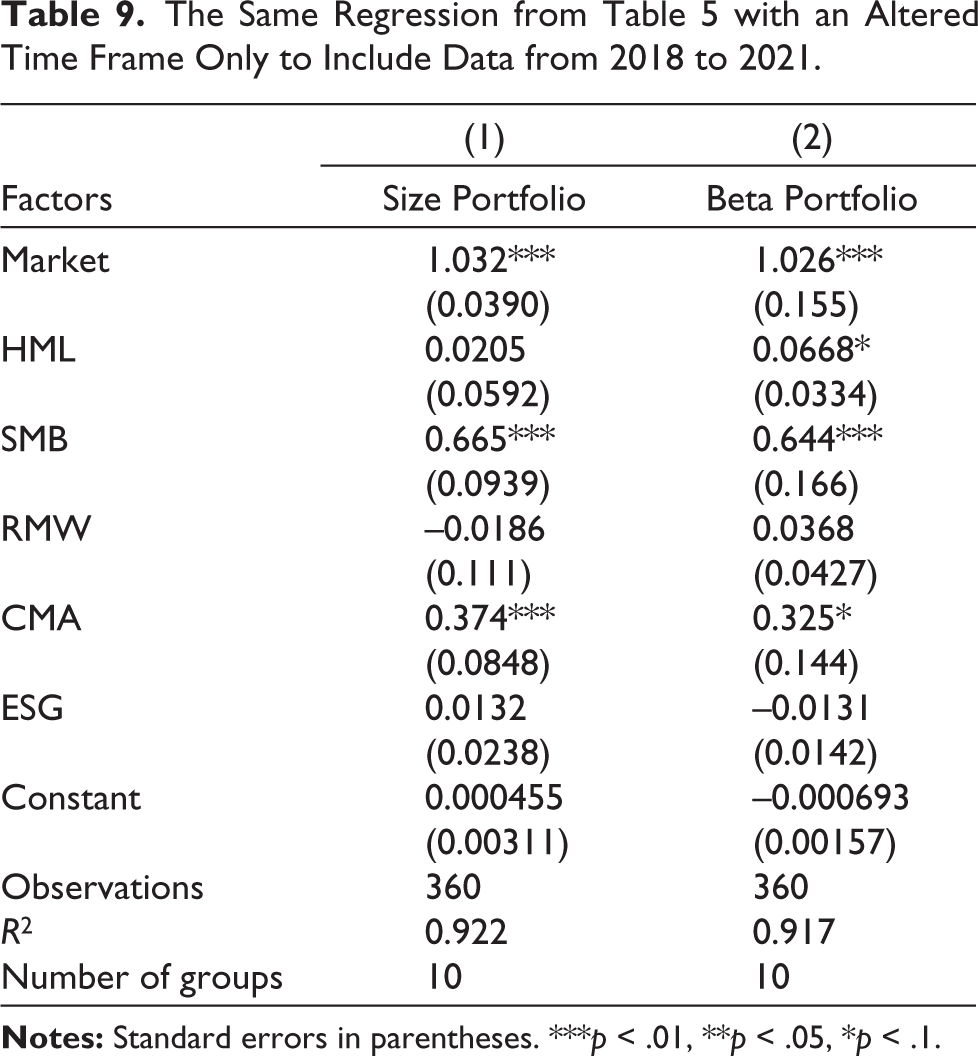
A final robustness check is conducted to address another concern about the MSCI ESG data. The MSCI ESG data used to create the factor is static. That is to say, the data for ESG scores is only a snapshot of ESG ratings for April 2021. The use of the entire window from June 2011 to March 2021 to assess excess returns might be a wrong characterization of the ESG landscape, as a company that could have been a low ESG company might have switched to a high ESG company in that time. To address this concern, the regression was recreated from Table 5 by limiting the time horizon to 2018–2021. Although there could have been some movement in the ESG scores during the modified time frame, a company’s ability to respond to ESG objectives has a degree of stickiness, as corporate initiatives often take several years to develop and implement, leading to a lag effect. Looking at the results from Table 9, the Market, SMB, and CMA factors are all statistically significant, which was also observed in Table 5. The ESG factor in Table 9, similar to Table 5, is not statistically significant for either the beta or size decile portfolios. The magnitude of the ESG factor for the size-based portfolio has increased from 0.004 to 0.013, which indicates the ESG factor might have a larger impact on excess returns. However, the beta decile portfolio has changed signs from 0.0145 to –0.013, which indicates that the ESG factor hurts excess returns. The muddled results, mixed with the statistical insignificance, do not provide evidence of a shorter time horizon improving the accuracy of the ESG factor as a predictor of stock performance. An additional source of error could result from the sample bias associated with the companies MSCI that has rated. MSCI’s publicly available ESG ratings data has 545 US firms. Of the rated companies, 439 (or 99% of rated firms) have a market cap greater than $1 billion. As a result of the large market cap bias, the ESG factor might not accurately reflect the risk premia associated with all ESG investing.
The Same Regression from Table 5 with an Altered Time Frame Only to Include Data from 2018 to 2021.
Discussion
The statistical findings of this study reveal significant insights into the economic rationale behind ESG risk premia, particularly when comparing the performance of ESG-focused indices with traditional fossil fuel indices. The results indicate that defining ESG risk premia as the difference between the MSCI ESG Index and the S&P Petroleum Index yields a robust and statistically significant risk premium, with a one-unit change in beta resulting in an 8.7% increase in excess returns for size decile portfolios. This finding aligns with the growing body of literature that suggests ESG factors can contribute to excess returns, particularly in industries where environmental concerns are paramount, such as energy (Dorfleitner et al., 2020; Gregory et al., 2021). The result lies in the increasing investor preference for sustainable investments, driven by both ethical considerations and the recognition of long-term financial risks associated with fossil fuels. As global climate change accelerates and regulatory pressures mount, companies in the petroleum industry face heightened operational and reputational risks, which may lead to lower expected returns. Conversely, firms with strong ESG performance, particularly those aligned with renewable energy solutions, are likely to benefit from investor demand and regulatory tailwinds, resulting in higher excess returns. However, the study also reveals a contrasting result when ESG risk premia are defined as the difference between high ESG-rated firms and low ESG-rated firms as classified by MSCI. In this case, no statistically measurable risk premia are observed, suggesting that the ESG factor, when defined in this manner, does not contribute to excess returns. This finding is consistent with some earlier studies, such as Berg et al. (2022) and Lioui (2018a, 2018b), which found no significant relationship between ESG ratings and financial performance. The discrepancy may lie in the limitations of ESG ratings themselves. ESG ratings are often static and may not fully capture the dynamic nature of corporate ESG performance (Bennani et al., 2018; Hale, 2021; Holder, 2017; Newburger, 2021). When a firm that improves its ESG practices over time may still be categorized based on outdated ratings, leading to misclassification and a lack of measurable risk premia. Additionally, ESG ratings may not adequately account for sector-specific risks and opportunities, which could explain why the petroleum industry shows a significant ESG risk premium while other industries do not. When comparing these findings to the available literature, the study contributes novel insights by highlighting the importance of how ESG factors are defined and measured. While some studies, such as Gregory et al. (2021), have found positive ESG risk premia by contrasting ESG-focused indices with traditional indices, others, like Berg et al. (2022), have found no such relationship when using firm-level ESG ratings. This study bridges these divergent findings by demonstrating that the definition of ESG risk premia plays a critical role in determining their financial impact. Specifically, the results suggest that ESG factors are more likely to contribute to excess returns when they are tied to specific industries or sectors, such as energy, where environmental risks are most pronounced. This finding is supported by recent research by Bolton and Kacperczyk (2021), who argue that carbon risk is increasingly priced into financial markets, particularly in industries with high environmental exposure. Furthermore, the study’s analysis of ESG risk premia at the one-digit SIC level provides additional economic insights. The results show that only firms in the petroleum industry demonstrate a statistically significant positive relationship between ESG factors and excess returns (Holder, 2017; Newburger, 2021). This finding underscores the sector-specific nature of ESG performance and suggests that the financial benefits of ESG investing may not be uniform across all industries (Koning Beals, 2020). For example, industries with lower environmental exposure, such as technology or healthcare, may not experience the same level of ESG-driven excess returns as the petroleum industry. This aligns with the work of Zerbib (2020), who found that the financial impact of ESG factors varies significantly across sectors, with industries like energy and mining showing the strongest relationships. The study also highlights the role of investor behavior in driving ESG risk premia. The significant inflows into sustainable investment products, particularly in 2020, suggest that investor demand for ESG-focused investments is a key driver of excess returns. This finding is consistent with the work of Pedersen et al. (2021), who argue that investor preferences for sustainable investments can create demand-driven price effects, leading to higher valuations for ESG-focused firms. However, the study also cautions that these demand-driven effects may not be uniform across all markets or investor types, as highlighted by Scholtens and Sievänen (2021), who found that institutional investors in certain regions are more likely to prioritize ESG factors than others (Hale, 2021). The study’s findings lie in the interplay between investor preferences, sector-specific risks, and the dynamic nature of ESG performance. The results suggest that ESG factors are most likely to contribute to excess returns when they are tied to specific industries, such as energy, where environmental risks are most pronounced. These findings contribute to the growing literature on ESG investing by providing a more nuanced understanding of how ESG factors influence financial performance.
Implications
The study’s findings suggest that ESG factors can enhance returns, particularly in industries with high environmental exposure, such as energy. Investors appear willing to pay a premium for strong ESG performance, with the petroleum industry showing a statistically significant ESG risk premium. This indicates that avoiding traditional fossil fuels and reallocating capital toward ESG-aligned firms may yield financial benefits. However, the sector-specific nature of ESG returns suggests that a tailored approach is needed rather than a universal ESG investment strategy. For investors and portfolio managers, integrating ESG factors into asset pricing models can improve risk assessment and portfolio performance. The study underscores the limitations of static ESG metrics, as firm-level MSCI ratings fail to capture measurable risk premia, implying that outdated ratings may misrepresent a company’s evolving ESG performance. This calls for more dynamic and transparent ESG reporting practices, enabling investors to make informed decisions based on real-time corporate behavior. Policymakers can support ESG investing by promoting standardized ESG reporting frameworks and offering incentives, such as tax benefits for sustainable investments. The substantial inflows into ESG funds in 2020 highlight growing investor interest, reinforcing the need for reliable and dynamic ESG evaluation methods. By developing robust ESG metrics that better reflect corporate sustainability efforts, policymakers can help investors allocate capital more effectively, ensuring ESG factors are accurately priced into financial markets and encouraging companies to enhance their sustainability practices for long-term economic and environmental benefits.
Conclusion
The main conclusions from this article come from defining and implementing an ESG factor. In the first set of analyses, where the ESG term is defined as the difference between the MSCI ESG Index and the Petroleum Index, the author observed a statistically significant result for the ESG term, which matched previous work conducted on ESG factor modeling. However, in the second set of analyses, when developing an ESG factor from the MSCI ratings, the author did not find a statistically significant factor on the aggregate level. Examining the MSCI results at the one-digit SIC level, the researcher could only find the firms starting with SIC code 1 to demonstrate a positive and statistically significant factor. These findings reaffirm that the petroleum industry may have negative expected returns but do not build a case for ESG providing excess returns for other industries. This lack of uniformity across both definitions fosters several essential questions to address in implementing the Fama–French six-factor model. This uncertainty in the findings of an ESG factor parodies the literature review and makes it extremely difficult to recommend a pro-ESG policy proposal. Using addition and deletion events from this index can provide a tangible event to test the market reaction to changes in ESG news and assess if there are abnormal returns. This methodology for evaluating abnormal returns can also be applied to ESG rating changes; however, there might be less of an effect if the market was anticipating a change in the rating similar to corporate credit ratings. As such, the indexing market event might provide a more precise image regarding market tracking behavior around ESG. Another possible extension for ESG research is to look further at the rating agencies. Over the last few years, more companies have entered the ESG rating space. MSCI and Sustainalytics have held a dominant position in the market, but S&P, Moody’s, and other firms are looking to expand their research efforts around ESG research. An interesting extension would be to analyze the risk premia or bubble for different firms and see if there is an ESG factor where high ESG minus low ESG has a more significant risk premium for one rating agency over another rating agency.
Footnotes
Declaration of Conflicting Interests
The author declared no potential conflicts of interest with respect to the research, authorship, and/or publication of this article.
Funding
The author received no financial support for the research, authorship, and/or publication of this article.