
Abstract
This study examines the relationship between user attitudes and continuance intention toward Unified Payment Interface (UPI) payment apps in India, with misinformation as a moderating variable. Data were collected from 404 users via an online questionnaire using validated scales, and analysed through Partial Least Squares Structural Equation Modelling (PLS-SEM). Thematic analysis was used to support qualitative insights. Results demonstrate a strong positive influence of user attitudes on continuance intention, driven by perceived benefits such as convenience, security, and efficiency. Notably, misinformation unexpectedly moderated this relationship positively, indicating that users with strong attitudes remain resilient to fake news, prioritizing UPI’s functional value. These findings have practical implications for policymakers, fintech firms, and digital platforms aiming to strengthen trust and user engagement. The study contributes to the growing literature on digital payments by highlighting the overlooked role of misinformation in user behavior and providing strategies to foster long-term adoption of UPI.
Introduction
The global digital payment industry is witnessing substantial expansion, propelled by technological developments, higher internet accessibility, and a transition toward cashless transactions. By 2023, the total value of worldwide e-commerce exceeded $6.1 trillion, with a growth rate that was more than twice as fast as point-of-sale (POS) transactions. The projection indicates that the trend of e-commerce would persist, with a compound annual growth rate (CAGR) of 9% compared to 4% for POS systems until 2027, as stated in the “Global Payments Report 2024” by Worldpay (2024). The global digital payment industry is expected to increase from $115.93 billion in 2023 to $180.26 billion by 2028, with a compound annual growth rate (CAGR) of 9.3%. The increase is driven by various factors such as the emergence of smart cities, government efforts to encourage digital payments, and the growing acceptance of Internet of Things (IoT) technology (Hassebo & Tealab, 2023). By 2027, Worldpay expects digital wallets to account for 52% of e-commerce transactions and credit and debit cards to account for 22% and 12%. The B2B industry is likewise experiencing a noticeable transition toward digital payments (Dahlberg et al., 2008).
In high-income countries like the United States, 47% of Americans admit to spending more money when utilizing digital wallets as opposed to conventional payment methods, according to a survey by Forbes (Claypool & Benninger, 2023). In the Asia Pacific area, digital wallets were widely used for e-commerce transactions, representing 70% of the transaction value, and for POS transactions, accounting for over 50% of the total in 2023 (Global Payments Report, 2024). A majority of individuals (53%) prefer utilizing digital wallets over traditional payment methods. Furthermore, the COVID-19 pandemic has expedited the shift toward digital payments, since numerous organizations and consumers are choosing contactless and online payment methods to reduce physical interaction (Tut, 2023).
India, one of the leading countries in digital payment adoption, has experienced remarkable growth in this sector. The Unified Payments Interface (UPI), a government-supported digital payment system, facilitated over 45 billion transactions amounting to more than USD 1 trillion in 2021. In December 2021 alone, UPI recorded 4.56 billion transactions worth ₹8.27 trillion (Panda, 2022). Prominent platforms such as Paytm, Google Pay, PhonePe, and Amazon Pay dominate the market. The e-commerce industry, heavily reliant on digital payments, was valued at USD 84 billion in 2021 and is projected to grow to USD 200 billion by 2026 (Vyas et al., 2023). This rapid expansion underscores India’s transition toward a less-cash-dependent economy.
The UPI is a distinctive Indian payment system that integrates multiple banking features into a single platform, enabling seamless peer-to-peer and merchant transactions. Developed by the National Payments Corporation of India (NPCI), UPI allows users to link multiple bank accounts to a single mobile application, facilitating real-time money transfers without the need for detailed bank information (NPCI, 2016). Its interoperability across various banks and payment platforms, combined with features such as virtual payment addresses and QR code scanning, has significantly enhanced the digital payment landscape in India (Ahmed et al., 2021; Ashok & Hallur, 2023). The system’s design emphasizes simplicity and security, contributing to its widespread adoption and positioning it as a model for digital payment solutions globally.
While UPI applications have revolutionized digital transactions in India by offering convenience and efficiency, this growth has also increased exposure to risks such as misinformation and fraudulent activities. A common type of misinformation involves deceptive cashback schemes and misleading offers, which tempt consumers to disclose their personal information by promising appealing incentives (Henderson, 2003). In addition, the market is inundated with counterfeit UPI applications that are created to imitate genuine ones, tricking users into downloading malicious software or disclosing personal information (Shruthi et al., 2024). Instances of fraudulent phone calls and phishing attacks have significantly increased (Alkhalil et al., 2021). Scammers pretend to be customer care representatives and ask for sensitive information like One Time Passwords (OTPs) or UPI PINs, which legitimate firms never ask for during phone conversation. In addition, consumers frequently encounter false links through SMS or social media, which can result in the installation of dangerous software and the compromise of their devices and financial information (Imgraben et al., 2014).
In order to reduce these risks, it is essential for users to follow the best practices for securely using UPI apps. This entails obtaining applications solely from reputable sources such as the Google Play Store or Apple App Store and verifying the legitimacy of the developer (Harris & Chin, 2016). Users should abstain from disclosing their UPI PIN, OTP, or any other personal information to anyone, since authorized agents from UPI services never solicit such information. By making use of the security functionalities offered by UPI apps, such as app locks and biometric identification, users can enhance their protection (Edburg et al., 2024). This study aims to explore the role of misinformation on social media in influencing the adoption and continued use of UPI payment apps in India. Building on prior research, such as Cheng and Chen’s (2021) study on the impact of disinformation on user trust and Kumar et al.’s (2021) analysis of fake news using the Stimulus-Organism-Behaviour-Consequence (SOBC) model, the present study examines the moderating effect of social media–driven fake news on the usage patterns of UPI payment apps in the Indian economy. The interplay between fake news in social media, users’ attitude, and intention toward UPI application usage has utmost significance currently to explore the adoption and sustained use of those applications. Therefore, this article examines the influence of fake news disseminated through social media platforms on users’ attitude and intention toward UPI payment application. The findings of this article will add significant theoretical and managerial implications of misinformation regarding UPI payment applications and suggesting measures to avoid detrimental effects on UPI payment application continuance intention to use.
Theoretical Background
Technology Continuance Theory
The technology continuance theory (TCT), first proposed by Liao et al. (2009), attempts to forecast whether customers will continue to use a technology or not. Included in the theory were three famous models from the domain of information technology (IT) and information system (IS) research: Oliver’s (1980) Cognitive (COG) model, Davis et al.’s (1989) Technology Acceptance Model (TAM), and Bhattacherjee’s (2001) Expectation-confirmation Model (ECM). The information system’s ongoing purpose served as the third and final dependent variable in the TCT model’s trifecta of levels. Validation, perceived user friendliness, and PU were the three main components of TCT, which also included the two foundational notions of attitude and contentment. Several research settings have utilized the IS/IT continuance intention model. These include smartphone banking services (Susanto et al., 2016), telehealth (Hsieh et al., 2022), mobile payment apps (Humbani & Wiese, 2019), mobile payment services (Zhou, 2013), Alipay (Khayer & Bao, 2019), and mobile purchase (Gao et al., 2015). However, the IS/IT continuity model has yet to be included in studies of UPI payment apps in lower-middle income countries like India. According to Hsu et al. (2013), the model is regarded by researchers as a predictor of customer satisfaction and desire to continue using the service. It is broadly adaptable to many information systems service repurchasing and continuation scenarios. The TCT has been widely used in various studies to understand user behavior toward the continued use of technology-based services. Rahi et al. (2021) integrated TCT with Task Technology Fit (TTF) to investigate Internet banking user continuance behavior. Putri et al. (2020) combined TCT with the Technological Personal Environmental (TPE) model to examine the factors influencing an individual’s continuance usage of mobile payment technology in Indonesia. Similarly, Jain et al. (2021) integrated M-S-QUAL, TAM, and TCT to study mobile shopping behavior. Abdul-Halim et al. (2022) extended TCT to investigate e-wallet continuance usage intention in Malaysia, focusing on variables such as price benefit, trust, habit, and operational constraints. Tang et al. (2022) explored the impact of customers’ perceptions of COVID-19 on m-payment continuance intention using TCT. Aprilia and Amalia (2023) analyzed mobile wallet users’ continuance intention by considering perceived security and TCT. Foroughi et al. (2023) studied the determinants of continuance intention to use gamification applications and food delivery apps, extending TCT to understand user behavior in post-adoption stages.
Literature Review and Hypotheses Development
Attitude Toward UPI Payment
Attitude is defined as “the degree of a person’s positive or negative feelings about performing a target behaviour” (Davis, 1989). Extensive studies (Basak & Calisir, 2015; Chang et al., 2016; Ifinedo, 2018) have illustrated that attitude toward a specific social network service (SNS) has a positive impact on users’ continuance intention usage. In the context of mobile payment, a number of studies support the relationship between attitude and behavioral intention (Liébana-Cabanillas et al., 2014b, 2014a; Qin et al., 2019). Further, previous studies (Amoroso & Lim, 2017; Lin, 2011) showed a positive relationship between users’ continuance intention and attitudes in the case of mobile banking service applications (MBSAs) in adoption or repeated usage intention. Some researchers also argued that attitude has a positive impact on habitual usage.
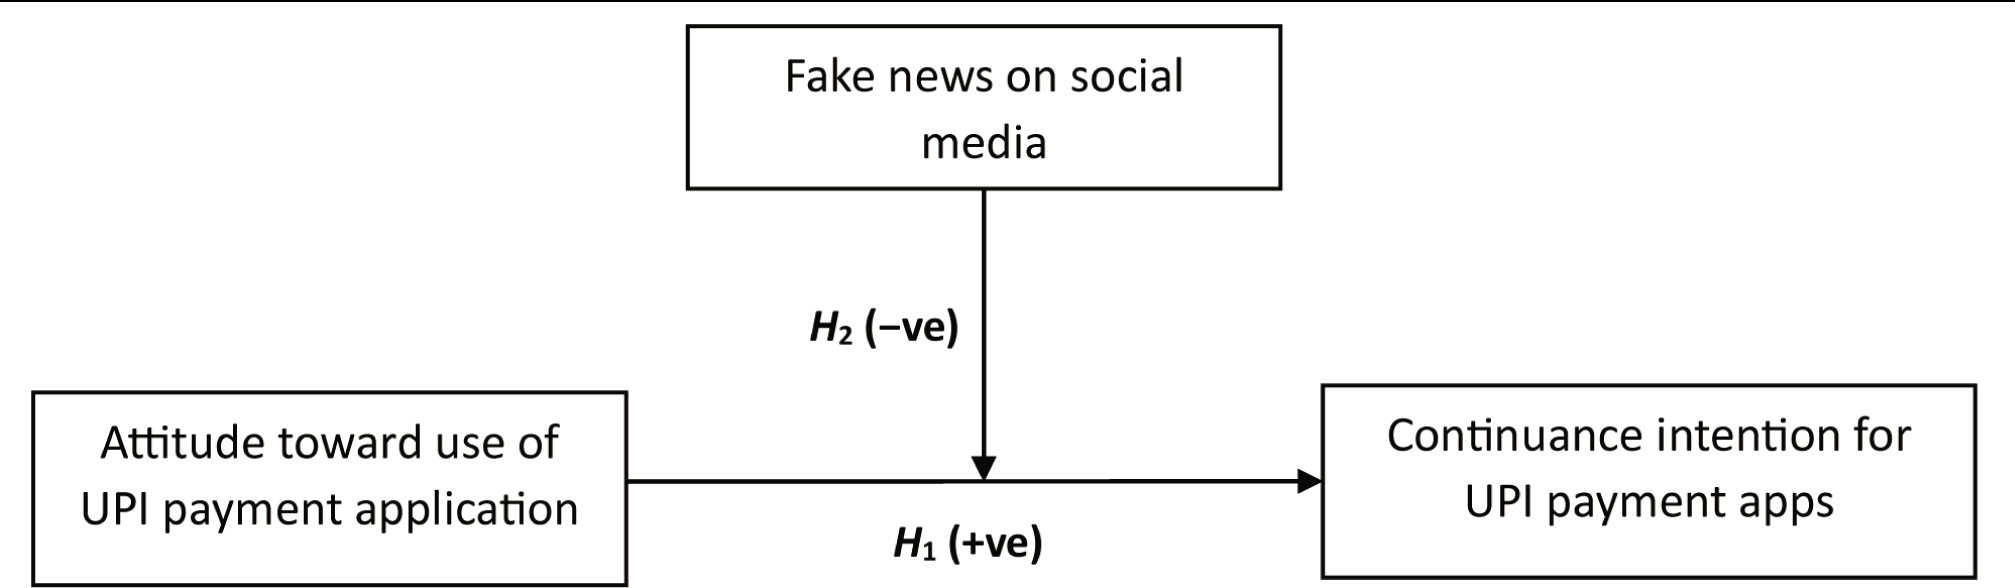
H1: Attitudes toward UPI payment apps have a positive impact on continuance intentions of UPI payment apps.
Fake News on Social Media
Fake news or misinformation, the dissemination of false or misleading information, has become a pervasive issue in the digital age, posing significant challenges to individuals, societies, and democracies. Allcott and Gentzkow (2017) define fake news as any information that mimics genuine news articles but contains erroneous and deceptive content. Scholars from various disciplines have studied misinformation to comprehend its origins, impacts, and potential mitigations. Research has identified multiple sources of misinformation, ranging from deliberate disinformation campaigns orchestrated by malicious actors to unintentional spread driven by cognitive biases and algorithmic amplification. Pennycook and Rand (2019) demonstrated how cognitive factors such as cognitive laziness and confirmation bias contribute to the susceptibility to misinformation, highlighting the role of individual psychology in its propagation. The advent of social media platforms has amplified the spread of misinformation by enabling rapid and widespread dissemination. Vosoughi et al. (2018) analyzed the diffusion of true and false news stories on Twitter, finding that falsehoods spread significantly faster and broader than accurate information, emphasizing the role of online networks in shaping information dynamics. Misinformation not only undermines public trust in institutions but also poses threats to public health, as evidenced by the proliferation of false claims and conspiracy theories during the COVID-19 pandemic. Bode and Vraga (2021) investigated the role of social media in disseminating vaccine-related misinformation, highlighting its adverse effects on vaccination rates and public health outcomes. Efforts to combat misinformation have encompassed various strategies, including fact-checking initiatives, algorithmic interventions, and media literacy campaigns. In another study, the researchers explored the key drivers of health-related misinformation which encompasses myths, false information, conspiracy theories, hoaxes, and misleading content that is intentionally or accidentally disseminated on social media platforms (Wang et al., 2019). This study has made an attempt to assess the moderating impact of misinformation between the relationship of attitude and continuance intentions toward UPI payment apps. McGonagle (2017) has provided evidence indicating that social media platforms have expedited the dissemination of deceptive internet material.
H2: Fake news on social media negatively moderates the relationship between attitude and continuance intentions toward UPI payment apps.
Research Methodology
The research adopted a descriptive design to investigate the impact of attitude on the continuance intention to use UPI payment applications as presented in Figure 1, with a specific focus on the moderating role of misinformation propagated through social media platforms.
Hypothetical Model.
Sample and Sampling Techniques
The users of any UPI apps are the target population for the study. Convenience sampling was used to ensure accessibility and feasibility in collecting data from the target population of UPI app users (Etikan et al., 2016). The structural equation modeling (SEM) model commonly recommends a minimum sample size of 10 respondents per item (Hair et al., 2021). Here, the study includes 12 items; the adequate sample size must be at least 120 respondents. However, we have selected a bit larger sample of 404 respondents to enhance the stability of the estimates and the generalizability of the findings. Furthermore, the required sample size for this study was determined using an a priori sample size calculator for SEM given by Daniel Soper. The following parameters were entered into the calculator: An anticipated effect size of 0.3, a desired statistical power level of 0.8, a significance probability level of 0.05, 3 latent variables, and 12 observed variables. The calculator returned a recommended minimum sample size of 119 to be considered for this study to ensure sufficient statistical power and model stability (Wolf et al., 2013).
Data Collection and Analysis Techniques
This study employed a survey-based quantitative research approach to collect data. An online self-administered questionnaire (see Appendix) was designed using Google Forms and distributed electronically via e-mail and various social media platforms to ensure broad reach among the target respondents across multiple states within the country. The digital distribution method was chosen due to its cost-effectiveness and convenience (Nayak & Narayan, 2019). Descriptive statistical analyses, including frequencies and percentages, were conducted using SPSS to examine the demographic characteristics of the respondents. The hypothesized relationships between the constructs were analyzed using SEM with the partial least squares (PLS)-SEM 4.0 software.
Research Instrument Design
We designed and used a structured questionnaire with two sections to collect primary data. Section A carries questions related to demographic information of the UPI users, whereas Section B includes scaled-based statements for measuring attitude, continuance intention for UPI payment apps, and fake news on social media. Five items related to attitude were adopted from Amoroso and Lim (2017). Three items related to fake news on social media were taken from the research conducted by Hossain et al. (2023). Four items from Mouakket (2015) for continuance intention of using UPI payment apps scale were used with minor alterations. The questionnaire was administered online. We used a 5-point Likert scale, ranging from 1 (strongly disagree) to 5 (strongly agree), to rate each statement.
Common Method Bias
Common method bias (CMB) refers to measurement errors that arise from relying on a single method for data collection, potentially inflating or distorting the observed relationships among variables. To assess the presence of CMB, Harman’s single-factor test, a widely used diagnostic technique, was employed. This approach involves performing an exploratory factor analysis (EFA) on all measurement items to evaluate the unrotated factor solution using SPSS. The analysis indicated that the total variance explained by a single factor was 41.58, which is less than 50%, suggesting that common method variance (CMV) was not a significant concern in this study (Podsakoff et al., 2003).
Data Analysis
The research uses both demographic profiling and SEM to obtain a thorough understanding of the relationships within a dataset. Demographic profiling provides an elementary overview of the sample population, encompassing variables such as age, gender, education, and income distribution. The SEM technique was used to test and estimate causal relationships between variables.
Demographic Profile
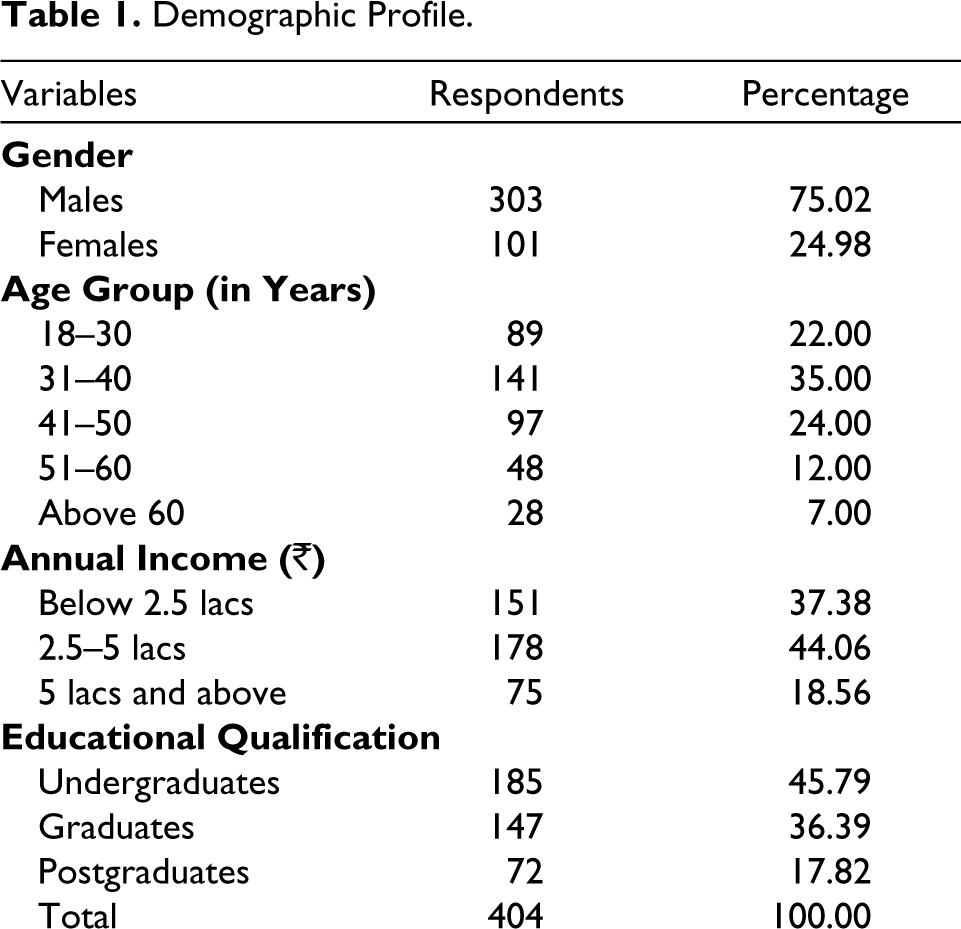
After thoroughly cleaning the data and removing incomplete responses, we obtained a final sample of 404 consumer participants. The majority of participants in our study are between the age range of 18 and 40 years. The data from the sample indicated that 75% of the respondents were male, while the remaining 25% were female. The data indicates that 45.79% of individuals have completed an undergraduate degree, 36.39% have completed graduate studies, and only 17.82% have completed postgraduate studies. In addition, 62.62% of the participants indicated that their yearly salary exceeded ₹2.5 lacs. The attributes of the sample are displayed in Table 1.
Demographic Profile.
Assessment of Measurement Model
Evaluating the measurement model in PLS-SEM is an essential step for ensuring the reliability and validity of the constructs before assessing the structural model. The Table 2 includes numerous crucial characteristics, such as indicator reliability, internal consistency reliability, convergent validity, and discriminant validity.
Assessment of Outer Model.
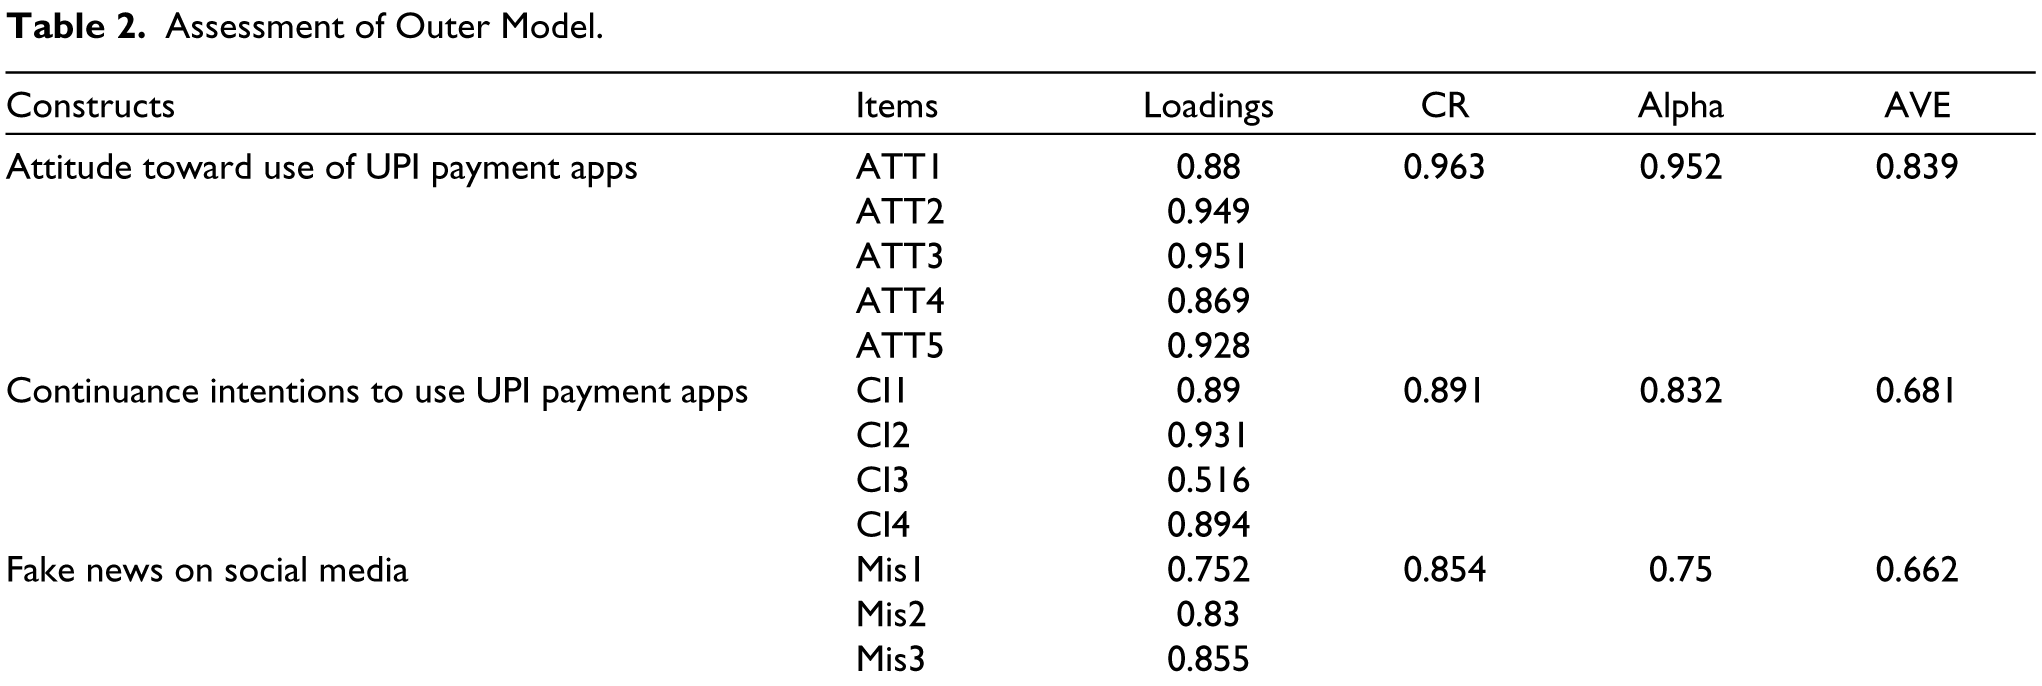
Indicator reliability refers to the degree to which a certain indicator (or item) consistently reflects the construct it is intended to measure. Loadings within the range of 0.40–0.70 can be deemed acceptable if the overall model fit is excellent and removing them does not considerably enhance the model (Hulland, 1999). In this study, all the factor loadings are observed to be over the threshold value of 0.40 and are statistically significant. The internal consistency reliability evaluates the degree to which all indicators of a hidden construct consistently measure the same construct. PLS-SEM employs two main metrics, composite reliability (CR) and Cronbach’s alpha, to assess internal consistency reliability. The CR value should exceed 0.70 for well-established constructs to indicate the reliability of a set of items that compose a latent construct (Bagozzi & Yi, 1988; Hair et al., 2021). Similarly, Cronbach’s alpha, which is a more cautious measure than CR, should also be greater than 0.70 (Nunnally & Bernstein, 1994). Cronbach’s alpha is a classic measure of internal consistency. Since all the constructs have a Cronbach’s alpha value greater than 0.7, there are no concerns with reliability.
Convergent validity pertains to the extent to which two measures of constructs that should theoretically be associated with each other are indeed associated. Convergent validity in PLS-SEM is assessed by the use of average variance extracted (AVE). According to Fornell and Larcker (1981), the AVE for each construct should be at least 0.50. This means that the construct should capture more than 50% of the variance of the indicators. Given that the average scores (AVE) for all constructs are higher than 0.5, it may be concluded that there is no problem with convergent validity.
Discriminant validity is the extent to which a construct is truly distinct from other constructs in the model. It ensures that a construct measures what it is intended to measure and not something else. In PLS-SEM, discriminant validity can be assessed using the Fornell–Larcker criterion (see Table 3). According to this criterion, the square root of the AVE for each construct should be greater than the correlation between the construct and any other construct, ensuring that a construct is more closely related to its own indicators than to other constructs (Fornell & Larcker, 1981). Further, the discriminant validity of the constructs was assessed using the Heterotrait–Monotrait ratio (HTMT), as suggested by Henseler et al. (2015). The results, presented in the HTMT matrix, indicate that all HTMT values were below the recommended threshold of 0.90.
Discriminant Validity.
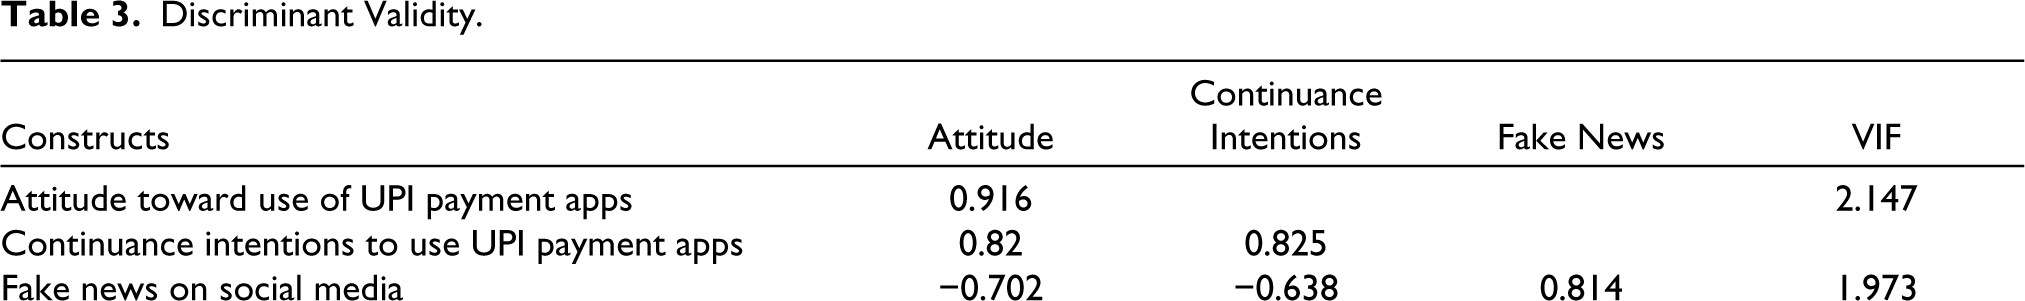
Variance inflation factor (VIF) is a measure used to assess multicollinearity among the predictor constructs in a model. Generally, a VIF value below 5 is considered acceptable, indicating that multicollinearity is not a severe issue. Some more conservative guidelines suggest a VIF threshold of 3 (Hair et al., 2021). Both VIF values are below the threshold of 5, indicating that multicollinearity is not problematic in this model. Next, the VIF value for the interaction effect, that is, fake news on social media × attitude toward UPI payment apps ≥ continuance intention is 1.152 which is below the threshold value also indicate no issue of multicollinearity. By adhering to these criteria, researchers confirmed that their measurement model in PLS-SEM is both reliable and valid, providing a solid foundation for further structural model analysis.
Assessment of Structural Model and Hypotheses Testing
Assessing the structural model and hypothesis testing are critical steps in PLS-SEM analysis. This process involves evaluating the relationships between constructs and testing the significance of these relationships based on the specified hypotheses.
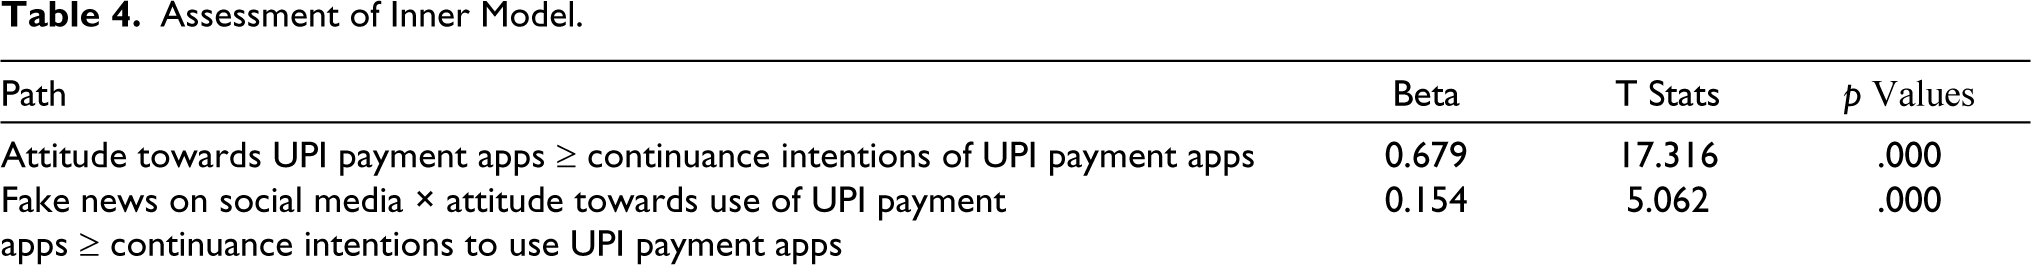
The Table 4 and Figure 2 present the path coefficients between latent variables. The data shows a strong positive association between people’s attitude toward UPI payment apps and their intention to continue using them in the future (β = 0.679, p < .000). Hence, hypothesis H1—attitudes toward UPI payment apps have a positive impact on continuance intentions of UPI payment apps—was supported. People with a more positive attitude (liking and valuing UPI payment apps) tend to have a stronger intention to keep using them (continuance intention). By focusing on user experience and highlighting the app’s benefits, developers and marketers can encourage continued use.
Assessment of Inner Model.
SEM Model.
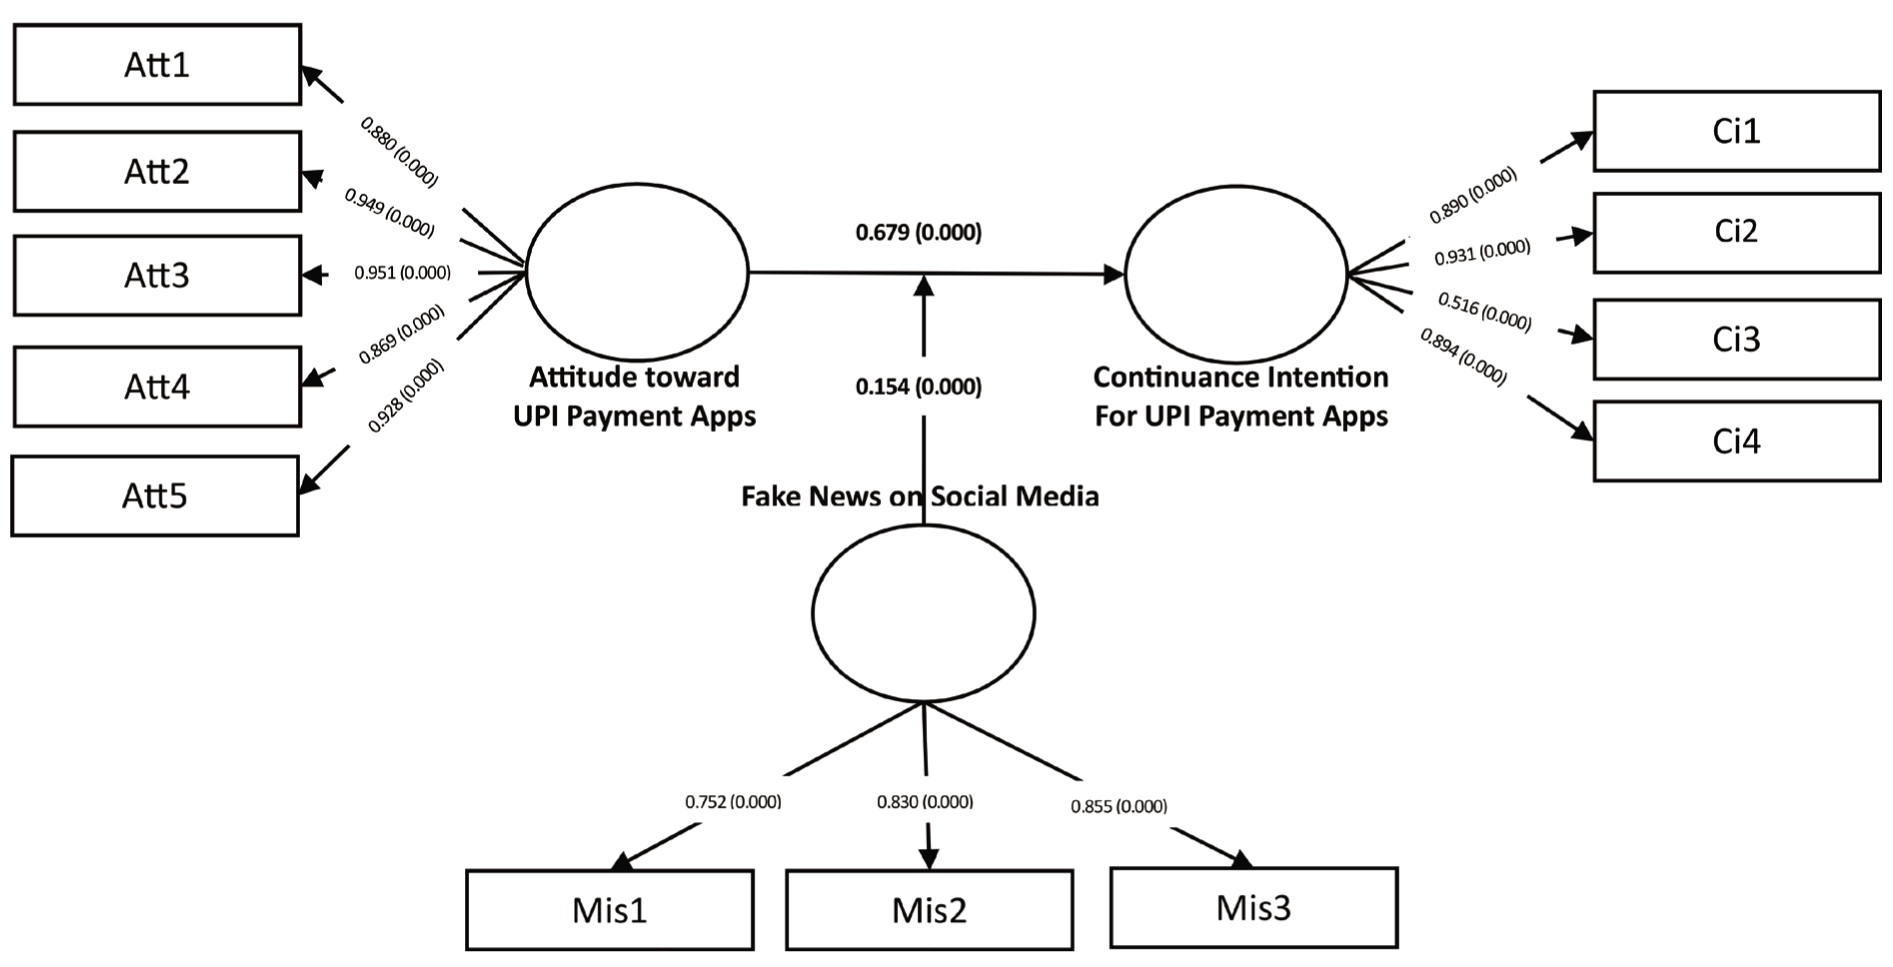
The analysis of moderating effect generated a contradicting outcome. Here, the interaction effect between attitude and fake news has a positive impact of intentions to use UPI. However, normally, as people believe negative rumors about UPI (e.g., security risks, scams), they might be less likely to continue using them. The second hypothesis (H2)—fake news on social media negatively moderates the relationship between attitude and continuance intentions toward UPI payment apps—was not supported, whereas the opposite was supported (β = 0.154, p < .000).
The Table 5 assesses the goodness of fit of the model using the R² (coefficient of determination) and Q² (predictive relevance) values. R² measures the proportion of variance explained in each endogenous construct, while Q² indicates the predictive relevance of endogenous constructs. Higher values suggest better model fit and predictive power. An R² value of 0.698 means that approximately 69.8% of the variance in the dependent variable is explained by the independent variables in your model. A Q² value of 0.681 suggests that your model has a good predictive capability.
R2,f2 and and Q2.
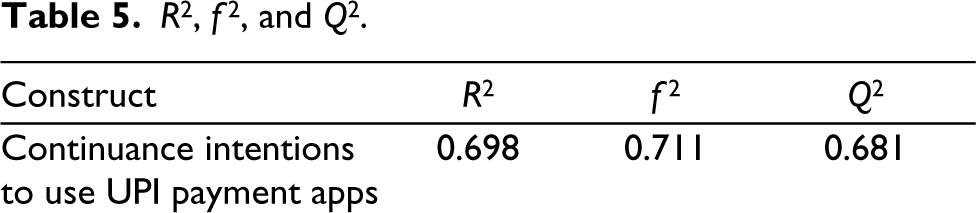
Consider the effect sizes of the relationships, such as f², which indicates the proportion of variance in the dependent variable explained by the independent variable. Effect sizes help interpret the practical significance of relationships. An f² value of 0.711 suggests that your model is explaining a large portion of the variance in the dependent variable, relative to the number of predictors.
Discussion
Our research shows that users’ fears about scams are greatly outweighed by the fact that UPI is widely used and deeply integrated into daily financial activities. The ease, speed, and effectiveness of UPI transfers are still strong reasons why they are used. There is also trust and reliability in the system because the government, banking institutions, and fintech companies have worked hard to improve security and make people more aware of safe practices. This aligns with findings by Pillai and Al-Malkawi (2018), who emphasize that ease of use and trust significantly influence the adoption and continued use of digital payment systems. Additionally, Dahlberg et al. (2015) highlight that trust and perceived security play pivotal roles in maintaining user confidence, even amidst fraud concerns. Also, the UPI system is always being improved and updated to make sure it stays safe and easy to use. Shin (2009) underscores the importance of continuous system updates and user trust in driving the sustained adoption of payment platforms. Although fraud is a big problem, these factors together have helped UPI payment habits stay strong in India. This shows that users are still using this game-changing payment platform despite the fraud events.
India’s strong UPI usage, despite a rise in fraud cases, has a number of management effects for those involved in the digital payment ecosystem. To keep users’ trust, financial institutions and fintech companies must first make it a priority to keep investing in new security technologies and scam detection systems. Fraud risks can be successfully reduced by improving real-time monitoring and putting in place strong authentication protocols, as suggested by Ryu (2018). Second, it is important to keep teaching users about safe ways to do transactions. Managers should come up with thorough communication plans to keep users aware of possible threats and how to protect themselves. Kumar and Ayodeji (2020) emphasize that user education on secure transaction practices significantly enhances trust and reduces fraud-related fears.
Third, analyzing data from UPI transactions can help identify trends and predict fraudulent activities, enabling proactive measures to prevent such incidents. Collaboration among banks, regulatory bodies, and technology providers is essential for a unified approach to combating fraud. Research by Ryu (2018) highlights the importance of leveraging transaction data analytics for fraud detection, allowing financial institutions to anticipate and mitigate risks effectively. Additionally, Zalan and Toufaily (2017) emphasize that a collaborative effort among stakeholders enhances the effectiveness of fraud management systems and strengthens the overall security framework.
Innovation should remain a priority, with managers ensuring that UPI continues to introduce features that enhance user convenience and security, thereby sustaining its growth and maintaining user trust. Dahlberg et al. (2015) argue that continuous system improvements and the introduction of user-centric features play a pivotal role in building long-term trust in digital payment systems. Educational campaigns are equally crucial for promoting safe usage practices and raising awareness about common fraud schemes. According to Kumar and Ayodeji (2020), user education significantly impacts their ability to identify and avoid fraudulent schemes, thereby improving trust in the system.
Lastly, implementing robust complaint-handling mechanisms is a moral obligation for banks and UPI service providers. Upon receiving a complaint, prompt acknowledgment and providing a resolution timeframe are essential. Zohar et al. (2016) underline that effective complaint resolution not only maximizes customer satisfaction but also reinforces trust in digital payment ecosystems, contributing to the sustained growth of platforms like UPI. These strategies, collectively, ensure that user confidence is maintained while enabling the continued expansion of digital payments in India.
Conclusion
In conclusion, this study underscores the nuanced relationship between users’ attitudes, fake news on social media, and their intentions to continue using UPI payment apps in India. A positive attitude toward UPI apps, characterized by trust in their convenience, efficiency, and security, strongly influences users’ intentions to sustain their usage. This finding highlights the importance of enhancing user experiences and emphasizing the benefits of UPI apps to encourage continued adoption.
Interestingly, the moderating role of fake news revealed a counterintuitive outcome, where misinformation did not deter users with strong positive attitudes from continuing their use of UPI apps. This suggests that the system’s perceived reliability and widespread adoption mitigate the negative effects of fake news. Users appear to prioritize the functional benefits of UPI apps over concerns raised by misinformation, showcasing their resilience and trust in the system.
These insights emphasize the need for collaborative efforts among developers, regulators, and financial institutions to maintain and strengthen this trust. Stakeholders should focus on combating misinformation through digital literacy initiatives, transparent communication, and robust security measures. Banks, in particular, must ensure secure transactions by deploying advanced fraud detection systems, encryption standards, and authentication protocols. Such measures will not only address potential risks but also enhance user confidence, fostering sustained adoption and growth. Ultimately, these efforts will reinforce UPI’s role as a driving force in India’s digital economy and its broader financial inclusion agenda.
Limitations
This study has certain limitations that should be acknowledged. First, the use of a convenience sampling method, while cost-effective and practical, may have limited the generalizability of the findings. The sample was drawn from UPI app users who were accessible through online platforms and social media, which might have excluded individuals who do not actively use these platforms. As a result, the study may not fully represent the broader population of UPI users in India, especially those in rural or less technologically connected areas. Second, the data collection relied on self-reported responses through an online questionnaire. This approach is susceptible to common method bias and social desirability bias, which could have influenced participants’ answers, particularly regarding their attitudes and perceptions of fake news. Finally, the study relied on previously validated scales that were adapted for the UPI context. While minor modifications were made to ensure contextual relevance, cultural and contextual nuances specific to Indian users may not have been fully captured.
Footnotes
Declaration of Conflicting Interests
The authors declared no potential conflicts of interest with respect to the research, authorship, and/or publication of this article.
Funding
The authors received no financial support for the research, authorship, and/or publication of this article.
Appendix Questionnaire
Using UPI payment app is a good decision (ATT1) Using UPI payment app is a wise decision (ATT2) Using UPI payment app is a positive step (ATT3) I like to use UPI payment app (ATT4) Overall, my attitude toward UPI payment app is favorable (ATT5)
On online social media, I saw information related to UPI payment that I later found out as a hoax. On online social media, I saw content related to UPI payment that seemed accurate at the time, but I later found it was made-up. On online social media, I saw content related to UPI payment that was exaggerated.
I intend to continue using UPI payment apps rather than discontinue its use. I will keep using UPI payment apps as regularly as I do now. My intention is to continue using UPI payment apps than use any alternative means. I intend to increase my use of UPI payment apps in the future.