
Abstract
The aim of the current study is to examine the impact of generic business strategies (GBS) on default risk for Indian firms listed on the National Stock Exchange. This study employs a distance-to-default model to compute default risk and GBS, which are measured through Porter’s framework. The relationship between GBS and the probability of default is derived through panel data regression analysis for the period 2008–2009 to 2021–2022. The results support the hypothesis and show a positive relationship between cost leadership and the distance-to-default model. The findings indicate that companies employing a cost leadership strategy tend to have sound financial health, which makes them less prone to default risk. The results show practical implications for financial institutions, creditors, and investors who can check the strategic positioning of a firm before evaluating and arriving at the credit rating, lending, and investment decisions. Based on the findings of this study, investors can provide funds to invest in a firm that implements GBS effectively to ensure high investment returns and fewer credit defaults. The study is expected to contribute to default risk literature by providing evidence that GBS indicators can be experimented for incorporation into new default risk prediction models.
Keywords
Introduction
Corporate default is a crucial phenomenon in the life history of a firm, as it results in economic losses for its stakeholders, comprising creditors, employees, shareholders, customers, and suppliers. It results in the causation of contagious disruptive effects on companies with whom it shares commercial relationships. In the case of the bankruptcy of General Motors (GM) in 2009, for instance, several of its offices were shut down, and several brands such as Saturn and Hummer ceased to exist. This event critically affected the suppliers and employees who lost their sources of income in this bankruptcy.
The prediction and alleviation of default risk have become the priority of accounting researchers and practitioners in the wake of the global recession of 2008 to 2009. Both financial analysts and academicians became vigorously involved in exploring the indicators to assess financial distress and improve the prediction accuracy of corporate defaults. Despite the existence of multiple research studies on the determinants of corporate default, there is a persistent and sustained need to comprehensively investigate the factors that rescue a company from a stage of distress (Altman et al., 2015; Balcaen & Ooghe, 2006).
Extant literature has used various accounting indicators, for example, a firm’s profitability, liquidity and solvency position, and so on, to forecast a corporate failure (Beaver et al., 2005). However, generic business strategies (GBS) that measure cost leadership and differentiation, which enhance business performance, have not been directly explored as predictors of corporate default. The GBS are the critical components that crucially contribute to the company’s success. The managers who are oblivious of the essence and significance of the business strategies cannot ensure the long-run viability of the companies (Sadjiarto et al., 2020). There has been evidence in recent studies that GBS significantly explains financial health and contributes to a firm’s creditworthiness (Bryan et al., 2013).
The article suggest that GBS are formulated, executed, and monitored to identify the red flags that may pave the way for a company to default (Agustia et al., 2020; Bryan et al., 2013). These generic strategies diversify a company’s revenue stream, ensure an optimum level of cash flow and liquidity, and contribute to the overall profitability of a company. GBS thus improves a firm’s financial stability by ensuring that the firm meets its financial obligations (Bryan et al., 2013). However, most of this research has been carried out in an international context that investigated the relationship between expected bankruptcy and GBS. Due to the scarcity of evidence in an Indian context on whether GBS can determine the probability of corporate default, this article aims to investigate the impact of GBS on default risk for Indian firms listed on the National Stock Exchange (NSE). Distance-to-default, a widely applied model to forecast corporate failure, is used for computing default risk and GBS, which have been measured using Porter’s (1980) framework.
The key motivation for this article arises from the factual report that financial distress is rising expeditiously among Indian firms. There have been a few industries that have experienced highest default rate for the last 30 years: food products, textiles, construction, metals and mining, and real estate development (Crisil Rating, 2022). This article, therefore, focuses on these industries to investigate empirically if GBS can improve the current state of financial distress of sample industries. Another motivation arises from the lack of empirical research studies in the Indian context that address this issue of default risk and GBS. There are numerous studies examining the relationship between business strategies and firm performance, but this domain has not been adequately focused upon and is, therefore, quite under-researched.
The study contributes to the literature on financial distress and default risk prediction from the Indian perspective. It provides empirical evidence about the importance of GBS in cleaning financial distress and strengthening the firm’s financial stability. The results provide useful implications for investors, financial analysts, and financial institutions who examine the creditworthiness of companies before making investment and credit-rating decisions. Firms that implement cost-leadership effectively tend to expand their profitability significantly and improve their creditworthiness. The study results are envisaged to enable stakeholders to invest their funds in companies that enjoy a significant competitive advantage and can award significant financial returns. The format and layout of the article is presented in various sections. The second section comprises the literature review. Research methodology is presented in the third section, while the fourth section is a portrayal of the discussion on the study findings. The conclusions drawn and future research implications are given in the fifth section.
Literature Review
The current section provides the review of literature relating to GBS and default risk. The literature has been classified under three subsections: the first being studies on default risk, the second being literature on GBS, and the third being studies providing links between GBS and default risk.
Default Risk Literature
Financial distress prediction has been an active area of accounting research since the pioneering work of Beaver (1966) and Altman (1968). The early literature employed accounting-based indicators to formulate models that could distinguish between defaulting and non-defaulting firms. One of the highly cited models, Altman’s (1968) Z-score, was constructed by employing a statistical technique named multiple discriminant analysis. The other widely used model was developed by Ohlson (1980) using logistic regression analysis. These accounting-based models, which rely excessively on financial statements, suffer from two major issues. First, financial statements are fundamentally backward-oriented and summarize the company’s financial performance for the previous year. Second, they are constructed under the going-concern principle, which states that companies are going to survive. Both of these attributes are incompatible with a predictive assessment of default risk. Most of the existing literature provides an understanding of only how accounting ratios can be utilized to forecast defaults. Recently, default prediction research has been centered on Merton’s (1974) contingent claims technique. Merton’s model takes into account equity prices for assessing the default probability and considers the market value of leverage rather than book value as the accounting-based models do. Market pricing represents investors’ forecasts for the firms’ future performances. Hence, this model provides progressive information that is more suitable for computing the probability of a default by a corporation in the future. Vassalou and Xing (2004) utilized an option model to compute default probabilities and found that size and book-to-market factors were key determinants of default risk. Similarly, Gharghori et al. (2006) found that the option-based DD model outperformed the other accounting-based metrics for predicting the default risk of Australian-listed firms.
Many research studies focused on simplifying and improving the original Merton model by incorporating specific modifications. Du and Suo (2007) examined the effectiveness of an option-based model for predicting the default risk of US-based firms. The results indicated that the simpler model surpassed the original Merton’s model in terms of default predictability of both estimating and hold-out samples. Similarly, Byström (2006) presented a basic approximation of the option-based model. The study demonstrated that errors generated by the simplified model were quite minimal in comparison to those produced by the option-based model. Both models have been developed on the basis of Merton’s (1974) model and utilize equity prices and debt as key predictors in default estimation. The models have been found to be effective in mis-specification and hold empirical significance in predicting default probabilities (Agrawal & Maheshwari, 2016; Chaturvedi & Singh, 2024; Kabir et al., 2021). The current study, therefore, applies these simplified distance-to-default models for the default estimation of the sampling population spanning one and a half decades.
Generic Business Strategy Literature
In the knowledge-based economy era, firms need competitive advantages that drive their performance in a challenging environment (Bentley et al., 2013; Miller & Friesen, 1986). Achieving a competitive position enables a firm to attain better financial performance. Porter (1980) is of the view that the three generic strategies can be used to achieve a competitive position in the market: cost leadership, differentiation, and focus strategies. Under cost leadership, a cost leader is a firm that produces goods at a lower cost for a given quality than its competitors. Hambrick (1983) suggested two ways to achieve cost leadership: (a) cost efficiency and (b) asset parsimony. A firm attains cost efficiency when it employs fewer units of inputs for producing given units of output. On the other hand, asset parsimony is achieved through the optimum utilization of fixed assets to generate a given level of output.
The differentiation strategy aims to bring value to the firm by generating a high profit margin achieved through creating brand awareness, customer acquisition, and technology leadership (David et al., 2002). Large budgets are devoted to research and development activities to improve customer awareness, create price inelastic demand, and build brand loyalty (Bentley-Goode et al., 2019). Focus strategy provides value to the customer in a niche market, which can be a specific customer group or geographical area.
Relevant literature shows that cost leadership and differentiation strategies are used in a broad range of segments to generate competitive advantage for firms (Banker et al., 2011). The competitive advantage enables a firm to achieve better financial performance (Hambrick, 1983). The performance indicators of a firm, such as return on assets, sales growth, and so on, are higher for companies that effectively implement GBS (Kald, 2003) and have better financial health (Shobhwani & Lodha, 2024). Based on the literature, cost leadership and differentiation are used to measure GBS employed by the sample firms.
Relationship Between Generic Business Strategy and Default Risk
The impact of GBS on firm performance is well documented in literature. The studies suggest that both GBS are essential for creating long-term competitive advantages (Leitner & Güldenberg, 2010; Ma, 2000). Recently, researchers are moving from the link between GBS and financial performance and examining GBS’ impact on a company’s financial health and stability. Using Porter’s (1980) typology for measuring business strategies, the results of Ameer and Othman (2021) indicate that tight cost controls achieved through efficient plants and product designs contribute to the firm’s survival in the long run.
Karels and Prakash (1987) warn that financial distress may lead a firm to a stage of bankruptcy. The study suggested two causes for the firm’s probability of default: internal and external. Internal causes such as poor management, lack of financial resources, and incompetent human resources can turn a profitable company into a distressed one. External causes, such as regulatory changes and market risks, affect the entire industry at the macro level. In this respect, recent research has proven that optimum business strategies protect firms from underlying internal and external risks (Dalwai & Salehi, 2021). As a result, firms need to adopt GBS to gain financial resilience and flexibility during uncertain events to enhance overall financial stability (Agustia et al., 2020).
The literature on default assessment and prediction in the Indian context acknowledges the importance of GBS in improving firm performance but does not investigate their effect on a firm’s financial solvency. Recent studies in the international context highlight the importance of GBS in mitigating the firm’s default risk (Anggraini & Hendranastiti, 2023; Bryan et al., 2013; Dalwai & Salehi, 2021; Habib, 2023; Luu Thu, 2023). Luu Thu (2023) suggest that both cost leadership and differentiation strategies aim to achieve competitive advantages through achieving cost efficiency and maximizing profit margins, respectively. This ensures the firm’s sustainability in long-run and reduces the risk of corporate failure.
Bryan et al. (2013) empirically investigated the relationship between default risk and business strategies and demonstrated the positive influence of generic strategies on a firm’s financial health and stability. Using US-based firms’ data for 17,636 firm-year observations, the results indicated that the implementation of effective strategies is necessary for mitigating default risk. The same results were observed from the study of Agustia et al. (2020) who examined impact of GBS on default risk for the companies listed on the Indonesia Stock Exchange. The findings suggest that firms implementing GBS efficiently are less prone to corporate failure. In the same vein, Dalwai and Salehi (2021) investigated the impact of strategies on default probability for the firms listed in the Muscat Securities Market. The results demonstrated that firms exhibiting effective implementation of strategies were more financially healthy as compared to firms showing a lower strategy index. On the basis of these arguments, the following hypotheses have been framed for the current study:
H1: Cost leadership strategy is negatively associated with the probability of default. H2: Differentiation strategy is negatively associated with the probability of default.
Research Design
Sampling, Data Source, and Variable
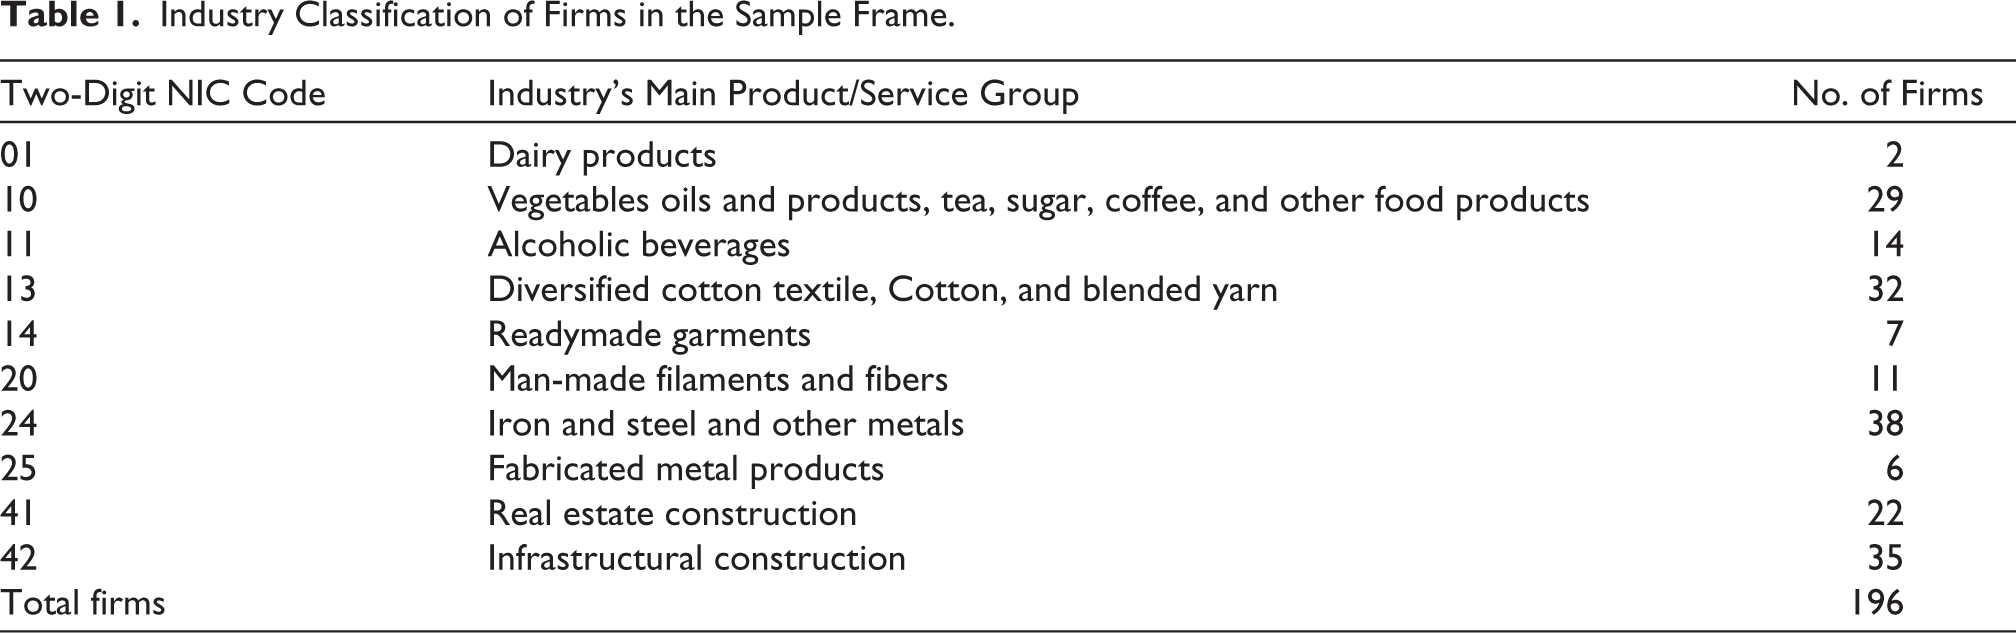
The research sample for this study had 196 companies, drawn from non-financial companies listed on the NSE for 15 years from 2008–2009 to 2021–2022. Of all the non-financial industries listed on the NSE, the following industries have experienced the largest default rate for the past 32 years: textiles, food products, metals and mining, construction, and real estate development (Crisil Ratings, 2022). We targeted the high default-incurring industries particularly to investigate if generic strategies can mitigate their corporate default risk. The financial services companies were excluded due to differences in their accounting practices. Further, those firms were selected for which data was completely available for all the financial years. This procedure leads to the final 2,940 firm-year observations for the period of 15 years. The data of all variables is collected from the Prowess IQ database. Table 1 presents the industry-wise classification of sample companies based on two-digit National Industrial Classification codes.
Industry Classification of Firms in the Sample Frame.
Variable Measurement
Dependent Variable: Default Risk
The current study applies distance-to-default as a proxy to estimate default risk because it remains an extensively applied market-based default risk metric (Capasso et al., 2020; Chaturvedi & Singh, 2024; Du & Suo, 2007; Nadarajah et al., 2021) and outperforms accounting-based models. The distance-to-default metric is computed through Merton’s (1974) option-based model, which utilizes the firm’s equity prices and leverage as the primary determinants of default. The DD metric assesses how far the company is from the probability of default. Higher values of the DD metric indicate a lesser probability of default, and lower values imply the greater likelihood of default. The modified Merton DD metric is computed using the following expression:
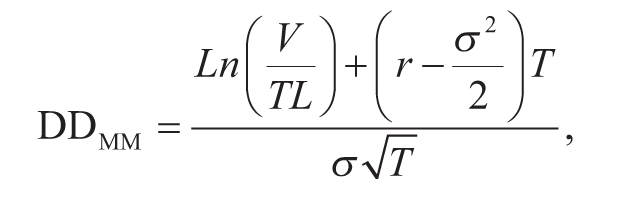
where DDMM = Modified distance to default, V = Assets’ market value, TL = Liabilities’ book value, r = Asset growth rate, σ = Assets’ standard deviation, and T = Time of expiry set as 1 year.
Since r and σ are not directly observable, they have been computed using the similar procedure used by Kealhofer, McQuown and Vasicek corporation (KMV) and Vassalou and Xing (2004).
Byström (2006) provides a simple version of an option-based model that estimates distance to default by using observable factors such as market prices of equity capital and the value of company’s liabilities. The author contends that his metric, which can be computed for any company independent of its capital structure and asset volatility, is useful in assessing default probability in both developing and volatile markets. This model is simple and produces similar results to the standard Merton model. Based on previous studies (Agrawal & Maheshwari, 2016; Schenck, 2014), the modified distance-to-default model created by Byström (2006) has been employed to ensure the robustness of the results. A simple formulation of the modified DD metric is written as
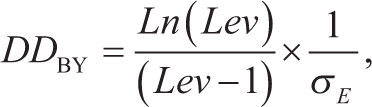
where DD BY = Modified Byström distance to default, Lev = Leverage ratio computed as TL/(VE + TL), VE represents the market value of equity and TL is the summation of firm’s long and short term debt, σE = Volatility in firms’ equity returns computed on a daily basis.
Independent Variables: Generic Business Strategies
As mentioned before, the study uses cost leadership and differentiation strategies to measure the extent of GBS employed by sample firms.
Cost Leadership Strategy Measure
Cost leadership is experienced by a firm when it establishes itself as a lowest-cost producer and achieves competitive advantage through operational excellence. In line with previous research studies (Agustia et al., 2020; Banker et al., 2011; Banker et al., 2013; Hambrick, 1983; Wu et al., 2015), Asset Turnover of Operation is used as a proxy to measure cost leadership.

where

Differentiation Strategy Measure
The existent literature contends that Porter’s differentiation strategy is widely used in accounting literature to achieve a competitive advantage (Agustia et al., 2020; Habib, 2023; Sadjiarto et al., 2020; Wu et al., 2015). Differentiators charge premium prices from their customers by offering them unique and superior products (Porter, 1980). Selling and Stickney (1989) argued that a differentiation strategy can be considered as a profit-margin strategy. Based on previous studies, the Profit margin is used as a proxy to measure differentiation strategy and is computed as follows:

Control Variables
The following six control variables are incorporated for the results estimation: Size, computed as the natural algorithm of market capitalization; Liquidity, calculated as the ratio of cash holdings to total assets; Leverage comes from the ratio of long- and short-term debt to total assets; Profitability, it is the dummy variable that assigns “0” to firm for incurring profits and “1” otherwise; Return Volatility, defined as annual stock return volatility measured through standard deviation of daily equity returns; Age is computed as taking the natural logarithm of the difference between the company’s incorporated year and the respective fiscal year (Agustia et al., 2020; Capasso et al., 2020; Kabir et al., 2020).
Empirical Results
Summary Statistics
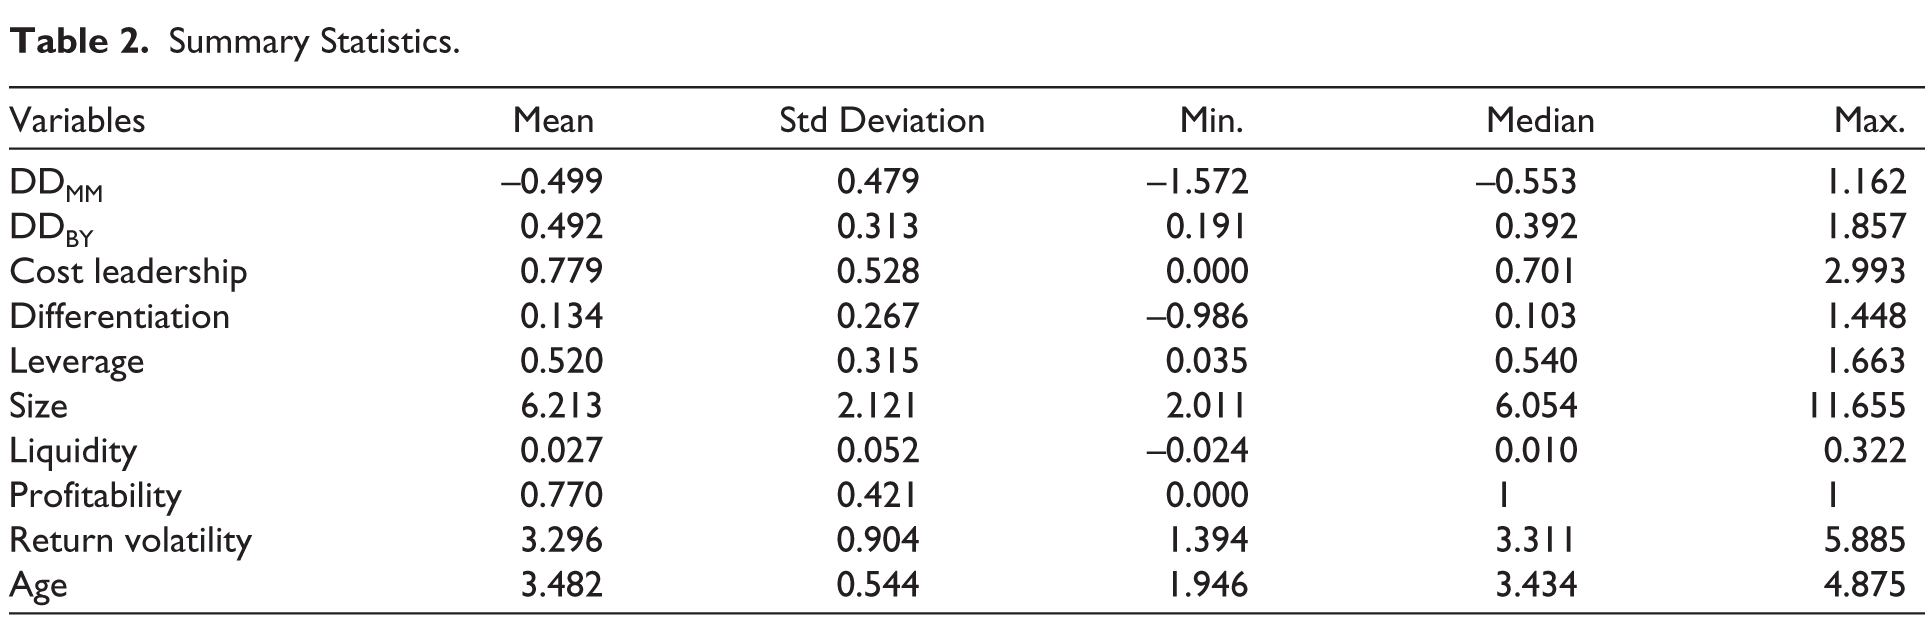
The summary statistics of the current study are presented in Table 2. To deal with potential outliers, the winsorization of independent variables was done at 1% from both tails. The average default risk captured by DDMM and DDBY appears to be –0.499 and 0.492, respectively. Both GBS display the positive mean of 0.779 and 0.134 for cost leadership and differentiation, respectively. The leverage shows a mean value of 0.52, while the average liquidity comes to be 0.027. The mean size (6.213) indicates that, on average, firms operate on a large scale. The average return volatility and age appear to be 3.296 and 3.482, respectively.
Summary Statistics.
Correlations
The correlation matrix of sample variables is provided in Table 3. Both cost leadership (correlation coefficient = 0.177) and differentiation strategy (correlation coefficient = 0.205) have shown a significant association with DDBY. This positive association implies that the higher the value of GBS, the more the financial stability will be or the lower the default risk.
Correlations.
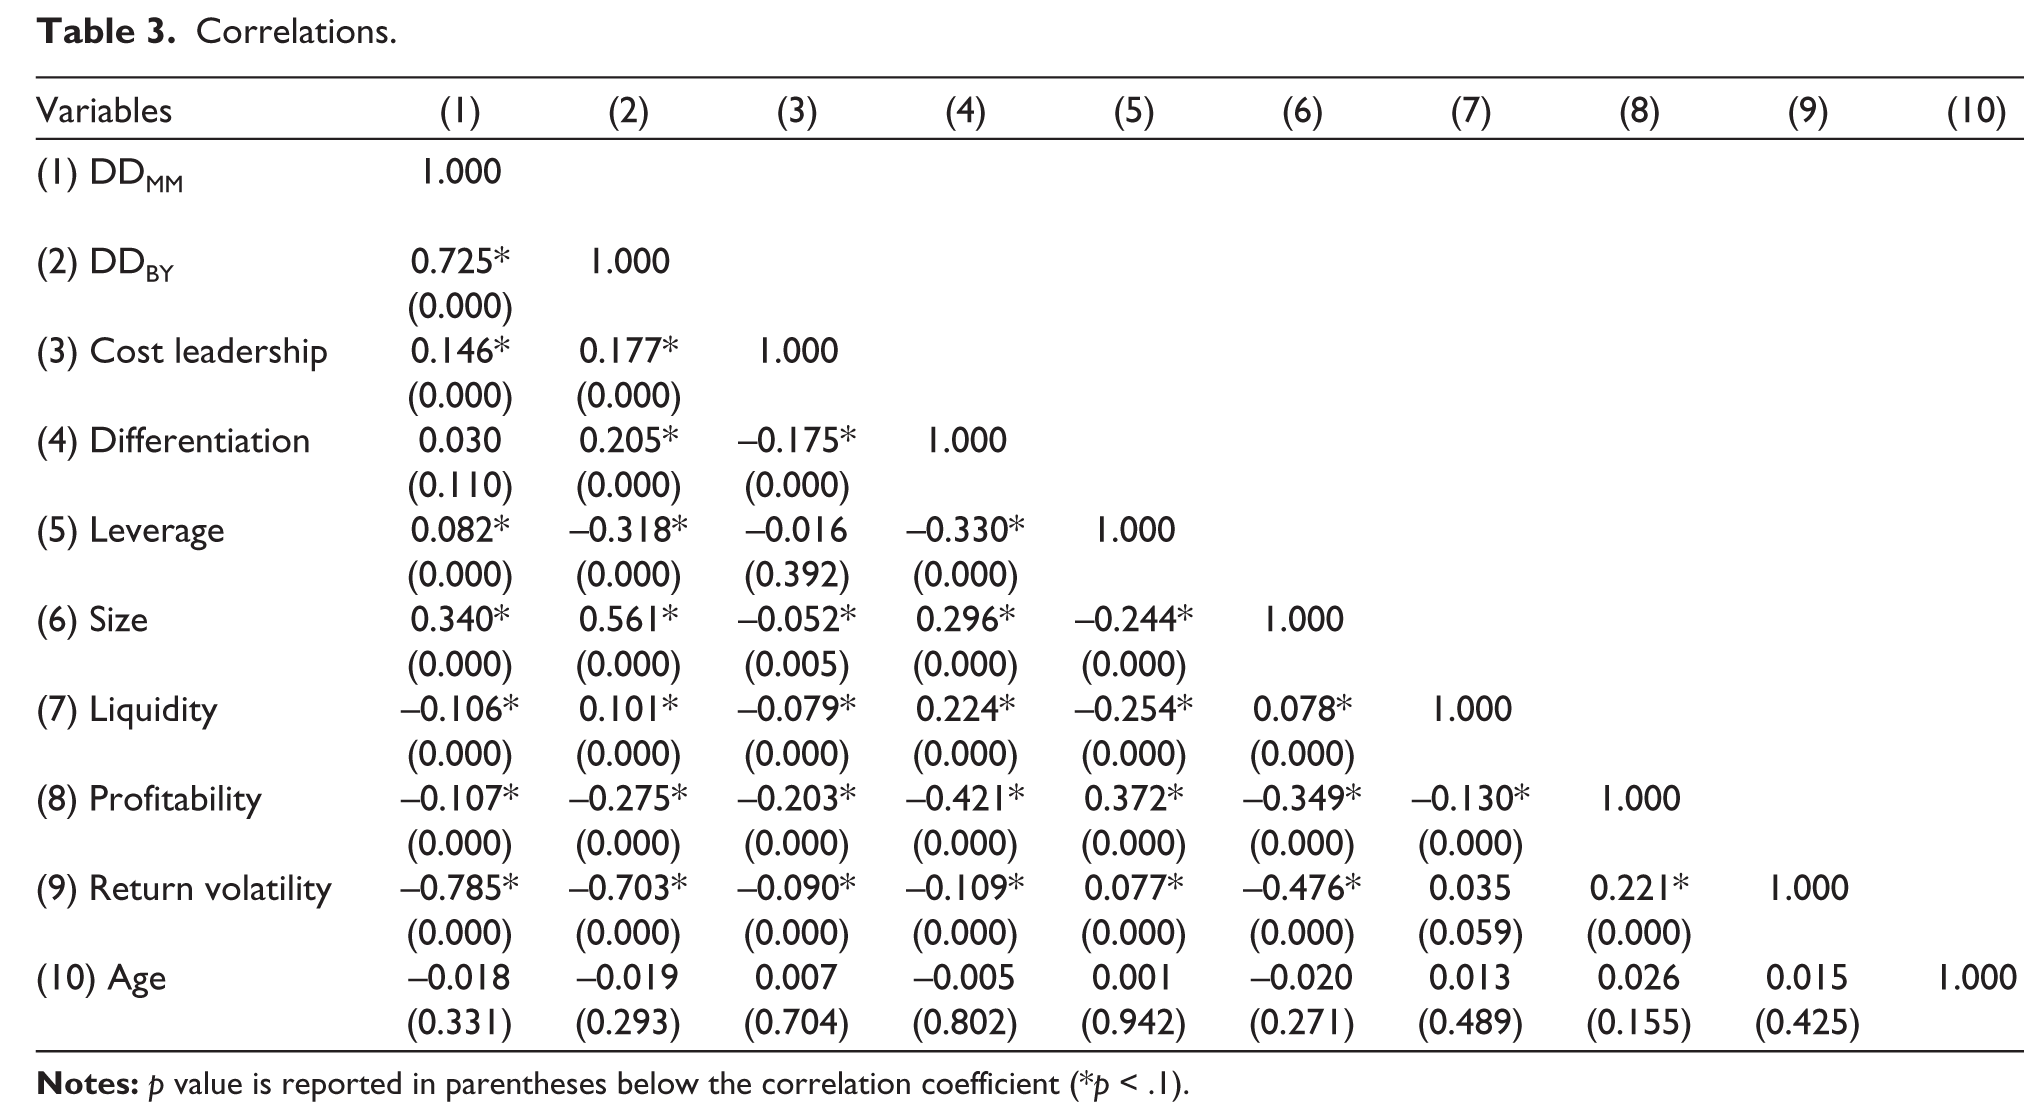
The control variables’ coefficients also align with our expectations. Size is positively correlated (correlation coefficient = 0.340; correlation coefficient = 0.561) with DDMM and DDBY, respectively. Similarly, liquidity has shown a positive association (correlation coefficient = 0.101) with the DDBY model. The negative associations between return volatility (correlation coefficient = –0.785; correlation coefficient = –0.703) with DDMM and DDBY, respectively, imply that firms with higher stock return volatility are more prone to default risk.
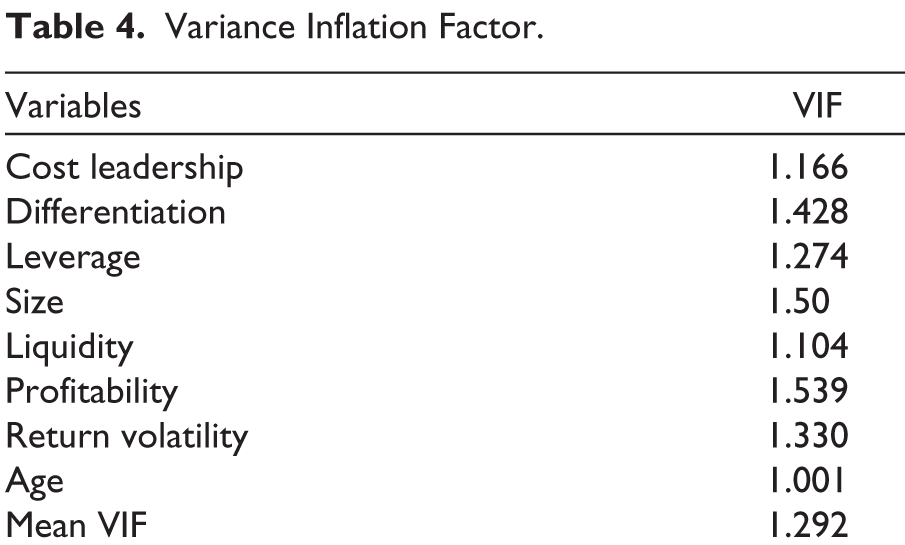
Prior literature posits that the model can be over-specified when two independent variables, which are related and pertinent, are used simultaneously to explain the variation in the dependent variable (Field, 2013; Wooldridge, 2015). In such a situation, incorporating both variables can cause the statistical results to be confounded. Therefore, the present study applied the Variance Inflation Factor (VIF) test to ensure that results are significant and do not confirm the multicollinearity issues. It is a widely used measure in accounting literature to address multicollinearity (Gandhi, 2024). The tool inflates the variance of estimators and suggests that the coefficients of the VIF estimators should be less than 10 to refrain from producing misleading results. As mentioned in Table 4, the average VIF is 1.292 with a maximum value of 1.539, confirming no multicollinearity issues.
Variance Inflation Factor.
Panel Data Regression Analysis
The hypotheses of the study have been tested via panel data regression analysis. To choose between pooled OLS and the random effect model, the Breusch–Pagan Lagrangian Multiplier test was applied. The null hypothesis of this test states that pooled OLS is an appropriate model. If p value is less than .05, then we reject the null hypothesis and use the random effect model. The results of this test favored the random effects model.
Further, the choice between the fixed effect and the random effect was made by conducting the Durbin–Wu–Hausman test (DWH), the null hypothesis of which favors the random effects model, and the alternative hypothesis explains that the fixed effect model is significant for results. The test findings indicated that the fixed-effect model is suitable for our study. The regression equation used in the current study is as follows:
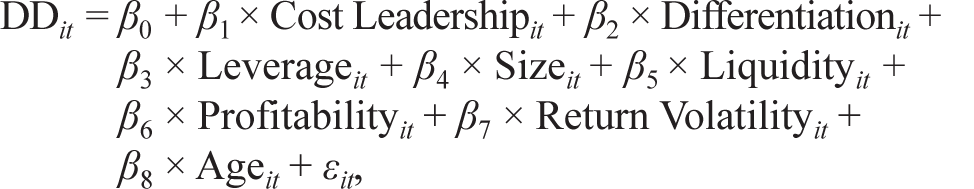
where DD it is default risk of a company i in year t computed through Modified Merton Distance-to-Default model. Cost Leadership it and Differentiation it are two generic strategies measured through Porter’s (1980) framework. Leverage it , Size it , Liquidity it , Profitability it , and Return Volatilityit, Age it are the control variables affecting the default risk of sample firms. The problem of autocorrelation and heteroskedasticity was corrected by computing robust standard errors using clustering by the firm (Kaufman, 2013; Petersen, 2008; Stock & Watson, 2018). The findings of robust fixed effect model are provided in Table 5.
Relation Between Default Risk and Generic Business Strategies.
Impact of Generic Business Strategies on Default Risk
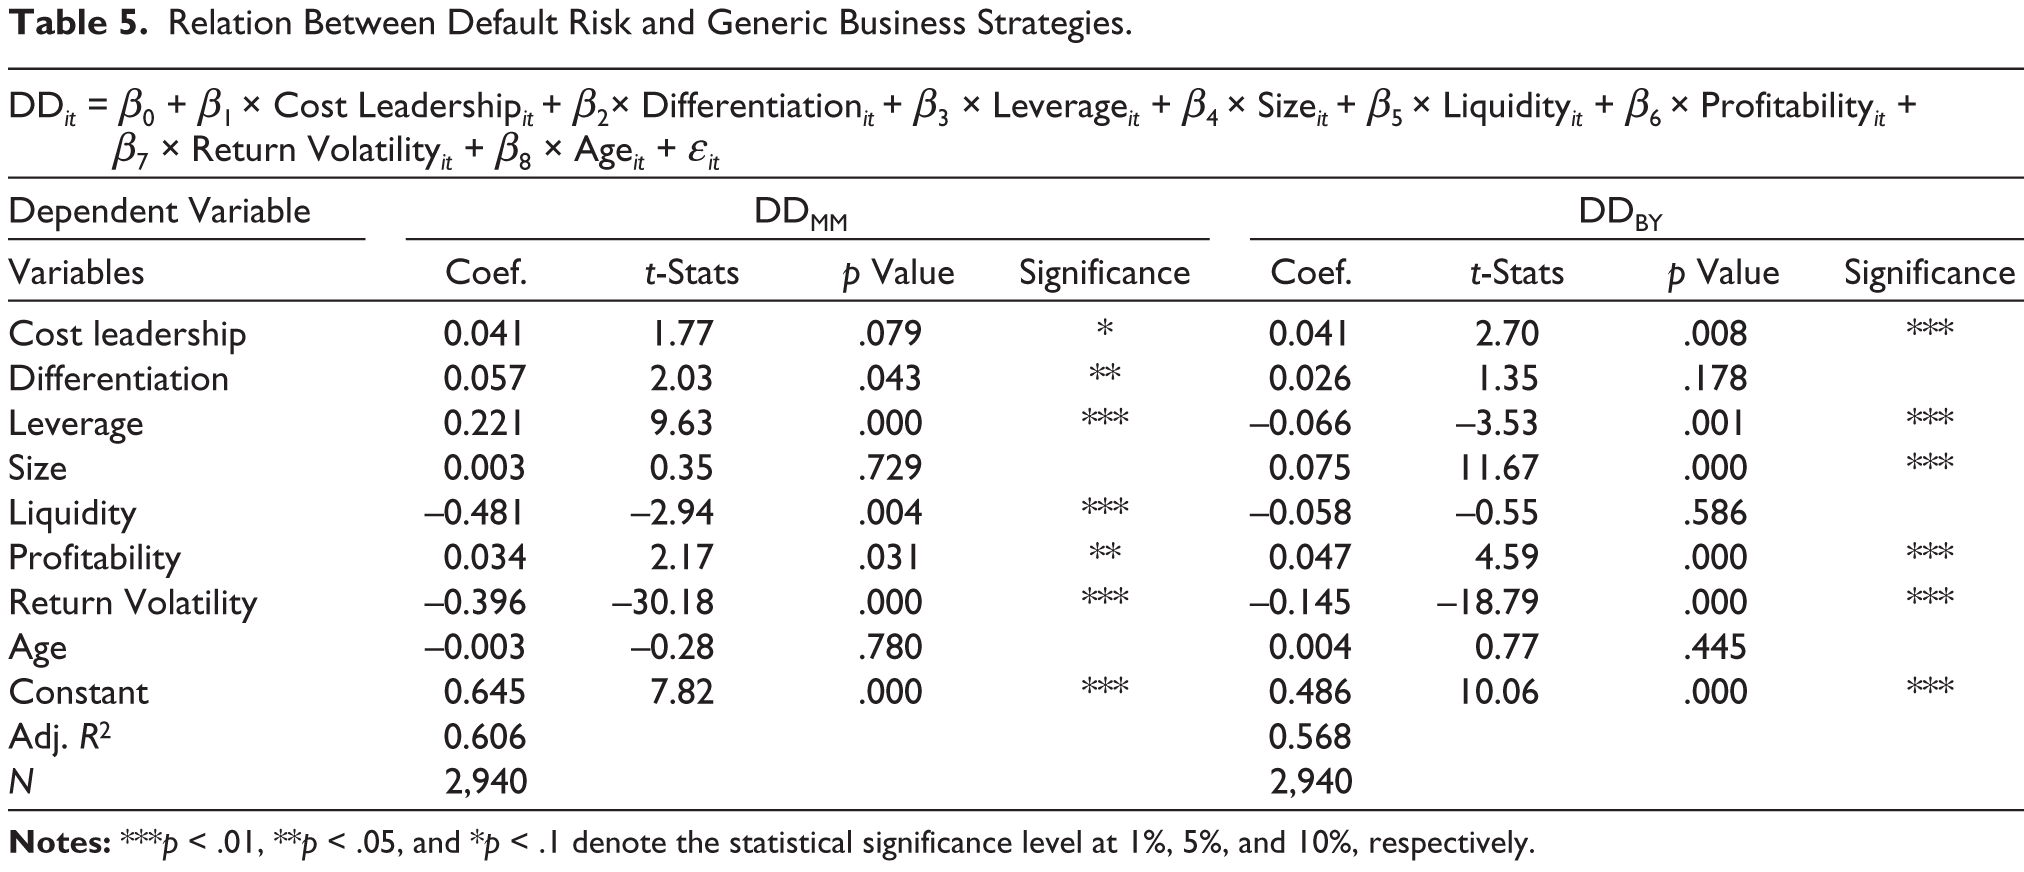
The relationship between GBS and the probability of default is evaluated by Equation (1). Panel data regression results for 2,940 firm-year observations (n) are provided in Table 5.
The coefficient of cost leadership (coefficient = 0.041; t-statistics = 1.77) indicates that it has a positive impact on improving financial the stability of sampling firms. These findings suggest that firms exercising cost leadership are achieving cost efficiency, which tends to lower their operational costs. The reduced operational costs enable firms to charge lower prices from customers and help beat their competitors through customer acquisition and improved financial returns. In other words, the contribution of cost leadership in improving profitability leads to better financial solvency and stability. These findings are similar to the results of Luu Thu (2023). The current study results also align with the findings of Anggraini and Hendranastiti (2023) and Pathak (2015), who found significant positive impacts of cost leadership on firms’ financial solvency.
Firms exercising cost leadership aim to provide customers with standardized and volume products at competitive prices. For an emerging economy like India, low labor and manufacturing costs provide a competitive edge to the firms because customers tend to choose lower-priced products owing to their lower disposable income. Thus, this approach entails firms to increase their market share by targeting price-sensitive and cost-conscious customers. Higher market share enhances firms’ profitability, leading to improved financial solvency. These findings are consistent with the results of Habib (2023), who demonstrated that a cost leadership strategy enables firms to produce and deliver products at lower cost, contributes to enlarging the profit base, and thereby results in increased financial resiliency.
Further, the differentiation strategy (coefficient = 0.057; t-statistics = 2.03) confers that it positively explains the solvency of firms. Differentiated firms are creating a genuine or perceived distinction in the products and/or services, leading to the creation of a customer base that perceives their products and/or services as being superior and exceptionable. Brand loyalty is generating space for commanding premium prices from customers, leading to an increment in the profitability position and hence increased financial solvency. These findings are in line with the results of Luu Thu (2023), Anggraini and Hendranastiti (2023), and Ameer and Othman (2021), who suggested that a differentiation strategy causes an improvement in a firm’s profit margin by charging premium prices on its unique product offerings, leading to an enhancement in overall financial stability.
Both of the competitive advantages lead a firm to superior profitability and financial health. Overall, the results support the findings of Bryan et al. (2013) and Dalwai and Salehi (2021), who found that the implementation of either of the generic strategies can bring financial stability to firms. On the contrary, the results disagree with the findings of Kristanti and Pancawitri (2024), who found an insignificant impact of GBS on firms’ financial health.
The estimated coefficients of some control variables show expected relationships. In line with our expectations, profitability is significant and positively impacting the financial stability of the firms (coefficient = 0.034; t-statistics = 2.17). It shows that profit-making firms have a lower likelihood of facing default. This result supports the findings of Nadarajah et al. (2021). Consistent with prior literature and in line with our expectations, return volatility has shown a significant and negative relationship (coefficient = –0.396; t-statistics = –30.18) with distance to default, meaning that higher stock return volatility leads to an increment in the firm’s default risk. These findings support the results of Capasso et al. (2020), who demonstrated the negative influence of return volatility on financial stability. Liquidity is shown to be significantly related to distance-to-default measure (coefficient = –0.481; t-statistics = –2.94). However, the negative impact of liquidity on firm’s health may arise because excess liquidity entails firms maintaining larger amounts of cash and cash equivalents that could be put into higher yield-generating investments. This lowers the firms’ asset and equity returns, resulting in reduced financial performance and stability. This result aligns with the findings of Kabir et al. (2020). Contrary to the common perception, Leverage has shown a positive relationship (coefficient = 0.221; t-statistics = 9.63) with distance-to-default measure. It could be argued that it is because of trade-off theory and agency cost hypothesis, which state that increasing leverage to a specific extent improves business performance by reducing inordinate contributions from equity holders. It results in minimized agency concerns between management and equity shareholders (Mishra & Dasgupta, 2019). This improved financial performance leads to increased profitability and financial solvency. The age of the sampling firms has shown an insignificant relationship with the distance-to-default model.
Robustness Checks Results
To ensure that the findings of the study are robust, an alternative specification of default risk, namely, Byström’s Distance to Default (2006), was applied. Although numerous methods exist for default risk measurement, this model is significant enough irrespective of the company’s capital structure or asset volatility and is useful for estimating companies’ likelihood of default in emerging economies. Hence, this model aligns with the sampling characteristics of the present article. The panel data regression was performed additionally to evaluate the sensitivity and strength of the primary results.
The findings in Table 5 revealed that the coefficient of cost leadership (coefficient = 0.04; t-statistics = 2.70) remained significant at the 1% level. This finding is lending support to the first hypothesis that cost leadership strategy accounts for noteworthy contributions to the company’s solvency, and confirm that results are holding up under alternative model measures. The coefficient of differentiation strategy (coefficient = 0.026; t-statistics = 1.35) is also positive, meaning that it positively impacts the firms’ financial stability. However, for this particular regression, the differentiation strategy coefficient has not shown a significant effect on distance-to-default. This finding is contrary to our second hypothesis.
Turning to control variables, the coefficient of Profitability (coefficient = 0.047; t-statistics = 4.59) has remained positive and significant at the 1% level. Similar to our expectations, the coefficient of Return Volatility (coefficient = –0.145; t-statistics = –18.79) has found to be significant and shows negative impact on financial stability. The coefficient of age, which was insignificant under primary results, also appears to be not significantly related to this alternate specification of distance-to-default. The coefficient of Leverage, which exhibited a positive relationship with financial stability under the main analysis (coefficient = 0.60; t-statistics = 3.01), has turned negative (coefficient = –0.066; t-statistics = –3.53). The study, therefore, fails to demonstrate the relationship between leverage and default risk. However, the significance and direction of coefficients of other variables remained upheld, indicating the overall robustness of results. It is, therefore, apparent that the results reported herein validate the abovementioned findings.
Diagnostic Tests
The study further applies dynamic panel data to validate that the results of the analysis are robust and not affected by the endogeneity issue. System generalized method of moments (SGMM) is used when the regression analysis targets a large number of firms with a small number of years (Blundell & Bond, 1998). Based on the literature, variables measuring default risk: DDMM and DDBY were estimated with a lag of 2 years. It allows past DD scores to have an impact on the current value of business strategies. In other words, the generalized method of moments (GMM) estimator takes into consideration the dynamic endogeneity while using past information as a valid mechanism. Arellano and Bond (1991) found that SGMM employs both level and differenced equations to produce consistent and unbiased results.
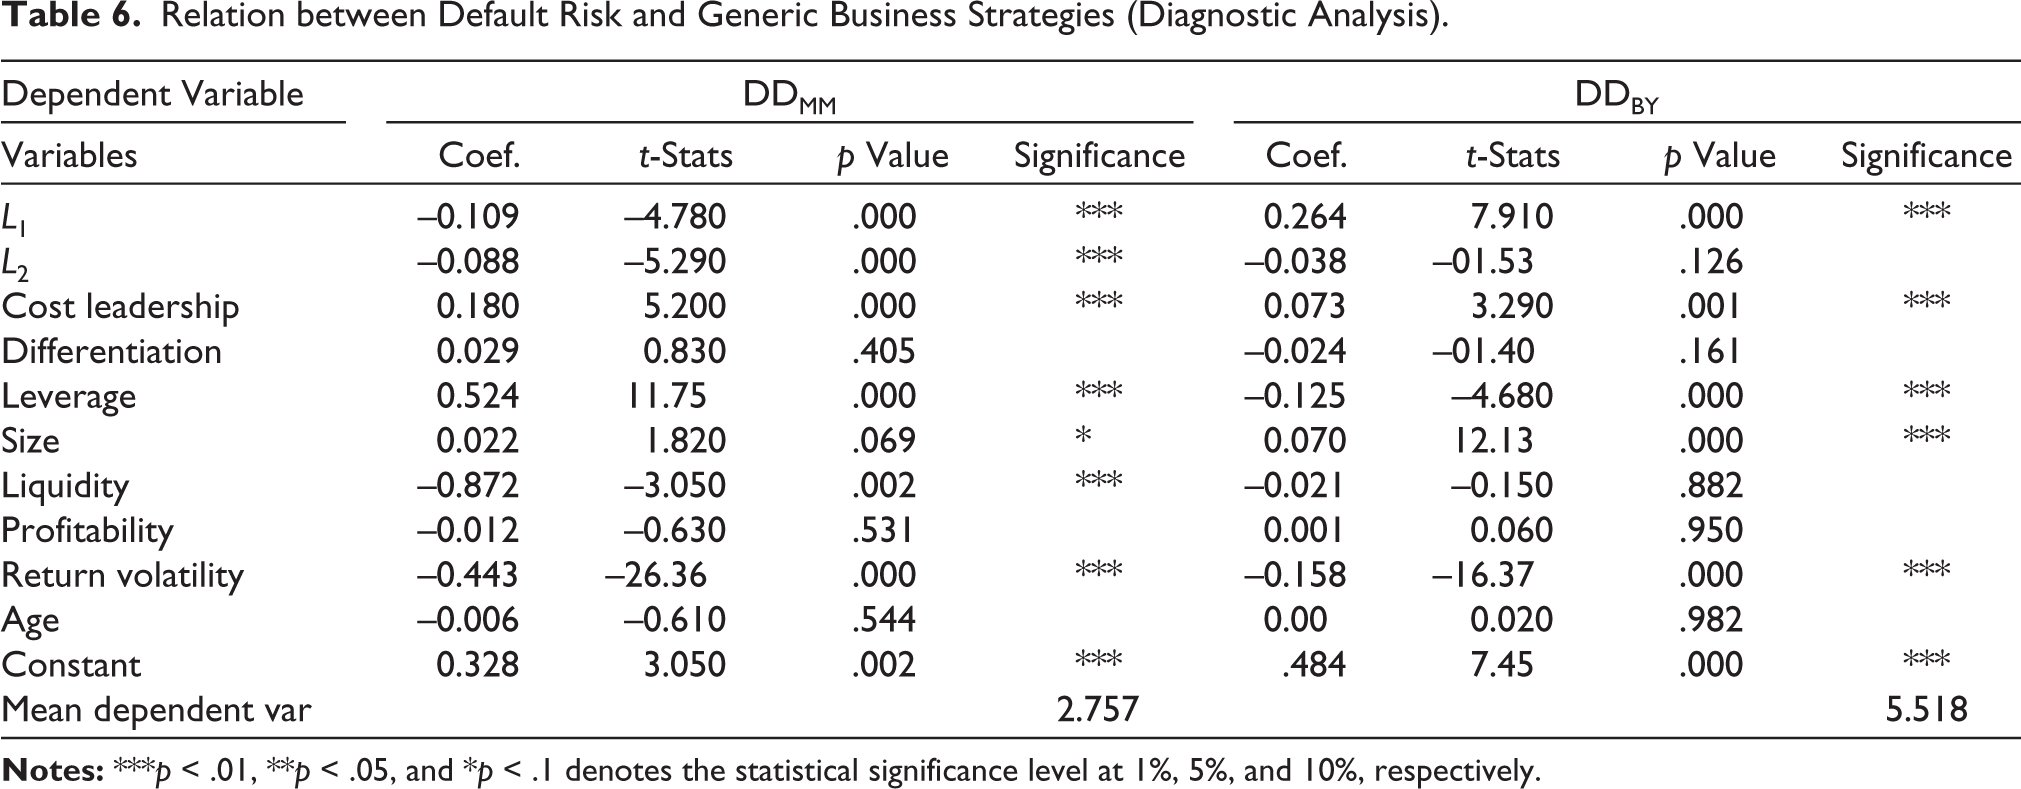
The results of the SGMM panel regression are presented in Table 6. The findings indicate that even after being impacted by the lag values of default risk measures, cost leadership is significantly and positively associated with DD scores. The coefficients of cost leadership (coefficient = 0.18, t-statistics = 5.20 and coefficient = 0.073, t-statistics = 3.29) with DDMM and DDBY, respectively, explain significantly the financial health of sample firms. The differentiation strategy coefficient, which was insignificant under robustness test results, shows an insignificant relationship under SGMM regression results. The control variables, such as size and return volatility, are found to be significantly associated with default risk measures. Overall, the findings of SGMM analysis support the results of the main analysis that cost leadership strategy can reduce the default risk of companies.
Relation between Default Risk and Generic Business Strategies (Diagnostic Analysis).
Conclusion, Limitations, and Future Research Recommendations
GBS play a crucial role in creating a competitive advantage that drives a firm toward superior financial performance. Firms that enjoy competitive positions are more financially resilient and flexible during difficult times. The current study examined the relationship between GBS and the default risk of Indian non-financial firms. Using Porter’s (1980) framework, both cost leadership and differentiation strategies were observed to make significant contributions in mitigating firms’ default risk. Generic strategies that enhance a company’s competitive positioning directly impact its financial health. The findings suggest that a firm that establishes itself as the lowest-cost producer and differentiates from its competitors experiences a significant edge in its performance. The improved performance leads to an increment in profit base, which helps clear passive interest and credit payments, contributing to the firms’ financial health and stability. The findings of the article can be served as a guiding map to managers regarding the adoption of GBS that can assist in reducing the firm’s probability of default.
Stressing upon operational excellence can reward superior financial returns and improve overall financial stability. Managers must, therefore, keep an eye on the costs to keep them cost-competitive. A firm can achieve cost reduction in a variety of areas, including overhead control and experience-based cost savings. Further, managers should closely supervise the workforce and continuously enhance their training and development. A skillful workforce can convert skill benefits into performance gains, which, in turn, improve the financial resiliency of firms. The firms that are pursuing a cost leadership strategy are in a position to stand up to pricing pressures caused by external forces. Firms that fail to build strategies, in contrast, are consistently in a tight spot with low profitability and market share, which tends to decrease their financial solvency. The study, therefore, supports the idea that managers must develop an efficient cost management system to reduce the rising default risk of the sampling firms.
The results have practical implications for financial institutions, creditors, and investors who can check the strategic positioning of firms before making credit rating, lending, and investment decisions. They are now aware that providing funds to a firm that implements GBS effectively can provide high investment returns and fewer credit defaults. The importance of investing funds in financially healthy firms is witnessed by the study of Varshney and Srivastava (2023).
The findings of the article can be interpreted along with taking into account some of its limitations. First, the study uses data on major default-incurring industries in India. Future studies would need to expand the population under study to include industries for wider generalizability. Scholars would also need to utilize the dataset of bankrupt and non-bankrupt firms to investigate the relationship between GBS and bankruptcy risk. This can help in determining whether cost leadership is one of the factors of corporate bankruptcy. Second, the current study employs Porter’s typology to measure business strategy. Future research can leverage other typologies such as Miles et al. (1978), Miller and Friesen (1978), or Mintzberg (1979) to study the relationship between GBS and default risk.
Footnotes
Acknowledgements
The authors sincerely thank the Editor-in-Chief, Mayank Joshipura. They also gratefully acknowledge the insights and comments provided by two anonymous reviewers.
Declaration of Conflicting Interests
The authors declared no potential conflicts of interest with respect to the research, authorship and/or publication of this article.
Ethical Statements
There are no human participants in this article and informed consent is not required.
Funding
The author received no financial support for the research, authorship and/or publication of this article.