
Abstract
Gender discrimination in the workplace remains a persistent issue with significant implications for employee well-being and organizational effectiveness. This study investigates the multifaceted impact of gender discrimination on employee performance in the transportation sector, focusing on the experiences of female commercial drivers in Coimbatore, Tamil Nadu, India. Employing a mixed-methods approach, the study integrates qualitative thematic analysis with quantitative survey findings to provide a comprehensive understanding of discrimination dynamics and their implications for organizational productivity. To determine the effects of discrimination on employee performance, data were gathered from 243 front-line female commercial drivers employed in Coimbatore’s road transportation industry. Analysis of the data is done statistically using correlation and regression techniques, and mixed-method analysis was used as comparative analysis using cross-tabulation and chi-square and moderation analysis using AMOS. This study considers three types of gender discrimination: hiring, promotion, and facility discrimination. The level of employee performance is more a result of discrimination against women in hiring and amenities. The paper offers principles for human resource managers to follow to prevent discriminatory behavior that negatively impacts employee performance. Guidelines for human resource management and empirical information from the Coimbatore road transport sector relate to employee performance and how it affects organizational productivity.
Keywords
Introduction
Although gender differences were initially noted in the 1950s, organizational and administrative studies did not begin to take gender discrepancies seriously until the 1980s and 1990s. In several studies (Hearn & Parkin, 1987) that focused on women in male-dominated organizations during these 20 years, the effects of gender were taken into consideration. The term “gender” is used to describe a range of distinctions between men and women, from the biological to the social. When someone is treated unfairly because of their race or gender, it is called discrimination. The dictionary defines “gender discrimination” as the preference for one gender over another, as determined by the aforementioned standards.
In a range of situations, including employment, compensation and wage discrimination, promotion, and discrimination in access to different goods and services, gender discrimination is a possibility. Employees serve as the company’s backbone and perform crucial tasks that are fundamental to its sustainability. Employee performance is negatively impacted by gender discrimination. To better understand how gender discrimination impacts employee performance, this research will examine these issues. Since men often hold the majority in India, they are given full preference. Gender discrimination encompasses a range of unfair treatment and biases based on an individual’s gender, affecting various aspects of employment, including hiring, promotion, and access to opportunities and amenities. Despite advancements in gender equality initiatives, discriminatory practices persist in many industries, including transportation. Female workers in male-dominated sectors often face unique challenges related to gender bias, harassment, and unequal treatment, impacting their job satisfaction, performance, and career advancement opportunities.
The transportation sector, characterized by its male-dominated workforce, presents a compelling context to examine the intersection of gender discrimination and employee performance. This study aims to advance understanding of the challenges faced by female commercial drivers in Coimbatore’s road transportation industry and explore how gender discrimination influences their performance and organizational productivity levels in the Coimbatore road transportation industry.
By employing a mixed-methods approach, combining qualitative thematic analysis with quantitative survey techniques, the study seeks to uncover nuanced insights into discrimination dynamics and their implications for employee well-being and organizational outcomes.
The human resource managers in the transportation industry who are dealing with gender discrimination and how it affects employee performance may find this study to be beneficial. It would also be beneficial for any transport business employee by educating them on the fundamental effects of gender discrimination on productivity.
Theory Framework
Gender discrimination in the workplace has been widely documented across various industries and geographical contexts. Studies have highlighted the prevalence of discriminatory practices in hiring, promotion, compensation, and access to opportunities and resources. In the transportation sector, female workers often encounter gender bias, harassment, and unequal treatment, contributing to a hostile work environment and impeding their professional growth and advancement.
Theoretical frameworks, such as social identity theory and gender schema theory, provide insights into the underlying mechanisms of gender discrimination and its impact on individual behavior and organizational processes. Moreover, empirical research has underscored the negative consequences of discrimination on employee morale, job satisfaction, and performance, leading to decreased productivity and organizational inefficiencies.
Petersen and Togstad (2006) claim that a variety of possible employer discriminatory practices, such as discrimination in hiring, promotion, and how salaries, are established for various types of labor, which contribute to the gender pay gap and employment discrimination. The recruiting of new employees may be the most crucial of them. According to many observers, recruiting is the most crucial factor, followed by promotions and pay. Although gender discrepancies were initially identified in the literature on management studies in the 1950s, they were not commonly regarded as a significant variable in organizational and administrative research until the 1980s and 1990s. Several studies (Hearn & Parkin, 1987) that concentrated on women in organizations with a male preponderance throughout these 20 years took gender impacts into consideration.
The World Economic Forum’s Gender Gap Report claims that “no country in the world has yet succeeded in eliminating the gender gap and discrimination.” The work market is divided based on gender and discrimination both vertically and horizontally; one illustration of this is the persistent wage difference. There have been claims that a “genderquake” is upending gender roles and rearranging them into a different, allegedly more equitable, pattern. According to some critics, gender inequality has become increasingly latent in Western industrialized economies, making it appear that individuals lack the motivation or competence to correct it (Kelan, 2009). The goal of Oros and Irina’s (2006) study was to provide an overview of gender imbalance in Romania’s political and economic life. This study is relevant to all forms of discrimination, particularly in light of Romania’s anticipated European Union membership in 2007. Some individuals have the preconceived notion that during communism, women were given special significance in the workforce and politics. But in actuality, males predominated in politics, the party, and state-run businesses. The proportion of women in elected bodies was capped, but these were mostly formalities because the representatives were chosen and the bodies themselves had no real authority (Pokharel, 2008).
Under communism, gender equality, as well as the promise of actual authority and control, was not realized. The gender development index, the gender empowerment measure, and the human development index are used to analyze the dynamic aspect of the gender inequality phenomena. One of the key aspirations for Eastern Europe’s transition to democracy and market economy is a greater opportunity for people to participate in and profit from a society that they helped construct (Gberevbie et al., 2014). Making decisions that influence people’s lives is more informed and more successful when they are made in a culture that values equality. The idea that women’s equality in a society that values its members depends on their representation in decision-making is becoming increasingly accepted worldwide (Maas & Torres-Gonzalez, 2011).
Mari Teigen (1999) examined the appointment cases the Gender Equality Ombud received over 10 years (1985–1994). The purpose of the study is to look at gender discrimination in hiring and the reasons why it is so hard to prove. Appointment study cases that are brought to the Ombud include those in which the plaintiff, the Ombud, and the three parties all provide arguments that expressly mention gender discrimination. How do hiring authorities respond to opposition is one of the two main questions: discrimination allegations? What reasons do people use to accept or reject arguments? an ombudsman? The three categories into which the cases under inquiry fall are those from organizations with a male preponderance, a female preponderance, and a gender balance (Kerdpitak & Jermsittiparsert, 2020). The hiring authority typically contends that the concern for personal appropriateness was the deciding factor; therefore, it is difficult to infer how the gender of the candidates affected the hiring process. The three primary forms of arguments for hiring preferences are “continuity,” “renewal,” and “the woman is unfit” in the study of the situations. In most situations, the Ombud’s decision-making process is ambiguous. The legal knowledge of the hiring authority appears to be important in many situations (Lopez et al., 2022). Which arguments should be regarded as unbiased and which should be rejected due to ambiguity or subjectivity are not delineated.
The recruiting process is now the area of the working relationship that is least understood, according to Petersen and Togstad (2006). When making recruiting decisions, the organization’s hiring agents are fully aware of their unconscious biases and gender schemas and are worried about them. They make use of information from the Norwegian Bank (DnB), which has roughly 7,400 employees and is one of the biggest Scandinavian banks. Given the preliminary fieldwork findings and the significance of the bank in the Scandinavian environment, it was decided to further explore the recruiting process outcomes in terms of job offers (Dilrukshi & Ranasinghe, 2021). While qualitative analyses of the hiring and selection procedures are ideally suited to them, the question of who receives offers and how this can differ by sex compels one to look more closely at the quantitative record. Multivariate analysis was utilized by the statistical tools. The outcome demonstrates that women are clearly at a disadvantage and that their impacts on hiring are seen to be irrefutable. We discovered that the contrary is true about real recruiting procedures: women are not at a disadvantage and can even be at an advantage when it comes to receiving offers (Babarinde et al., 2022). Two organizational procedures could favor women. The recruiting representatives had received training on the subject of unconscious prejudice, which may have lessened its consequences. They were also instructed to actively search the applicant pool for competent women, though. After finding no eligible girls during the first pass, they continue through the pool a second and third time to discover one (Setati et al., 2019).
A quantitative method for evaluating gender discrimination in public wages at the individual level is presented by Meier and Wilkins (2002). All Texas school superintendents who worked full-time between 1995 and 1998 are included in the database utilized for the study. With 4,103 total instances for analysis, Texas has more than 1,000 superintendents, or about 8% of all superintendents nationwide. The Texas Educational Agency contributed the statistics, which were all corrected for glaring mistakes. We provide a set of year-dummy variables to account for serial correlation as they are pooled time-series data. The findings indicate that, as opposed to being systematically different, gender disparities in superintendent pay are minor. Female superintendents who take the position of male superintendents are paid less (Tom, 2021). Salary differences are also influenced by the affluence of the local region and gender.
Using survey-based accounts of sexual harassment and sex discrimination, Heather et al. (2009) look for stylized facts about the nature of their relationship. We are particularly curious about whether these categories capture similar occurrences of gender prejudice and if they have an identical impact on employees’ job satisfaction and desire to leave their jobs. Data from the 2002 General Social Survey are used in this study. They only include employed people between the ages of 18 and 65 in the sample. This yields a final sample of 1,696 observations, of which 874 are female and 822 are male, and which has non-missing values for all of our important variables.
The findings do not strongly support the claim that sexual harassment and sex discrimination are two different behaviors that are captured by the same survey-based measures. Respondents do seem to distinguish between instances of sex discrimination and sexual harassment in the workplace. The effects, however, vary depending on gender.
Sexual harassment and sex discrimination are linked to greater levels of work unhappiness. However, it seems that males are more sensitive to sexual harassment than women are to sex discrimination when it comes to their anticipated employment shifts. Although exploratory, these findings raise the possibility that in the future sufficiently thorough surveys may serve as a helpful starting point for calculating the relationship between sexual harassment and sex discrimination (Taaka, 2022). They also contend that a multidisciplinary approach that incorporates the viewpoints of fields such as sociology, psychology, and economics offers the best chance for creating and testing a conceptual framework of gender prejudice.
Francois (1998) studied the effects of steps taken to lessen gender discrimination and explained why it continues in highly competitive employment markets. The great majority of “gender gap” research shows that women continue to earn less money than men do on average. A gap in earnings persists even after taking into account the number of hours worked, the industry in which the labor is performed, and worker traits connected to human capital, according to many who claim that this proves wage discrimination against women. Unlike earlier theories of gender discrimination, this one is based on interactions between men and women in the home rather than on the natural inequalities between men and women. Even though it is believed that discrimination is linked to elements of the labor market that are considered external, such as higher rates of job turnover and female workers leaving the workforce, policies that only focus on the labor market’s outcomes and ignore these elements can both reduce discrimination and affect these elements, further reducing discrimination. However, unless they are supplemented with more direct measures, policies that address external causes will often be less effective in decreasing prejudice.
Even though it is believed that discrimination is linked to elements of the labor market that are considered external, such as higher rates of job turnover and female workers leaving the workforce, policies that only focus on the labor market’s outcomes and ignore these elements can both reduce discrimination and affect these elements, further reducing discrimination. However, unless they are supplemented with more direct measures, policies that address external causes will often be less effective in decreasing prejudice.
Accordingly, this study looked at the interactions of race, ethnic identity, and starting wages on the perceptions of salaries among 342 undergraduates, as reported by Derek R. Avery (2001). White, Asian American, and Hispanic participants showed favorable pay impacts, whereas Black respondents did not show any discrimination between incomes.
But when ethnicity, race, and pay were combined, a more nuanced pattern of answers for Black individuals emerged: Hispanic, White, and Asian Americans answered similarly to those with higher ethnic markers. These findings’ implications for how racial pay inequality will continue are examined. This article details the violations made against workplace discrimination against women based on early data from 2000 to 2004.
It demonstrates how gender discrimination affects productivity in every organization. Allison Bentley is focusing on the requirements of working women while reintegrating kid ex-combines into Serra One.
Research Objectives
To examine the impact of gender discrimination on the performance and job satisfaction of female commercial drivers.
To compare and contrast qualitative thematic analysis findings with quantitative survey results to identify areas of convergence, divergence, or complementarity between qualitative and quantitative data.
To integrate qualitative insights from thematic analysis with quantitative evidence to develop a comprehensive understanding of gender discrimination dynamics and their multifaceted impact on employee performance in the transportation sector.
Regression

where Y is employee performance, βo is a constant, X1 is discrimination for promotion, X2 is discrimination for salary increment, X3 is discrimination for benefits, E is SD, β1, β2, β3,…, β11 are coefficients.
Following a survey of the literature, this research proposes many theories and questions.
What is gender discrimination, and how many different forms does it take?
What impact does gender discrimination have on employees’ performance?
The hypotheses are as follows:
H01: Employee performance is not correlated with gender discrimination. H0(a): Discrimination for promotion is not associated with employee performance. H0(b): Discrimination for salary increment is not associated with employee performance. H0(c): Discrimination for benefits is not associated with employee performance. H02: There is no significant association between the demographic variables (age, education, and experience), level of female commercial drivers, and their perceptions and experiences of discrimination and promotion opportunities. H03: Demographic variables (age, education, experience) will not strengthen the positive effect on gender discrimination and employee performance.
Methodology
This section explains the statistical techniques used to estimate the impact of gender discrimination on employee performance as well as the research variables, sample, data distribution pattern, and sample size. The objective of this research is to contribute to our understanding of important components of gender discrimination that affect performance.
In terms of methodology, our study followed a cross-sectional design, wherein data were collected from 243 front-line female commercial drivers employed in Coimbatore’s road transportation sector. The sample size was determined based on considerations of statistical power and representativeness within the context of the study objectives. Data collection was conducted through face-to-face interviews and self-administered surveys, depending on the preferences and availability of the respondents. Before data collection, ethical considerations were carefully addressed, and informed consent was obtained from all participants.
The questionnaire administered to the respondents was carefully designed to capture relevant data on gender discrimination in the transportation sector and its impact on employee performance. The questions were structured to elicit information on various aspects of gender discrimination, including hiring practices, promotion opportunities, salary increments, and access to benefits and amenities.
Specifically, the questionnaire included both closed-ended and open-ended questions to gather quantitative and qualitative insights from the respondents. Closed-ended questions facilitated the collection of structured data, enabling a statistical analysis using techniques such as correlation, regression and mixed-method analysis. Comparative analysis was performed using cross-tabulation and chi-square, and moderation analysis was conducted using AMOS.
Study Area
In this section, the study examines the relationship between worker performance and gender discrimination in the road transportation sector in Coimbatore. Coimbatore was selected as the study location for several reasons. First, Coimbatore is renowned as a major industrial and commercial hub in the state of Tamil Nadu, India. The city’s transportation industry, with its diverse range of stakeholders and operational dynamics, provided a rich and representative context to explore the intersection of gender discrimination and employee performance within the transport sector. Additionally, Coimbatore’s geographical location and accessibility facilitated data collection and engagement with relevant stakeholders, including female commercial drivers, transport companies, and industry experts.
Furthermore, Coimbatore’s demographic composition, coupled with its status as a prominent urban center, offered insights into the unique challenges and opportunities faced by women working in male-dominated industries such as transportation. By focusing on Coimbatore, we aimed to generate findings that could inform policy interventions and organizational practices not only within the city but also in similar contexts across India and beyond.
Data Set
The basic data used in this investigation were collected using a questionnaire. The responder of a private transport sector organization provided the information for the study.
Variable
The study’s goal is to examine gender discrimination in Coimbatore and how it affects output. The past study and analysis on performance and gender discrimination had an impact on the choice of variables. All the following variables, including dependent and independent variables, have been utilized to test the study’s hypothesis (Figure 1).
Diagram of Gender Discrimination and Employee Performance.
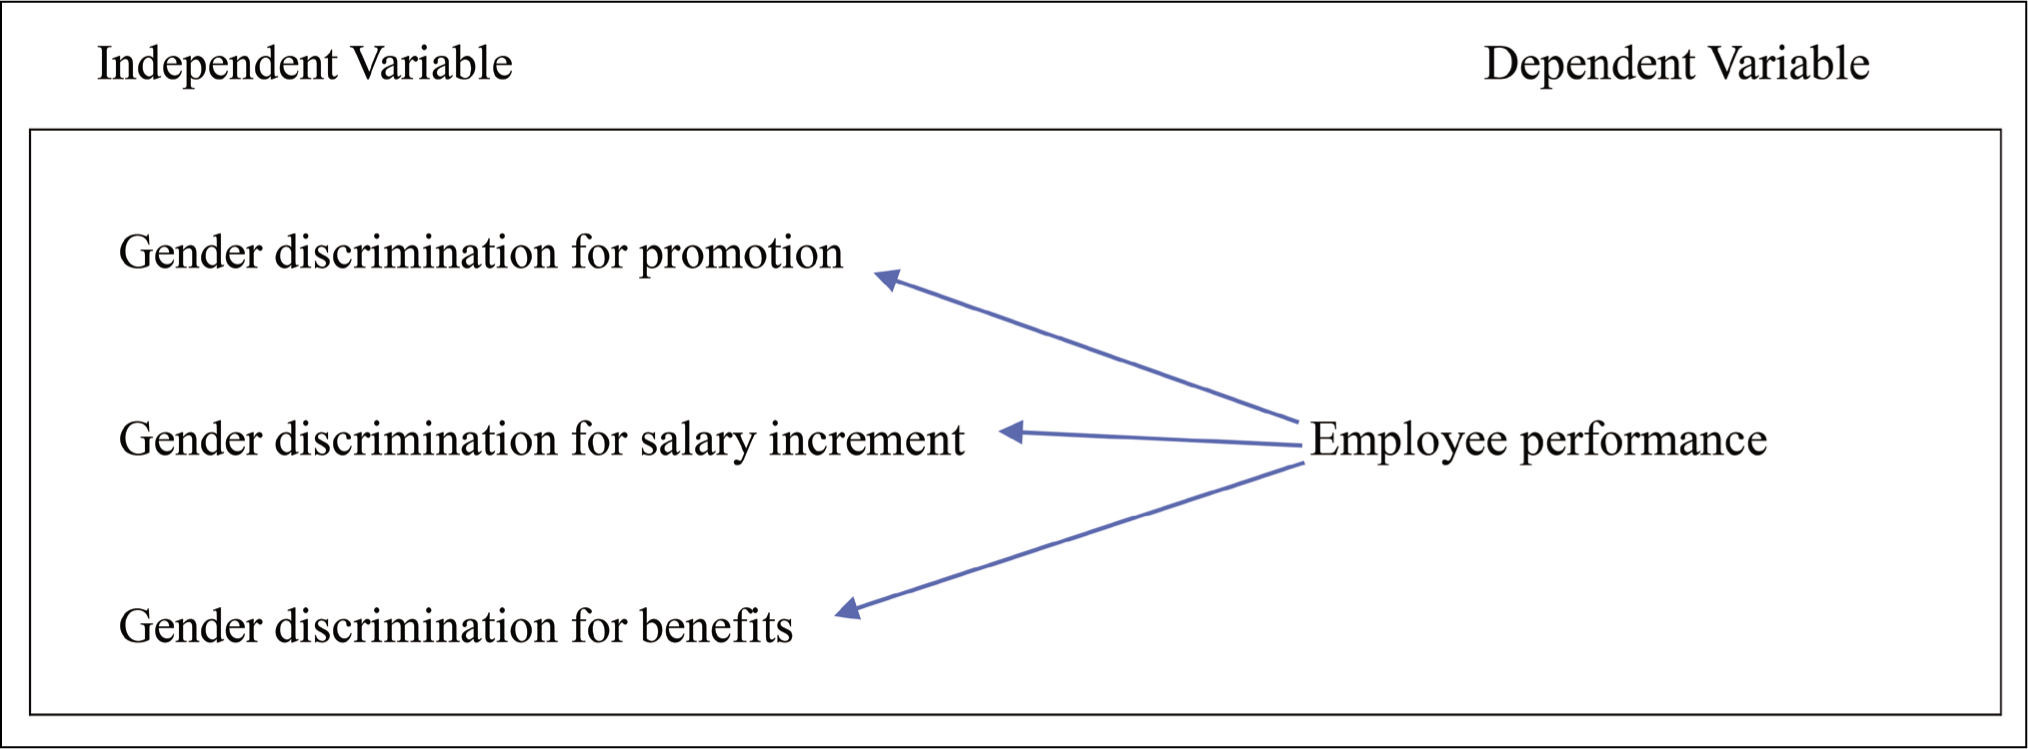
Independent Variable
Gender discrimination is the study’s independent variable, which can have either a positive or negative impact on the dependent variable. The world’s most pressing social issue is gender inequality.
Dependent Variable
The dependent variable, which is a variable that is affected by the independent variable, is the focus of the researcher’s attention. Employee performance is the primary dependent variable, and the variation in the independent variable can explain the variance in the dependent variable.
Limitation
Cost, timing, and research culture are the main drawbacks of this study. Due to a lack of funding, this research cannot be carried out on a larger scale. Time is yet another restriction. Employees are unwilling to engage in surveys and provide personal information since there is no research culture in Indian organizations, particularly in the transportation industry.
Results
Reporting Demographic Profile
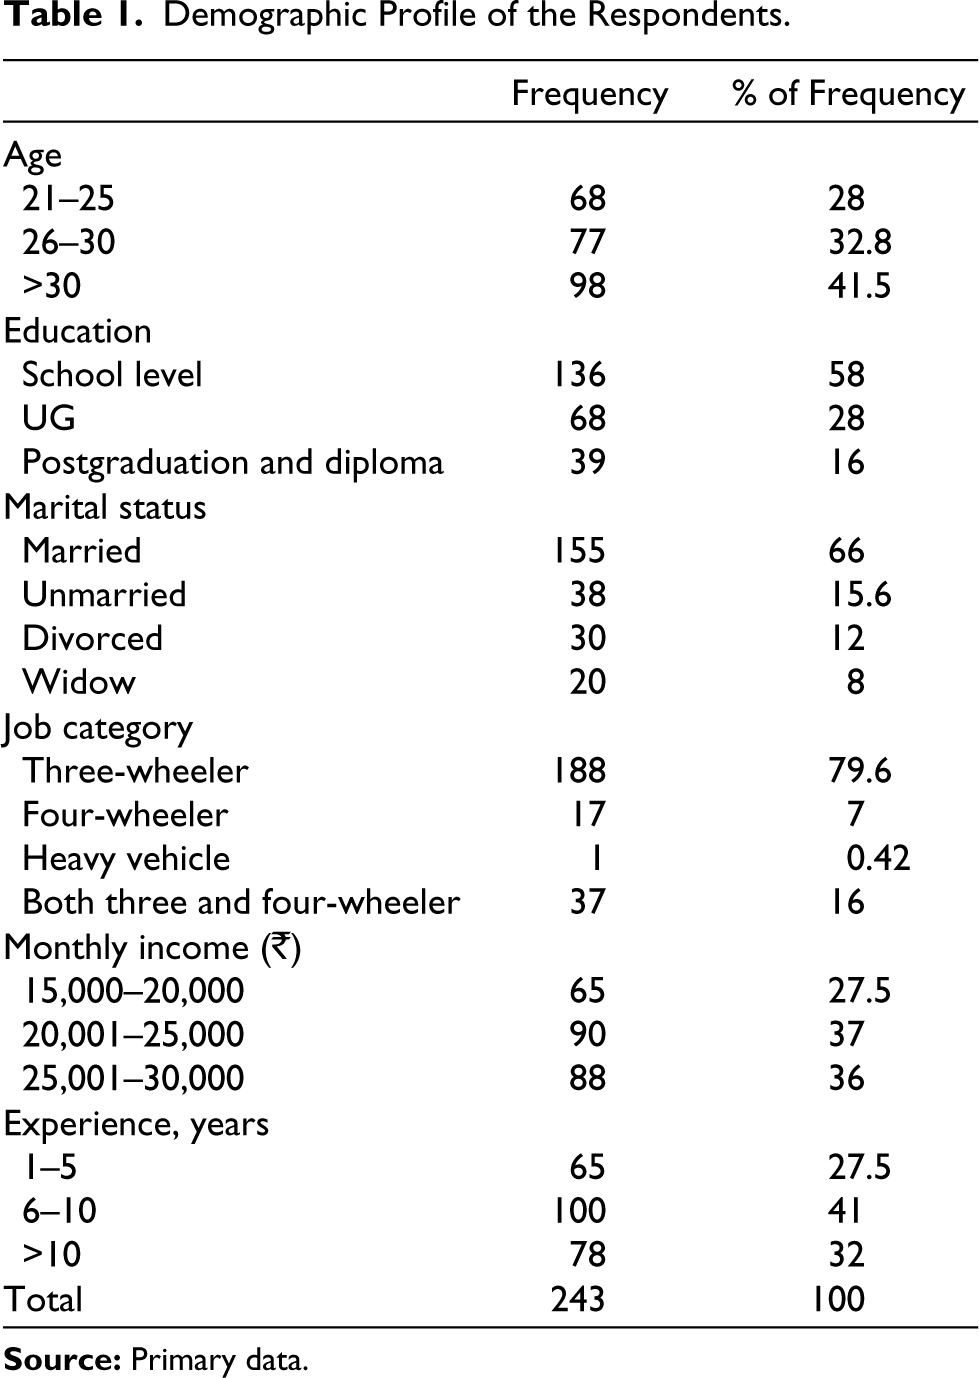
Demographics shows the profile of our respondents. This nominal data type provides us with a frequency table. The demographic profile of the respondents is presented in Table 1. It shows that 98 respondents were above 30 years of age (41.5%), 58% were from the school level, 66% were married, and the majority are three-wheeler drivers. Most of the respondents earn a monthly income between ₹20,001 and ₹25,000. Further, the majority of respondents have 6–10 years of experience.
Demographic Profile of the Respondents.
Reporting Correlation and Regression
Table 2 shows the Pearson correlation and regression analysis using SPSS was the statistical method used to analyze the data. To indicate how the respondents responded to the question, a descriptive analysis was performed. The correlation coefficient offers a way to gauge the degree of strength. The goal of this study is to prove a causal link between gender discrimination and performance, which was estimated using regression analysis.
Correlation.
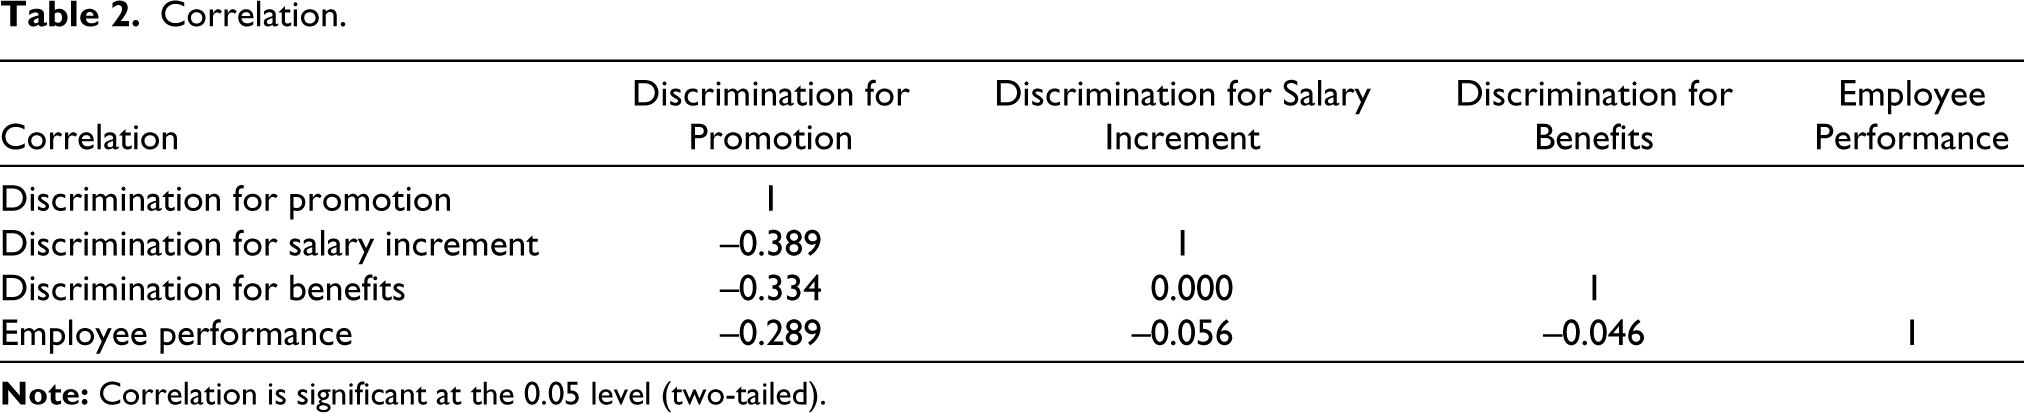
Pearson correlation using SPSS is one of the statistical methods used to analyze the data. A sensible and well-known method of determining the linear link between variables is Pearson correlation. The Pearson coefficient expresses the strength of the relationship between the variables under study. The correlation coefficient offers a way to gauge the degree of strength. The dependent variable and all other independent variables have a linear connection. At a 95% confidence level, the link and association have been explained. At the 0.05 level of confidence or 95% of the time, there is a significant association between the variables. At a 95% confidence level, gender discrimination has an impact on employee performance, which helps to explain the high correlation between the two.
To explain the variance and causal connection between the independent and dependent variables, regression analysis is performed. Table 3 provides the regression coefficients for the independent variables. At the 0.05 threshold of significance, there is discrimination in benefits, salary increases, and promotions. These denote regression line’s slope and Y-intercept. Table 3 contains one constant, which is 1.985, as well as the regression coefficients for the slope and Y-intercept, −0.521, −0.327, and −0.123, respectively.
Coefficient.
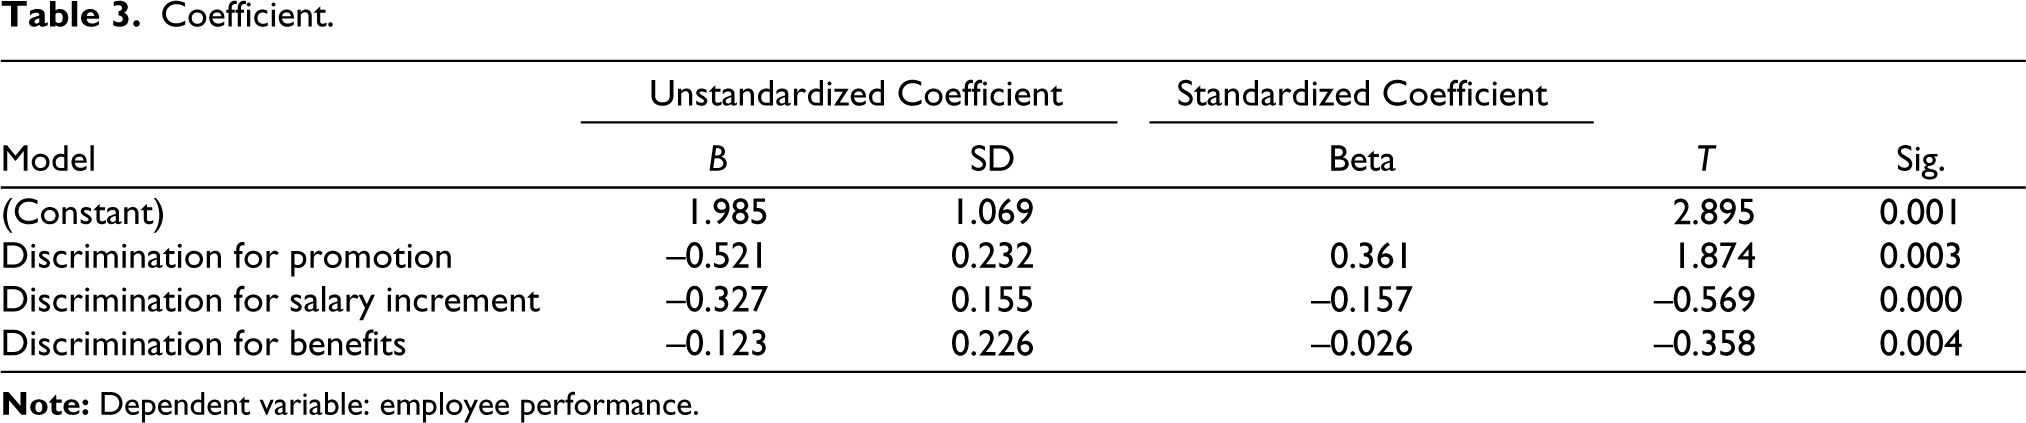
The regression analysis showed that gender discrimination had a significant, negative effect on workers’ productivity. To identify the main variable influencing the dependent variable, employee performance, regression analysis was used in this study. Table 4 represents the employee performance as the dependent variable in the model’s regression analysis. R-squared (R2) is equal to 82.3%, while adjusted R2 is about 81.7%. This shows that just 36.4% of the variance, or independent factors, is responsible for the fluctuation in the dependent variable, or employee performance. Stronger correlations are indicated by larger R values.
Model.
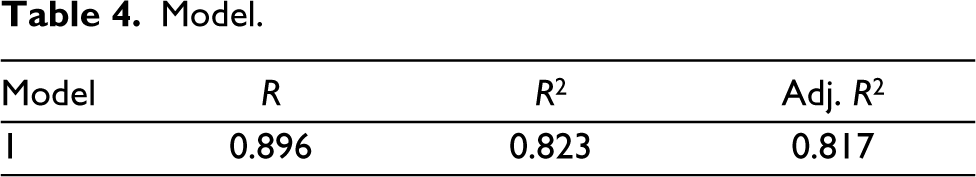
Table 5 lists the findings of a variance analysis. The total model’s statistical significance is indicated by its F value, and independent variables are shown to be capable of predicting changes in the dependent variable.
ANOVA.
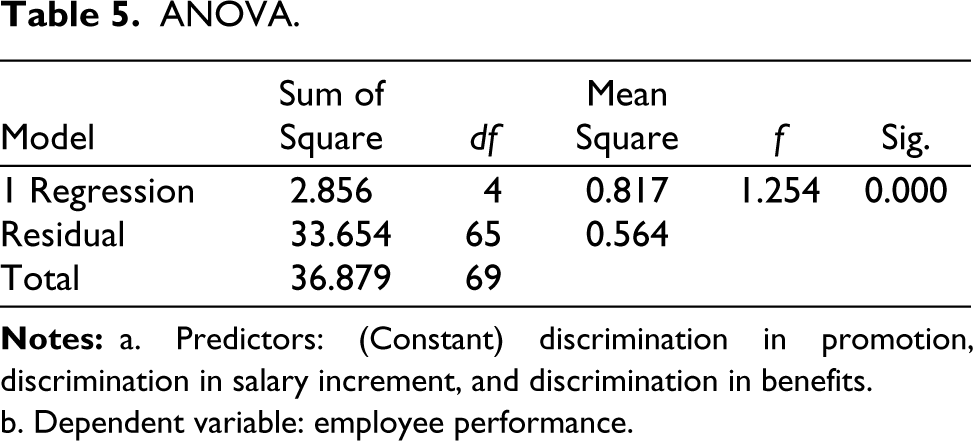
b. Dependent variable: employee performance.
Interpretation
Cross-tabulation and chi-square was used to conduct a comparative analysis among age, education, and experience of female commercial drivers regarding perceptions and experiences of discrimination and promotion opportunities:
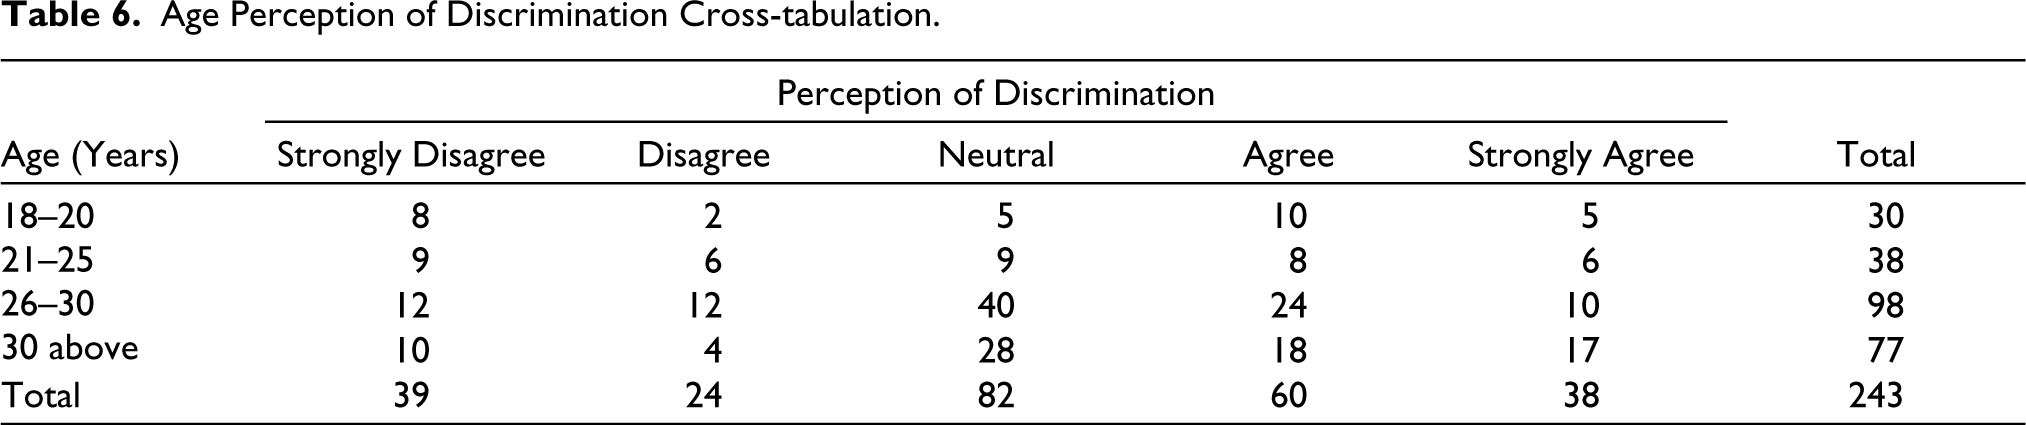
Age vs. perception of discrimination: There is a variation in perceptions of discrimination across different age groups among female commercial drivers shown in Table 6. The highest count of respondents who strongly agree with experiencing discrimination is in the age group “30 above,” followed by “26–30” and “21–25” age groups. The “18–20” age group has the lowest count of respondents who strongly agree with experiencing discrimination.
Age Perception of Discrimination Cross-tabulation.
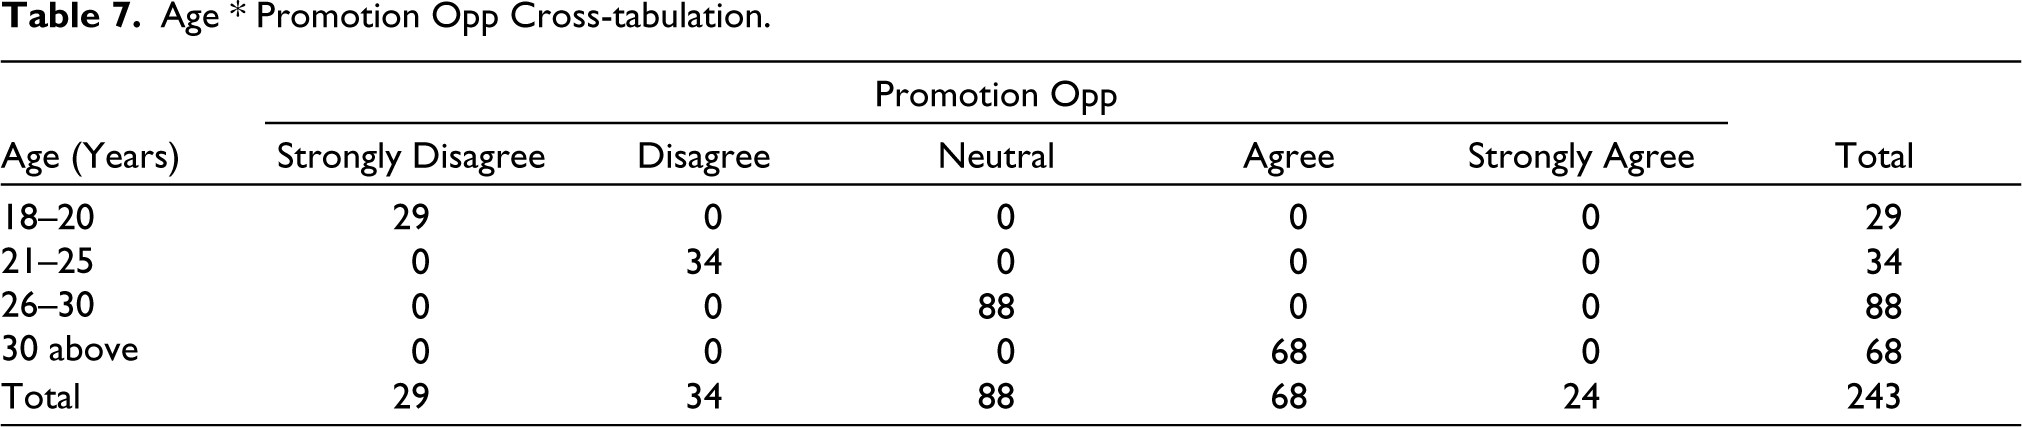
Age vs. promotion opportunities: Promotion opportunities also vary across different age groups among female commercial drivers. The highest count of respondents who strongly disagree with promotion opportunities is in the “18–20” age group, where no respondents strongly agree with this category. The “30 above” age group has the highest count of respondents who strongly agree with promotion opportunities shown in Table 7.
Age * Promotion Opp Cross-tabulation.
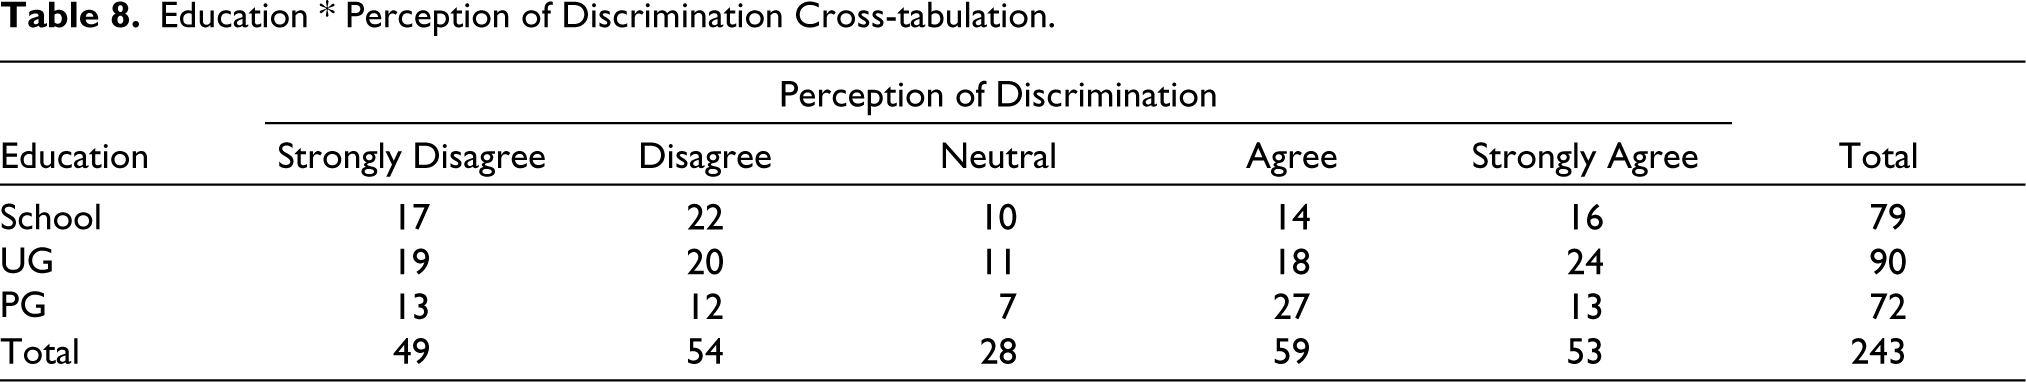
Education vs. perception of discrimination: There is a noticeable difference in perceptions of discrimination across different education levels. Respondents with the undergraduate (UG) education level have the highest count of respondents who strongly agree with experiencing discrimination shown in Table 8.
Education * Perception of Discrimination Cross-tabulation.
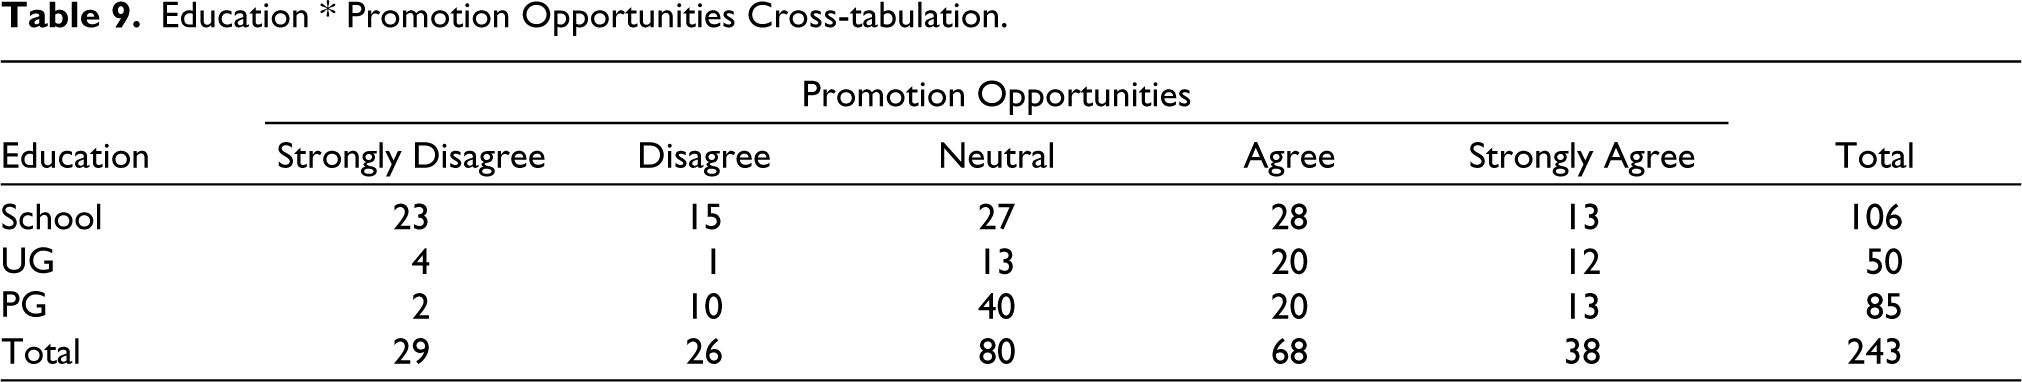
Education vs. promotion opportunities: Table 9 shows that promotion opportunities also vary across different education levels among female commercial drivers. Respondents with postgraduate (PG) education levels have the highest count of respondents who strongly agree with promotion opportunities.
Education * Promotion Opportunities Cross-tabulation.
Experience vs. perception of discrimination: There is a variation in perceptions of discrimination across different levels of experience shown in Table 10. Respondents with 5–10 years of experience have the highest count of respondents who strongly agree with experiencing discrimination.
Experience * Perception of Discrimination Cross-tabulation.

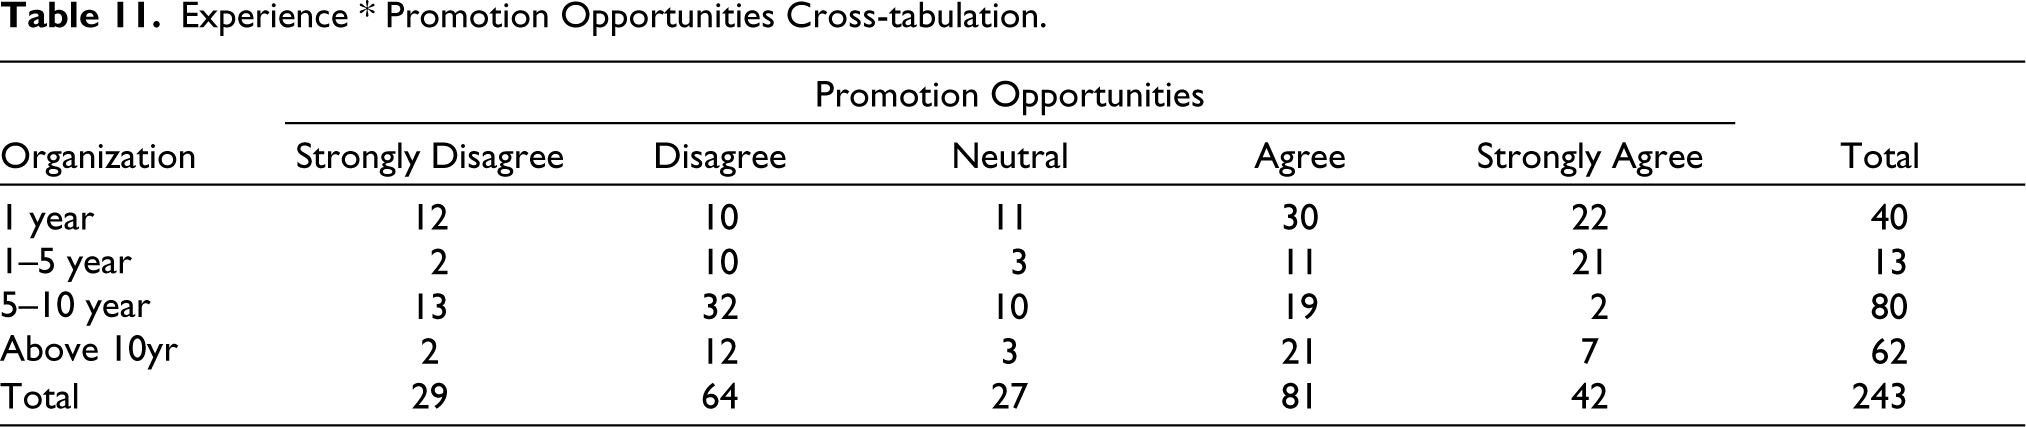
Experience vs. promotion opportunities: Promotion opportunities also vary across different levels of experience among female commercial drivers shown in Table 11. Respondents with 1–5 years of experience have the highest count of respondents who strongly disagree with promotion opportunities.
Experience * Promotion Opportunities Cross-tabulation.
Cross-tabulations provide insights into how demographic factors such as age, education, and experience influence perceptions of discrimination and promotion opportunities among female commercial drivers.
Chi-square Interpretation
Age vs. perception of discrimination: Pearson chi-square: χ²(16) = 19.972, p = .222 (not significant), likelihood ratio: χ²(16) = 18.308, p = .306 (not significant), linear-by-linear association: χ²(1) = 8.660, p = .003 (significant). While the Pearson and likelihood ratio tests do not show a significant association, the linear-by-linear association test indicates a significant linear trend between age groups and perceptions of discrimination.
Age vs. promotion opportunities: Pearson chi-square: χ²(16) = 864.000, p < .001 (significant), likelihood ratio: χ²(16) = 615.601, p < .001 (significant), linear-by-linear association: χ²(1) = 215.000, p < .001 (significant). All tests demonstrate a significant association between age groups and perceptions of promotion opportunities, indicating varied perceptions across different age groups.
Education vs. perception of discrimination: Pearson chi-square: χ²(16) = 61.029, p < .001 (significant), likelihood ratio: χ²(16) = 60.153, p < .001 (significant), linear-by-linear association: χ²(1) = 40.407, p < .001 (significant). Significant associations are observed between education levels and perceptions of discrimination, suggesting varying perceptions across different education levels.
Education vs. promotion opportunities: Pearson chi-square: χ²(16) = 52.633, p < .001 (significant), likelihood ratio: χ²(16) = 47.526, p < .001 (significant), linear-by-linear association: χ²(1) = 24.425, p < .001 (significant). Significant associations exist between education levels and perceptions of promotion opportunities, indicating differing perceptions based on education.
Experience vs. perception of discrimination: Pearson chi-square: χ²(16) = 253.271, p < .001 (significant), likelihood ratio: χ²(16) = 184.414, p < .001 (significant), linear-by-linear association: χ²(1) = 88.294, p < .001 (significant). Significant associations are found between levels of experience and perceptions of discrimination, suggesting variations based on experience.
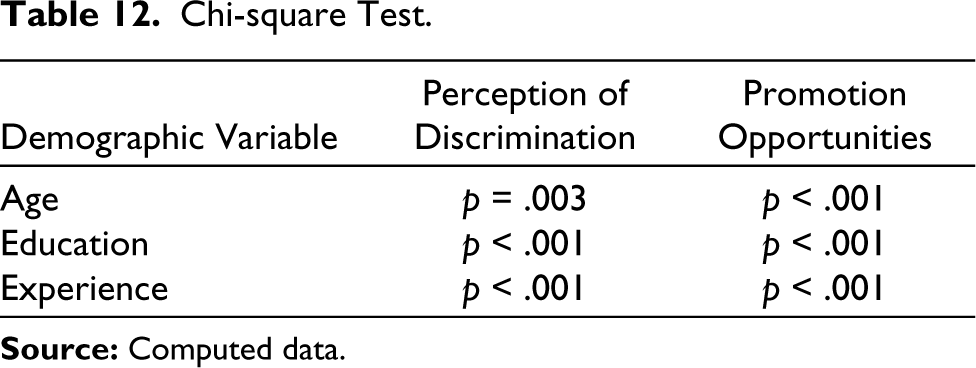
Experience vs. promotion opportunities: Pearson chi-square: χ²(16) = 40.394, p = .001 (significant), likelihood ratio: χ²(16) = 39.168, p = .001 (significant), linear-by-linear association: χ²(1) = 19.585, p < .001 (significant). Significant associations are observed between levels of experience and perceptions of promotion opportunities, indicating differences in perceptions based on experience. These interpretations are summarized and detailed in Table 12.
Chi-square Test.
Reporting Moderation Analysis
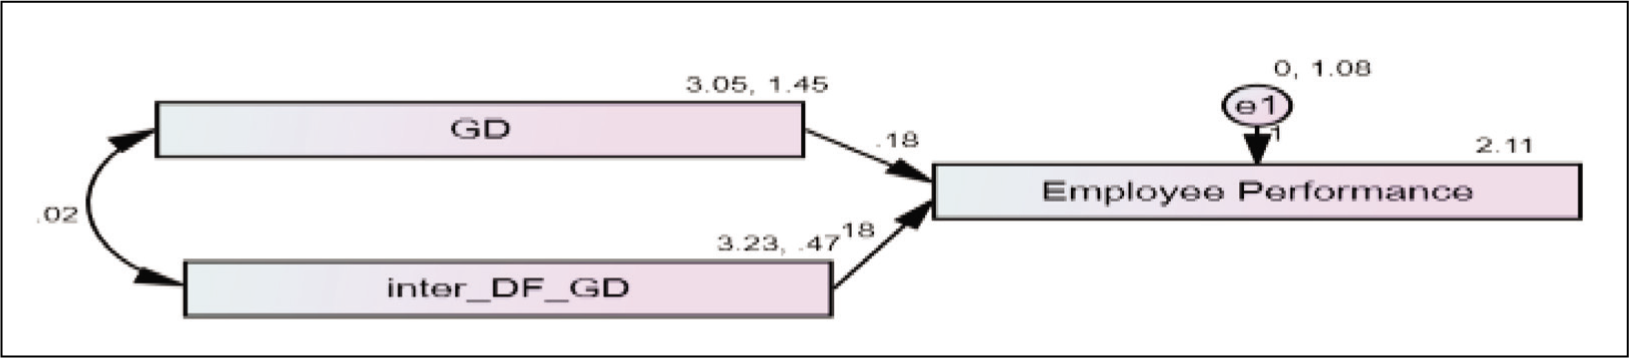
Age: The significance of associations between age and perceptions of discrimination and promotion opportunities suggests that age influences how female commercial drivers experience workplace discrimination. Older drivers may have developed coping strategies over time, potentially mitigating the negative impact of discrimination on performance. Conversely, younger drivers may be more vulnerable to discrimination due to their limited experience and authority, which could adversely affect their performance. This moderation analysis, as shown in Figure 2, illustrates the differential impact of age on perceptions and outcomes.
Education: Significant associations between education levels and perceptions of discrimination and promotion opportunities indicate that education influences how female drivers perceive their work environment. Higher education levels may empower drivers to recognize and challenge discrimination, leading to better performance outcomes. Conversely, lower education levels may restrict drivers’ awareness of their rights and ability to advocate for themselves, exacerbating the negative effects of discrimination on performance. This moderation analysis, as shown in Figure 2, highlights the role of education in shaping these perceptions and their impact on performance.
Experience: Significant associations between experience levels and perceptions of discrimination and promotion opportunities suggest that experience shapes how female drivers navigate their workplace. More experienced drivers may have developed coping strategies and advocacy skills, positively impacting their performance. Conversely, less experienced drivers may be more susceptible to discrimination due to their unfamiliarity with workplace dynamics, potentially hindering their performance. This moderation analysis, as shown in Figure 2, demonstrates how experience influences the relationship between perceptions of discrimination and promotion opportunities and performance outcomes.
Moderation Analysis Workflow.
Findings and Results
These findings underscore the importance of considering demographic factors when addressing issues related to discrimination and promotion opportunities in the commercial driving sector. They provide valuable insights into how age, education, and experience influence perceptions and experiences among female drivers, which can inform targeted interventions and policies aimed at improving workplace equity and satisfaction within the industry.
The findings revealed that older drivers tend to have developed coping mechanisms, while younger drivers may be more vulnerable to discrimination. Higher education levels empower drivers to challenge discrimination, whereas lower education levels may limit advocacy skills. More experienced drivers often possess coping strategies, while less experienced drivers may struggle to navigate workplace dynamics. These insights underscore the importance of considering demographic factors in addressing discrimination and promoting equity in the commercial driving sector.
Conclusion and Implication
The study examined the impact of gender discrimination on the performance and job satisfaction of female commercial drivers in the transportation sector of Coimbatore. It also aimed to compare and integrate qualitative thematic analysis findings with quantitative survey results to gain a comprehensive understanding of gender discrimination dynamics. The research findings highlight a significant correlation between gender discrimination and employee performance, with discrimination for promotion, salary increments, and benefits negatively affecting productivity. Regression analysis further confirmed the detrimental impact of gender discrimination on worker productivity, underscoring the need for proactive measures to address discrimination in the workplace.
The study successfully compared and contrasted qualitative thematic analysis findings with quantitative survey results, revealing areas of convergence, divergence, and complementarity. By integrating qualitative insights with quantitative evidence, the research developed a comprehensive understanding of gender discrimination dynamics and their multifaceted impact on employee performance in the transportation sector.
Demographic factors such as age, education, and experience significantly influenced perceptions of discrimination and promotion opportunities among female commercial drivers. Insights from cross-tabulations and chi-square analyses underscored the importance of considering these demographic factors in addressing workplace equity and satisfaction within the industry. The study sheds light on the nuanced interplay between demographic factors and perceptions of discrimination among female commercial drivers. Age, education, and experience emerge as significant influencers, shaping how drivers experience and respond to discrimination in the workplace.
Implications and Recommendations
Policy Interventions
The findings emphasize the need for targeted interventions and policies aimed at addressing gender discrimination in the transportation sector. This includes implementing awareness training, mentorship programs, and diversity initiatives to foster inclusivity and equal opportunities for female drivers.
Organizational Practices
Transport companies should review their hiring, promotion, and salary increment practices to ensure fairness and transparency. Creating supportive work environments that value diversity and prioritize employee well-being can enhance job satisfaction and performance.
Research Culture Enhancement
Efforts should be made to foster a research culture within Indian organizations, particularly in industries like transportation. This can be achieved through capacity-building initiatives, knowledge-sharing platforms, and collaborative research partnerships.
Overall, the study provides valuable insights into the complex relationship between gender discrimination, employee performance, and demographic factors in the transportation sector. By addressing these issues through targeted interventions and informed policy decisions, organizations can create more equitable and inclusive workplaces that benefit both employees and the industry as a whole.
Footnotes
Acknowledgements
The authors express gratitude to all respondents who contributed to filling out the research questionnaire and appreciate their support and interest in the research.
Declaration of Conflicting Interests
No potential conflict of interest was reported by the authors.
Funding
The authors received no financial support for the research, authorship, and/or publication of this article.